
Two-Roller Continuous Calibration Process by Compression for Submarine Pipelines


Abstract
:1. Introduction
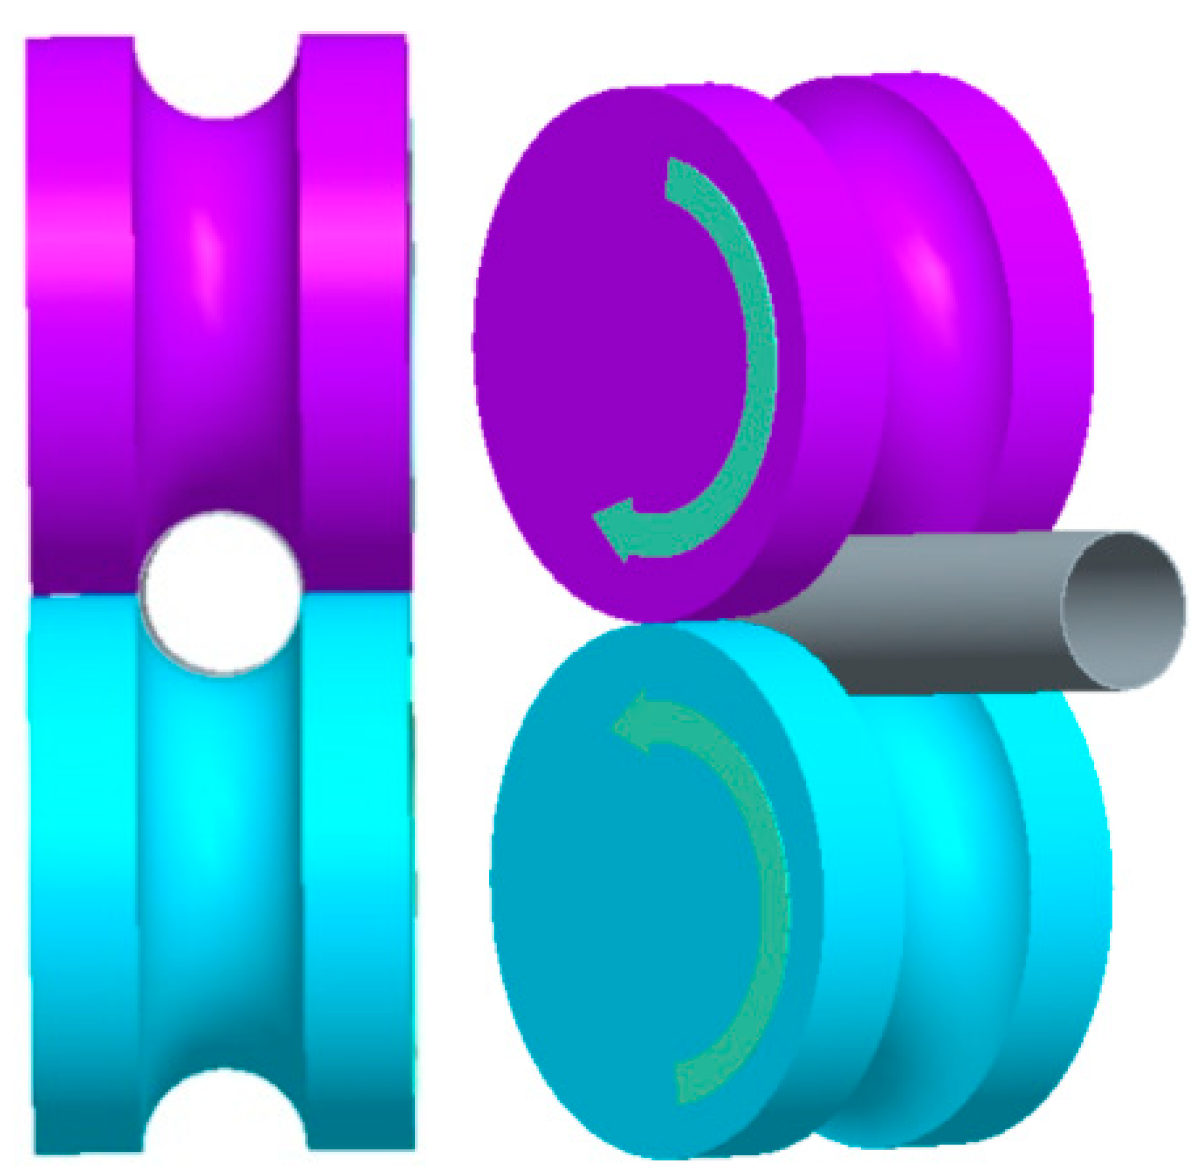
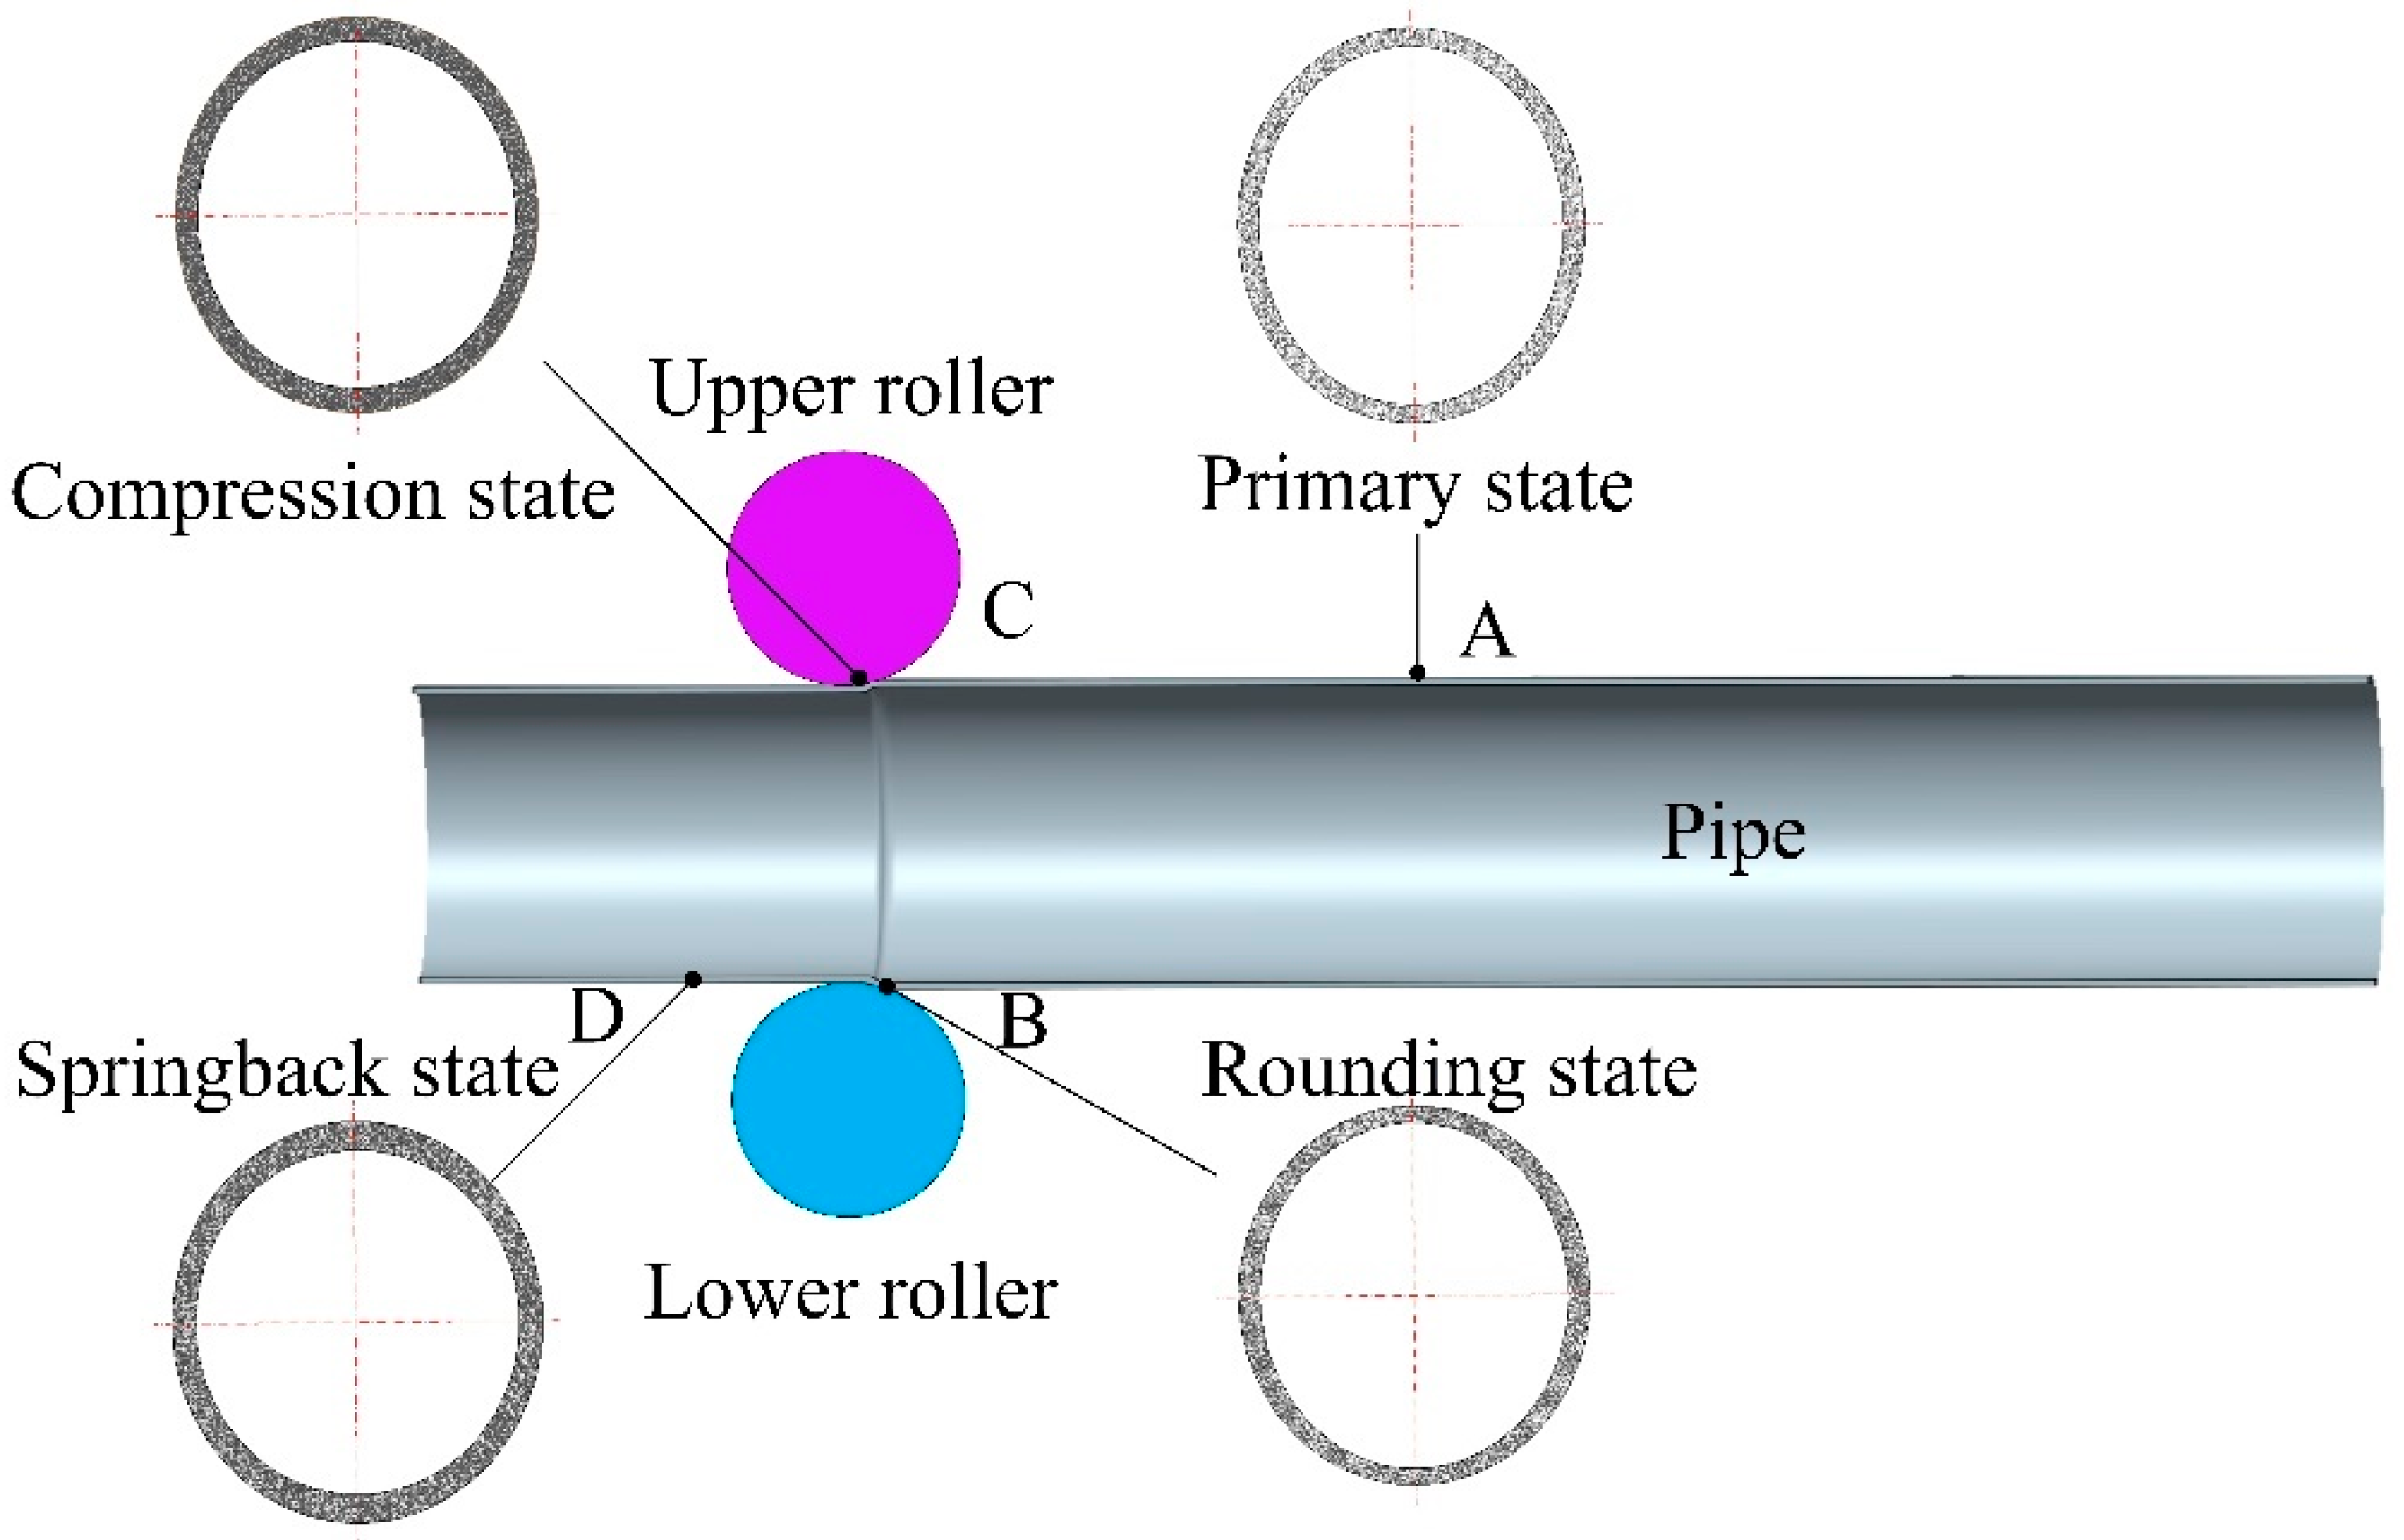
2. TRCC Process
3. Mechanical Analyses
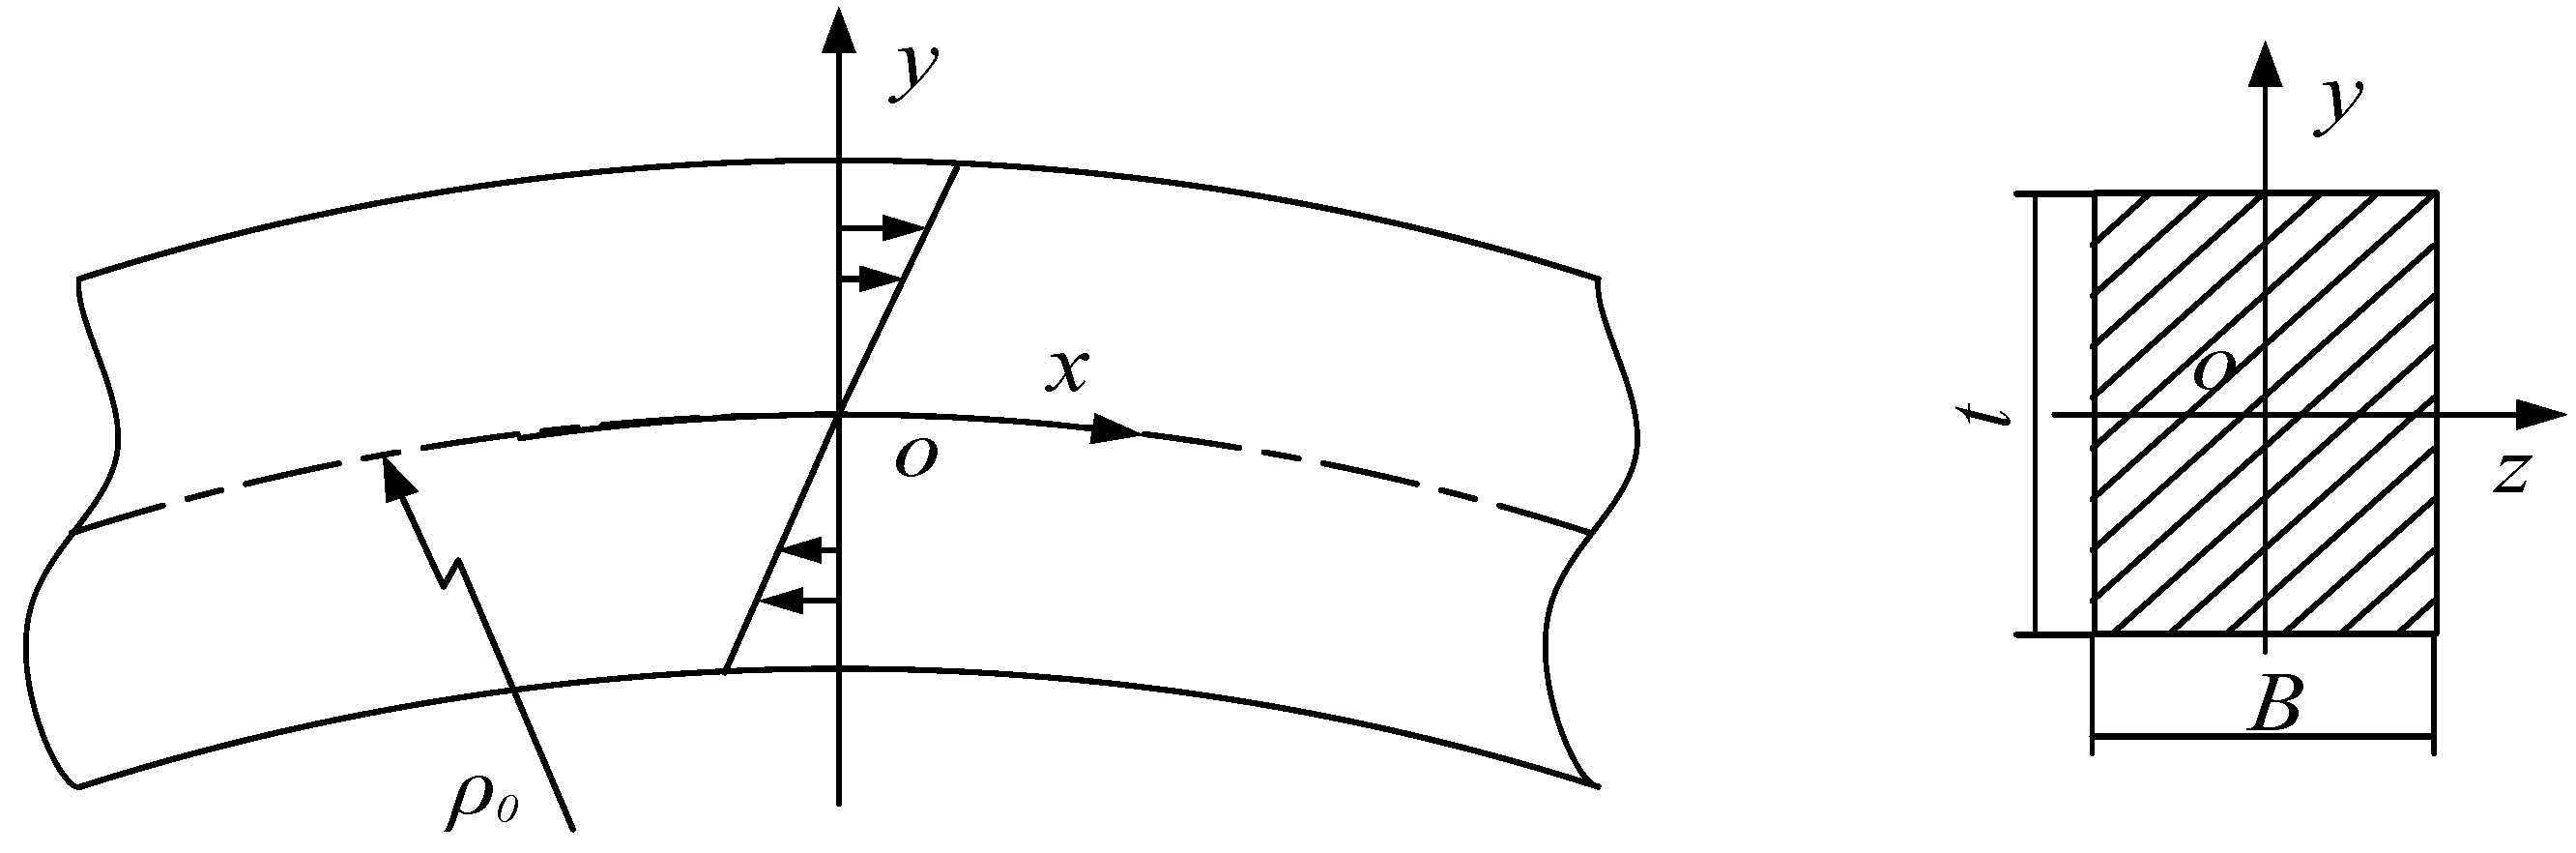
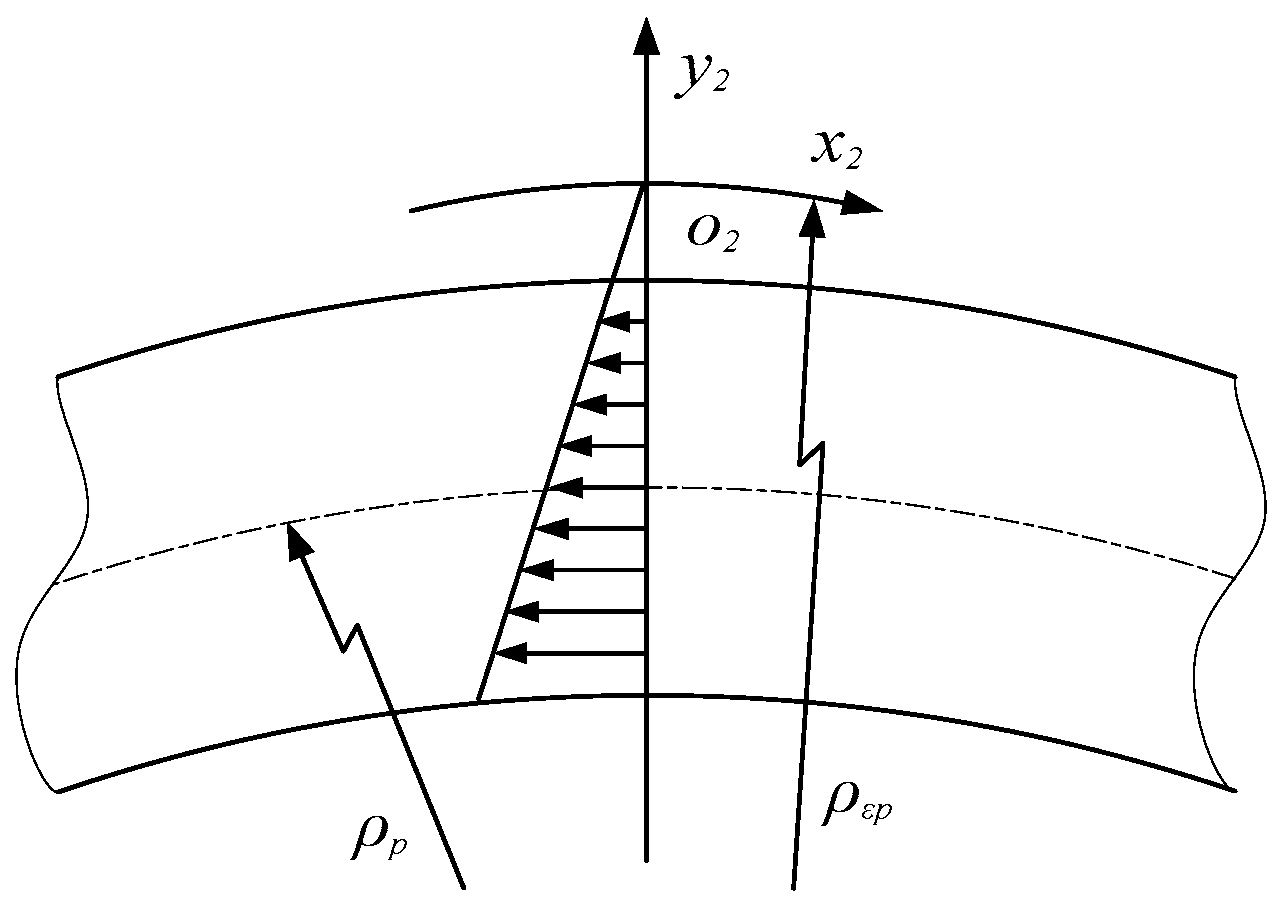
3.1. Compress Bending Springback Analysis
3.1.1. Loading Strain
3.1.2. Strain after Unloading
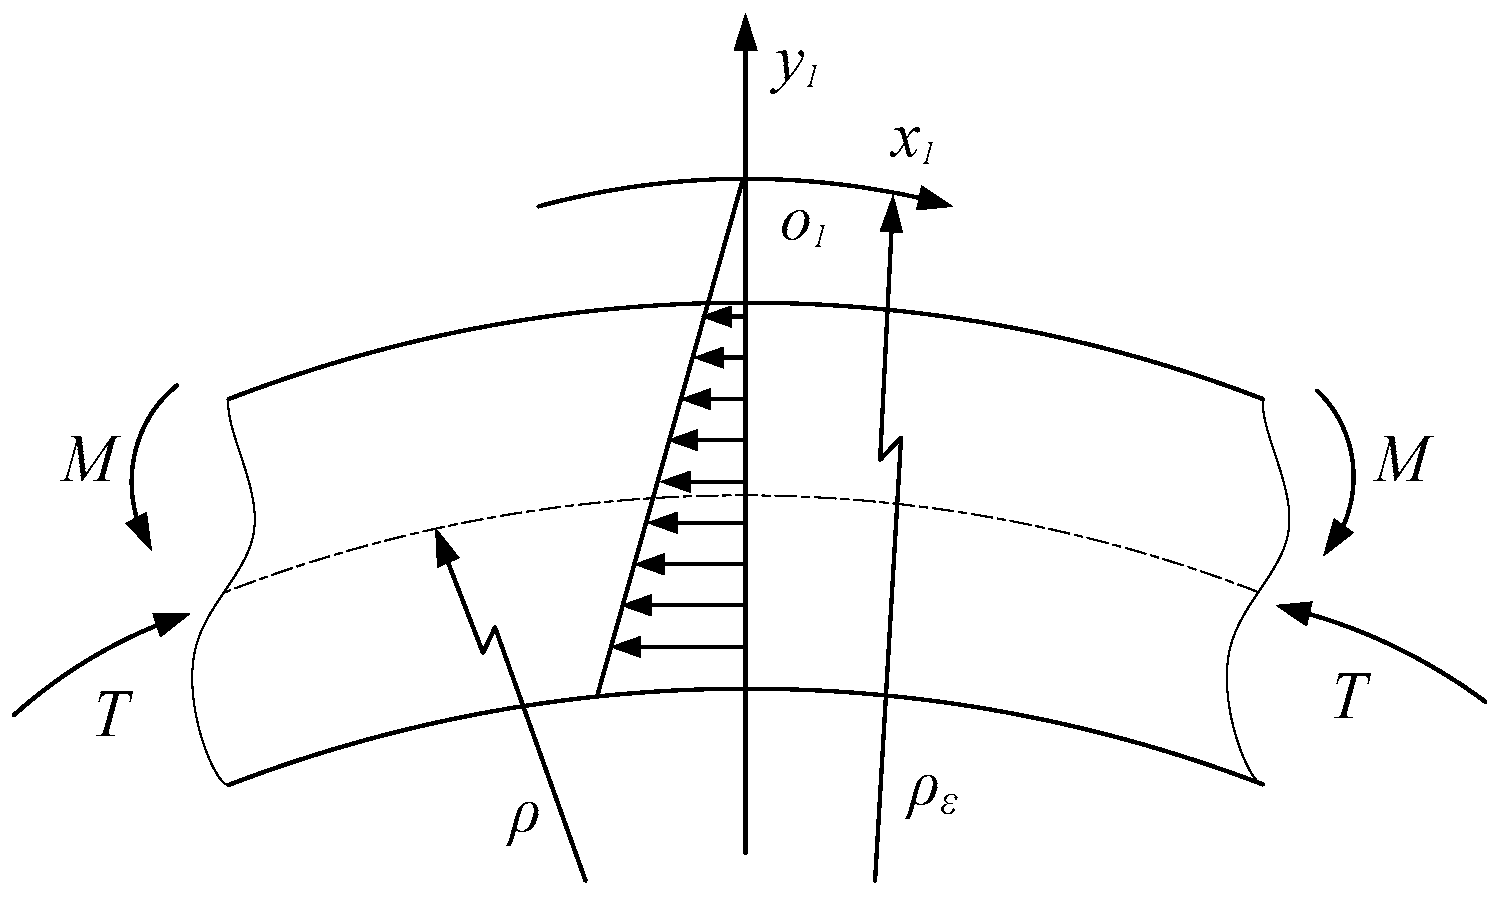
3.1.3. Elastic Strain under Reverse Loading
3.1.4. Springback Equation
3.2. Ovality after Two-Roller Calibration Process
4. Finite Element Model
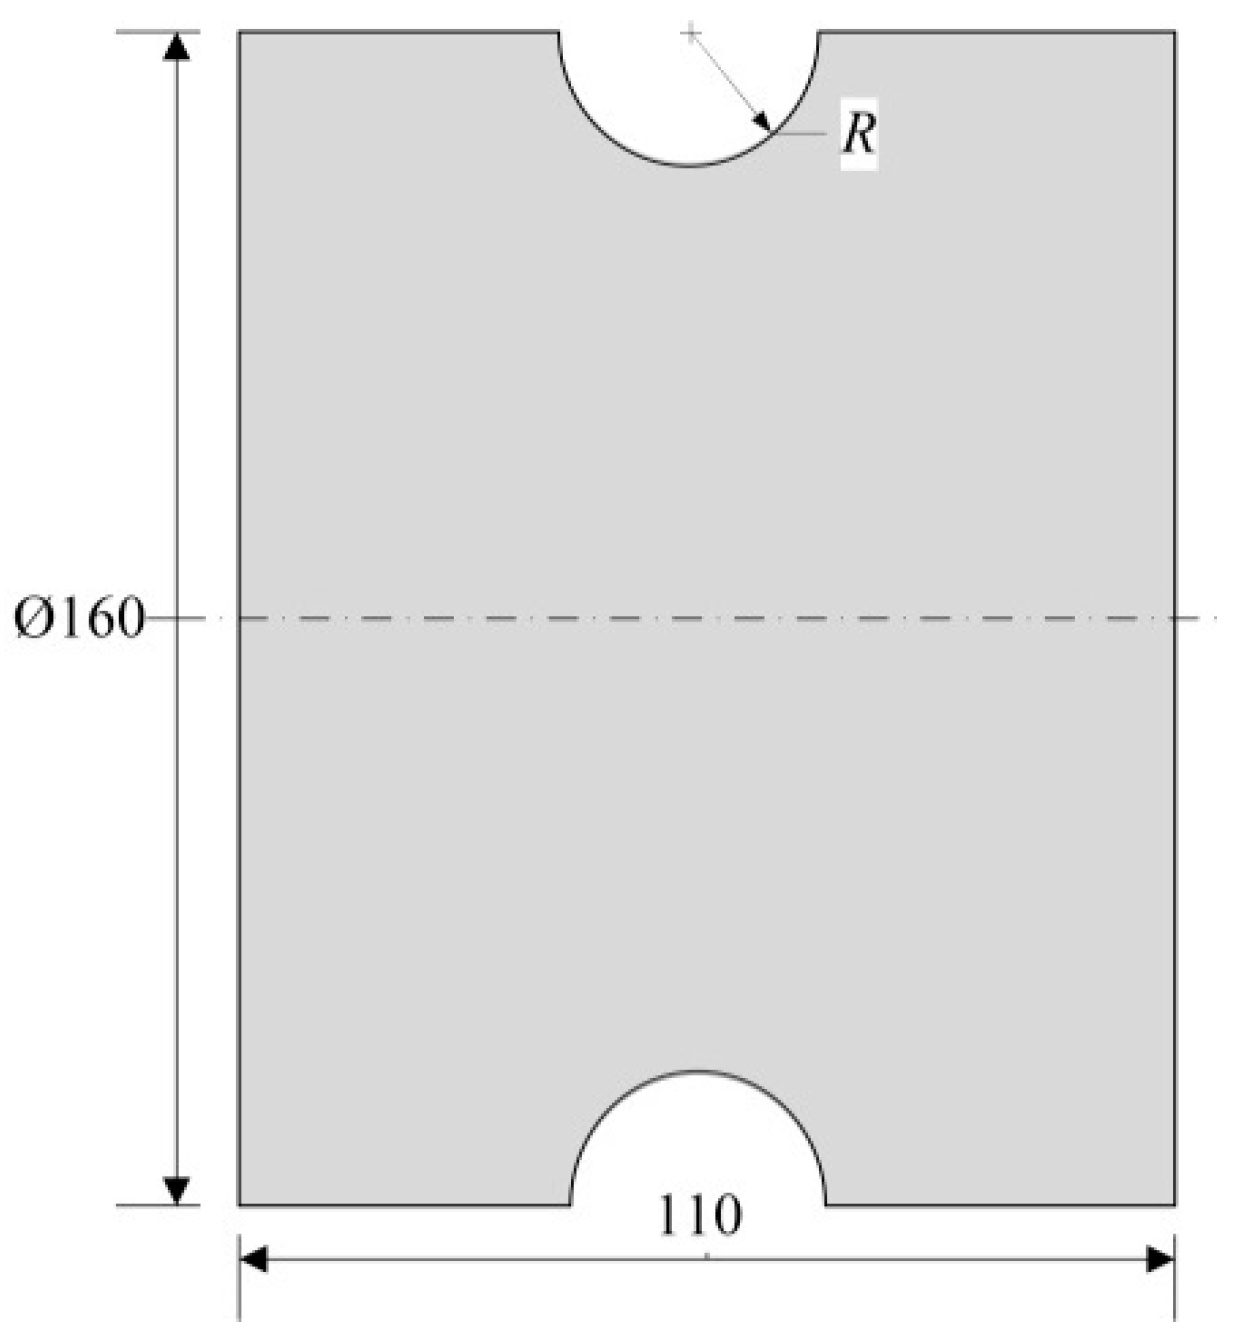
5. Experimental Device
6. Results and Discussion
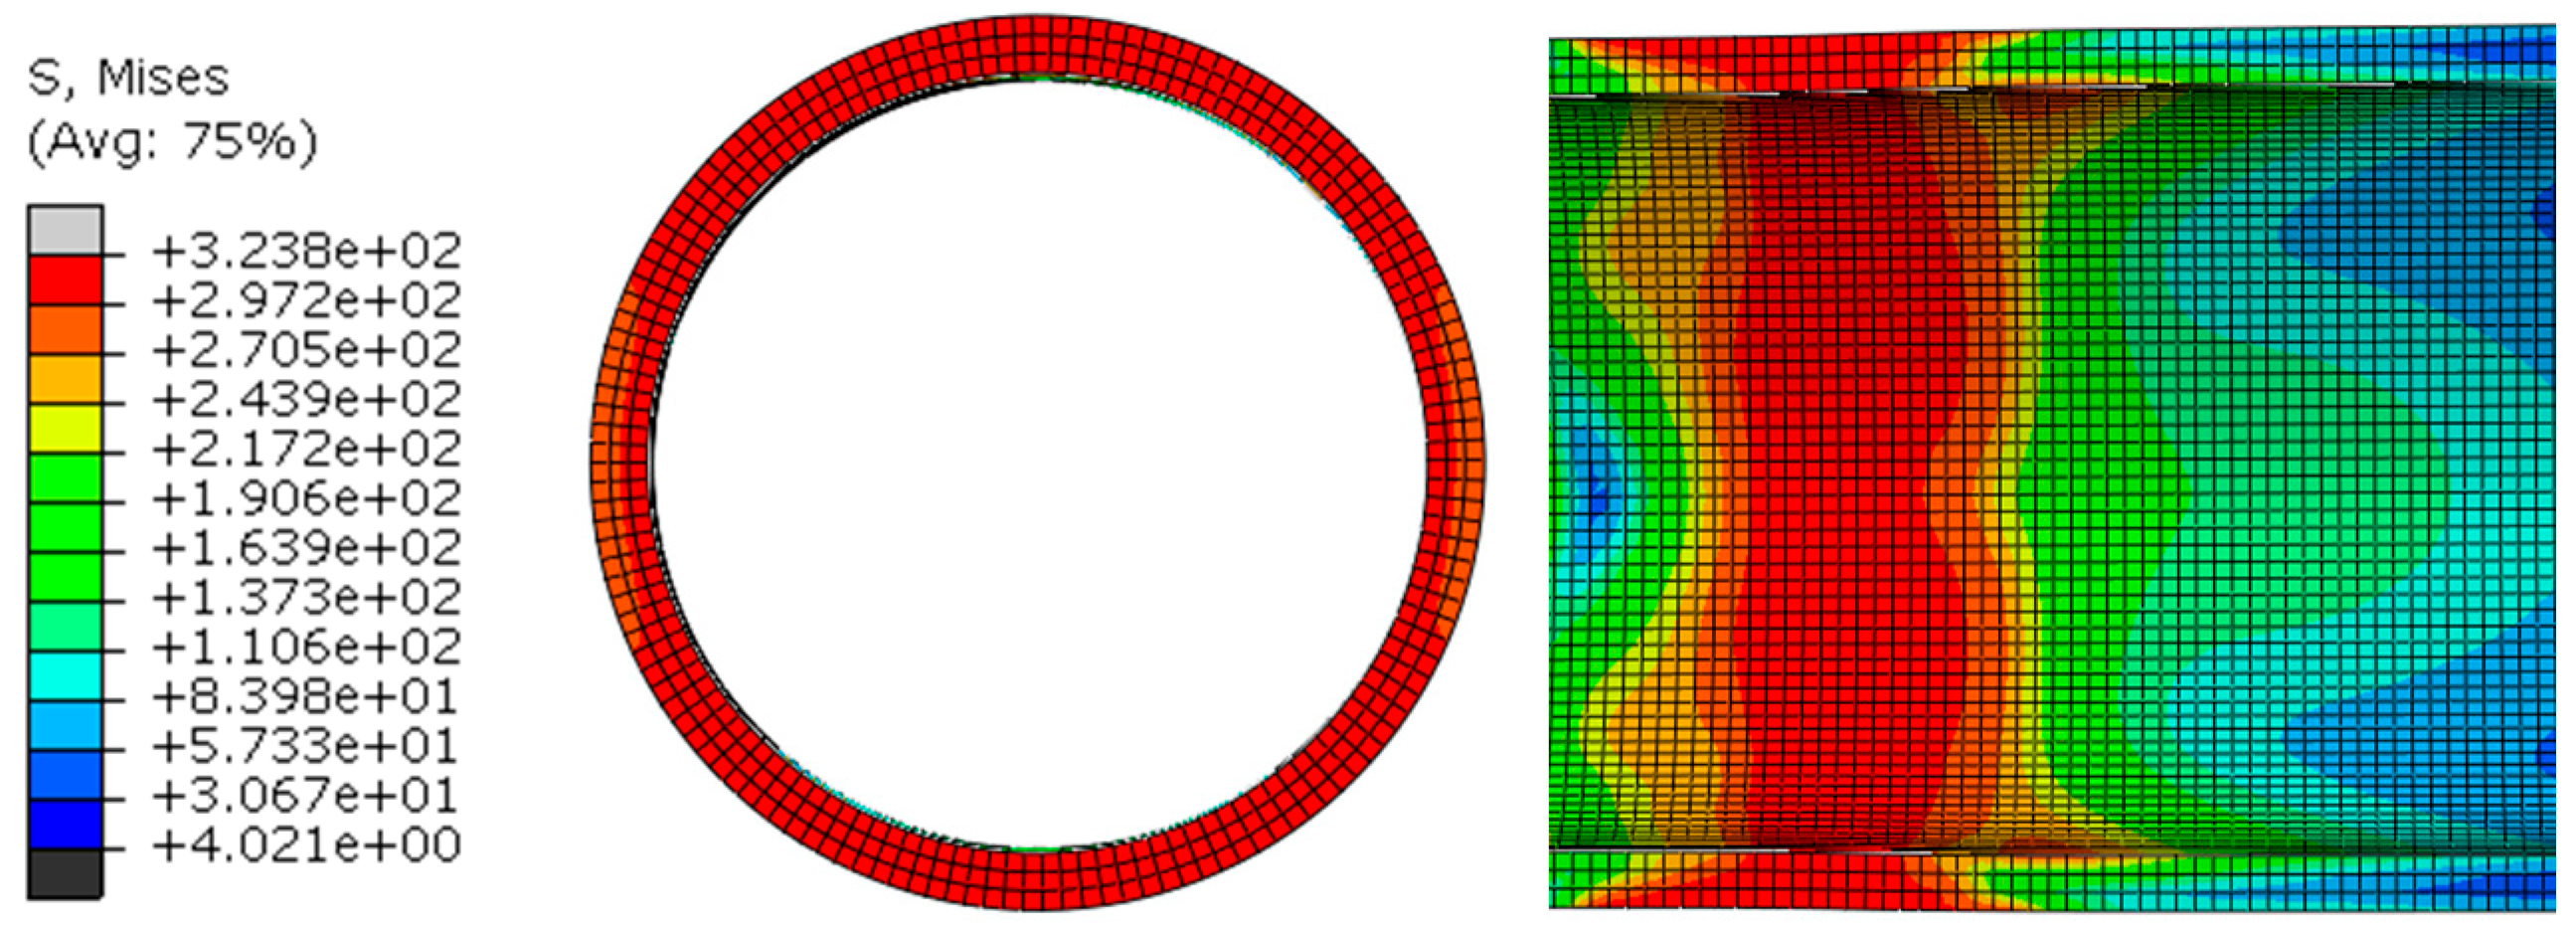
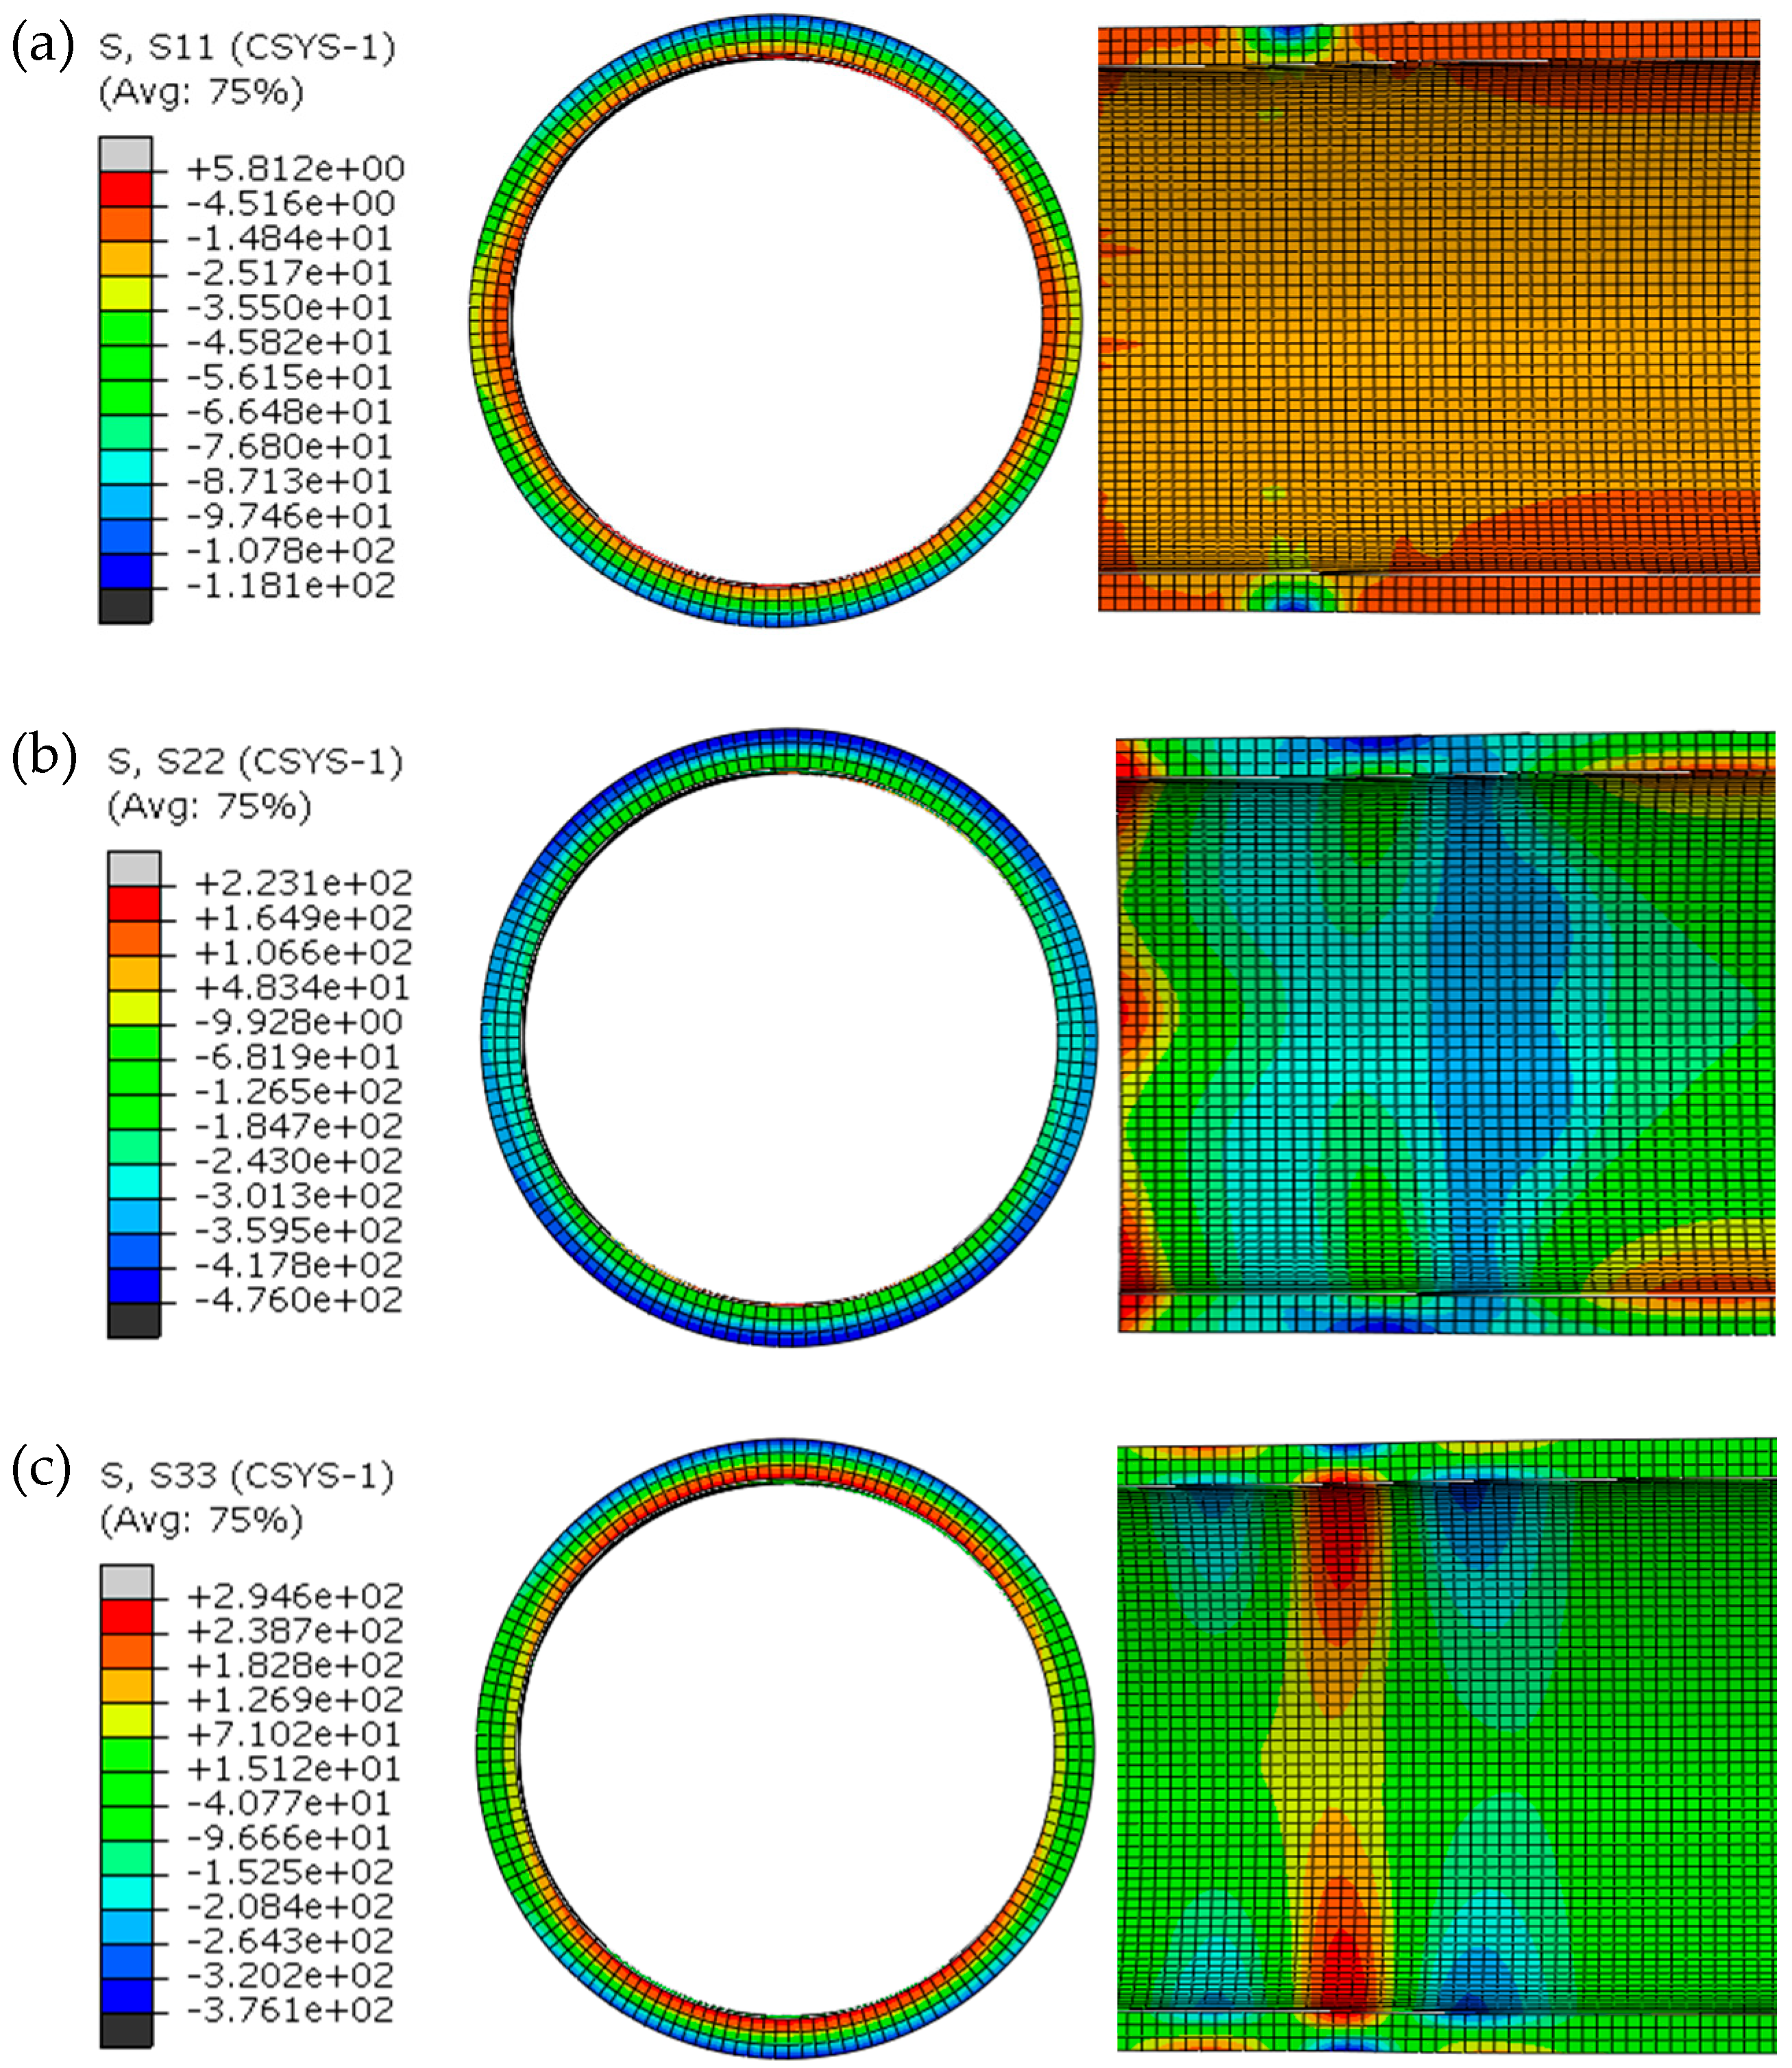
6.1. Stress and Strain
6.2. Evaluation of Ovality
7. Conclusions
- (1)
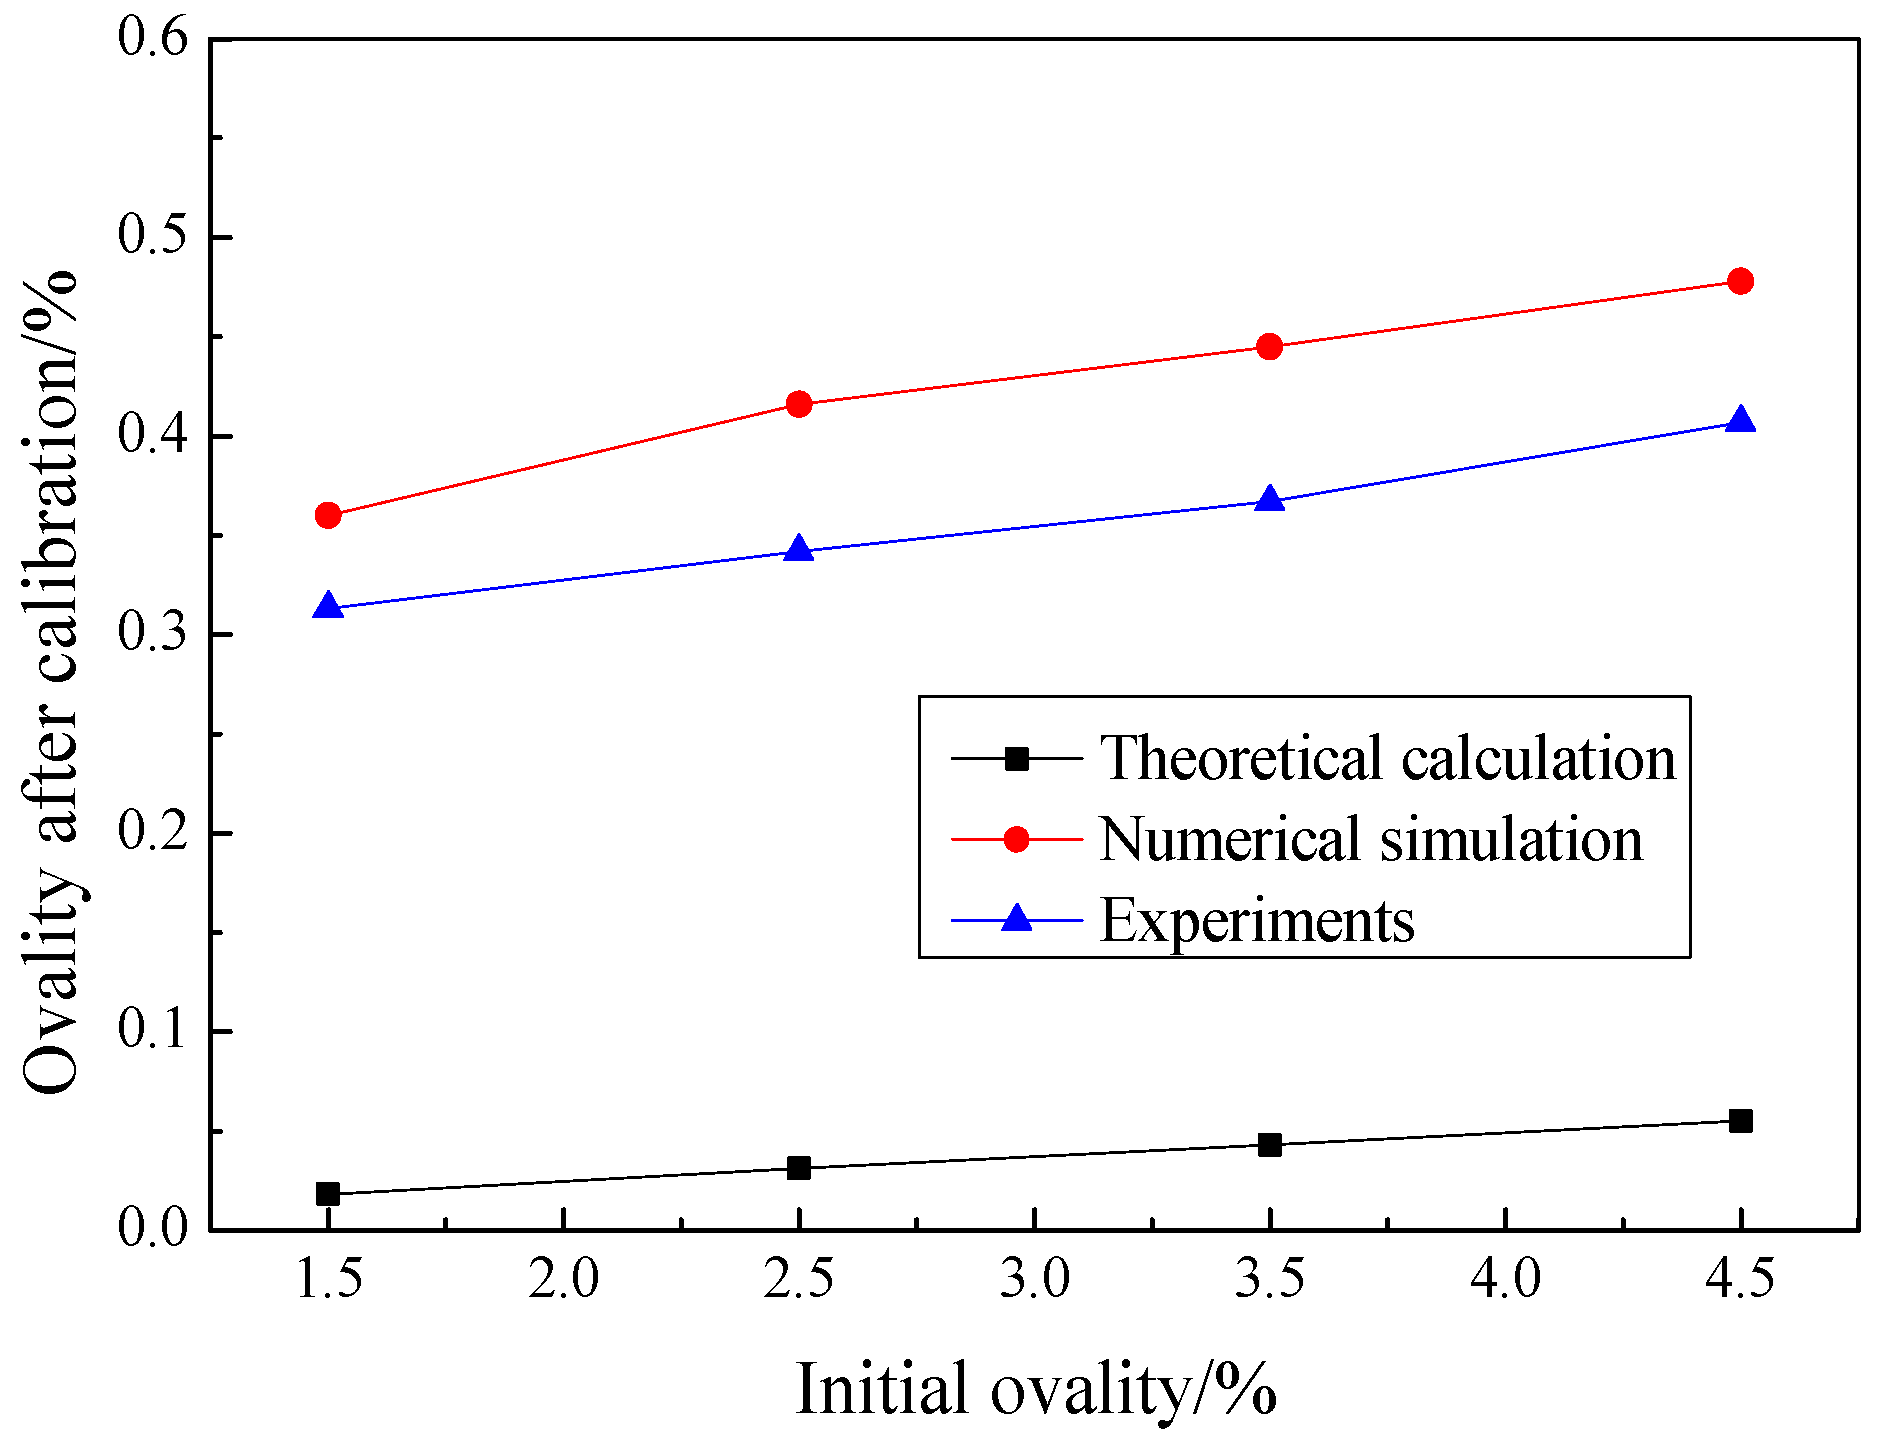
- A TRCC process by compression was proposed for submarine pipelines to reduce the ovality and residual stress, and to increase the compressive yield strength in order to improve the collapse pressure of the pipe in deep sea. In the process, the continuous local loading not only reduces the tonnage of the equipment, but also improves the efficiency of the calibration process. The ovality after calibration was about 0.03% by theoretical calculation, and the ovality after calibration was less than 0.45% by numerical simulation and experiment, which proves the feasibility of the process.
- (2)
- The springback analytical model of TRCC process was established, and the ovality after calibration was predicted, which provides a theoretical basis for roller shape design and process parameters formulation.
- (3)
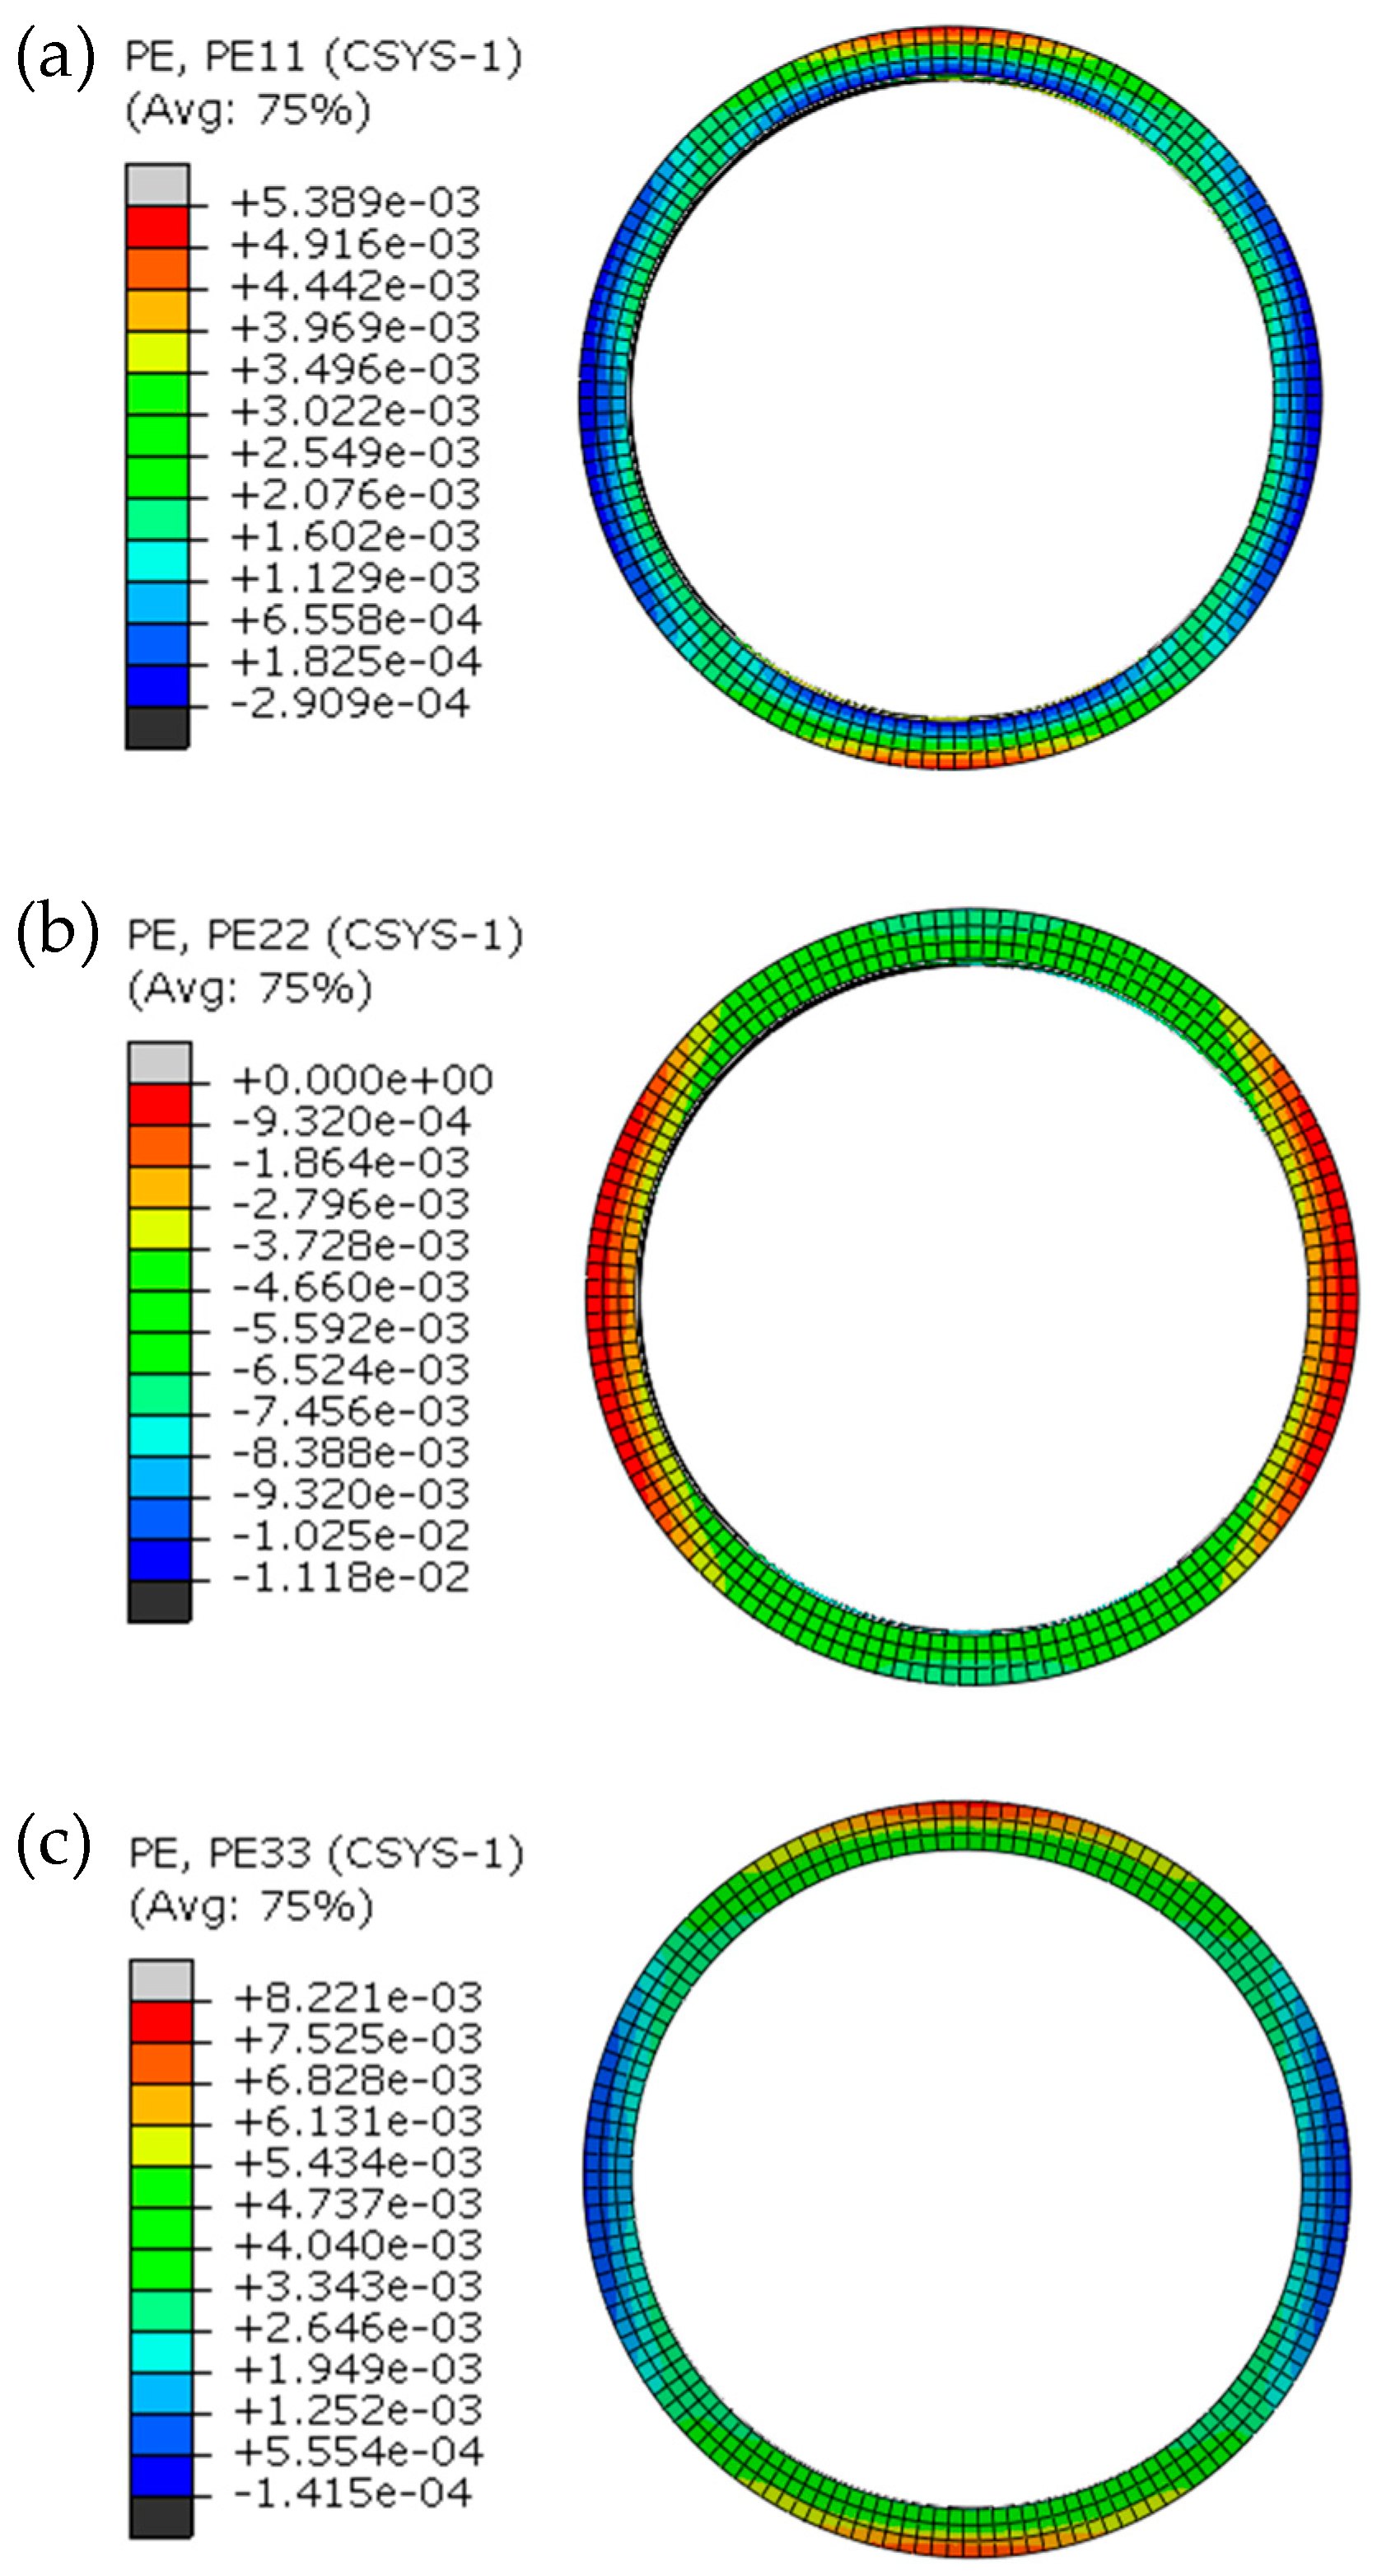
- The process is part of local continuous loading. Under the combined action of compression and bending, the deformation is complex, and the pipe is in a state of triaxial stress and triaxial strain.
- (4)
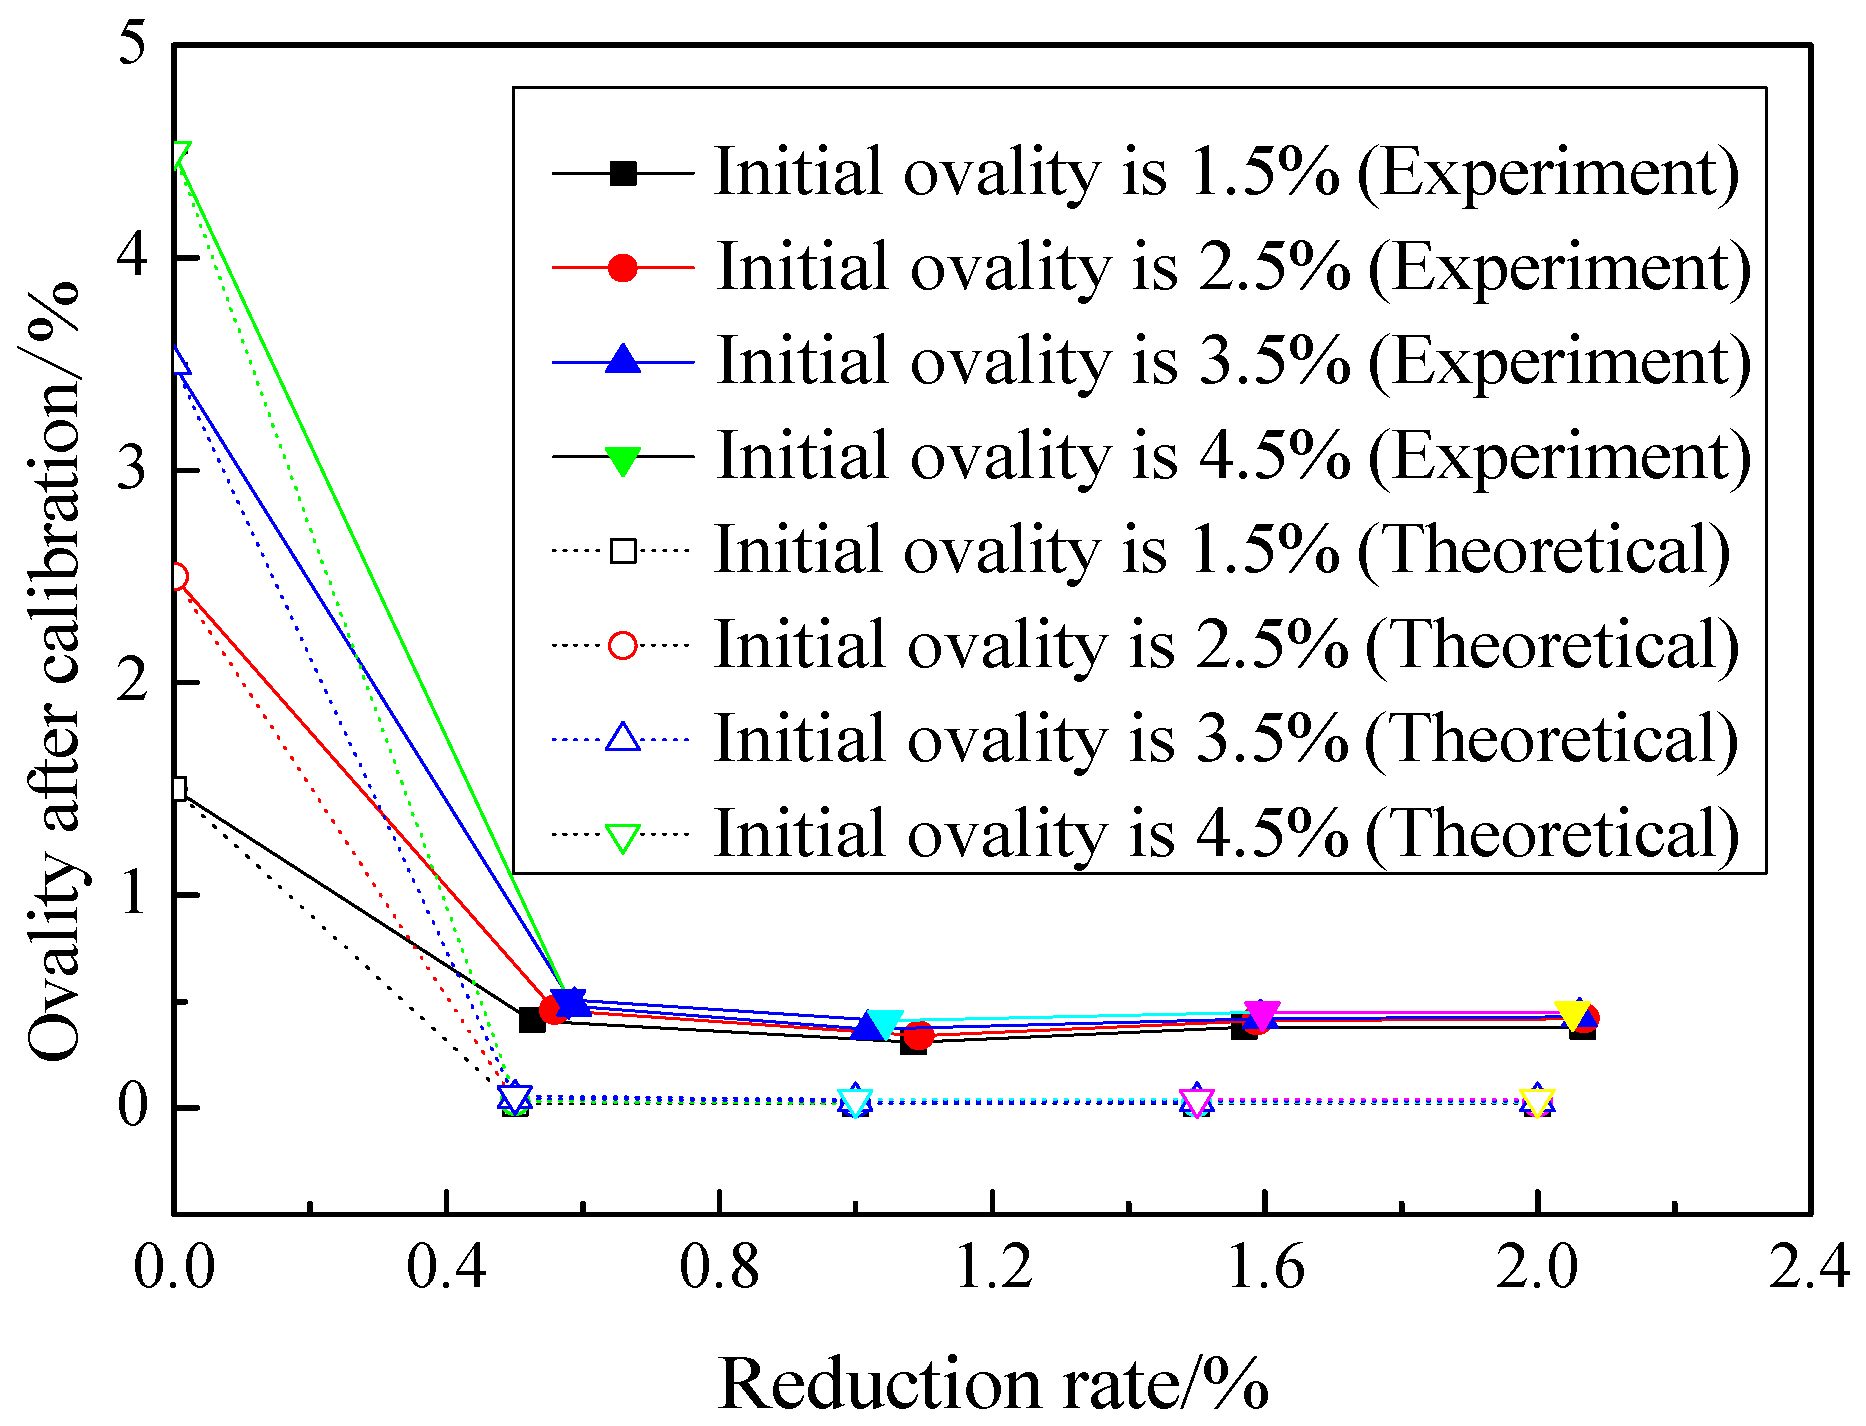
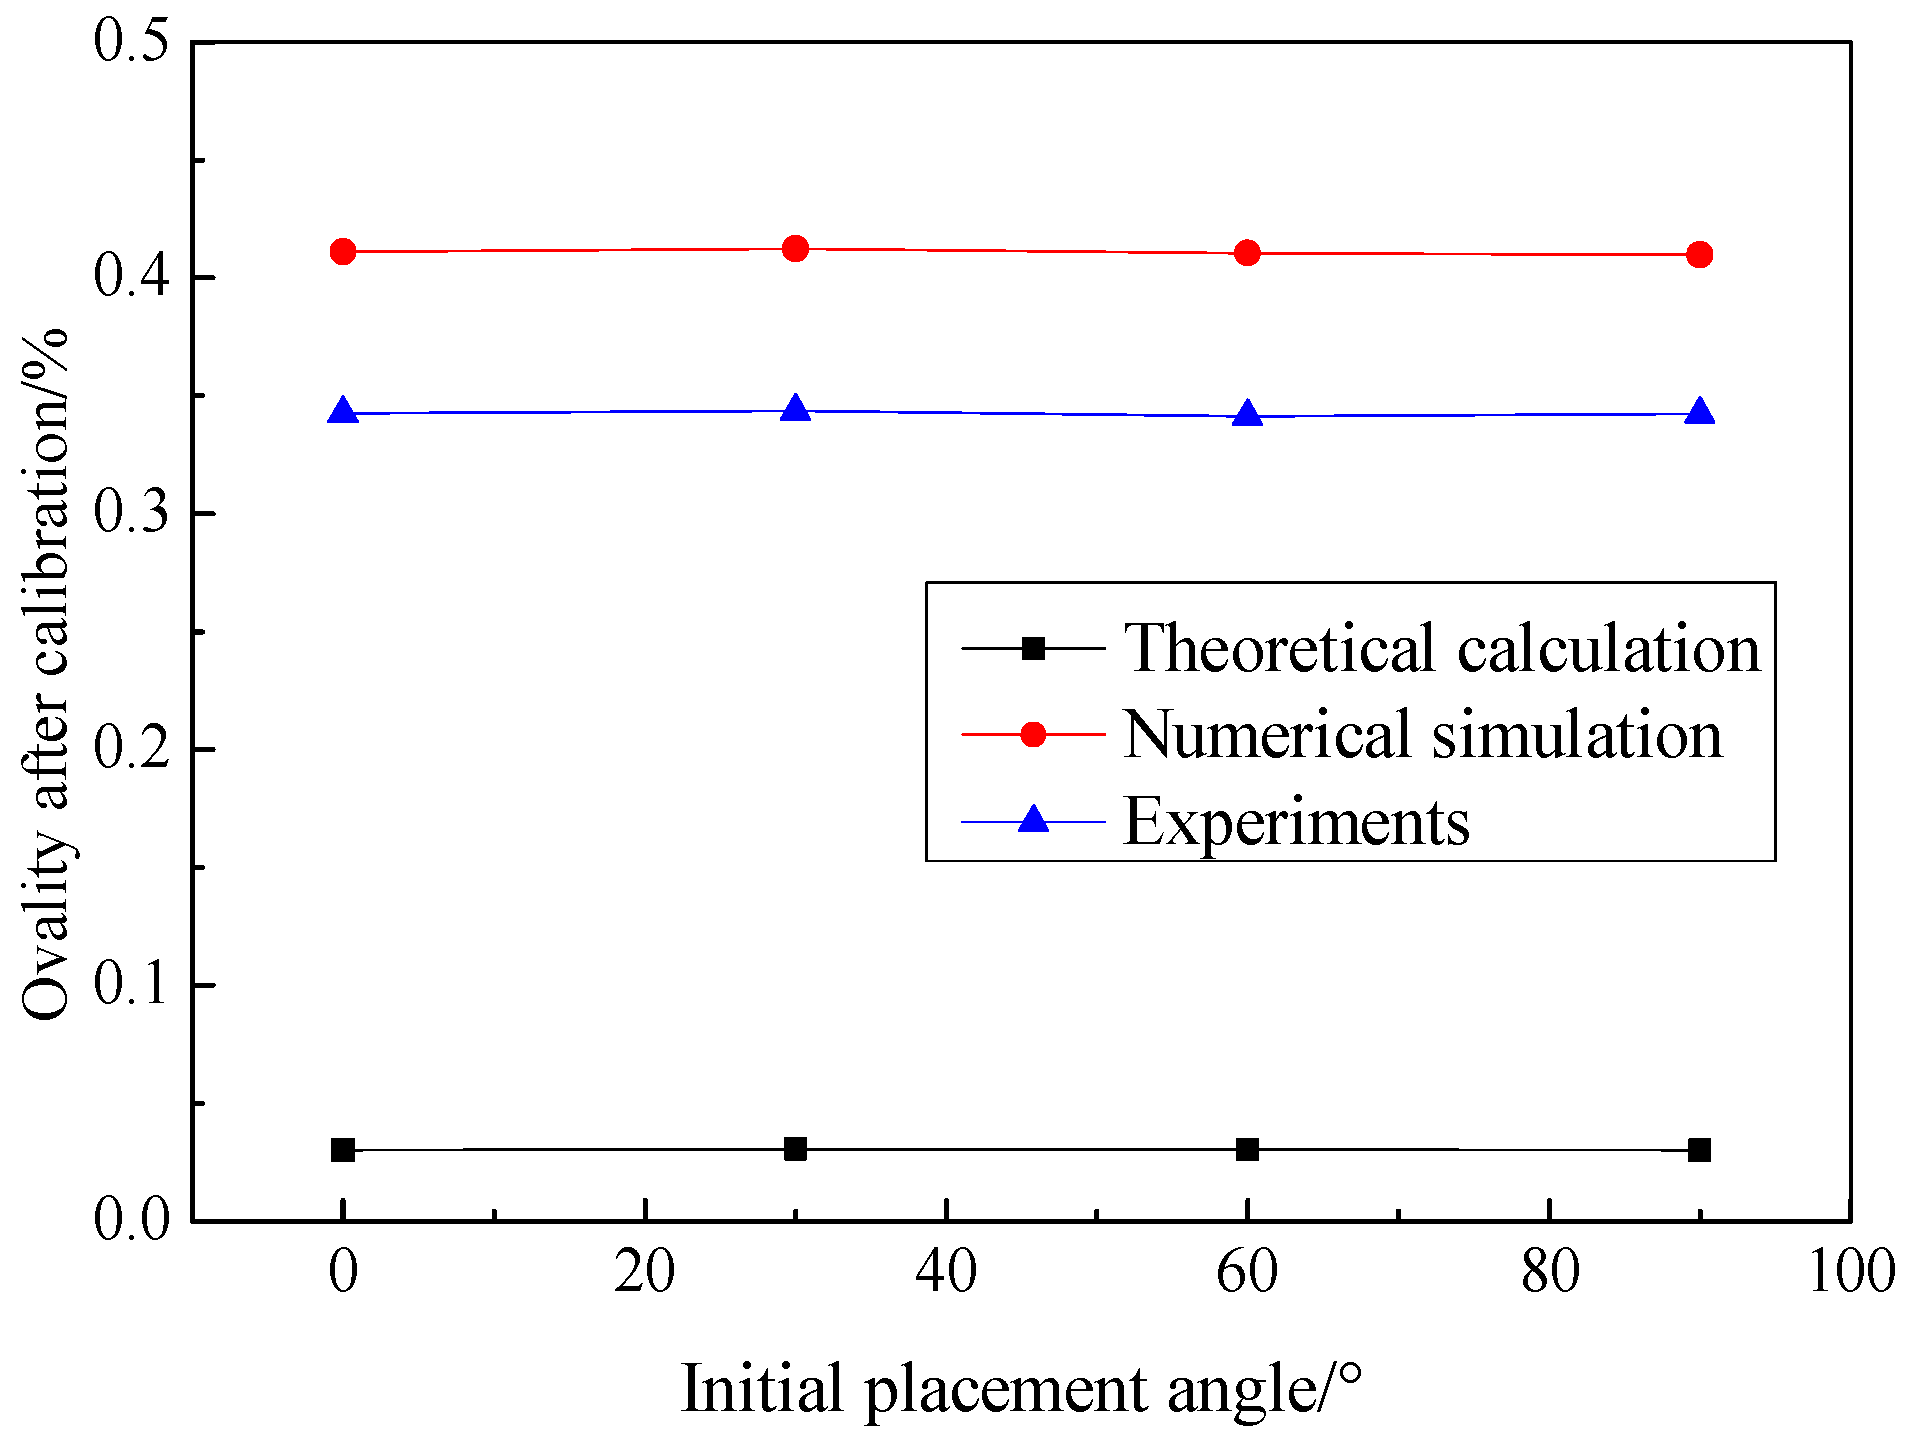
- The ovality after calibration decreases with the increase in reduction ratio, and finally tends to be saturated. It is only somewhat related to the initial ovality but is unrelated to the placement angle of the pipe. When the reduction ratio is about 1%, the ovality after calibration is optimal.
Author Contributions
Funding
Institutional Review Board Statement
Informed Consent Statement
Data Availability Statement
Conflicts of Interest
References
- Yu, J.X.; Han, M.X.; Yu, Y.; Duan, J.H.; Chen, H.C. The research on pipe structural behavior of 3D UOE manufacturing process. Thin Wall. Struct. 2021, 158, 107168. [Google Scholar] [CrossRef]
- Yi, J.; Kang, S.C.; Park, W.; Choo, J.F. Yield strength tracking of UOE pipe considering various thickness-to-diameter ratios. Mar. Struct. 2019, 68, 102616. [Google Scholar] [CrossRef]
- Yi, J.; Kang, S.C.; Koh, H.M.; Choo, J.F. Yield strength prediction of UOE pipes: From forming to flattening. Int. J. Offshore Polar. 2018, 28, 206–211. [Google Scholar] [CrossRef]
- Zhang, Z.Y.; Wang, H.R.; Yu, G.C.; Zhao, J. Research on four-point air bending process and contour detection method for JCO forming process of LSAW pipes. Metals 2019, 9, 859. [Google Scholar] [CrossRef] [Green Version]
- Konstantinos, A.; Giannoul, A.C.; Karamanos, S.A.; Tazedakis, A.; Palagas, C.; Dourdounis, E. Numerical simulation of JCO-E pipe manufacturing process and its effect on the external pressure capacity of the pipe. J. Offshore Mech. Arct. 2019, 141, 011704. [Google Scholar] [CrossRef] [Green Version]
- API Publishing Services. ANSI/API Specification 5L, Forty-Fourth Edition, ISO 3183:2007, Specification for Line Pipe; API Publishing Services: Washington, DC, USA, 2009. [Google Scholar]
- Chatzopoulou, G.; Karamanos, S.A.; Varelis, G.E. Finite element analysis of UOE manufacturing process and its effect on mechanical behavior of offshore pipes. Int. J. Solids Struct. 2016, 83, 13–27. [Google Scholar] [CrossRef]
- Fu, F. Development status and countermeasures of marine engineering equipment in china. China Plant. Eng. 2020, 13, 213–214. [Google Scholar]
- Yu, J.X.; Guo, S.; Yu, Y.; Li, Y.; Li, X. Effects of crack parameters on fatigue life of subsea pipelines. J. Tianjin Univer. 2016, 49, 889–895. [Google Scholar]
- Feng, C.J.; Chen, G.L.; Li, T.; Lu, Q.Z.; Cui, Y.H. Study on the theoretical applicability of submarine pipeline collapse analysis. J. Ocean. Tech. 2020, 39, 88–94. [Google Scholar]
- Madhav, V.; Krishnaswamy, H.; Majumdar, S. Analysis of UOE forming process accounting for Bauschinger effect and welding. Mater. Manuf. Process. 2020, 35, 910–921. [Google Scholar] [CrossRef]
- Chatzopoulou, G.; Antoniou, K.; Karamanos, S.A. Numerical simulation of JCO pipe forming process and its effect on the external pressure capacity of the pipe. In Proceedings of the International Conference on Ocean, Offshore and Arctic Engineering (OMAE), Trondheim, Norway, 25–30 June 2017. [Google Scholar] [CrossRef]
- Kyriakides, S.; Corona, E. Mechanics of Offshore Pipelines, Buckling and Collapse; Elsevier: Amsterdam, The Netherlands, 2007; Volume 1. [Google Scholar]
- Herynk, M.D.; Kyriakides, S.; Onoufriou, A.; Yun, H.D. Effects of the UOE/UOC pipe manufacturing processes on pipe collapse pressure. Int. J. Mech. Sci. 2007, 49, 533–553. [Google Scholar] [CrossRef]
- Kyriakides, S.; Corona, E.; Fischer, F.J. On the effect of the UOE manufacturing process on the collapse pressure of long tubes. Offshore Technol. Conf. 1991. [Google Scholar] [CrossRef]
- Pan, X.; Chen, P.; Qian, Y.; Li, Y.F. Numerical Simulation of Rounding-sizing Process of Large-sized Straight Welded Pipe. Steel Pipe. 2009, 38, 70–73. [Google Scholar]
- Yin, J.; Zhao, J.; Sun, H.L.; Zhan, P.P. Precise compression and setting round by mold for large pipes. Opt. Precis. Eng. 2011, 19, 2072–2078. [Google Scholar]
- Zhao, J.; Sun, H.L.; Song, X.K.; Ma, R. Four-point bending JCOC process: A new technology for forming longitudinally submerged arc welding pipe. J. Plast. Eng. 2012, 19, 59–62. [Google Scholar] [CrossRef]
- Zhao, J.; Zhan, P.P.; Ma, R.; Zhai, R.X. Control strategy of over-bending setting round for pipe-end of large pipes by mould press type method. Trans. Nonferrous Met. Soc. China 2012, 22, 329–334. [Google Scholar] [CrossRef]
- Yuan, J.; Li, J.; Dou, F.L.; Zhang, Y.N. Simulation analysis on necking process of tube. Forg. Stamp. Tech. 2015, 40, 50–55. [Google Scholar]
- Yu, G.C.; Zhao, J.; Zhai, R.X.; Ma, R.; Wang, C.G. Theoretical analysis and experimental investigations on the symmetrical three-roller setting round process. Int. J. Adv. Manuf. Technol. 2018, 94, 45–46. [Google Scholar] [CrossRef]
- Huang, X.Y.; Yu, G.C.; Zhao, J.; Mu, Z.K.; Zhang, Z.Y.; Ma, R. Numerical simulation and experimental investigations on a three-roller setting round process for thin-walled pipes. Int. J. Adv. Manuf. Technol. 2020, 107, 355–369. [Google Scholar] [CrossRef]
- Kyu, W.K.; Moon, K.K.; Woo, Y.C. An analytical model of roll bending steel pipe formed by three rollers. Int. J. Adv. Manuf. Tech. 2019, 104, 4039–4048. [Google Scholar] [CrossRef]
- Zhang, X.H.; Pan, G. Collapse of thick-walled subsea pipelines with imperfections subjected to external pressure. Ocean. Eng. 2020, 213, 107705. [Google Scholar] [CrossRef]
- Zhao, J.; Yin, J.; Ma, R.; Ma, L.X. Springback equation of small curvature plane bending. Sci. China Technol. Sci. 2011, 54, 2386–2396. [Google Scholar] [CrossRef]
- Huang, X.Y.; Zhao, J.; Yu, G.C.; Meng, Q.D.; Mu, Z.K.; Zhai, R.X. Three-roller continuous setting round process for longitudinally submerged arc welding pipes. Trans. Nonferrous Met. Soc. China 2021, 31, 1411–1426. [Google Scholar] [CrossRef]
- Zhao, J.; Zhan, P.P.; Ma, R.; Zhai, R.X. Prediction and control of springback in setting round process for pipe-end of large pipe. Int. J. Press. Vessel. Pip. 2014, 116, 56–64. [Google Scholar] [CrossRef]
- Zhao, J.; Song, X. Control strategy of multi-point bending one-off straightening process for LSAW pipes. Int. J. Adv. Manuf. Technol. 2014, 72, 1615–1624. [Google Scholar] [CrossRef]
- Wang, C.G.; Zhang, Z.Y.; Zhai, R.X.; Yu, G.C.; Zhao, J. Cross-sectional distortion of LSAW pipes in over-bend straightening process. Thin Wall. Struct. 2018, 129, 85–93. [Google Scholar] [CrossRef]


| Yield Stress σs/MPa | Elastic Modulus E, GPa | Plastic Modulus D, MPa | Tensile Strength σb, MPa | Poisson Ratio ν | Density, ρ/(kg⋅m−3) |
|---|---|---|---|---|---|
| 298 | 206 | 2533 | 701 | 0.3 | 7.85 × 10⁻⁹ |
Publisher’s Note: MDPI stays neutral with regard to jurisdictional claims in published maps and institutional affiliations. |
© 2021 by the authors. Licensee MDPI, Basel, Switzerland. This article is an open access article distributed under the terms and conditions of the Creative Commons Attribution (CC BY) license (https://creativecommons.org/licenses/by/4.0/).
Share and Cite
Peng, D.; Gong, Z.; Zhang, S.; Yu, G. Two-Roller Continuous Calibration Process by Compression for Submarine Pipelines. Symmetry 2021, 13, 1224. https://doi.org/10.3390/sym13071224
Peng D, Gong Z, Zhang S, Yu G. Two-Roller Continuous Calibration Process by Compression for Submarine Pipelines. Symmetry. 2021; 13(7):1224. https://doi.org/10.3390/sym13071224
Chicago/Turabian StylePeng, Deping, Zhongwang Gong, Shumin Zhang, and Gaochao Yu. 2021. "Two-Roller Continuous Calibration Process by Compression for Submarine Pipelines" Symmetry 13, no. 7: 1224. https://doi.org/10.3390/sym13071224
APA StylePeng, D., Gong, Z., Zhang, S., & Yu, G. (2021). Two-Roller Continuous Calibration Process by Compression for Submarine Pipelines. Symmetry, 13(7), 1224. https://doi.org/10.3390/sym13071224