Abstract
Distributed denial of service (DDoS) attacks often use botnets to generate a high volume of packets and adopt controlled zombies for flooding a victim’s network over the Internet. Analysing the multiple sources of DDoS attacks typically involves reconstructing attack paths between the victim and attackers by using Internet protocol traceback (IPTBK) schemes. In general, traditional route-searching algorithms, such as particle swarm optimisation (PSO), have a high convergence speed for IPTBK, but easily fall into the local optima. This paper proposes an IPTBK analysis scheme for multimodal optimisation problems by applying a revised locust swarm optimisation (LSO) algorithm to the reconstructed attack path in order to identify the most probable attack paths. For evaluating the effectiveness of the DDoS control centres, networks with a topology size of 32 and 64 nodes were simulated using the ns-3 tool. The average accuracy of the LS-PSO algorithm reached 97.06 for the effects of dynamic traffic in two experimental networks (number of nodes = 32 and 64). Compared with traditional PSO algorithms, the revised LSO algorithm exhibited a superior searching performance in multimodal optimisation problems and increased the accuracy in traceability analysis for IPTBK problems.
1. Introduction
A series of major information security incidents have occurred recently. Information security hazards include not only individual hackers highlighting their technical capabilities, but also team attacks aimed at obtaining economic benefits. For example, in 2016, the servers of the First Bank of Taiwan were attacked with a trojan horse from the United Kingdom [1]. Several security breaches involving distributed denial of service (DDoS) attacks have occurred in Taiwan. The Financial Services Information Sharing and Analysis Centre, which is the only global cyber intelligence sharing community solely focused on financial services, reported that more than 100 financial services firms were the targets of a wave of DDoS extortion attacks conducted by the same actor in February 2021. These DDoS attacks by botnets resulted in people being unable to place brokerage orders online with the aforementioned firms. The hackers behind the aforementioned attacks demanded a large ransom from the firms, and threatened to detonate the money by using implanted trojans and launch a new wave of DDoS attacks [2].
The Taiwan Stock Exchange announced that, after suffering DDoS attacks, several companies adopted DDoS attack flow cleaning services based on network intrusion prevention systems in 2020. These services provide possible connections to trace the sources of real attacks, analyse the behavioural feature of cyber attacks with data collection [3], and enable countermeasures to be taken against DDoS threats. To counter DDoS attacks, security managers use the Internet protocol (IP) traceback (IPTBK) scheme for periodically detecting and identifying possible threats.
In the identification of the sources of DDoS attacks from botnets, defenders are assumed to have the ability to collect only a small amount of routing information. Therefore, in real-time IP traceability analysis of the botnet command and control (C&C), a small number of router records are required to trace the attack source successfully in the shortest time. In practice, defenders use machine learning algorithms, such as particle swarm optimisation (PSO) [4,5,6,7], the genetic algorithm, and ant colony optimisation, to trace the attack source. The routing information of the attack path is used for recursively estimating multiple possible attack paths on the Internet, finding the real attack URL, and marking the compromised host. However, because the traditional PSO algorithm has a nonoptimal balance between path exploration and exploitation in the search strategy, it often provides a suboptimal solution of the target, and often only particles travel on the same attack paths towards the attack sources. Generally, multi-swarm systems provide a new approach to improve this balance based on multi-swarm optimisation. Multi-swarm optimisation uses multiple sub-swarms instead of one swarm, and ensures that each sub-swarm explores a specific region with symmetrical competitive interactions in biology.
Inspired by multi-swarm PSO (MS-PSO) schemes [8,9,10,11,12,13,14,15], the present study used locust search PSO (LS-PSO) to identify the multiple attack sources generated by DDoS attacks from botnets. In this study, DDoS attack paths with a high success probability were reconstructed by marking router packets, tracing the IPs of the botnet C&C by using the LS-PSO algorithm based on multi-swarm optimisation, and preventing spoofed IP attacks.
In summary, the primary contributions of this study are as follows:
- ▪
- Different botnet attack sources were analysed with the locust search mechanism to solve the multimodal optimisation problem according to the natural behaviour of locust swarms.
- ▪
- The optimal route-searching process of the LS-PSO algorithm was improved using the short-range force (SRF) of a wave of swarm particles (WOSP) [9,10] to prevent the LS-PSO algorithm from converging prematurely to a local suboptimal solution.
- ▪
- The LS-PSO algorithm has the advantages of the WOSP algorithm and gradient descent method. The LS-PSO algorithm constructed the attack paths first using the cluster strategy, then the route (CFRS) strategy for path searching in the entire solution space, and then found the global multi-objective solution.
- ▪
- The accuracy of the LS-PSO algorithm was 99.07% and 95.05% for the effects of dynamic traffic in two experimental networks (number of nodes = 32 and 64, resectively).
- ▪
- Compared with other route-searching algorithms, such as the A* algorithm [16] and PSO algorithm [4,5,6,7], the proposed LS-PSO algorithm exhibited a higher traceback accuracy in the reconstruction of attack paths, which were employed for analysing attack origins from multiple data sources by using ns-3 with the Boston University Representative Internet Topology Generator (BRITE) framework.
The remainder of this paper is organised as follows. Section 2 presents a review of the locust swarm optimisation (LSO) algorithm for solving multimodal optimisation problems. Section 3 describes the LS-PSO scheme for solving the IPTBK problem. Section 4 presents the experimental results obtained using the LS-PSO algorithm with the ns-3 network simulator, and describes the global heuristic performance of the algorithm. Finally, Section 5 concludes the study.
2. Overview of Multiswarm PSO Schemes
This section reviews several existing multi-swarm PSO schemes for identifying the possible sources of DDoS attacks.
The LSO algorithm [14] was proposed by Stephen Chen in 2009. The original concept of the LSO algorithm is based on the optimisation of group actions according to the biological intelligence of birds. In the process of a locust swarm searching for food (best solution), each locust (individual) represents a solution. The process of PSO involves dispersing each locust in a certain solution space, searching each specific space with a locust, and sharing the information found with the entire swarm. The locust swarm updates its movement according to the route information and the previous experiences of the locusts. Such updates in the movement direction enable the entire swarm to search for food successfully, that is, to find the best solution in the entire solution space.
Three multimodal optimisation methods use revised PSO schemes: the WOSP [9,10], dynamic multiswarm particle swarm optimisation (DMS-PSO) [11,12,13], and LSO algorithms [14,15]. The LSO algorithm is introduced in the following text.
LSO Algorithm
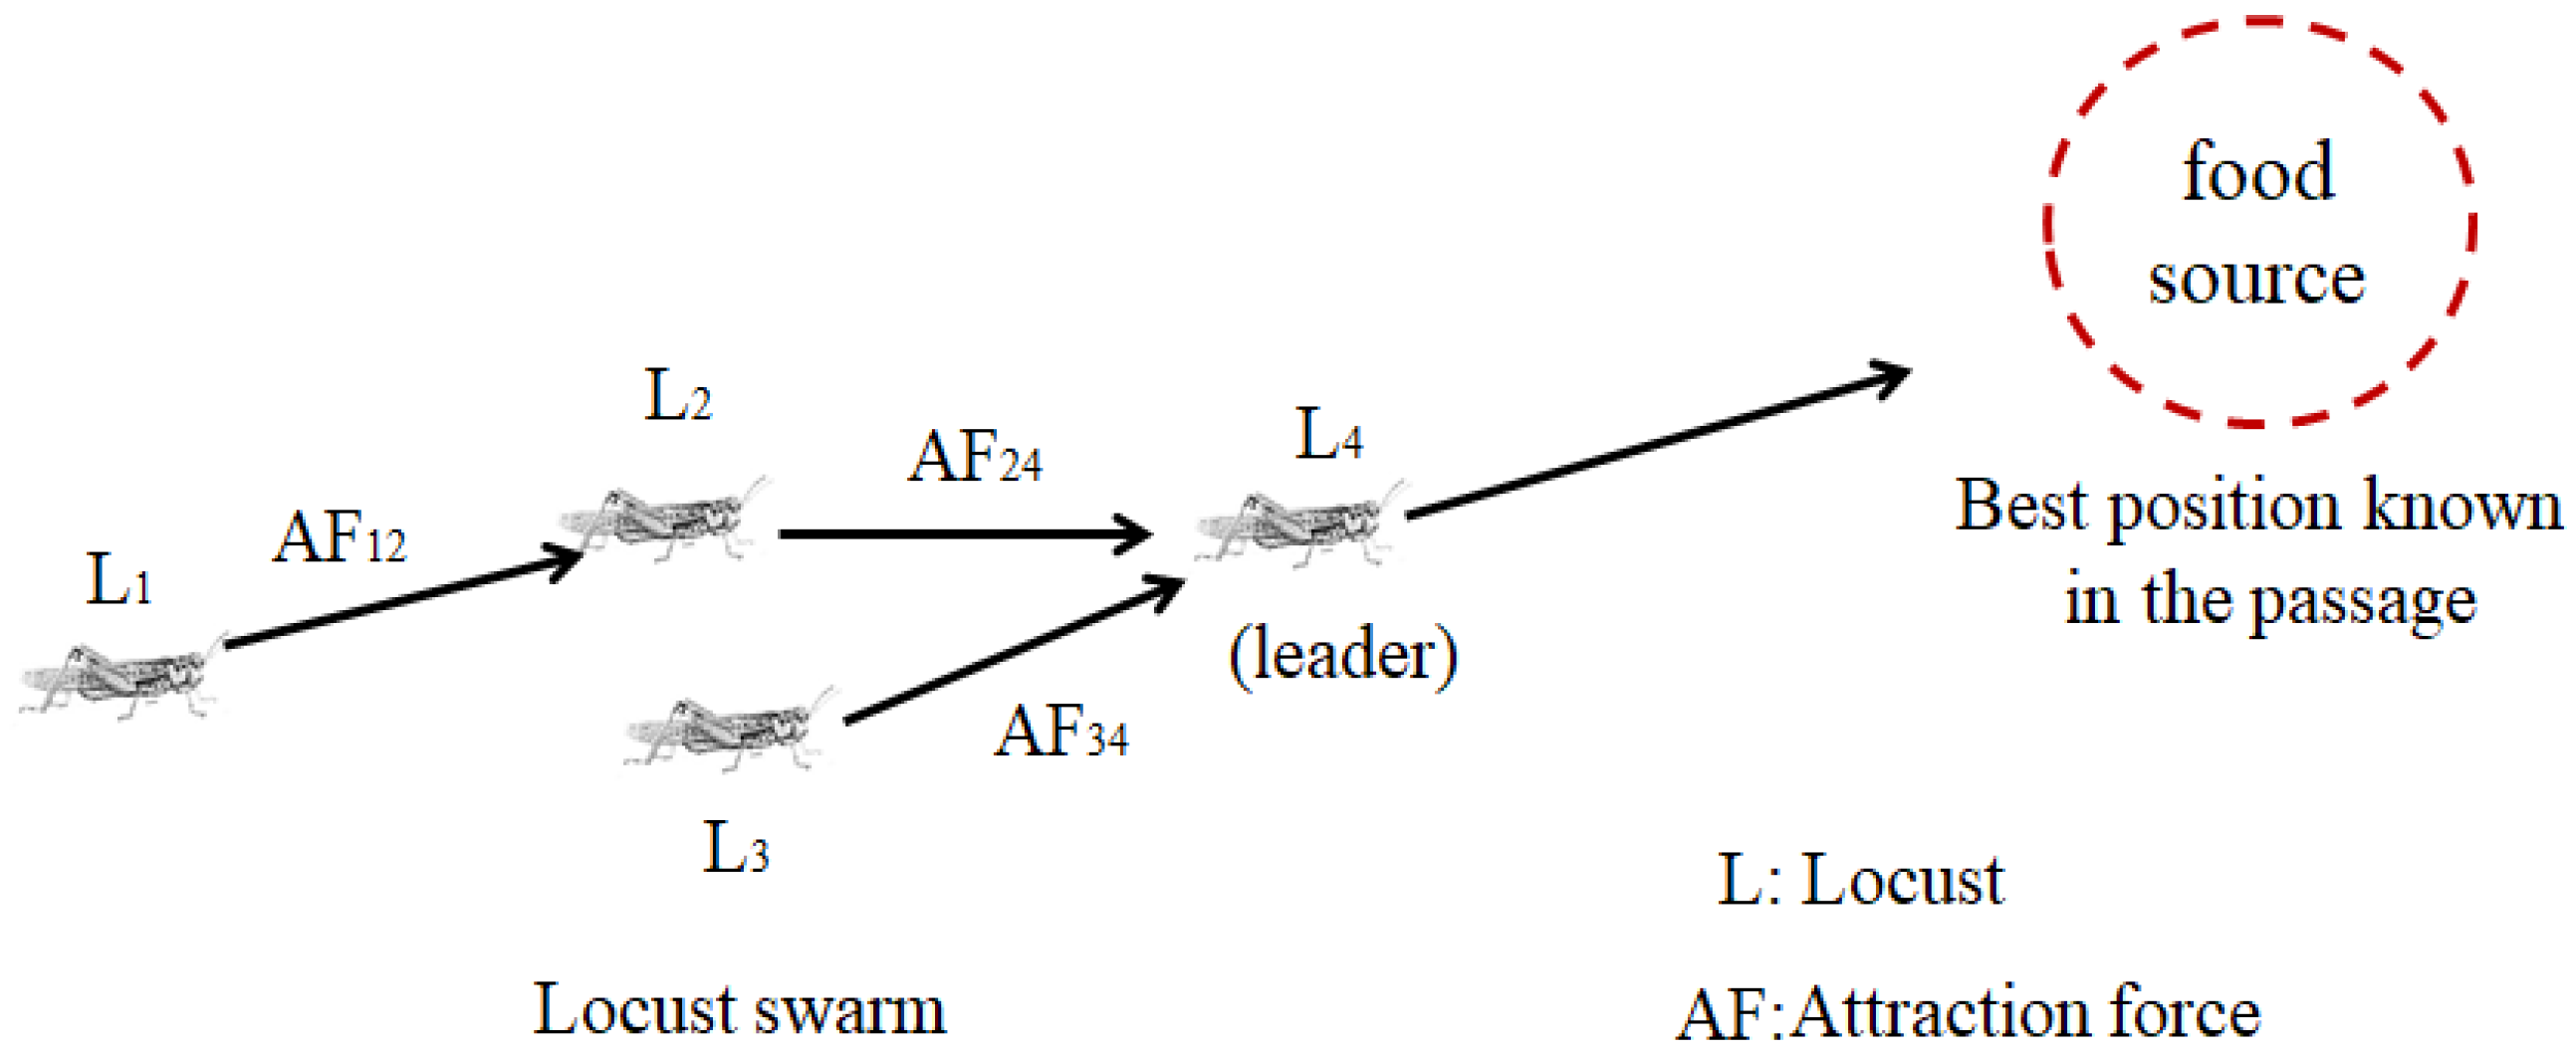
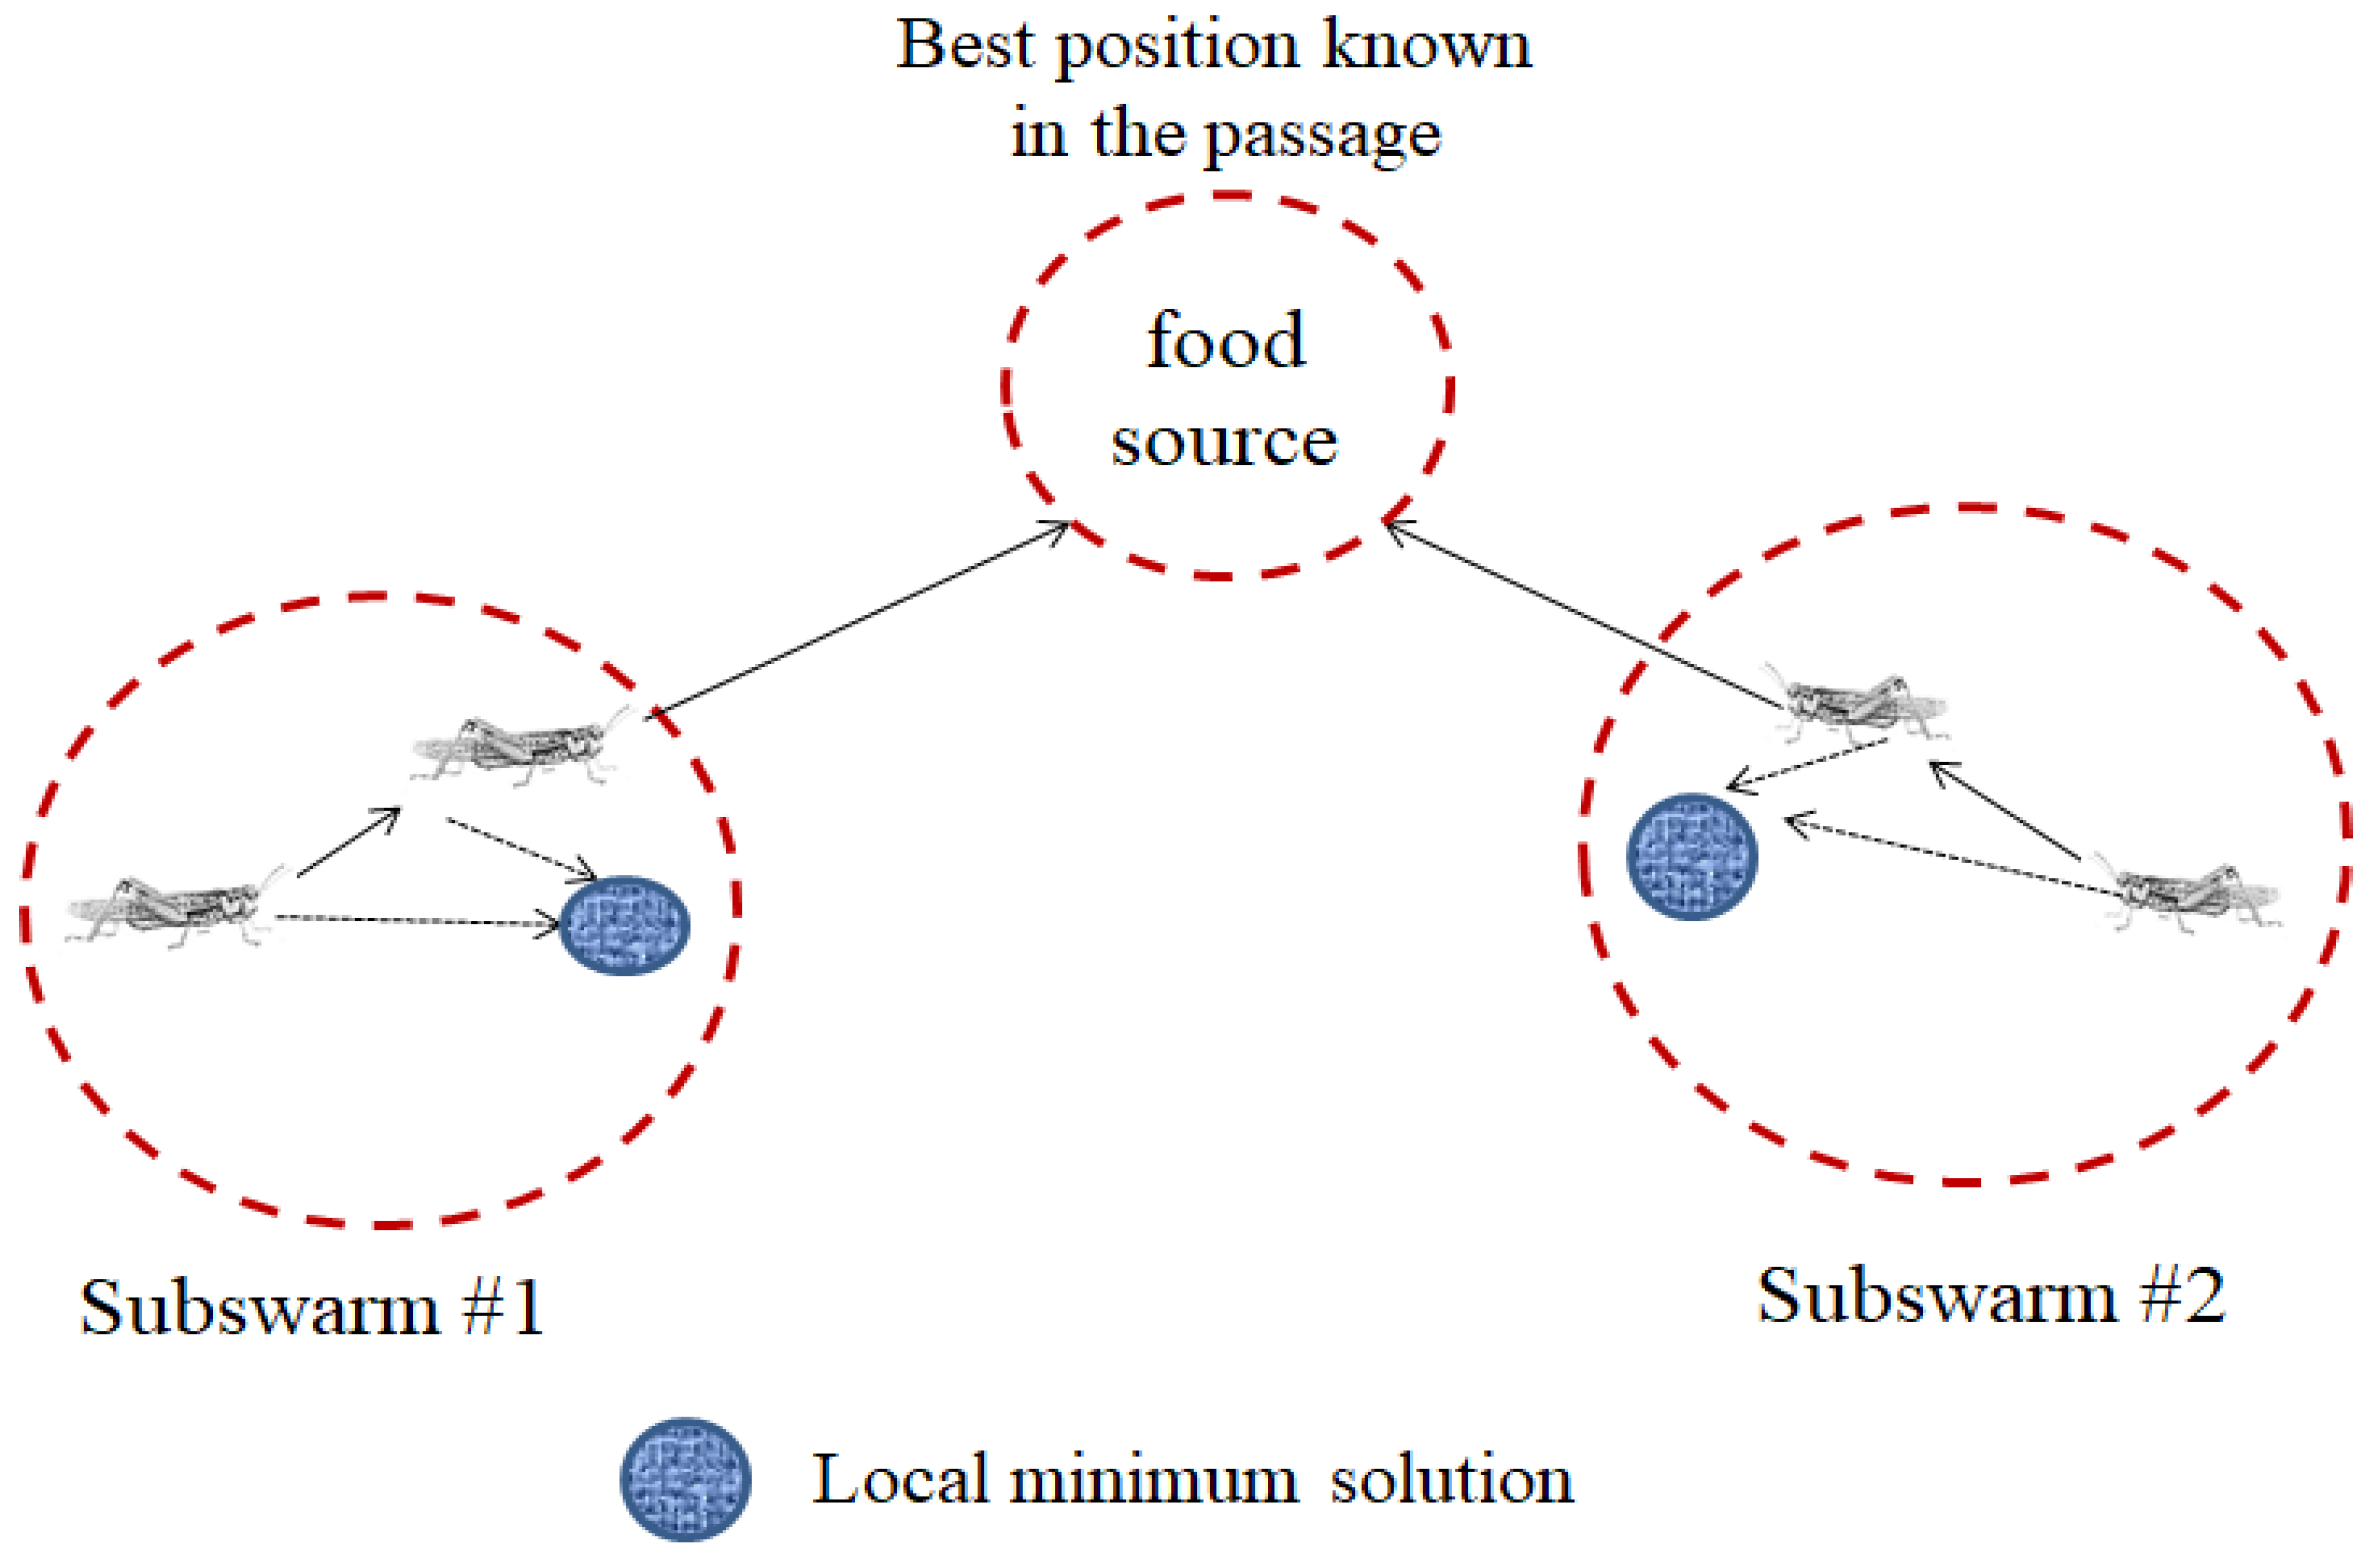
The LSO algorithm is basically a revised version of the WOSP algorithm, which is derived from the PSO algorithm, and aims to prevent premature convergence to local suboptimal solutions associated with the SRF, which comprises the repulsion force (RF) and attraction force (AF; Figure 1) based on symmetric competitive interactions in the biology. In the PSO algorithm, every individual has unique motivations; however, the swarm tends to follow the leader. When newly joined individuals find a better solution on the search path, the leader updates the trajectory. The trajectory of each individual is an inertial route towards the best position known in the passage [9].
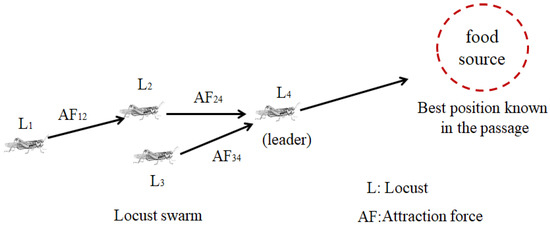
Figure 1.
Movement of locust swarms in the WOSP algorithm.
As displayed in Figure 1, the difference between the LSO and PSO algorithms is that the LSO algorithm is designed to solve multimodal optimisation problems, where locusts (subswarms) simultaneously search for multiple objects. The search position is continually updated through iterations by optimising locust swarms to find the optimal solution.
To enhance the search for multiple optima, the LSO algorithm uses the following two main adjustments for finding a new optimal solution when particles converge near the local optima: (1) the SRF is used to disperse the neighbouring particles escaping from the current local optimum and regroup partial particles into new subswarms, and each subswarm explores the possible best solution (Figure 2), and (2) the starting point is optimised by using the evolutionary algorithm in the best-found optimum process. In general, the evolutionary algorithm produces an excellent next generation of particles to adapt to the changing environment through innate inheritance and acquired knowledge. The pseudocode of the LSO algorithm developed by Chen (2009) [14] is presented as follows (Algorithm 1).
| Algorithm 1 Locust Swarm Optimisation (LSO) Algorithm |
| 1. For Swarm 1 |
| 2. Generate R random particles |
| 3. Select a subset S with the best particles for a particle swarm |
| 4. Assign a random velocity to each particle |
| 5. Run each particle for n iterations |
| 6. Optimise the best particles by using the gradient descent search algorithm |
| 7. For Swarms 2–N |
| 8. Generate R random points around the previous optimum |
| 9. Select a subset S with the best points for a specific particle swarm |
| 10. Run each particle for n iterations |
| 11. Optimise the best points by using the gradient descent search algorithm |
| 12. Obtain the best optimum |

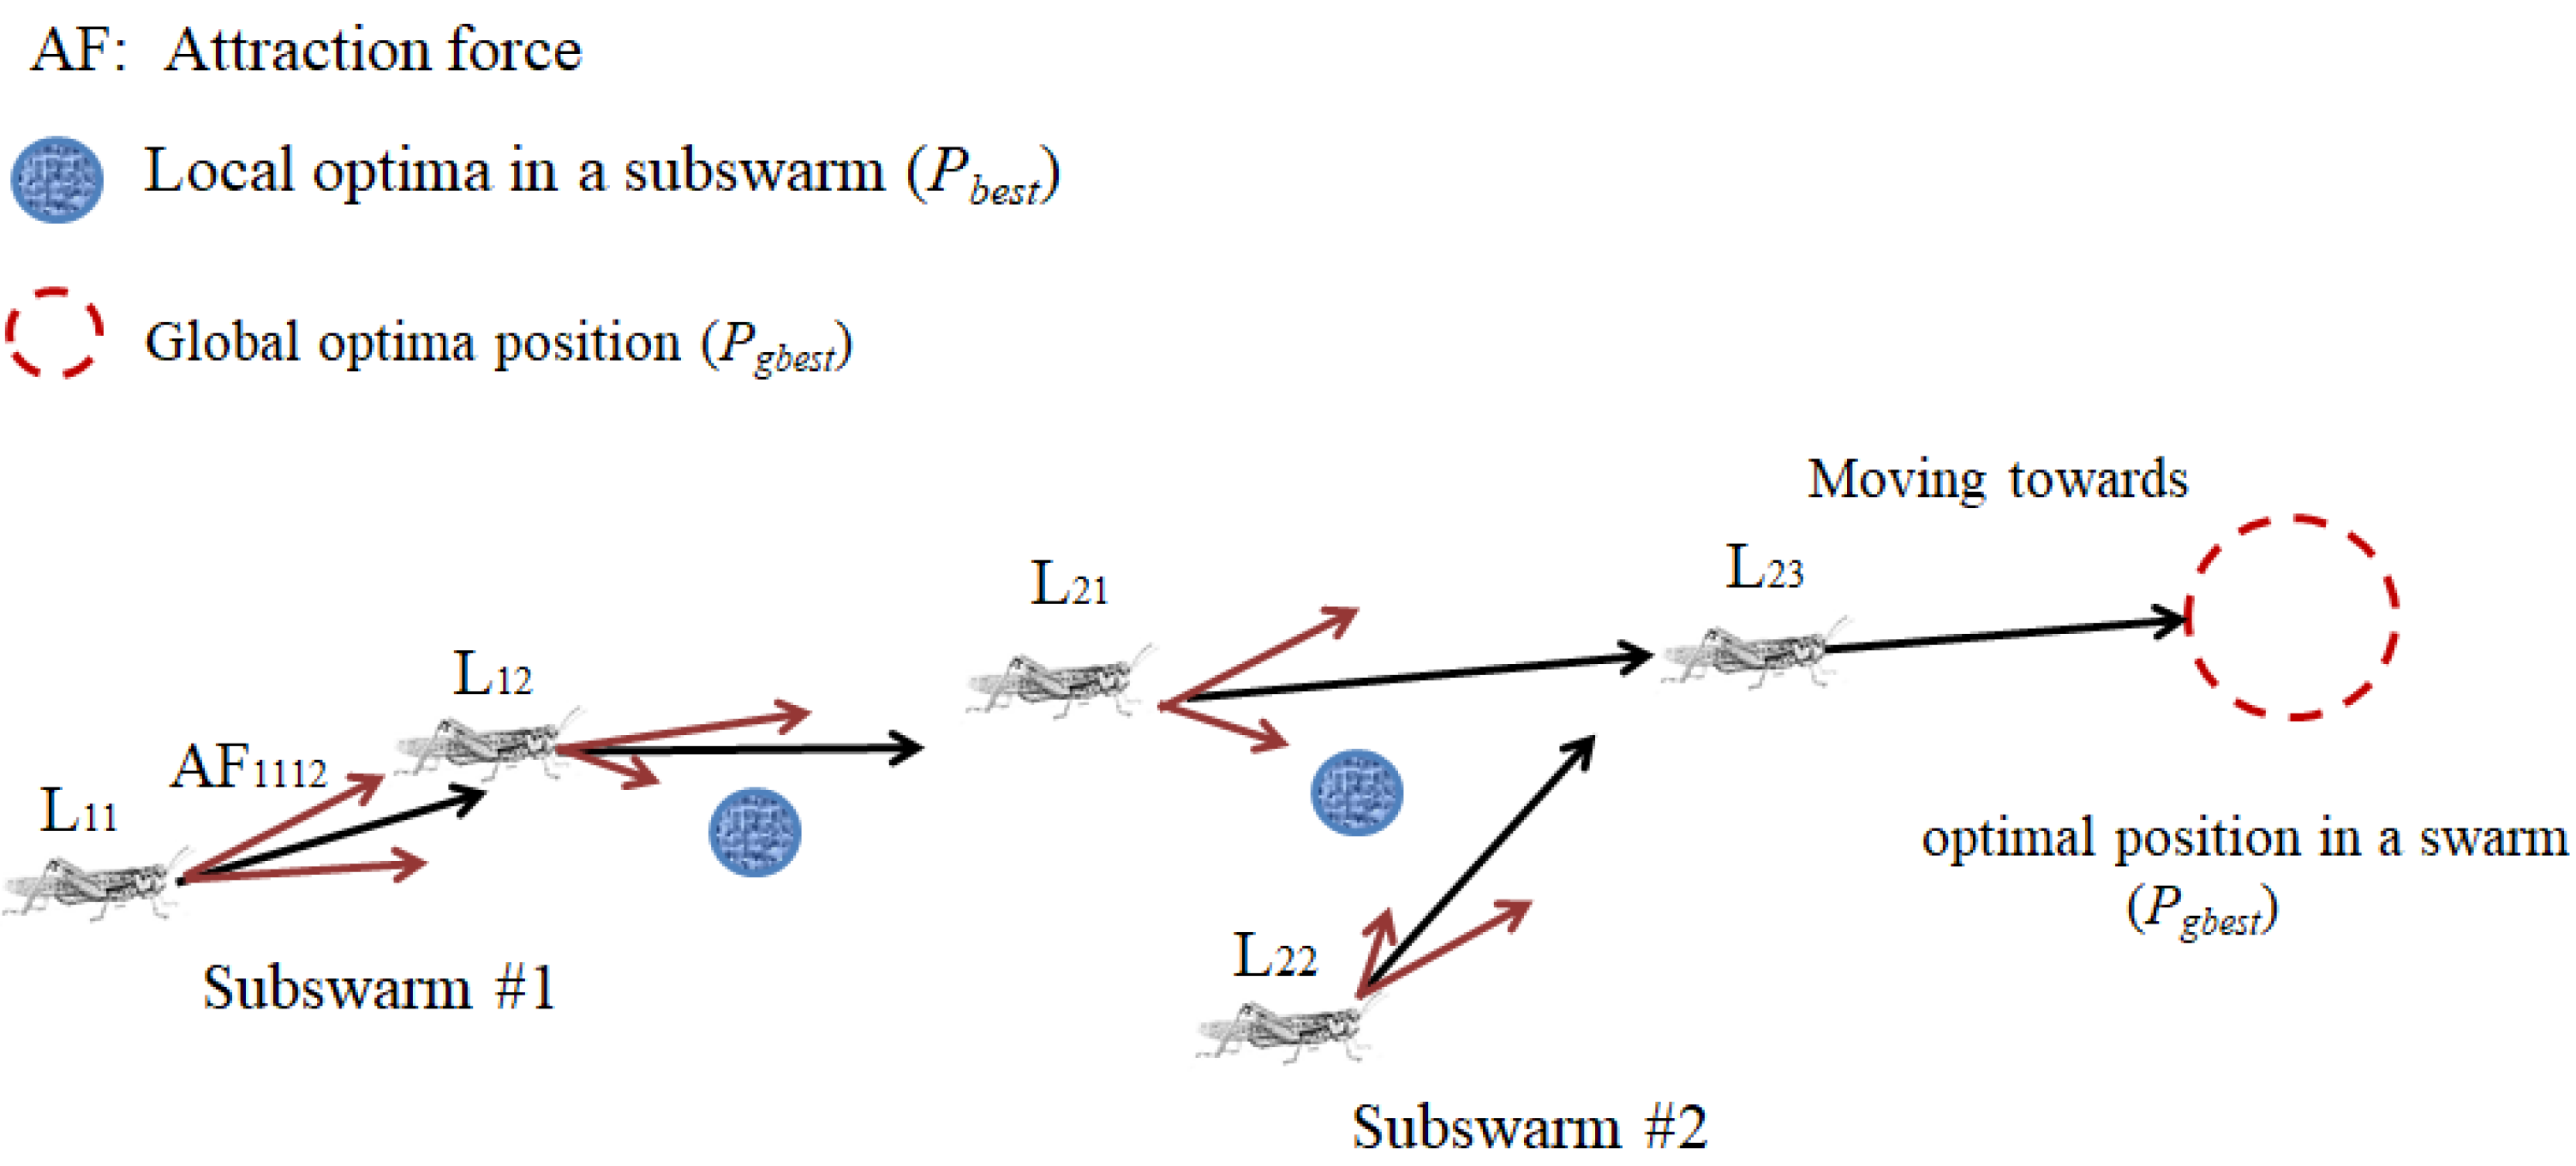
Figure 2.
Search process of the proposed LSO algorithm when using two subswarms.
For Swarm 1-, the LSO algorithm imitates the moving effect of biological swarms when the particles are far away from each other. Thus, the mutual AF between the neighbouring particles produces a particle swarm. The AF leads close for the neighbouring particles and accelerates for each other. After a certain period, the distance between the adjacent particles in the swarm is too low. At this time, these particles generate an RF so that they move away from each other before the next time interval.
For Swarms 2–N-, the LSO algorithm uses a “jump to pre-set direction” strategy at a fixed time interval according to the scout particle suggestions in order to allow partial particles to jump from the original subswarms. In the LSO algorithm, the scout particles are used for selecting the starting point of the jump particles to be scattered in order to explore the best solution. However, the rescattering time and particle direction are random in the WOSP algorithm.
The smart starting point is found using the random search strategy (when R > S, R and S are selected randomly from selected particle swarms) [14] to detect new possible solutions. In line 10, the initial velocity of the particles is selected, such that the particle movement is directed away from the previous best solution and previously searched space.
The LSO algorithm has exhibited good results when solving multimodal optimisation problems. Moreover, multiswarm PSO schemes, such as the WOSP, DMS-PSO, and LSO algorithms, have also provided good search results when solving multimodal problems. Table 1 compares these three PSO schemes.

Table 1.
Comparisons of the features of three locust search PSO schemes.
3. Application of the LSO Algorithm for Solving the IPTBK Problem
The proposed LS-PSO algorithm was used to analyse the accuracy of the attack path reconstruction at various topology sizes. The basic IPTBK problem is described in the following subsections. The problem of the attack path reconstruction can be expressed as a directed graph as follows: G = (N, E) = (ni, eij), where N represents a set of nodes, N = [ni] = {ni1, …, nid, …, niD}, ns is a set of nodes for attack sources, nd represents a set of victims, and E denotes set of edges eij of the graph from node xi to node xj in D-dimensional search space.
3.1. Basic Idea
When solving multimodal optimisation problems, the main aim is to find multiple optimal solutions (global optimum and local optima) associated with a single cost function. Theoretically, multiswarm PSO is suitable for optimisation in multimodal problems with multiple local optima, because it can achieve a good balance between exploration and exploitation behaviours. However, the performance of multiswarm PSO algorithms is dependent on the starting points selected in the search process. When solving multimodal problems, new starting points can be randomly selected or derived from known solutions. In general, starting points are randomly selected. However, many search spaces are globally convex; thus, the quality of the local optima increases as the distance from the global optimum decreases. In the global convex search space of the LSO algorithm, if the starting point is selected near the area of the optimum, the global optimum solution can be obtained using the gradient descent algorithm. To explore possible new solutions, the proposed LS-PSO algorithm uses two behaviours of biological locust swarms, namely, solitary operation and social operation.
Solitary operation. Similar to the behaviour of biological locust swarms, when neighbouring particles are far away from each other within the swarm, the AF ensures group cohesion. Conversely, when neighbouring particles are too close, they are expelled by the SRF into new subswarms, which prevents premature convergence. The SRF can accelerate the particles to separate in different directions at a fixed time interval (Figure 3).
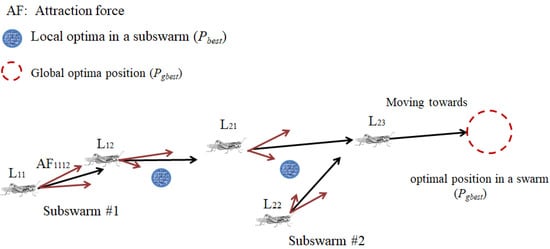
Figure 3.
Prevent the LS-PSO algorithm from converging prematurely using the SRF.
To improve the searching ability of the LSO algorithm, a scout particle is introduced in a swarm to suggest a search direction. In particular, the scout particle recommends the starting point of the re-searching process to find the best path to food sources at the ending period of the search. Thus, the re-searching process prevents most particle swarms from converging prematurely to a local suboptimal solution when the fitness function value has stabilised.
Social operation. To prevent most particle swarms from converging prematurely to local optima, the search space must be expanded using neighbouring particles to form a new particle swarm according to the social behaviour of locust swarms. In practice, the initial values of the particles of the new subswarms are set as close as possible to the global best solution, which decreases the search time for the regional optimal solution. Thus, the intelligent selection of a starting point effectively reduces the computational time, but maintains the accuracy of the recursive re-searching process. Therefore, this research focused on finding the best starting points for the scattering operation.
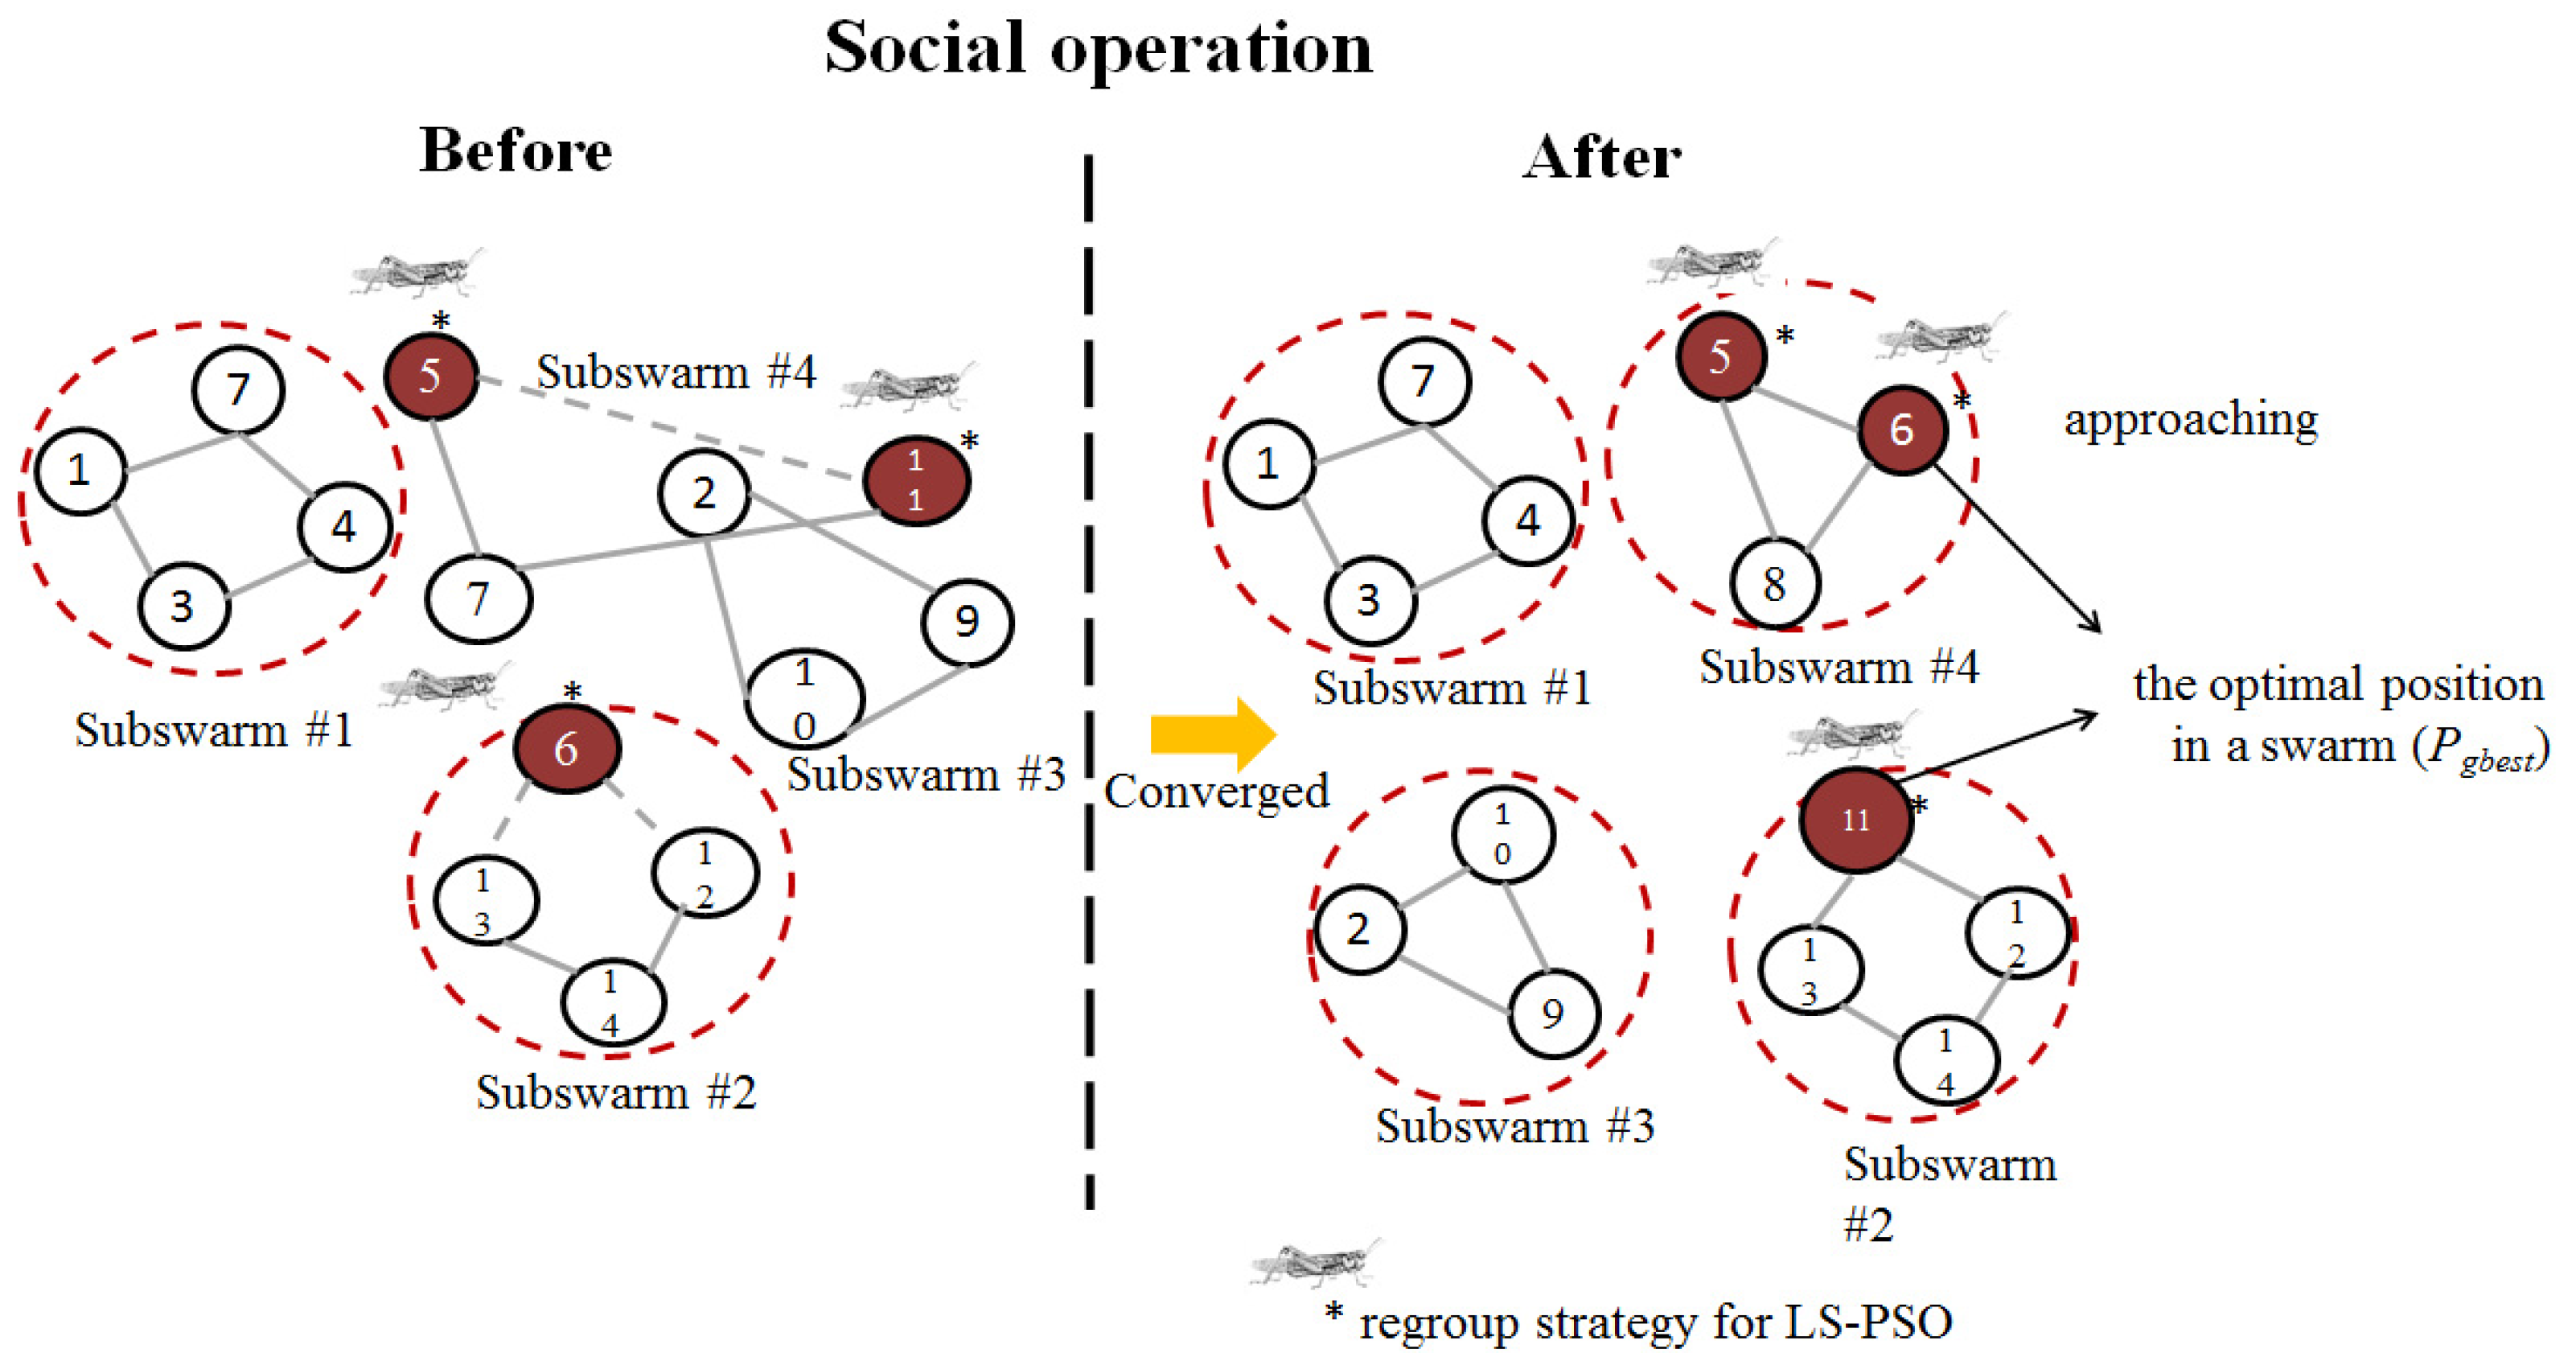
When all the particles converge quickly to a single attack path, the particle subswarms are forced to make dynamic changes in the neighbourhood structure, as illustrated in Figure 4. Thus, adjacent subswarms are reorganised by grouping partial particles into new subswarms for expanding the search space of each subswarm. When each subregion is reorganised and generated at each iteration, some of the particles of the subswarms are periodically randomly recombined, and the new subswarms search the adjacent regions again. R denotes the reorganisation period. In the aforementioned method, each subswarm can fully exchange information with the other subswarms. Compared with the traditional (static) neighbourhood structure, the new neighbourhood structure has greater freedom, which increases the diversity of the particle swarm searching.
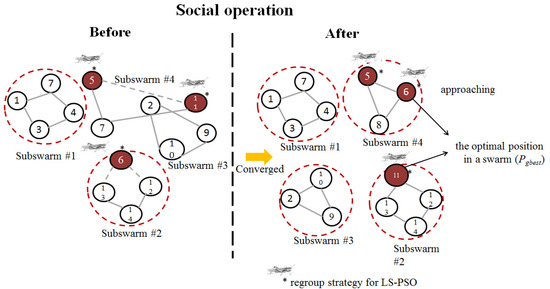
Figure 4.
Regroup strategy for multiswarm optimisation in the LS-PSO.
To prevent premature convergence to local optima, two modified approaches are proposed with updated rules for multi-objective searching: (1) multiswarm optimisation and (2) intelligent starting point selection. In multiswarm optimisation, which is inspired by the DMS-PSO method [11,12,13], the locust swarm periodically regroups the particles of the subswarms after they have converged into new subswarms. The new swarms are produced using particles from previous swarms using the regroup strategy (Figure 4).
In intelligent starting point selection, the starting point is selected near the best area in the global convex search space by using a nonrandom adaptive subswarm scattering strategy. The LSO algorithm attempts to jump using a fixed time interval and direction according to the suggested scout particle scattering at the starting point of the local optimum.
3.2. Tracing the Sources of DDoS Attacks by Using the LS-PSO Algorithm
To prevent particle swarms from converging quickly on a single path, the proposed LS-PSO algorithm divides them into several subswarms. Furthermore, to solve the multimodal search optimisation problem, the rules of each subswarm must be updated in the proposed LS-PSO algorithm.
Assuming that the particle swarm represents a group of packets in the attack path, each packet header record includes the source IP address, the address of the next route, and the destination address. Moreover, we consider that the highest fitness value would be obtained for the most recent experience in which particles travel on the best path. Multiple possible attack paths exist between the nodes (ni, ..., nk, ..., nj). The fitness value of each path is calculated to check whether a particle has travelled on a low-cost path. Usually, the path search algorithm is used to improve the efficiency of a travel routing system by considering the selection of low-cost network routes, that is, where the distance between two nodes (i.e., ni and nj) is shorter, the hop count (dij) is smaller, and the path between the two nodes (ni, nj) has a high quality of service (QoS). Therefore, the path search algorithm usually selects the path with the lowest routing cost (i.e., the shortest travel distance and highest QoS to reduce the routing time). In general, the route cost of path Ci from node xi to the victim is inversely proportional to the distance travelled and directly proportional to the QoS (i.e., a high QoS corresponds to a low transmission delay and low traffic congestion); thus, . Theoretically, the minimum cost function (Lp) must be determined to solve the multipeak optimisation problem; however, this function is subject to routing cost constraints. The minimum cost function (Lp) is a positive number (), which is expressed as follows:
where Fitness represents the fitness value of a path. Adaptability is considered to evaluate the suitability of each path, and indicates whether a path exists from node i to node j for particle n. An value of 1 indicates that a path exists from node i to node j for particle x, and an value of 0 indicates that the aforementioned path does not exist.
Route searching approach: In the proposed LS-PSO algorithm, a two-stage route searching approach based on the cluster first, route second (CFRS) strategy is used for path searching in the entire solution space. Our solution technique involves creating subswarms of particles that contain certain information regarding the destination. Inspired by the CFRS strategy used in capacity-constrained vehicle routing problems, this study divided the attack source into multiple network areas according to the IP domain associated with the timing data from DNS logs to determine the minimum cost path to the destination on the basis of a weighted graph theory.
The CFRS performs a single swarming of the vertex set and then determines a route with the minimum cost for each swarm. It also regularly expands possible paths from the destination node by examining the possible paths of the starting node until the end condition is satisfied for reconstructing the overall attack paths. In addition, the CFRS assigns several subswarms of particles in sequence to each local area. It uses heuristic algorithms to acquire the global optimum. The advantage of using FBCFRS is that by clustering the routing traffic, the attack sources can be found within multiple local areas in advance. Moreover, the redundancy of the attack path reconstruction can be reduced.
Exploration and exploitation processes: The exploration and exploitation processes follow different strategies. When solving multimodal optimisation problems, exploration involves following a new route, whereas exploitation involves following an existing route. In the exploitation process, the focus is on determining the local optimal solution by using the local and global updates of the position and velocity vectors. Therefore, the fitness value of each path in each subswarm must be updated to evaluate whether the particles travel on attack paths towards the attack sources. In the exploration stage, the global optimum is found using the regrouping method.
On the basis of previous studies on the use of the LSO algorithm in IPTBK analysis, the operation and verification process of the proposed LS-PSO algorithm is divided into three subphases, as depicted in Figure 5.
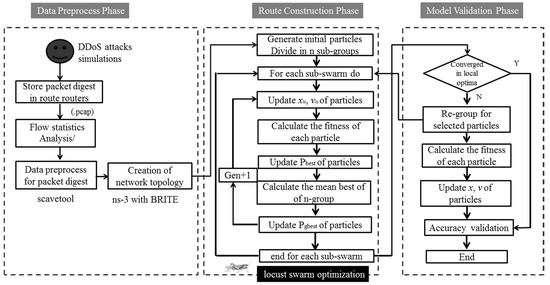
Figure 5.
Flowchart of the LSO algorithm for the analysis of the network DDoS source tracing.
(1) Data preprocessing phase: The tcpdump tool is used to filter and collect the network routing packets required for path exploration, and to mark these packets for subsequent analysis and reorganisation. Then, Unicast Reverse Path Forwarding is used to check each router that passes through it. The source IP of the packet header is used to determine the path of the transmission connection.
(2) Route reconstruction phase: In multimodal optimisation methods, the exploration and exploitation processes are generally performed in different stages [13]. In the solitary operation stage, each subswarm is used to explore possible solutions. In this stage, the proposed LS-PSO algorithm focuses on determining the local optimal solutions in the solution space and prevents particle swarms from rapidly converging on a single path. In the social operation stage, the global optimal position is determined through a regrouping strategy.
2.1 Solitary operation: To increase the search efficiency of the particle swarms, the proposed LS-PSO algorithm divides them into several subswarms when solving multimodal optimisation problems, where the local update rules of each subswarm must be determined. In the LS-PSO algorithm, attack paths are explored and reconstructed on the basis of the route packets collected from the victim to calculate the fitness of each path.
The first particle swarm generates R = 5000 particles, and each subswarm has 20 particles (S = 20). The initial speed set for the LS-PSO algorithm is the same as that set for the LSO algorithm [14].
where c1 and c2 represent acceleration constants ( and ), Range represents a unit value of particle position updating between the particle position and the centre of the subswarm, and rand() represents a random number in the range (0, 1). Suitable acceleration constants can control the particle speed. Route construction is performed using a velocity state updating rule for conducting position updates over 500 iterations (n = 500). The particle position for each iteration is updated using Equations (4) and (5).
To examine whether any particle exists in a particle swarm, the LSO algorithm explores the best position of the particle swarm (Pbest) by using the gravity vector G (G = (0.95, 0.05)) [14] in Equation (4). Thus, the gravity force attracts all single particles to search the solution space. In the LSO algorithm, a fixed speed ratio of 0.95 is used to update the distance without considering the effects of the network capability (i.e., the node distance () and QoS). Consequently, determining the best route between two edge nodes is difficult, and most particles travel on the frequently travelled paths. Therefore, the current study considered two important factors, namely and the QoS (Equation (5)).
In Equation (5), represents the movement of Δt, which is inversely proportional to the path distance between the two end nodes. The parameter represents the number of hops on the ith attack path in the kth subswarm.
For each iteration i, the new position of each particle is updated using Equation (6).
A high value enables the particles to cross the destination easily; however, a small value leads to slow convergence. The LS-PSO algorithm uses the gradient descent algorithm to search for the optimal acceleration factor.
To determine the acceleration factor wi (Equation (6)), this study used a greedy local search technique associated with the quasi-Newtonian gradient descent method (BFGS) to identify possible local optima with an intelligent reconnaissance strategy (Equation (7)). Theoretically, the BFGS algorithm can efficiently search for the optimal particle positions when the particle is alone (Pbest) and in a subswarm (Pgbest) in a convex space. Moreover, it can efficiently improve the solution quality of each particle. To determine Pbest and Pgbest for a subswarm, the BFGS algorithm can be used for dynamically adjusting the particle acceleration (weight: wi) to avoid overfitting by minimising the routing cost Ci (Equation (7)).
where η is the learning factor.
The recursive process with the aforementioned updating rule generates Pbest and Pgbest values for estimating the fitness value for each particle. The fitness value of each particle is calculated to examine whether the particle selects the best route. When a particle moves to a new position, the fitness value is calculated for this position. If the fitness value for the new position is higher than that for the previous best position (i.e., Pbest), the value of Pbest must be replaced by the fitness value for the new position, updated according to the particle’s optimal experience. Similarly, Pgbest must be replaced by Pbest if the fitness value of the new position is higher than Pgbest.
2.2 Social operation: To prevent the majority of subswarms from converging quickly to local optima, the LS-PSO algorithm uses the regrouping strategy to enable particles to escape from the original subswarms because of the mutual RF between particles. A fraction (e.g., 30%) of the particle subswarm is randomly selected to form a new subswarm. In the new subswarms, the starting points of the jumping particles are maintained around the best position Pgbest so as to improve the search results in the social operation process. The particle position is updated as follows:
where Range represents a unit value of particle position updating between the particle position and the centre of the subswarm. The random jump distance is set using the term for example, set spacing = 0.3 for small variation. The initial velocity is set using Equation (9) to accelerate the particles away from the previous local optima.
where is shown in Equation (3).
The original subswarm and new subswarm then restart the search process and continue searching until the cost function error is less than the pre-set value or the maximum number of iterations is reached.
(3) Model validation phase: After updating the velocities and positions of the particle swarms, the proposed LS-PSO algorithm must determine the best path for successfully tracing the sources of DDoS attacks. The model accuracy is evaluated using the coverage percentage (%), which is the ratio of the average number of packets on an attack path to the total number of routing packets. The coverage percentage is expressed as follows:
where the average number of packets on an attack path is computed as the total number of packets on the route divided by the routing distance (in terms of the hop count). If the converged solution is not the true attack node, then the average number of packets on the route is reset to 0 and the search for the true route is resumed. The complete process is summarised as follows (Algorithm 2).
Coverage percentage (%) = Average number of packets on an attack path/Total number of routing packets,
| Algorithm 2 Pseudocode of the LS-PSO Algorithm |
| Input: parameters of the LS-PSO model, including the initial values of max_gen, c1, c2, x, and v for the particles, and the network topology generated using Waxman theory |
| Generate R random points (x, y) in a swarm |
| Select a subset S with the best points from the original swarm |
| Assign an initial velocity to each point by using Equation (3) |
| While (the number of max_gen) do |
| For each particle i in the subswarm k, do |
| For each particle i, do |
| Update the velocity vki and position xki by using Equations (4)–(6) |
| Adjust the particle acceleration (weight: wi) by minimising the routing cost Ci by using Equation (7) |
| End for |
| Calculate the particle fitness value of xki |
| End for |
| If (generation ≥ R) the neighbouring subswarms are randomly regrouped |
| Generate R random points (x, y) around local optimal solutions |
| Select a subset S with the best points from the original swarm |
| Set the velocity for each point so that each individual point moves away from its original location |
| Optimise the best point by using Equations (8) and (9) |
| Update the individual best position Pbest and swarm best position Pgbest |
| gen = gen + 1 |
| End |
| Calculate the coverage percentage of each path by using Equation (10) |
| Output: optimal solution for possible paths |
4. Discussion
In this study, the ns-3 simulation tool was used to identify botnet C&Cs for countering DDoS attacks and to examine the success probability of DDoS attacks along different attack paths for tracing attack sources in a distributed network. The following situation was simulated: an attacker uses a fake IP address to conduct DDoS attacks and analyses the success probability of the attack source. The applicability of the proposed LS-PSO–IPTBK model was examined using two botnet examples.
For security concerns in academic networks, simulations were performed using the ns-3 software with the BRITE framework on a personal computer with a 2.7-GHz Intel Dual-Core computer processing unit equipped with 4 GB of DDR3 RAM running on Debian 10.9.0 Stable. The simulation of the network security is a cost-effective method for evaluating, testing, and selecting a suitable algorithm. In the simulations, defenders could examine all of the routing options for DDoS attacks and evaluate the basic performance of IPTBK algorithms.
4.1. Case Study I: Network Performance Analysis for DDoS Attacks (32 Nodes)
The first example considers the profiles of DDoS attacks on Internet of Things (IoT) devices on a cloud server. A network intrusion detection system was constructed using the following three processes: (1) data pre-processing, (2) attack path reconstruction, and (3) model validation. The workflow of security analysis is illustrated in Figure 4.
- Step 1: Data preprocessing
4.1.1. Creation of the Network Topology
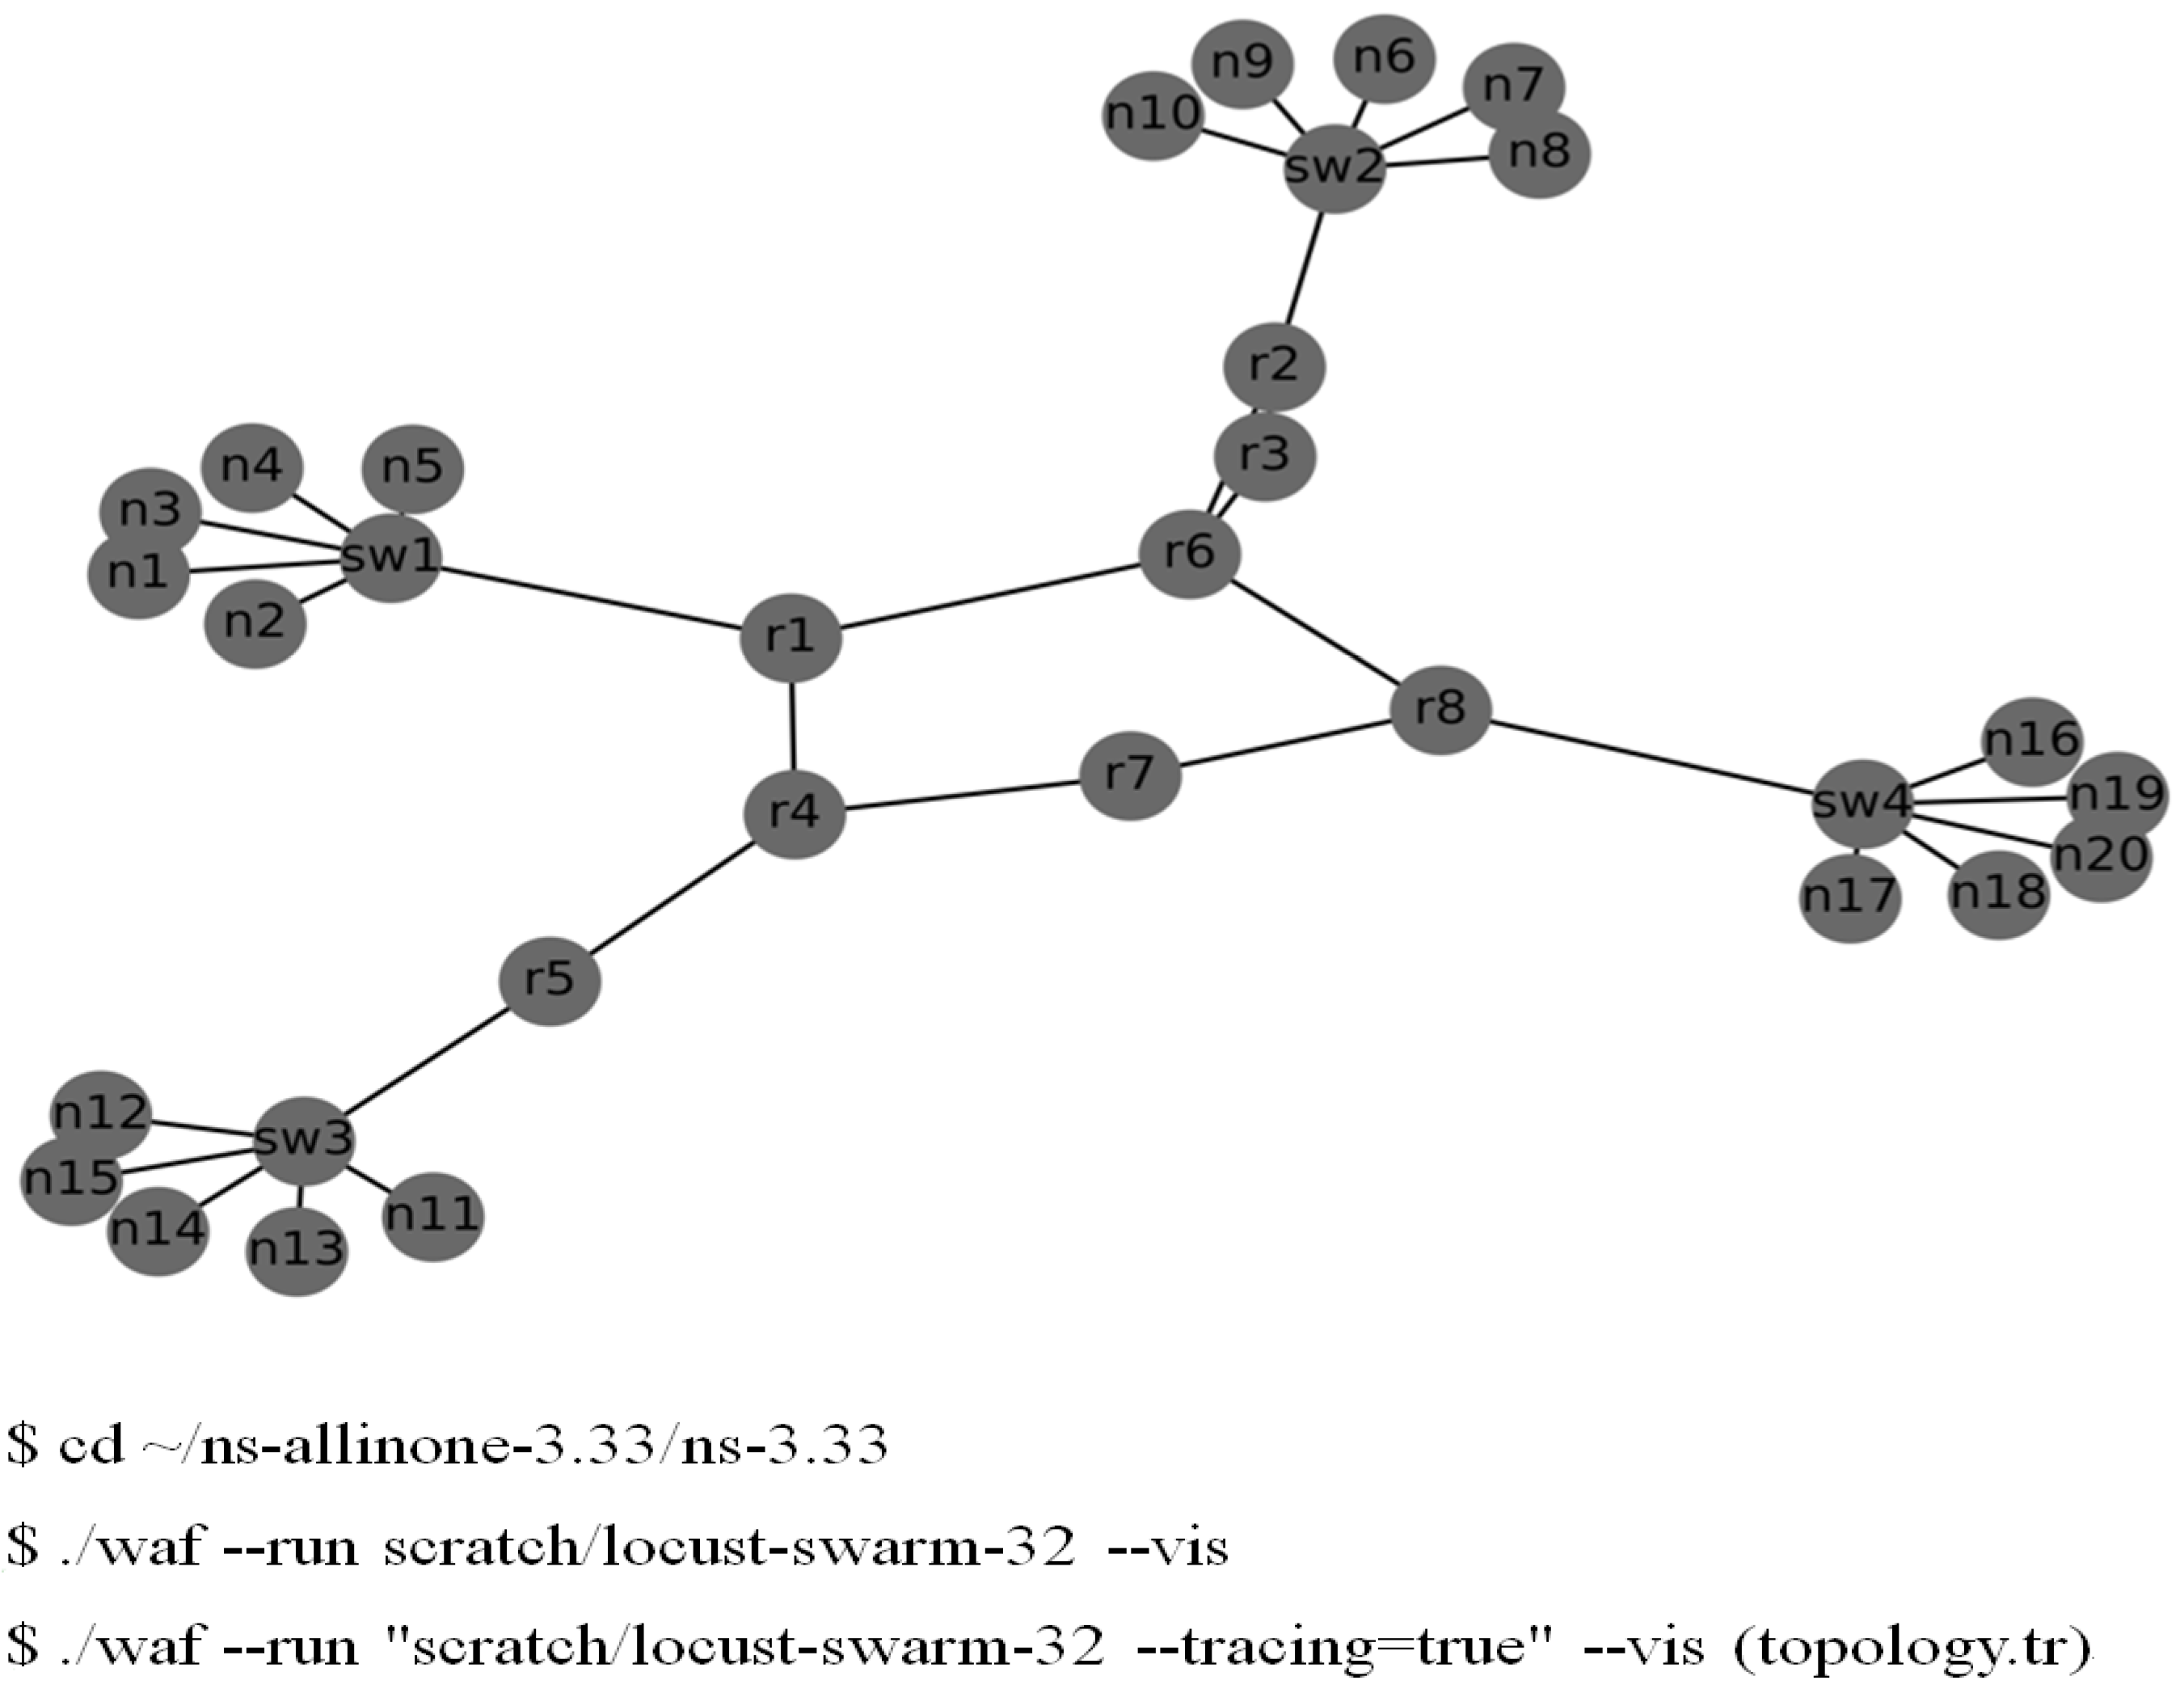
The ns-3 software was deployed with the BRITE framework to generate 32 nodes with integer position coordinates over a rectangular area of 300 × 300, as displayed in Figure 6. As depicted in Figure 6, the simulated network topology consisted of two local area networks (LANs). Simulated hosts and routers were configured using a BriteTopologyHelper class. Furthermore, each of the four LANs had six host nodes, one switch node, one router node, and the relay nodes of the Internet. The attack sites were compromised IoT devices (host 1–host 5 in LAN 1). The switch node was designated as Switch 1. The victim was an online game server (host 11) in LAN 2 (host 6–host 10). We used the Python package networkx to construct the network topology. Each pair of adjacent nodes was an edge that was assigned a weight or cost in all paths. The function attribute res_cost(x,y) was used to indicate the bandwidth and QoS of a path.

Figure 6.
Simulated network topology specified by the BRITE framework (number of nodes = 32).
The routing cost of each route in the network topology must be set to decide the next hop path by using the command res_cost = array ([x, y], weight = x). The lower the routing cost of a path, the higher the priority of a packet on it. A high-priority packet can traverse a low-cost path with a relatively small delay.
- Step 1.2: Data pre-processing for DDoS threats
Attack Paths Were Constructed Using the Following Two-Step Procedure
- Step 1.2.1: Attack on the victim
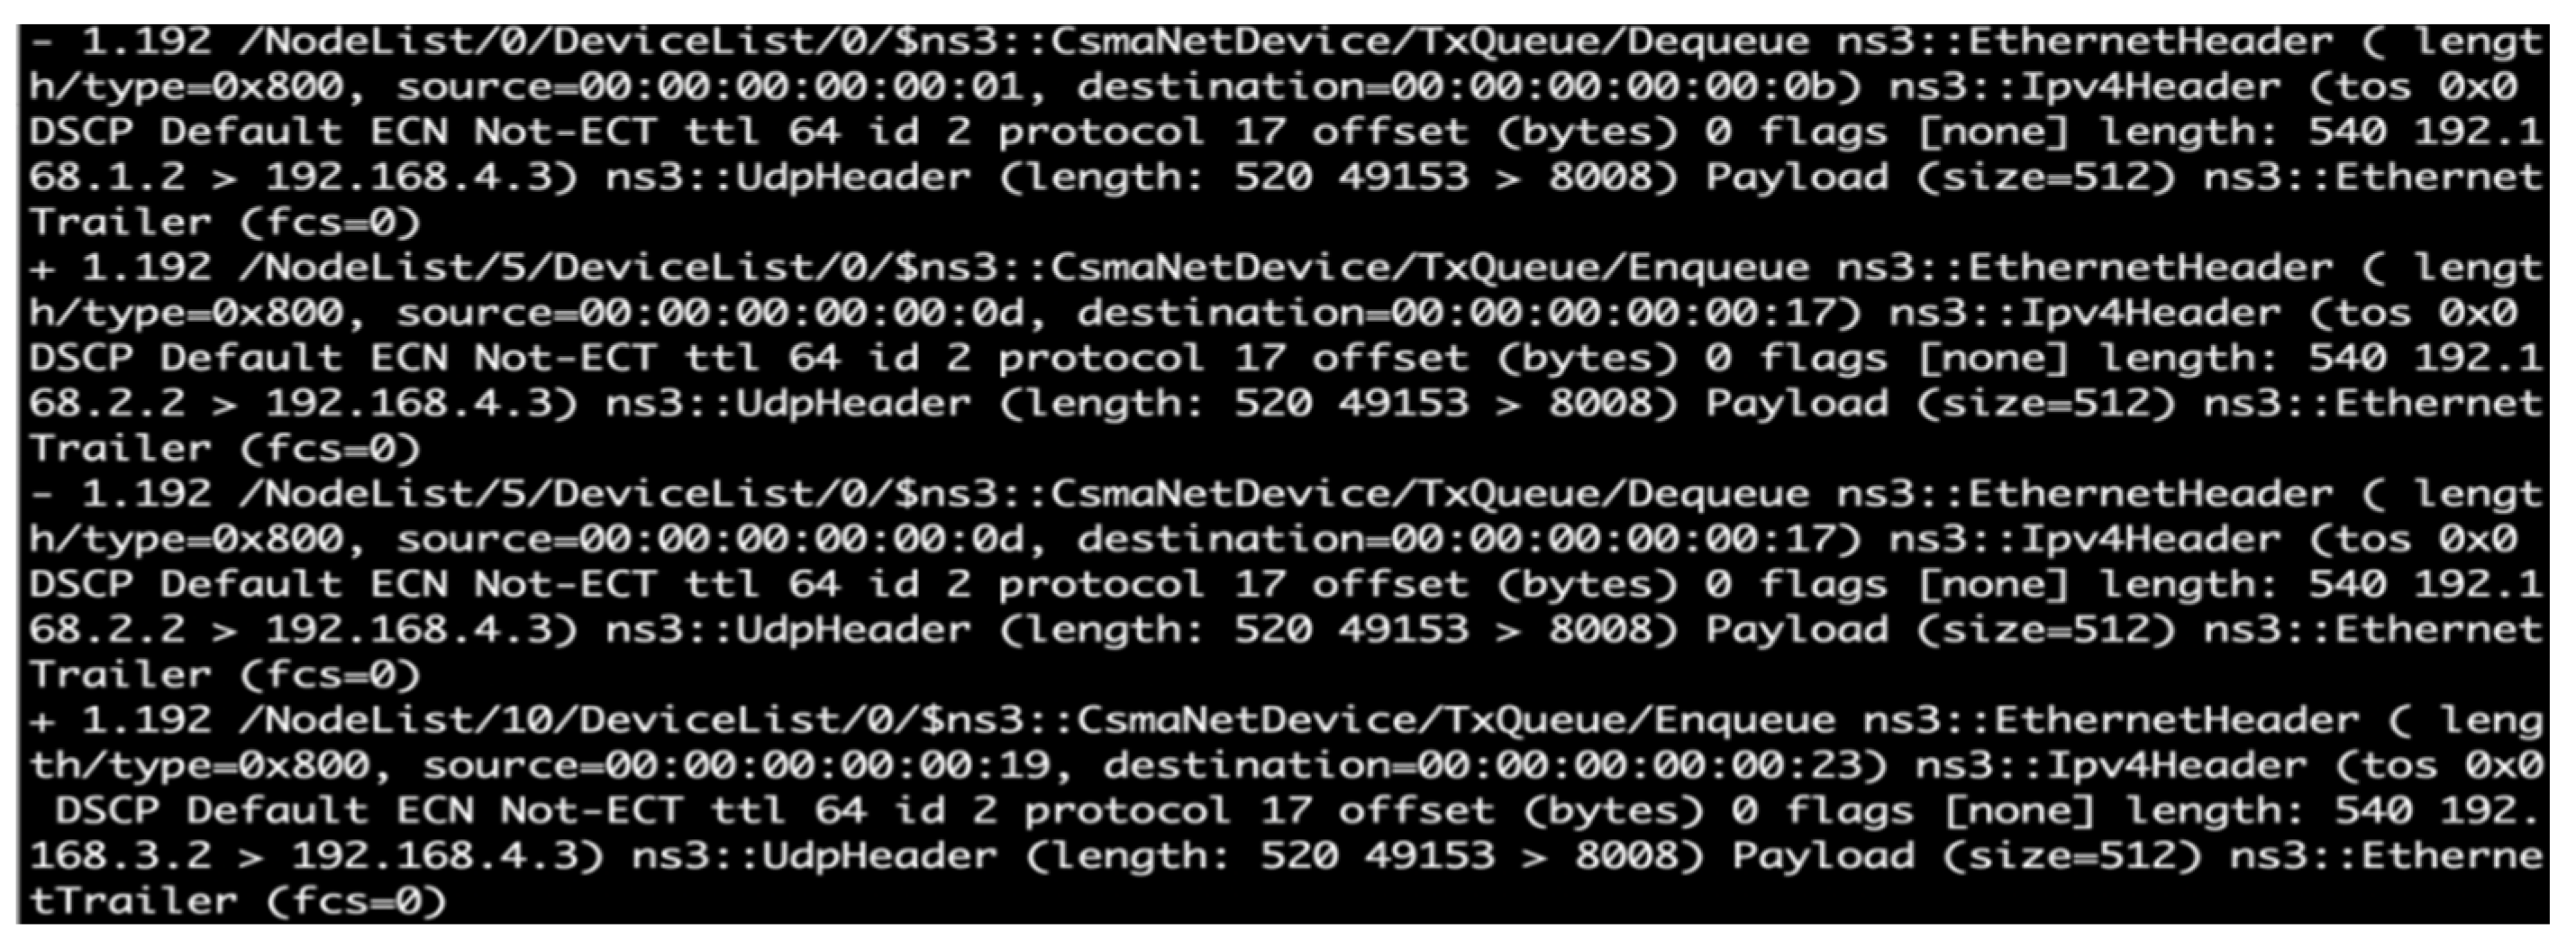
In this step, the attack nodes 1, 6, and 11 (IP addresses of 192.168.1.1, 192.168.1.2, and 192.168.1.3, respectively) launched a series of low-rate DDoS attacks by using UDP floods against the online game server (host 17) in LAN 4. The victim (IP address of 192.168.4.3) listened by default on port 8008. Three cycles of attacks were conducted in 60 s to generate routing information on the victim node for conducting IPTBK, as illustrated in Figure 7.
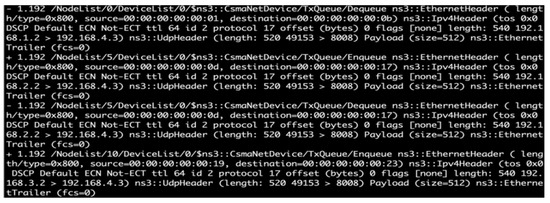
Figure 7.
Packet information in a series of low-rate DDoS attacks launched from nodes 1, 6, and 11.
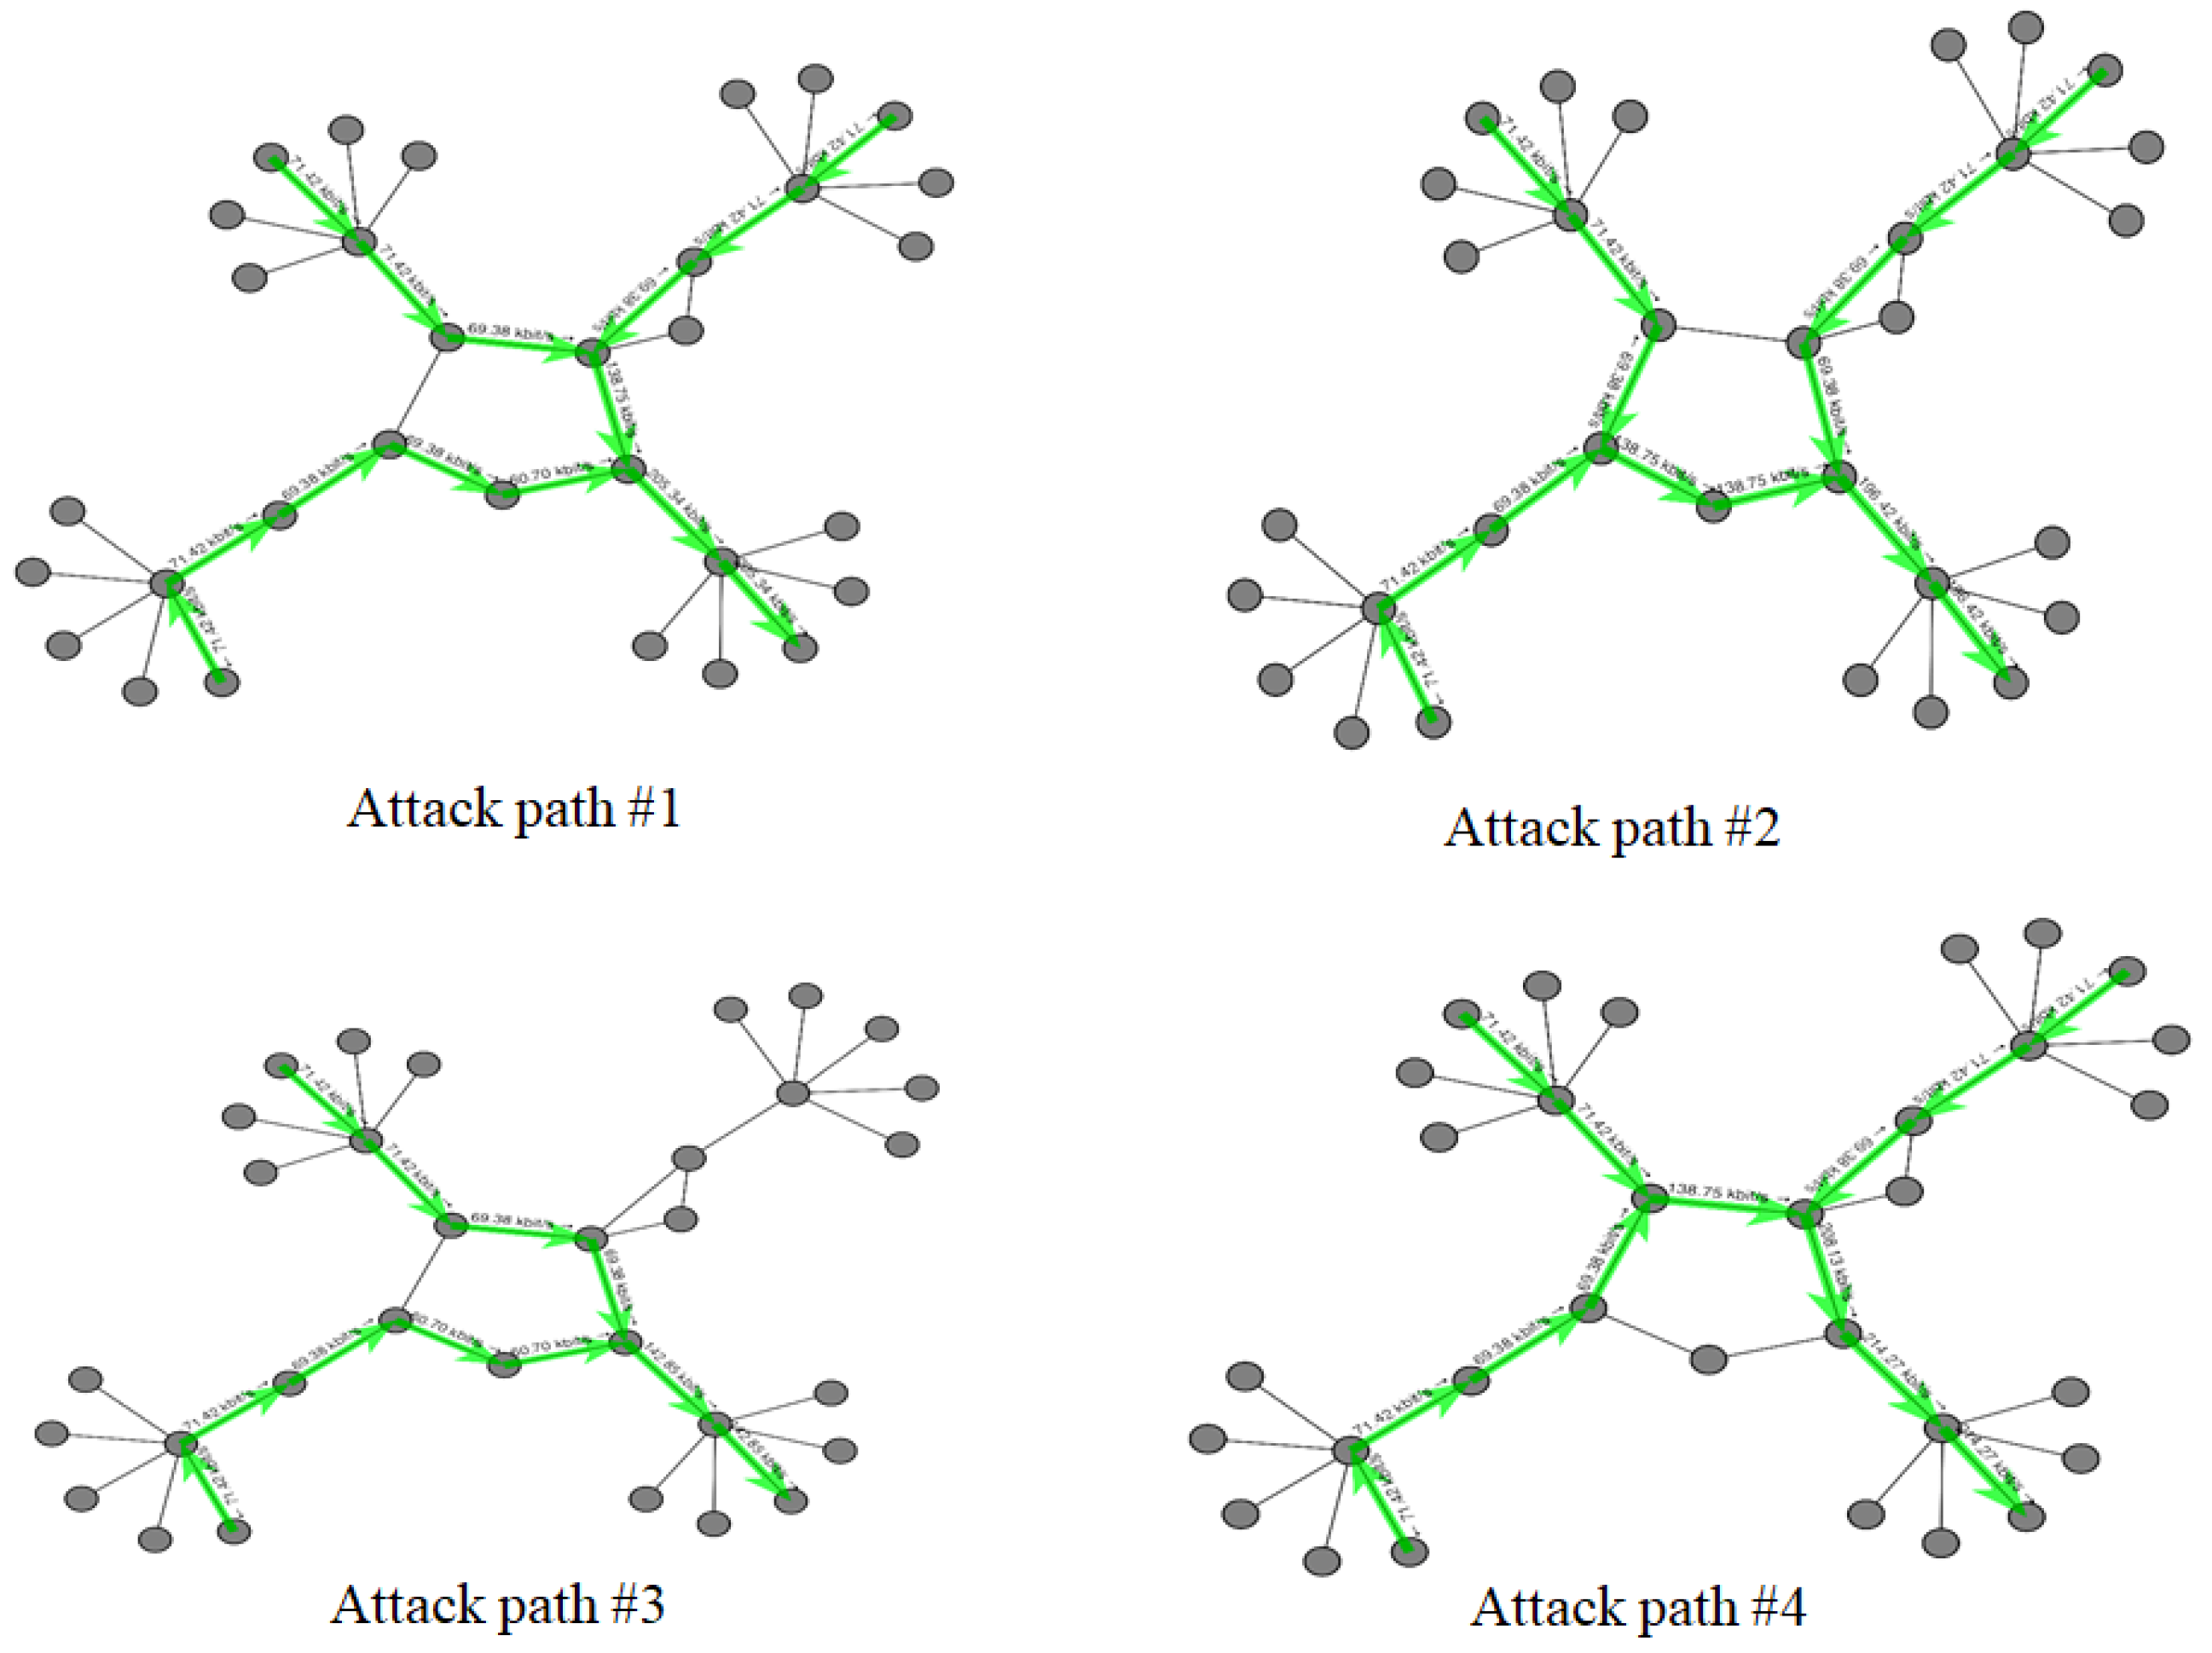
A total of 2685 attack packets (m = 2685) were sent to host 17 by using UDP floods. The average packet quantity of the visited node was the basis for updating the number of particles and assisting particle swarms to trace the sources of attacks by reconstructing the routes (Figure 8).
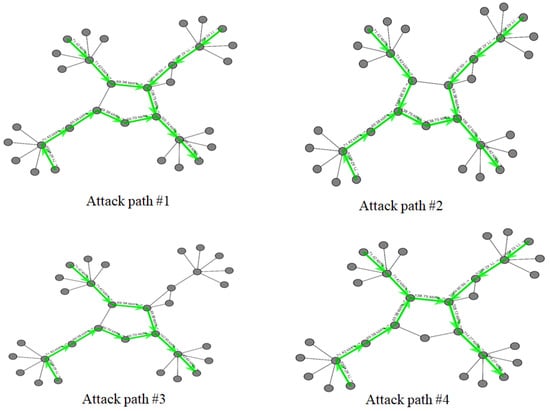
Figure 8.
Four attack paths for DDoS attacks from nodes 1, 6, and 11 (number of nodes = 32).
- Step 1.2.2: Data collection
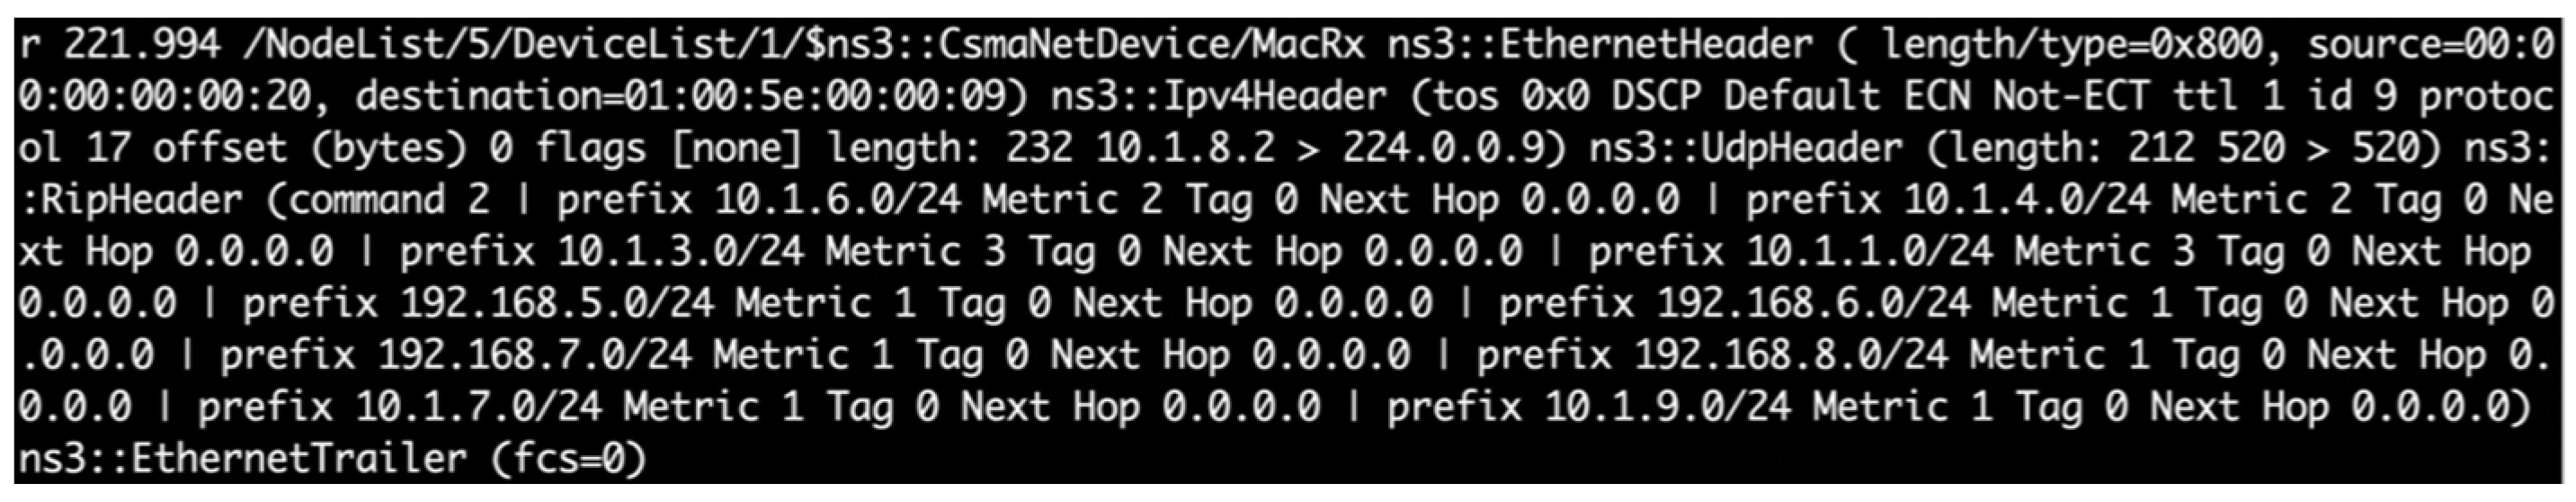
We used Wireshark to collect the samples of network traffic flows from port 8008 of the victim for periodically collecting the routing information of DDoS attacks from routers, as displayed in Figure 9 and Figure 10. The traffic flows were recorded in the Pcap format. After collecting the attack flow packets, scavetool was used to convert the recorded files to the comma-separated values format to the comma-separated values (CSV) format for the reconstruction of attack paths.
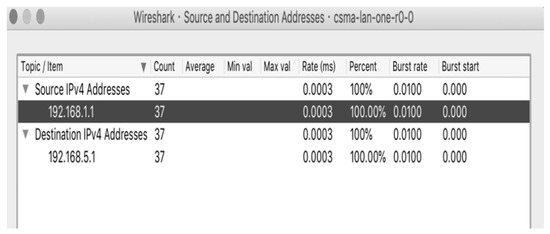
Figure 9.
Routing information collected from port 8008 using Wireshark.

Figure 10.
Routing information summarized from the victim.
In practice, the defender uses the traceroute command to periodically validate the routing information of DDoS attacks from routers and decide the route from a given source by collecting the sequence of hops the packet traversed, as shown in Figure 11.
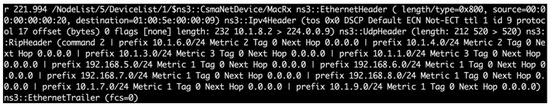
Figure 11.
Using traceroute to validate the routing information of DDoS attacks.
- Step 2: Route construction
The routing information generated in Step 1.2.2 was used as the input dataset of the PSO model. The main characteristics of the LS-PSO model were as follows: (1) the particle population was set equal to the number of packets collected related to DDoS attacks; (2) the number of generations was set to 500, and the route-searching rules were updated for each generation; (3) the initial value of wi (weighting factor) was 0.8; (4) c1 and c2 were set as 2.0 in Equation (4); and (5) the number of subswarms was 4. For the first particle swarm generated R was set to 5000 particles, and each subswarm had 20 particles (S = 20). Moreover, each particle was run for 500 iterations (n = 500).
4.1.2. Dynamic Routing Costs of All the Routes
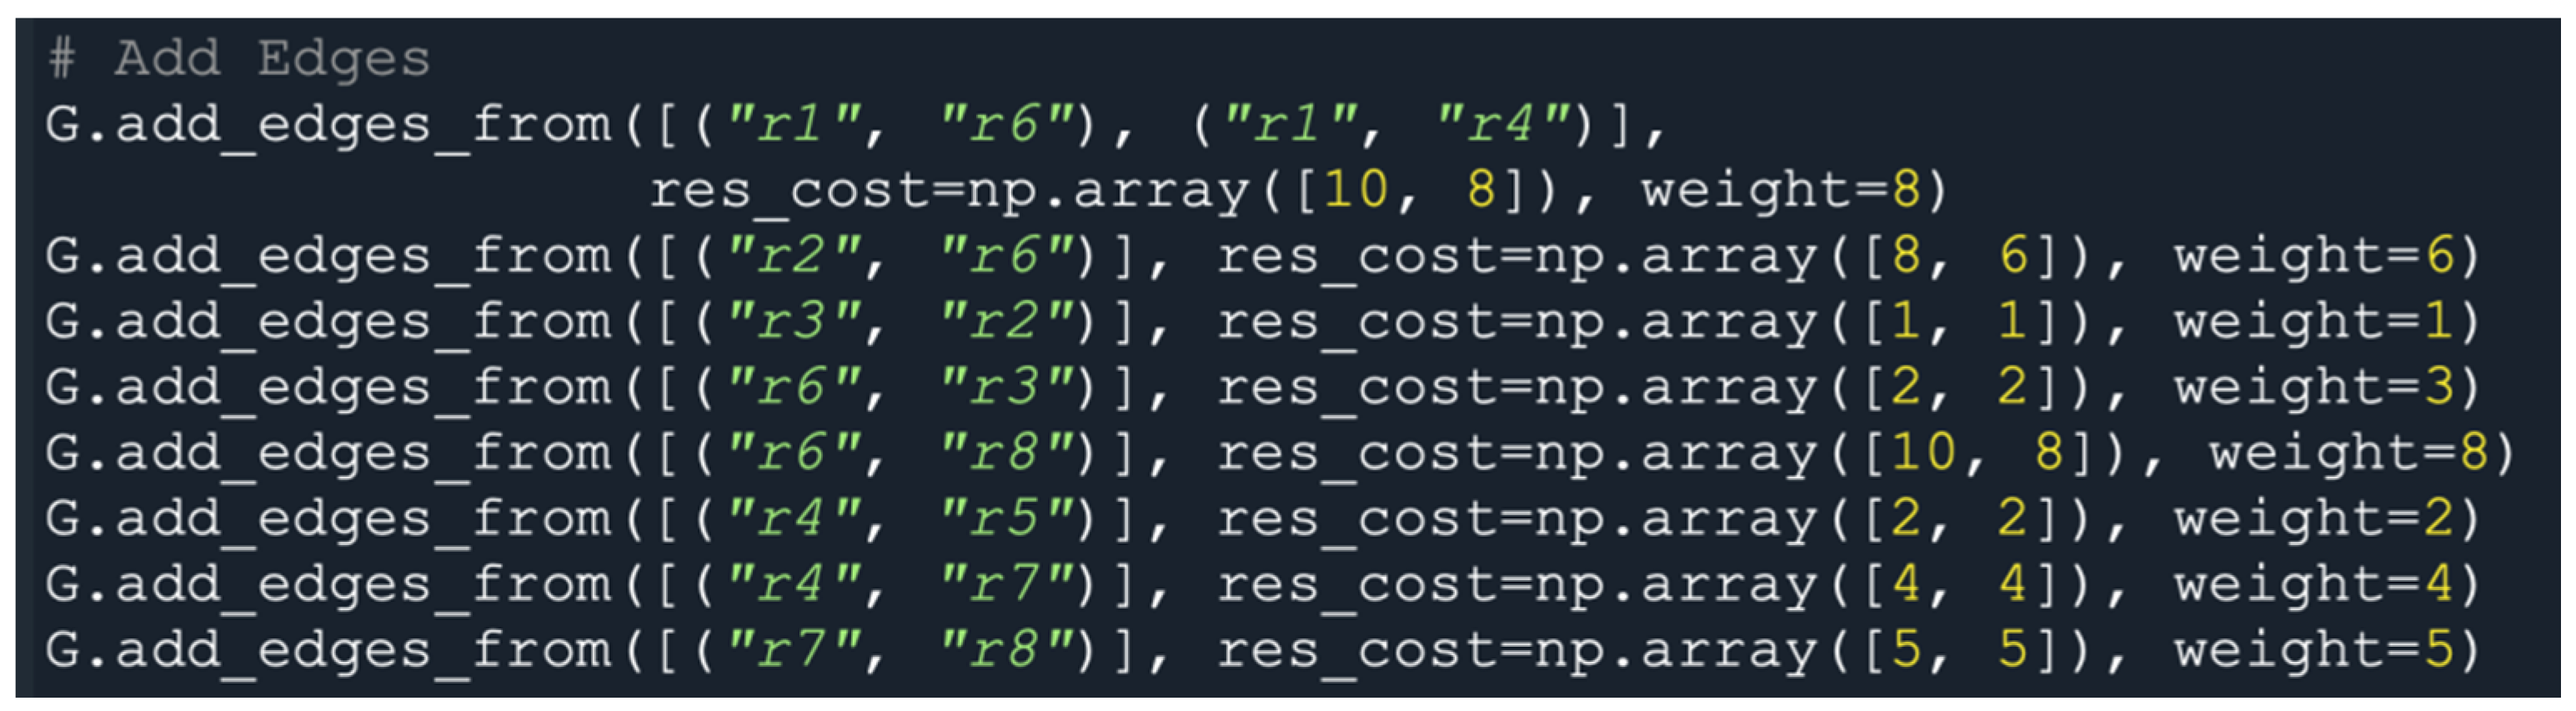
Considering the factors of traffic dynamics, including the bandwidth, traffic delay, and QoS requirements in the network transmission, we set different weights (i.e., cost) for each route in the network topology, and decided the next hop path by using the command res_cost = array ([x, y], w = x) for paths r1–r6–r8 and r1–r4–r7–r8. Figure 12 indicates that all paths had different routing costs and weights. The higher the routing cost, the lower the routing priority. The larger the weight (w), the larger the bandwidth. Moreover, the shorter the routing distance for a path, the higher the QoS.
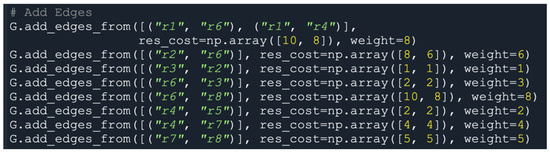
Figure 12.
Dynamic routing cost settings for paths r1–r6–r8 and r1–r4–r7–r8..
As presented in Table 2, the simulated system comprised eight simple routes between n1, n6, and n11 (the attack nodes) and n17 (the victim). This information was obtained using the all_simple_paths application programming interface call in the networkx suite of ns-3.
Table 2.
Set of simple routes between the attack nodes and the victim (n11).
To verify the optimal path of DDoS attacks, the shortest route between the attack nodes and the victim was determined using A* algorithm [16]. The A* algorithm is an improved version of Dijkstra’s algorithm. The A* algorithm can be used to identify the shortest path between any two end nodes in a search space. We compared the performance of the A* and LS-PSO algorithms for solving the IPTBK problem. First, we used the A* algorithm in the networkx suite to examine the situation in which n1, n6, and n11 attacked n17. By using this algorithm, the following paths in Table 3 were identified as having the lowest costs.
Table 3.
Set of the shortest routes between the attack nodes and the victim (n11).
We used the LS-PSO algorithm to analyse the possible attack path for the attack case n1 → n17. By reconstructing the attack path for this case, we applied the subgroup searching strategy to obtain the optimal solution. Particles travelled around all the paths and back to the attack origins according to the local and global updating rules presented in Equations (5)–(10). After 500 generations had been executed, the results revealed two possible attack paths for conducting model performance analysis.
- Route 1: [‘n1′, ‘sw1′, ‘r1′, ‘r6′, ‘r8′, ‘sw4′, ‘n17′]
- Route 2: [‘n1′, ‘sw1′, ‘r1′, ‘r4′, ‘r7′, ‘r8′, ‘sw4′, ‘n17′]
Similarly, the following paths were obtained for the attack cases n6 → n17 and n11 → n17.
- Route 3: [‘n6′, ‘sw2′, ‘r2′, ‘r6′, ‘r8′, ‘sw4′, ‘n17′]
- Route 4: [‘n11′, ‘sw3′, ‘r5′, ‘r4′, ‘r7′, ‘r8′, ‘sw4′, ‘n17′]
- Route 5: [‘n11′, ‘sw3′, ‘r5′, ‘r4′, ‘r1′, ‘r6′, ‘r8′, ‘sw4′, ‘n17′]
- Step 3: Model validation phase
After 500 generations had been executed, the coverage rate of the attack path in the experimental case was calculated using Equation (10) (Table 4). The first three paths presented in Table 4 were selected as the possible attack paths for the experimental case, in which the minimum support threshold was t = 3%. As presented in Table 4, the LS-PSO–IPTBK model exhibited an accuracy of 99.07% (m = 2685) for static traffic; thus, the error rate was 0.93% for the network topology (number of nodes = 32).
Table 4.
Possible paths of DDoS attacks (number of nodes = 32).
4.2. Case study II: Network Performance Analysis for DDoS Attacks (64 Nodes)
In the second experiment, a series of DDoS attacks were conducted in a simulated network topology (number of nodes = 64) using ns-3 with BRITE to evaluate the convergence performance of the proposed model. As shown in Figure 13, the simulated network topology consists of eight local area networks (LANs). In the following, the attack nodes, including n1, n11, n21, n31, and n36, launched a series of low-rate DDoS attacks using UDP floods against the node17 (port 8008) in LAN4. Six cycles of attacks were conducted in 60 s and a total of 4526 attack packets (m = 4526) were sent to host 17 using UDP floods, as illustrated in Figure 14.
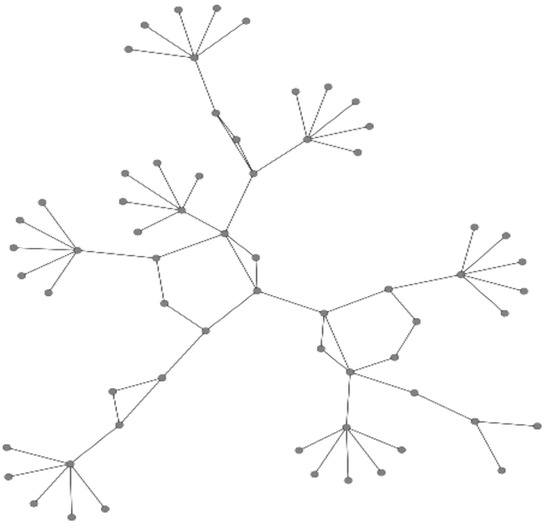
Figure 13.
Simulated network topology specified by the BRITE framework (number of nodes = 64).
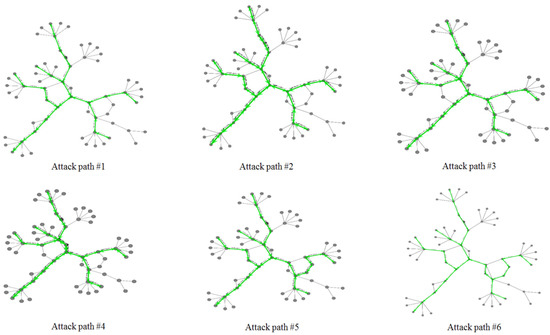
Figure 14.
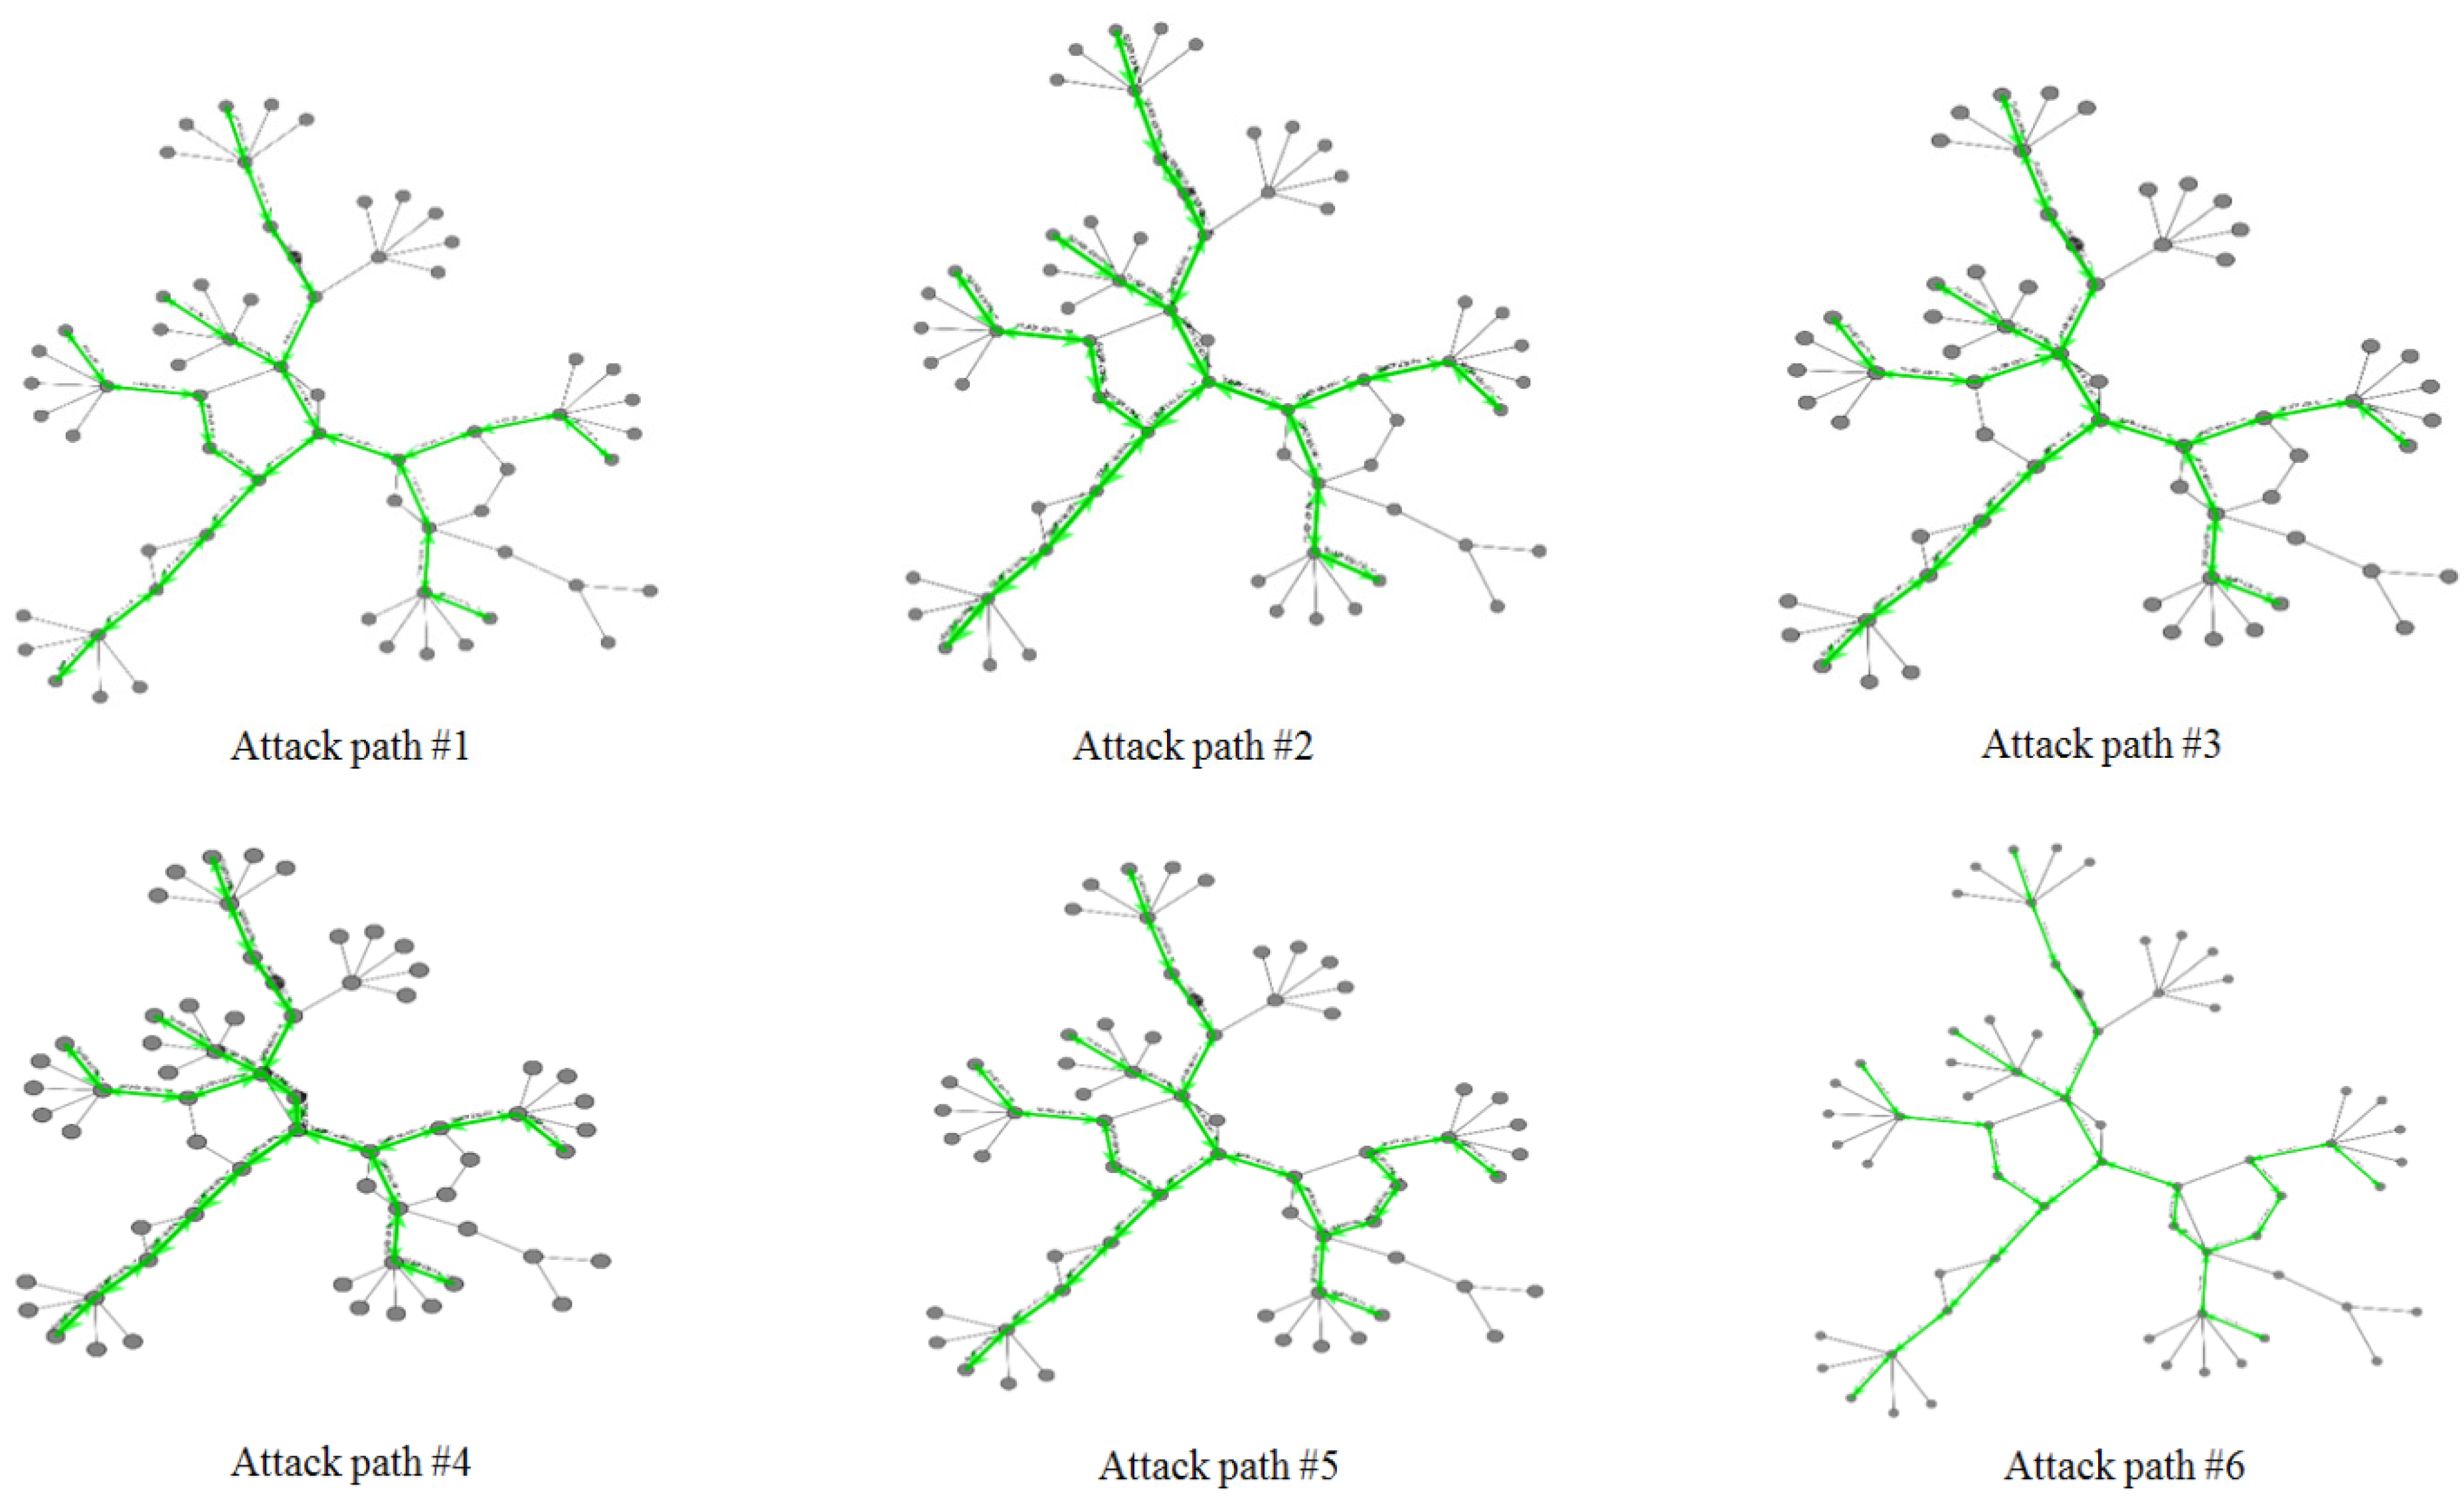
Six attack paths for Distributed Denial-Of-Service (DDoS) attacks from nodes 1, 11, 21, 31, and 36.
Similar to the first experiment, we used the LS-PSO algorithm to analyse the possible attack path for the test case (n1 → n17), (n11 → n17), (n21 → n17), (n31 → n17), and (n36 → n17). The coverage rate of the attack path in the experimental case was calculated using Equation (10), and the experiment results for the five cases are listed in Table 5.
Table 5.
Possible paths of DDoS attacks (number of nodes = 64).
Table 5 indicates the LS-PSO accuracy considering that the static traffic was 95.05% (m = 4526) and that the error rate was 4.95% for the network topology (number of nodes = 32).
The effect of the network size on the number of packets required to construct the attack path was also investigated. Table 6 shows the accuracy and execution time for a test set of routing algorithms with different topology sizes. The experimental results indicate that the execution time of PSO algorithm is higher than that of the LS-PSO algorithm due to the global optimal position that is exploited using the regrouping strategy in the LS-PSO algorithm. Furthermore, the experimental results indicate that the traceback error decreased as the size of the testing data increased.
Table 6.
Traceback accuracy vs. execution time of DDoS attacks using the proposed algorithm with A* and PSO algorithm.
Obviously, the accuracy of the proposed algorithm is higher than those of the A* and the PSO algorithm. Two experimental results demonstrated that the traceback error increased with an increase in the size of the network topology (ns) for the LS-PSO algorithm. The overall accuracy rate for the two test cases was 97.06%.
4.3. Case Study III: Network Performance Analysis for DDoS Attacks with Different Subswarms (64 Nodes)
In practice, the LS-PSO algorithm needs to determine the best number of subswarms. The effect of the search strategy with different numbers of subswarm particles (ns = 2, 4, and 8) on the number of packets required to construct the attack path in a medium-scale network topology was also investigated. For similar test runs, a series of DDoS attacks was conducted on two simulated network topologies (number of nodes = 32 and 64) to evaluate the convergence performance of the proposed model (Figure 10 and Figure 12). In the experiment, the attacker flooded the victim with packets originating from the attack nodes.
A total of 4526 attack packets were sent in irregular bursts within 120 s to congest the link. Table 7 presents the coverage percentage achieved with the proposed model in the experiment. The results presented in Table 7 indicate that the accuracy of the LS-PSO algorithm was 97.96% when the number of swarms was 2 (R = 5000, S = 20, and 500 generations); thus, the corresponding error rate was 2.04%. Moreover, the accuracy of the aforementioned algorithm was 98.29% and 97.60% when using four and eight swarms, respectively. The experimental results indicated that the LS-PSO scheme achieved a higher accuracy for medium-scale networks when using four-swarm than when using two-swarm or eight-swarm.
Table 7.
Experimental results obtained with different numbers of subswarms.
5. Conclusions
This paper presents an LS-PSO algorithm for solving the IPTBK problem. The proposed algorithm can analyse the effects of multiple-swarm search strategies on the quality of PSO solutions to improve the reconstruction accuracy for the probable paths of DDoS attacks. The experimental results confirmed that the proposed algorithm can analyse the possible attack paths of botnets and the attack sources of DDoS threats by IP traceback techniques with the LS-PSO algorithm.
Although the proposed algorithm can solve the IPTBK problem, its use entails practical challenges. For example, in the case of a DDoS attack, the proposed algorithm generates unusually high rates of packet loss across a network, which may disorder the sequence of packet marking and thus may reduce the traceback accuracy of the algorithm. To implement rapid countermeasures against cyber-attacks involving DDoS flooding in high-speed networks, such as 5G networks, partial packets with high rates of packet loss must be collected. A future study will examine the minimum number of packets required to determine the origins of attacks.
Author Contributions
Conceptualization, P.W.; methodology H.-C.L. and K.-M.C.; resources, P.W.; formal analysis, H.-C.L.; data curation, H.-C.L.; writing—original draft, H.-C.L. and W.-H.L.; writing—review and editing, P.W. and K.-M.C.; software, H.-C.L. and Z.-Y.Y.; validation, H.-C.L. and W.-H.L.; visualization, H.-C.L. and Z.-Y.Y.; project administration, P.W.; funding acquisition, P.W. All authors have read and agreed to the published version of the manuscript.
Funding
This research was funded by the Ministry of Science and Technology of Taiwan under grant no. MOST 108-3116-F-168-001-CC2, no. MOST 109-2410–H-168-005 and the green energy technology research center on the featured areas research center program within the framework of the higher education sprout project from Ministry of Education (MOE) of Taiwan.
Institutional Review Board Statement
Not applicable.
Informed Consent Statement
Not applicable.
Data Availability Statement
The data presented in this study are available upon request from the corresponding author.
Conflicts of Interest
The authors declare no conflict of interest.
Nomenclature
| Problem formulation: | |
| Symbol list. | |
| c1 and c2 | acceleration constants |
| route cost of path | |
| dij | travel routing distance (hop count) |
| E | a set of edges eij |
| eij | edge from node xi to node xj |
| G | gravity vector |
| Lp | cost function |
| N | a set of network nodes |
| ns | a set of nodes for attack sources |
| nd | a set of victim |
| of a path from node i to node j for particle n | |
| rand() | a random number in the range (0, 1) |
| quality of service | |
| the velocity of particle i in k subswarm | |
| initial speed of a particle | |
| the position of particle i in k subswarm | |
| the movement of Δt for particle i in k subswarm | |
| the movement of Δt for a particle in k subswarm (CFRS strategy) | |
References
- Nguyen, A. Taiwan’s Central Bank to Offer Banknote Exchange ahead of Lunar New Year. Taiwan News, 30 January 2018. [Google Scholar]
- FS-ISAC. More than 100 Financial Services Firms Hit with DDoS Extortion Attacks. Taiwan News, 10 February 2021. [Google Scholar]
- Catak, F. Two-layer malicious network flow detection system with sparse linear model based feature selection. J. Natl. Sci. Found. Sri Lanka 2018, 46, 601–612. [Google Scholar] [CrossRef]
- Shi, Y.; Eberhart, R. A Modified Particle Swarm Optimizer. In Proceedings of the IEEE International Conference on Evolutionary Computation, Anchorage, AK, USA, 4–9 May 1998; pp. 69–73. [Google Scholar]
- Angeline, P.J. Evolutionary Optimization versus Particle Swarm Optimization: Philosophy and Performance Difference. In Proceedings of the 7th Annual Conference on Evolutionary Programming, International Conference on Evolutionary Computation, San Diego, CA, USA, 25–27 March 1998; pp. 69–73. [Google Scholar]
- Lin, H.C.; Wang, P.; Lin, W.H. Implementation of an PSO-based security defense mechanism for tracing the sources of DDoS attacks. Computers 2019, 8, 88. [Google Scholar] [CrossRef] [Green Version]
- Eberhart, R.C.; Shi, Y. Comparing Inertia Weights and Constriction Factors in Particle Swarm Optimization. In Proceedings of the Congress on Evolutionary Computation, La Jolla, CA, USA, 16–19 July 2000; pp. 84–88. [Google Scholar]
- Multi-Swarm Optimization. Available online: https://en.wikipedia.org/wiki/Multi-swarm_optimization (accessed on 25 February 2021).
- Hendtlass, T. WoSP: A Multi-Optima Particle Swarm Algorithm. In Proceedings of the IEEE 2005 Congress on Evolutionary Computation, Edinburgh, UK, 2–5 September 2005; pp. 727–734. [Google Scholar]
- Zhang, Q.W.; Zhan, F.F. Particle swarm optimization algorithm based on multi-subgroup harmony search. J. Comput. 2020, 31, 116–126. [Google Scholar]
- Zhao, S.Z.; Liang, J.J.; Suganthan, P.N.; Tasgetiren, M.F. Dynamic Multi-Swarm Particle Swarm Optimizer with Local Search for Large Scale Global Optimization. In Proceedings of the IEEE 2008 Congress on Evolutionary Computation, Hong Kong, China, 1–6 June 2008; pp. 3845–3852. [Google Scholar]
- Xua, X.; Tang, Y.; Li, J.; Hua, C.; Guan, X. Dynamic multi-swarm particle swarm optimizer with cooperative learning strategy. Appl. Soft Comput. 2015, 29, 169–183. [Google Scholar] [CrossRef]
- Chen, S.; Montgomery, J. Selection Strategies for Initial Positions and Initial Velocities in Multi-Optima Particle Swarms. In Proceedings of the 13th Annual Conference on Genetic and Evolutionary Computation, Dublin, Ireland, 12–16 July 2011; pp. 53–60. [Google Scholar]
- Chen, S. Locust Swarms-A New Multi-Optima Search Technique. In Proceedings of the 2009 IEEE Congress on Evolutionary Computation, Trondheim, Norway, 18–21 May 2009; pp. 1745–1752. [Google Scholar]
- Cuevas, E.; González, A.; Fausto, F.; Zaldívar, D.; Pérez-Cisneros, M. Multithreshold segmentation by using an algorithm based on the behavior of locust swarms. Math. Probl. Eng. 2015, 2015, 805357. [Google Scholar] [CrossRef] [Green Version]
- A* Search Algorithm. Available online: https://en.wikipedia.org/wiki/A*_search_algorithm/ (accessed on 17 January 2020).


Publisher’s Note: MDPI stays neutral with regard to jurisdictional claims in published maps and institutional affiliations. |
© 2021 by the authors. Licensee MDPI, Basel, Switzerland. This article is an open access article distributed under the terms and conditions of the Creative Commons Attribution (CC BY) license (https://creativecommons.org/licenses/by/4.0/).