1. Introduction
With the advent of the big data era, many people are receiving services from it. For example, you can be provided with decision-making strategies for social and economic development, or you can automatically find the information you want on the web [
1,
2]. In addition, many new convenient services are emerging, such as product recommendations during shopping, human movement analysis, and health checks using data [
3,
4].
These days, natural language data such as social networks and news articles are pouring out; natural language processing have received tremendous attention [
5]. Measuring the similarity between natural language sentences is important even within natural language processing [
6]. Sentence similarity is a numerical measure of how symmetrical the meaning of two sentences is regardless of word order, sentence length, or symmetry in context. For example, many approaches such as a chatbot system, plagiarism checking system, and automatic classification system all depend on sentence similarity. Accurately measuring the similarity between two sentences is a crucial task
Research measuring sentence similarity has been conducted from various perspectives [
6,
7,
8,
9,
10,
11,
12]. Including deep learning approaches and sentence structure approaches there are many ways to measure sentence similarity [
10,
11,
12,
13,
14].
In a study on sentence similarity measurement using deep learning, Ref. [
10] proposed a method by extracting features containing the entire information of a sentence via long short-term memory (LSTM). The authors of Ref. [
13] proposed a method to measure sentence similarity using a combination of global features—the entire information of sentences extracted via bidirectional LSTM (Bi-LSTM)— and local features—the detailed information of sentences extracted through capsule networks.
In the natural language processing field, it is necessary to focus not only on the model using deep learning, but also on the structure of the sentence and the lexical relationship of the sentence. The author of Ref. [
8] proposed a method measuring the similarity between two sentences based on the relationship between vocabulary within sentences, using WordNet composed from a knowledge base using vocabulary. In contrast, Ref. [
9] proposed a method of decomposing and reorganizing vocabulary.
In this paper, our research aims to improve the performance of methods for measuring the similarity between the Korean language sentences by combining a deep learning methodology and a methodology that considers lexical relationships. We use several deep learning methodologies, such as convolutional neural networks (CNN), recurrent neural networks (RNN), and bidirectional encoder representations from transformers (BERT), to measure sentence similarity. Additionally, we apply cosine the similarity to embedding vectors obtained from the language representation model. Finally, we calculate the final sentence similarity by combining the sentence similarity value calculated by the deep learning model and the value obtained from the cosine similarity. Experiments show that our proposed method performed better compared to those with only a deep learning model.
This paper is structured as follows:
Section 2 mentions related work.
Section 3 explains the proposed approach and data.
Section 4 shows the result about our method.
Section 5 discusses our research. Finally,
Section 6 mentions the conclusion.
2. Related Work
Many approaches have been proposed to address the problem of measuring the similarity between sentences [
15]. Research measuring the similarity between two sentences has been conducted for a long time from various perspectives. There are many approaches to calculate the similarity between two sentences, such as using sentence structure, considering a lexical relationship, and using deep learning.
The method of measuring the similarity between two sentences using the structure of sentences is a widely used method from the early days of natural language processing to the present era of deep learning. Since many researchers have studied it for a long time, many ideas have been proposed to measure the similarity between two sentences using sentence structure. The authors of Ref. [
16] proposed a similarity measure method of two sentences based on sentence structure grammar. The authors of Ref. [
17] proposed a similarity measure method of two sentences based on a part of speech tags. The authors of Ref. [
6] proposed a similarity measurement method of two sentences based on the word order and sentence structure. The authors of Ref. [
7] measured the similarity of two sentences by identifying statistics on sentence structure.
A method of measuring the similarity between two sentences considering lexical relationships is also one of the sentence similarity measures. The author of Ref. [
8] proposed a method for measuring the similarity between two sentences using WordNet composed from a lexical-based knowledge base. The authors of Ref. [
9] were presented with a method to calculate the similarity between two sentences using an approach that uses the word to calculate the similarity using repetitive and different parts of a sentence. The authors of Ref. [
18] proposed a method to measure sentence similarity using word detection ambiguity and synonym extension.
Deep learning has recently developed significantly since hardware development and the opening of the big data era [
19]. Sentence similarity studies using deep learning have shown good performance using various neural networks such as LSTM, gated recurrent units (GRU), CNN, and BERT [
10,
13,
14,
20,
21].
The authors of Ref. [
6] used LSTM, which has a good performance for sequential data processing. They evaluated the sentence similarity by applying the last hidden states extracted via LSTM to Manhattan distance. The authors of Ref. [
20] combined CNN and LSTM. They extracted combined information from adjacent words through CNN and applied the last hidden states extracted via LSTM to Manhattan distances to assess the sentence similarity. The authors of Ref. [
21] used Group CNN (G-CNN), which extracted representative local features, and bidirectional GRU (Bi-GRU), which has good performance in sequential data processing and applied the last hidden states extracted via Bi-GRU to Manhattan distances. The authors of Ref. [
13] sequentially used Bi-LSTM, self-attention reflecting contextual information, capsule networks with a CNN structure. They, then, combined the last hidden states extracted via Bi-LSTM and local features extracted via capsule networks. The authors of Ref. [
14] evaluated the similarity of two sentences using BERT, a language representation model that shows excellent performance in various natural language processing fields.
Unlike previous approaches, we proposed a novel method that combines deep learning and the method considering lexical relationships to measure the similarity between two sentences.
3. Methods and Data
Measuring accurately the similarity of sentence-to-sentence is an important task [
6]. To measure similarity between sentences, we combined deep learning methodology and a method that considers lexical relationships. A description of the equations mentioned in
Section 3 is given in
Appendix A.
We used Python version 3.6.9 and TensorFlow version 2.4.1 from Seoul, Korea The computer specifications used in the experiment were 2 GeForce RTX 3090 and 32 Intel (R) Xeon (R) Silver 4215 CPUs @ 2.50 GHz.
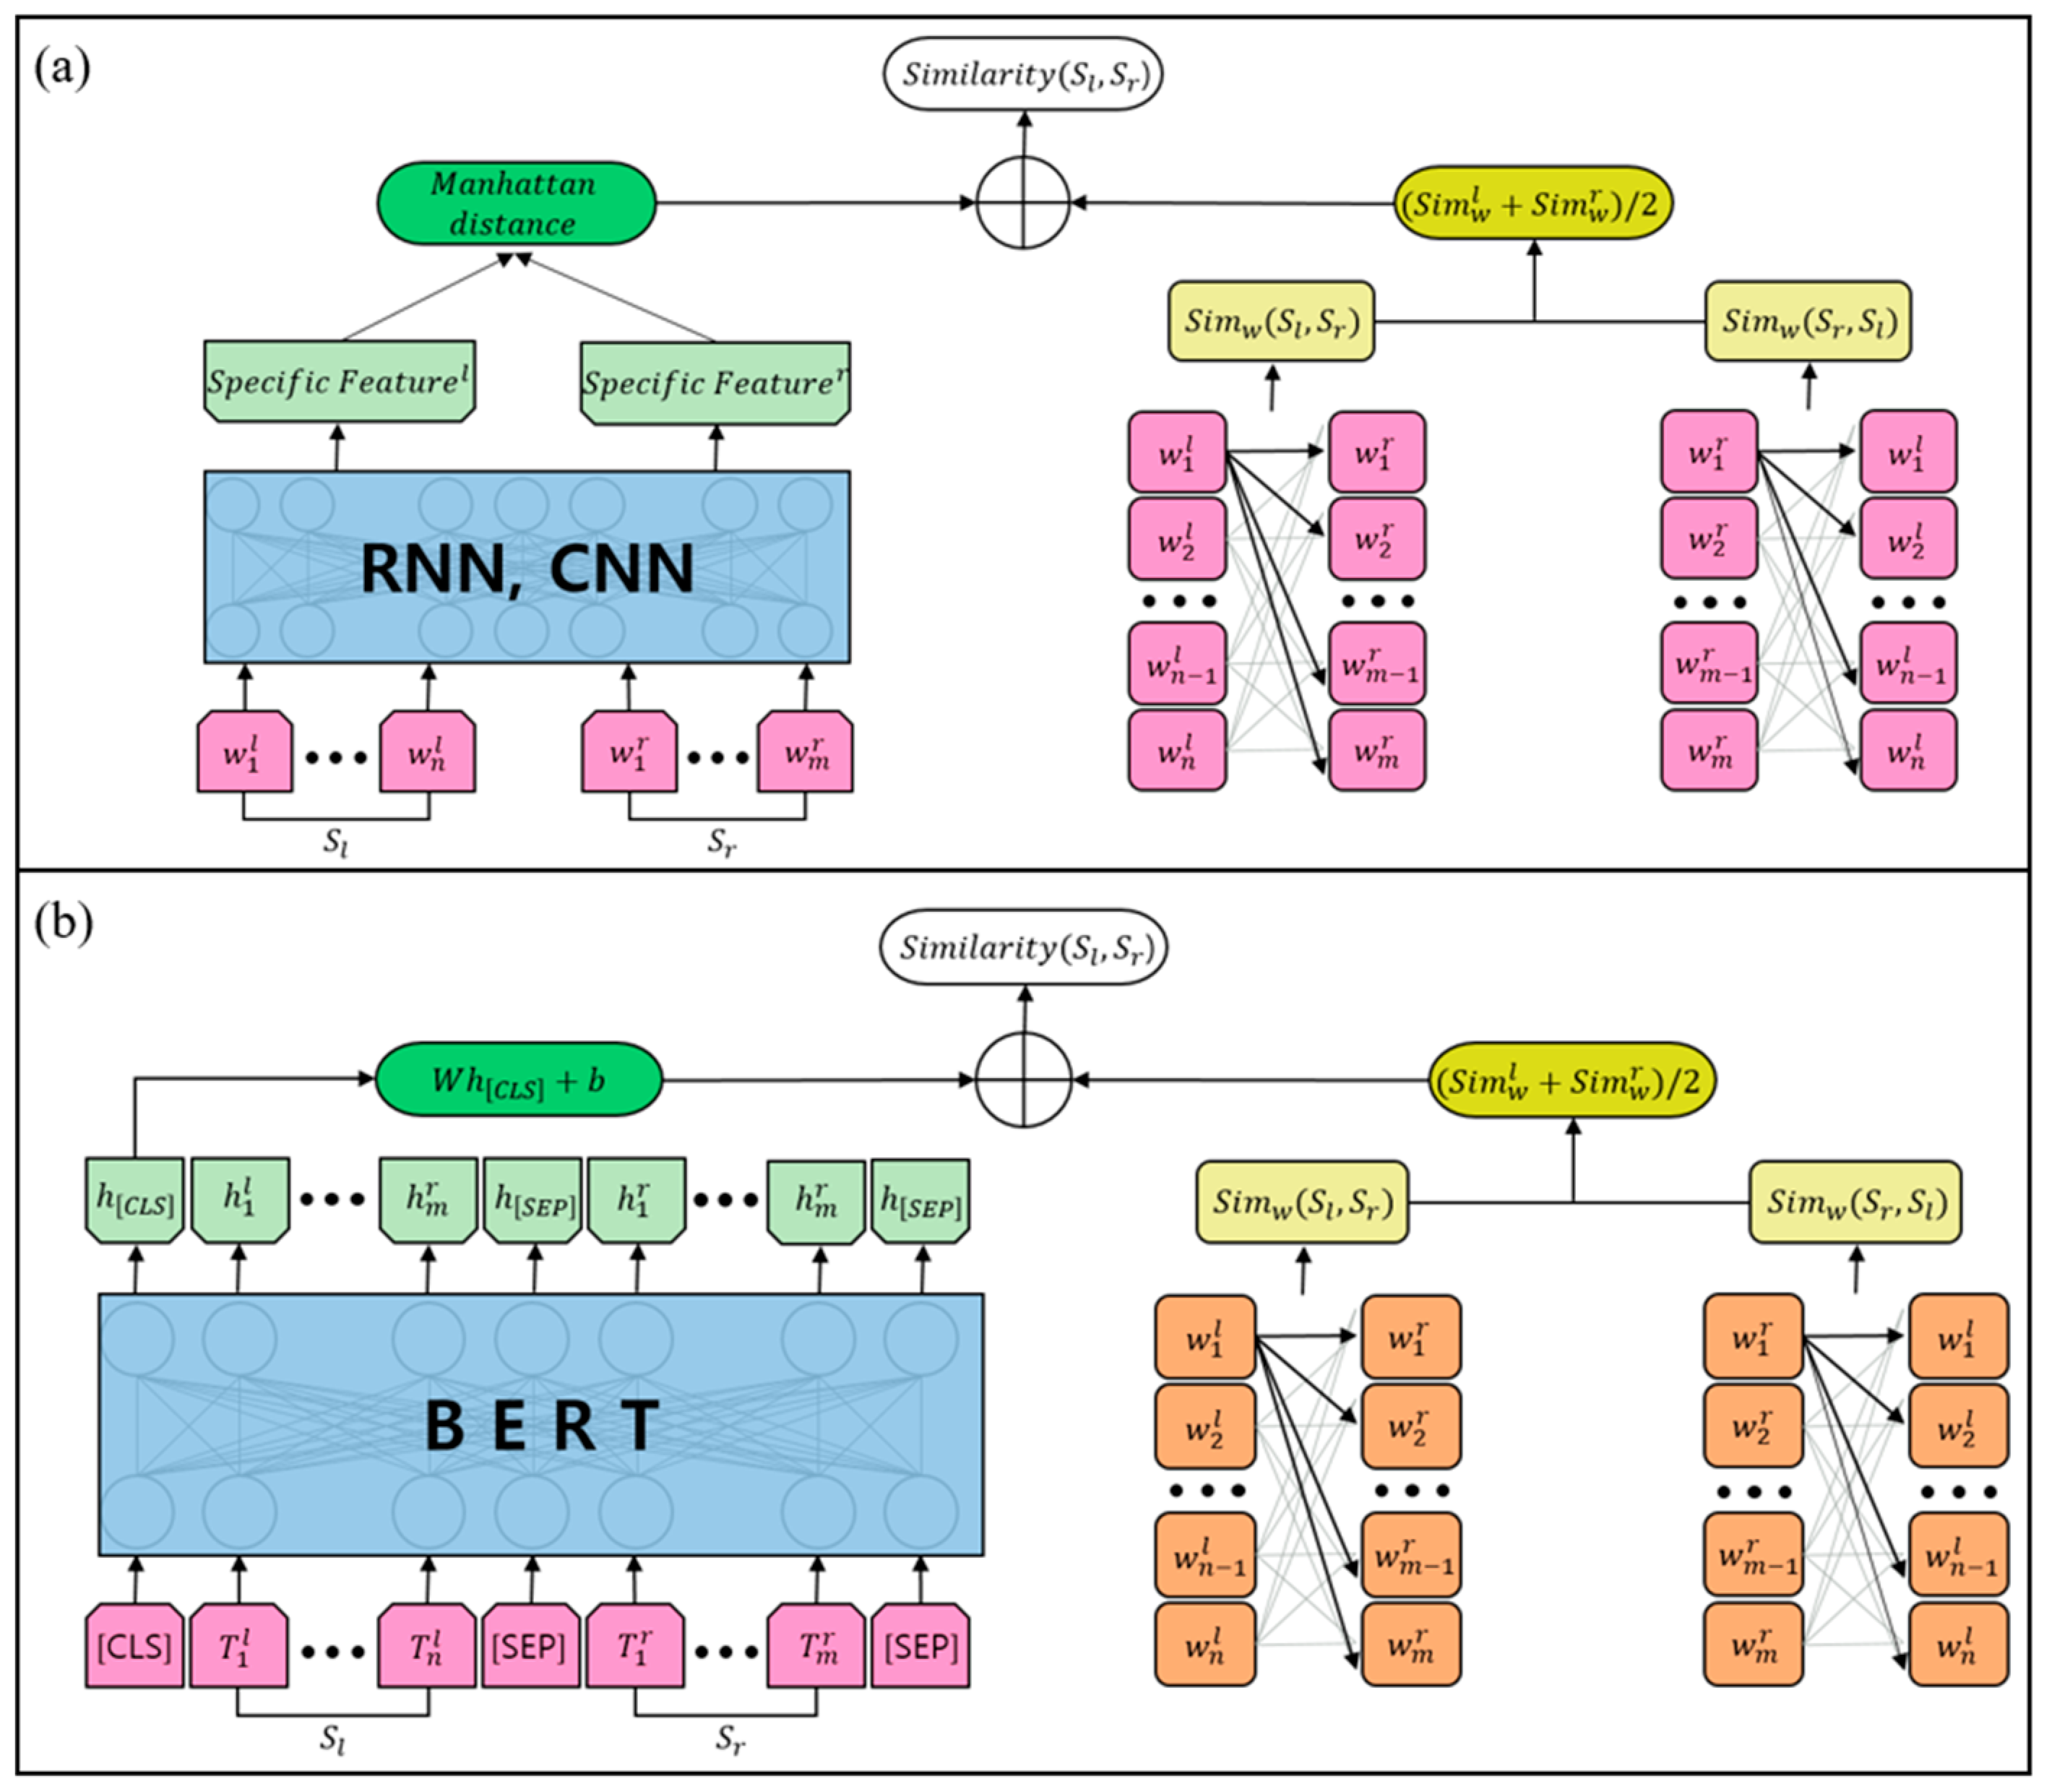
3.1. Similarity Based on Deep Learning Model
The models used in this study were LSTM and GRU, CNN, G-CNN, capsule networks, and BERT. LSTM and GRU are a family of RNN, and G-CNN and capsule networks are neural networks using CNN. CNN and G-CNN were used as input values to the RNNs model. The sentence similarity using RNNs or capsule networks was calculated by applying the Manhattan distance, such as
Figure 1a. Additionally, the sentence similarity using BERT was calculated through a special token, such as
Figure 1b.
3.1.1. Sentence Similarity Using Word Embedding
The RNN is a neural network that shows good performance when processing sequential data [
22]. When calculating the representation of each time step in text processing, it was determined through learning how much context information up to that point was reflected. However, in the case of RNN, if the sequence length was increased, gradient vanishing or gradient exploding problems could occur [
23]. To solve this, LSTM and GRU were devised [
23,
24]. When calculating the similarity of two sentences, each sentence was input into the family model of RNNs to obtain the last hidden states (
) of each sentence [
10,
13,
20,
21]. The
included the entire sentence information. Manhattan distance used in the family model of RNNs is as follows:
The
CNN showed good performance in image and text processing [
13]. In text processing,
CNN extracted local features, which were combined information, by grouping words appearing in sentences by kernel size (
), and increasing the amount of learning by using the number of filters (
). The equation of
CNN is as follows:
In Equation (2), refers to word index, refers to the activation function. In addition, refers to a learning weight of a CNN having a size of , refers to a word embedding vector having a size of , and refers to a bias vector. Through Equation (2), the feature map, which had a size of , was generated according to , which refers to the number of words. Finally, the feature maps the size of were generated by the number of filters.
The
G-
CNN used three CNNs with different kernel sizes in parallel and obtained representative semantic information [
21].
G-CNN integrated feature maps extracted from three CNNs into a feature of one and then created the most representative feature map by applying max pooling. The equation of
G-CNN is as follows:
The capsule networks used two
and
which were used to extract subdivided information in the field of sentence similarity [
13].
had a typical
CNN form, and
received a feature map of
as the input value. After that, to extract subdivided information, a kernel size corresponding to the overall size of the input value was used, and then a feature map the size of
was generated by dividing the feature map into
C-dimensions. The feature map
reshaped as many as
C was defined as
and, finally, Manhattan distance used in the capsule networks is as follows:
3.1.2. Sentence Similarity Using BERT Embedding
BERT is a language representation model created by stacking several transformer encoder blocks [
14]. The learning process of BERT is divided into a pre-training process and a fine-tuning process. In the pre-training process, after randomly masking word tokens in a sentence of a large corpus, the BERT model learned by predicting the masked word token. Fine-tuning is a process of learning a pre-trained BERT model with labeled data once more. We trained BERT on the similarity task between sentences in the fine-tuning process.
BERT is divided into BERT-base and BERT-large models according to the size of the model and, in this work, we used the BERT-base model. BERT-base model consists of 12 layers of transformer encoder blocks. There are several special tokens in the BERT model. The [CLS] token was placed at the beginning as a token indicating the beginning of the input. The [SEP] token was a token that distinguished between sentences. In the case of the sentence similarity task, the input was entered into the BERT model in the form of “[CLS] Sentence1 [SEP] Sentence2 [SEP]”. The similarity between sentences was calculated by inputting the output vector of the (CLS) token extracted via the BERT model into the dense layer, as shown in Equation (5).
The is the vector representation of the (CLS) token extracted through the BERT model and has a matrix of . refers to weights that can be learned, with a matrix of , and refers to bias vector.
3.2. Similarity Based on Lexical Relationship
To measure structure similarity, the proposed approach calculated the word-to-word similarity between sentences. Using a language representation model in measuring similarity between words, improved similarity measuring between sentences [
25].
In the word embedding model, to consider the lexical relationship, including semantic information, we used the embedding vector of words (
). Word embedding used in this study used Word2Vec, which learns by minimizing the dot product values of the target word vector and neighbor word vectors surrounding the target word vector [
26,
27].
In BERT, to consider the lexical relationship, including contextual information, we used the hidden states of the 12 transformer blocks, which were BERT-base model components. To calculate the word-to-word similarity, we excluded hidden states of the (CLS) token and (SEP) token. The embedding token of the word (
was calculated using the following equation:
In Equation (6), refers to the index of the word, refers to the number of transformer blocks.
The word-based similarity was calculated using the following equation:
In Equation (7),
and
refer to sentence 1 and sentence 2, respectively.
is the number of words in
and
(
) is the similarity of word
in
and
. To calculate the similarity, we first added all the words-to-sentences. In this process, we could obtain the sentence-to-sentence likeness of
and
. However, the likeness became higher in proportion to the length of
, and this could cause a problem when the length of
is too long. Thus, we divided the likeness into
, the length of sentence
. In this way, we could normalize the likeness and have similar values regardless of length. The similarity between word
and
was measured by selecting the max similarity between
and every word in
according to the following Equation (8).
In Equation (8), is the similarity between word and word . refers to the th word that appears in another sentence . The similarity between words was measured using cosine similarity between word vectors. When measuring similarity between the target word and the sentence , a comparison of several important words in a sentence was sufficiently meaningful. Thus, the maximum value of the cosine similarities was defined as the similarity between the target word and the sentence .
Our method went through the process of calculating the similarity of words belonging to
based on words belonging to
, as in the above formula, when comparing two sentences
and
, and vice versa. In other words, we calculated the word in
based on the word in
and then calculated the arithmetic mean of the method, such as Equation (9), from two methods.
3.3. Novel Hybrid Sentence Similarity
In this study, we combined deep learning methodology and a method that considers lexical relationships using the equation below:
In Equation (10), α is a weight that can adjust which information to focus on among deep learning methodology and a method that considers lexical relationships and is determined experimentally. Through Equation (10), the value of sentence similarity had a range of 0–1.
3.4. Data
BERT used in this study was the Bert-Kor-Base [
28], which trains Korean texts. Additionally, Word2Vec is trained using the Korean raw corpus [
29] applied Kkma [
30], a Korean morpheme analyzer. Some studies have shown that splitting words into morphemes in Korean tends to perform well [
31]. Word vector extracted through Word2Vec had an embedding size of
, the same as BERT embedding size.
In this study, KorSTS [
32], consisting of 8628 sentence pairs, was used as the experiment data. Training sets, development sets, and test sets consisted of 5749, 1500, and 1379 sentence pairs. The similarity score range of two sentences was composed from 0 to 5 points, as shown in
Table 4.
In this study, the similarity score was normalized from 0 to 1 using the minimum–maximum scaling.
4. Result and Analysis
We compare the results of the model using only deep learning and the models using our method. We used the Pearson correlation coefficient and the Spearman correlation coefficient as the evaluation metrics.
The performance shown in
Table 5 was the average value of the results of the five experiments each. As shown in
Table 5, we can see that the Pearson and Spearman correlation coefficients were both higher in consideration of both deep learning and lexical relationships than those using only deep learning.
5. Discussion
Our method resulted in a significant performance improvement, though the minor calculation cost increased compared to those using only deep learning. The proposed method had better performance than a single method using deep learning because it hybridizes methods that consider the semantic relationship between words. Since we used the pre-trained embedding model to calculate the relationships between words, we could distinguish different words with the same meaning. For example, ‘car’–‘car’ or ‘cookie’–‘biscuit’ had a high score of similarity. According to the experiment, the similarity calculation between sentences was improved by using the similarity information between words within a sentence. For example, consider the following sentences:
- S1
= ‘미나는 저녁으로 치킨을 먹기 위해 자동차를 타고 식당에 갑니다.’
- S1
= ‘Mina gets into the car and goes to a restaurant to eat chicken for dinner.’
- S1
= ‘미나는 저녁식사를 치킨으로 해결하려고 승용차를 타고 식당에 갑니다.’
- S1
= ‘Mina gets in her automobile and goes to a diner to make supper with chicken.’
These sentences have a similar meaning but are expressed in different words. Our model improved the similarity between the measured sentences by considering the semantic relationship between words in which the two sentences above are identical.
Given that we achieved performance improvements in all five models, we showed that our method generally increased the ability of the model to understand the semantic similarity of sentences. Especially on [
18] model, our approach resulted in about a 65% performance improvement. Therefore, using our methods together gave a more accurate performance than using one deep learning method.
6. Conclusions
This study measured the similarity between the Korean language sentences by combining a deep learning methodology and a method that considers lexical relationships. In a deep learning methodology, we used five neural networks related to CNN, RNN, and BERT. Additionally, in a method that considers lexical relationships, we used a cosine similarity in embedding vectors extracted through the word representation model. Finally, we calculated the final sentence similarity by combining the output values of the two methods. As a result, our method combining two methods showed good performance compared to using only a deep learning model.
The method considering lexical relationships used in this study is one of several linguistic methods for measuring sentence similarity. As it can be seen from the experimental results, it could achieve good performance by combining the deep learning method and the linguistic method. Therefore, in future studies, we will further improve the performance of similarity between sentences by using various linguistic methods such as information on the order of words and parts of speech.
Author Contributions
Conceptualization, Y.Y.; methodology, T.-S.H. and Y.P.; validation, Y.Y.; formal analysis, T.-S.H., Y.P., and K.K.; writing—original draft preparation, Y.Y., T.-S.H., and Y.P.; writing—review and editing, K.K.; visualization, Y.Y.; supervision, K.K. All authors have read and agreed to the published version of the manuscript.
Funding
This work was supported by the ICT R&D by the Institute for Information & communications Technology Promotion(IITP) grant funded by the Korea government(MSIT) (project number: 2020-0-00113; project name: development of data augmentation technology by using heterogeneous information and data fusions) and the Industrial Technology Innovation Program funded by the ministry of Trade, Industry and Energy(MOTIE, Korea) (project number: 20008625; project name: development of deep tagging and 2D virtual try on for fashion online channels to provide mixed reality visualized service based on fashion attributes).
Institutional Review Board Statement
Not applicable.
Informed Consent Statement
Not applicable.
Data Availability Statement
Conflicts of Interest
The authors declare no conflict of interest.
Appendix A
This part is an explanation of the mathematical notation shown in Equations (1)–(10).
Equation (1).
Equation (2).
—Activation function.
—Learning weight of a CNN.
—Word embedding vector corresponding to the -th word index.
—Kernel size corresponding to hyperparameter of a CNN.
—Bias vector of a CNN.
Equation (3).
Equation (4).
—Hyperparameter that determines how much to subdivide the overall meaning.
exp—Exponential function.
—Absolute value.
—Result of reshaping the result of as many as .
—Feature map that is the result of using CNN twice.
Equation (5).
—Sigmoid function.
—Learning weight of the dense layer.
—Vector of the (CLS) token extracted through the BERT model.
—Bias vector of the dense layer.
Equation (6).
—The number of transformer blocks.
—Vector corresponding to -th transformer block and -th word index.
Equation (7).
Equation (8).
—Word that appears in sentence 1.
—Sentence 2.
—Cosine similarity values between and .
—Word that appears in sentence 2. refers to an index from 0 to sentence length.
Equation (9).
Equation (10).
—Weight to adjust what information to focus on.
—Similarity value through deep learning model.
—Similarity value through a method that considers lexical relationships.
References
- Wang, J.; Yang, Y.; Wang, T.; Sherratt, R.S.; Zhang, J. Big data service architecture: A survey. J. Internet Technol. 2020, 21, 393–405. [Google Scholar]
- Peng, H.; Li, Q. Research on the automatic extraction method of web data objects based on deep learning. IASC 2020, 26, 609–616. [Google Scholar] [CrossRef]
- Ali, W.; Din, S.U.; Khan, A.A.; Tumrani, S.; Wang, X.; Shao, J. Context-aware collaborative filtering framework for rating prediction based on novel similarity estimation. Comput. Mater. Contin. 2020, 63, 1065–1078. [Google Scholar]
- Gumaei, A.; Al-Rakhami, M.; AlSalman, H.; Rahman, S.M.M.; Alamri, A. DL-HAR: Deep learning-based human activity recognition framework for edge computing. Comput. Mater. Contin. 2020, 65, 1033–1057. [Google Scholar] [CrossRef]
- Hirschberg, J.; Manning, C.D. Advances in natural language processing. Science 2015, 349, 261–266. [Google Scholar] [CrossRef] [PubMed]
- Ferreira, R.; Lins, R.D.; Simske, S.J.; Freitas, F.; Riss, M. Assessing sentence similarity through lexical, syntactic and semantic analysis. Comput Speech Lang. 2016, 39, 1–28. [Google Scholar] [CrossRef]
- Li, Y.; McLean, D.; Bandar, Z.A.; O’shea, J.D.; Crockett, K. Sentence similarity based on semantic nets and corpus statistics. IEEE Trans. Knowl. Data Eng. 2006, 18, 1138–1150. [Google Scholar] [CrossRef] [Green Version]
- Miller, G.A. WordNet: A lexical database for English. Commun. ACM 1995, 38, 39–41. [Google Scholar] [CrossRef]
- Wang, Z.; Mi, H.; Ittycheriah, A. Sentence similarity learning by lexical decomposition and composition. In Proceedings of the 26th International Conference on Computational Linguistics: Technical Papers (COLING 2016), Osaka, Japan, 11–16 December 2016; pp. 1340–1349. [Google Scholar]
- Mueller, J.; Thyagarajan, A. Siamese recurrent architectures for learning sentence similarity. In Proceeding of the 30th AAAI Conference on Artificial Intelligence (AAAI-16), Phoenix, AZ, USA, 12–17 February 2016; pp. 2786–2792. [Google Scholar]
- Zhang, X.; Lu, W.; Li, F.; Peng, X.; Zhang, R. Deep feature fusion model for sentence semantic matching. Comput. Mater. Contin. 2019, 61, 601–616. [Google Scholar] [CrossRef]
- Liang, Z.; Liu, J. Sentence Similarity Measurement with Convolutional Neural Networks Using Semantic and Syntactic Features. Comput. Mater. Contin. 2020, 63, 943–957. [Google Scholar]
- Heo, T.S.; Kim, J.D.; Park, C.Y.; Kim, Y.S. Global and Local Information Adjustment for Semantic Similarity Evaluation. Appl. Sci. 2021, 11, 2161. [Google Scholar] [CrossRef]
- Devlin, J.; Chang, M.W.; Lee, K.; Toutanova, K. BERT: Pre-training of deep bidirectional transformers for language understanding. In Proceedings of the 2019 Conference of the North American Chapter of the Association for Computational Linguistics: Human Language Technologies, Minneapolis, MN, USA, 2–7 June 2019; pp. 4171–4186. [Google Scholar]
- Farouk, M. Measuring sentences similarity: A survey. arXiv 2019, arXiv:1910.03940. [Google Scholar] [CrossRef]
- Lee, M.C.; Chang, J.W.; Hsieh, T.C. A grammar-based semantic similarity algorithm for natural language sentences. Sci. World J. 2014, 2014, 437162. [Google Scholar] [CrossRef] [Green Version]
- Lee, M.C.; Zhang, J.W.; Lee, W.X.; Ye, H.Y. Sentence similarity computation based on POS and semantic nets. In Proceedings of the 2009 Fifth International Joint Conference on INC, IMS and IDC, Seoul, Korea, 25–27 August 2009; pp. 907–912. [Google Scholar]
- Abdalgader, K.; Skabar, A. Short-text similarity measurement using word sense disambiguation and synonym expansion. In Proceedings of the Australasian Joint Conference on Artificial Intelligence, Adelaide, Australia, 7–10 December 2010; pp. 435–444. [Google Scholar]
- Schmidhuber, J. Deep learning. Scholarpedia 2015, 10, 32832. [Google Scholar] [CrossRef] [Green Version]
- Pontes, E.L.; Huet, S.; Linhares, A.C.; Torres-Moreno, J.M. Predicting the semantic textual similarity with siamese CNN and LSTM. arXiv 2018, arXiv:1810.10641. [Google Scholar]
- Li, Y.; Zhou, D.; Zhao, W. Combining Local and Global Features into a Siamese Network for Sentence Similarity. IEEE Access. 2020, 8, 75437–75447. [Google Scholar] [CrossRef]
- Medsker, L.R.; Jain, L.C. (Eds.) Recurrent neural networks. In Design and Applications, 2nd ed.; CRC press: Boca Raton, FL, USA, 2001. [Google Scholar]
- Hochreiter, S.; Schmidhuber, J. Long short-term memory. Neural Comput. 1997, 9, 1735–1780. [Google Scholar] [CrossRef] [PubMed]
- Chung, J.; Gulcehre, C.; Cho, K.; Bengio, Y. Empirical evaluation of gated recurrent neural networks on sequence modeling. arXiv 2014, arXiv:1412.3555. [Google Scholar]
- Kenter, T.; De Rijke, M. Short text similarity with word embeddings. In Proceedings of the 24th ACM International on Conference on Information and Knowledge Management, Melbourne, Australia, 19–23 October 2015; pp. 1411–1420. [Google Scholar]
- Mikolov, T.; Sutskever, I.; Chen, K.; Corrado, G.S.; Dean, J. Distributed representations of words and phrases and their compositionality. In Proceedings of the 26th International Conference on Neural Information Processing Systems, Lake Tahoe, NV, USA, 5–10 December 2013; pp. 3111–3119. [Google Scholar]
- Mikolov, T.; Chen, K.; Corrado, G.; Dean, J. Efficient estimation of word representations in vector space. arXiv 2013, arXiv:1301.3781. [Google Scholar]
- Bert-Kor-Base. Available online: https://github.com/kiyoungkim1/LMkor (accessed on 21 June 2021).
- Korean Raw Corpus. Available online: http://nlp.kookmin.ac.kr (accessed on 21 June 2021).
- Kkma Morpheme Analyzer. Available online: http://kkma.snu.ac.kr/ (accessed on 21 June 2021).
- Heo, T.S.; Kim, J.D.; Park, C.Y.; Kim, Y.S. Sentence similarity evaluation using Sent2Vec and siamese neural network with parallel structure. J. Intell. Fuzzy Syst. 2021, 40, 7735–7744. [Google Scholar] [CrossRef]
- Ham, J.; Choe, Y.J.; Park, K.; Choi, I.; Soh, H. KorNLI and KorSTS: New Benchmark Datasets for Korean Natural Language Understanding. In Proceedings of the 2020 Conference on Empirical Methods in Natural Language Processing: Findings, Virtual Conference, 16–20 November 2020; pp. 422–430. [Google Scholar]
| Publisher’s Note: MDPI stays neutral with regard to jurisdictional claims in published maps and institutional affiliations. |
© 2021 by the authors. Licensee MDPI, Basel, Switzerland. This article is an open access article distributed under the terms and conditions of the Creative Commons Attribution (CC BY) license (https://creativecommons.org/licenses/by/4.0/).


