Article

Effects of Anodic Aluminum Oxide Substrate Pore Geometry on the Gas-Phase Photocatalytic Activity of ZnO/Al2O3 Composites Prepared by Atomic Layer Deposition

by
Bozhidar I. Stefanov
1,*,
Blagoy S. Blagoev
2,
Lars Österlund
3,
Boriana R. Tzaneva
1 and
George V. Angelov
4
1
Department of Chemistry, Faculty of Electronic Engineering and Technologies, Technical University of Sofia, 8 Kliment Ohridski Blvd, 1756 Sofia, Bulgaria
2
Georgi Nadjakov Institute of Solid State Physics, Bulgarian Academy of Sciences, 72 Tzarigradsko Chaussee Blvd, 1784 Sofia, Bulgaria
3
Department of Materials Science and Engineering, The Ångström Laboratory, Uppsala University, P.O. Box 35, SE-75103 Uppsala, Sweden
4
Department of Microelectronics, Faculty of Electronic Engineering and Technologies, Technical University of Sofia, 8 Kliment Ohridski Blvd, 1756 Sofia, Bulgaria
*
Author to whom correspondence should be addressed.
Symmetry 2021, 13(8), 1456; https://doi.org/10.3390/sym13081456
Submission received: 13 July 2021 / Revised: 30 July 2021 / Accepted: 4 August 2021 / Published: 9 August 2021
(This article belongs to the Special Issue Heterogeneous Catalysis: Topics and Advances)

Abstract

:
We report on the photocatalytic activity of ZnO layers deposited by atomic layer deposition on a porous anodic aluminum oxide substrate with hexagonal pore symmetry and varied pore dimensions. ZnO/Al2O3 composites were prepared with pore diameters in the range 93–134 nm and interpore distance in the range 185–286 nm, and their photocatalytic activity was measured for gas-phase photocatalytic oxidation of acetaldehyde at varying UV illumination intensities (0.08–3.94 mW cm−2). The results show that substrates with narrower pore diameters (<115 nm, in the case of this study) have a detrimental effect on the photocatalyst performance, despite their higher effective surface. The results are explained on the basis of limited mass transfer inside the porous structure and can be used as a guideline in the purposeful design of photocatalysts with a nanoporous or nanotubular structure.

1. Introduction

Porous anodic aluminum oxide (AAO) has a porous structure, leading to a highly developed surface, making it a suitable support in heterogeneous catalysis [1,2]. It is prepared by inexpensive electrochemical routes, which allow for a fine control of the porous structure by adjusting anodization parameters, or varying electrolyte compositions [3]. AAO is also optically transparent in the UV to NIR wavelengths, and it is possible to prepare AAOs with a highly symmetrical 2D or 3D pore arrangement, which can also exhibit photonic crystal properties [4,5] and can be especially advantageous for supported photocatalysts [6]. Photocatalysts, such as TiO2 and ZnO, supported on AAO have been widely studied and find applications in energy conversion and contaminated water/air remediation [7,8,9].
In this work, we present results on the effects of AAO morphology on the photocatalytic activity of supported ZnO. AAO substrates were prepared with varied pore diameters and interpore distance by adjusting the anodization potential, and ZnO was deposited by atomic layer deposition (ALD). The performance of the as-prepared ZnO/Al2O3 photocatalysts was studied by measuring the photocatalytic oxidation (PCO) of acetaldehyde (CH3CHO) in gas phase, and UV-intensity-dependent experiments were carried out to estimate the effects of AAO morphology on the intrinsic photocatalytic performance of ZnO/Al2O3.

2. Materials and Methods

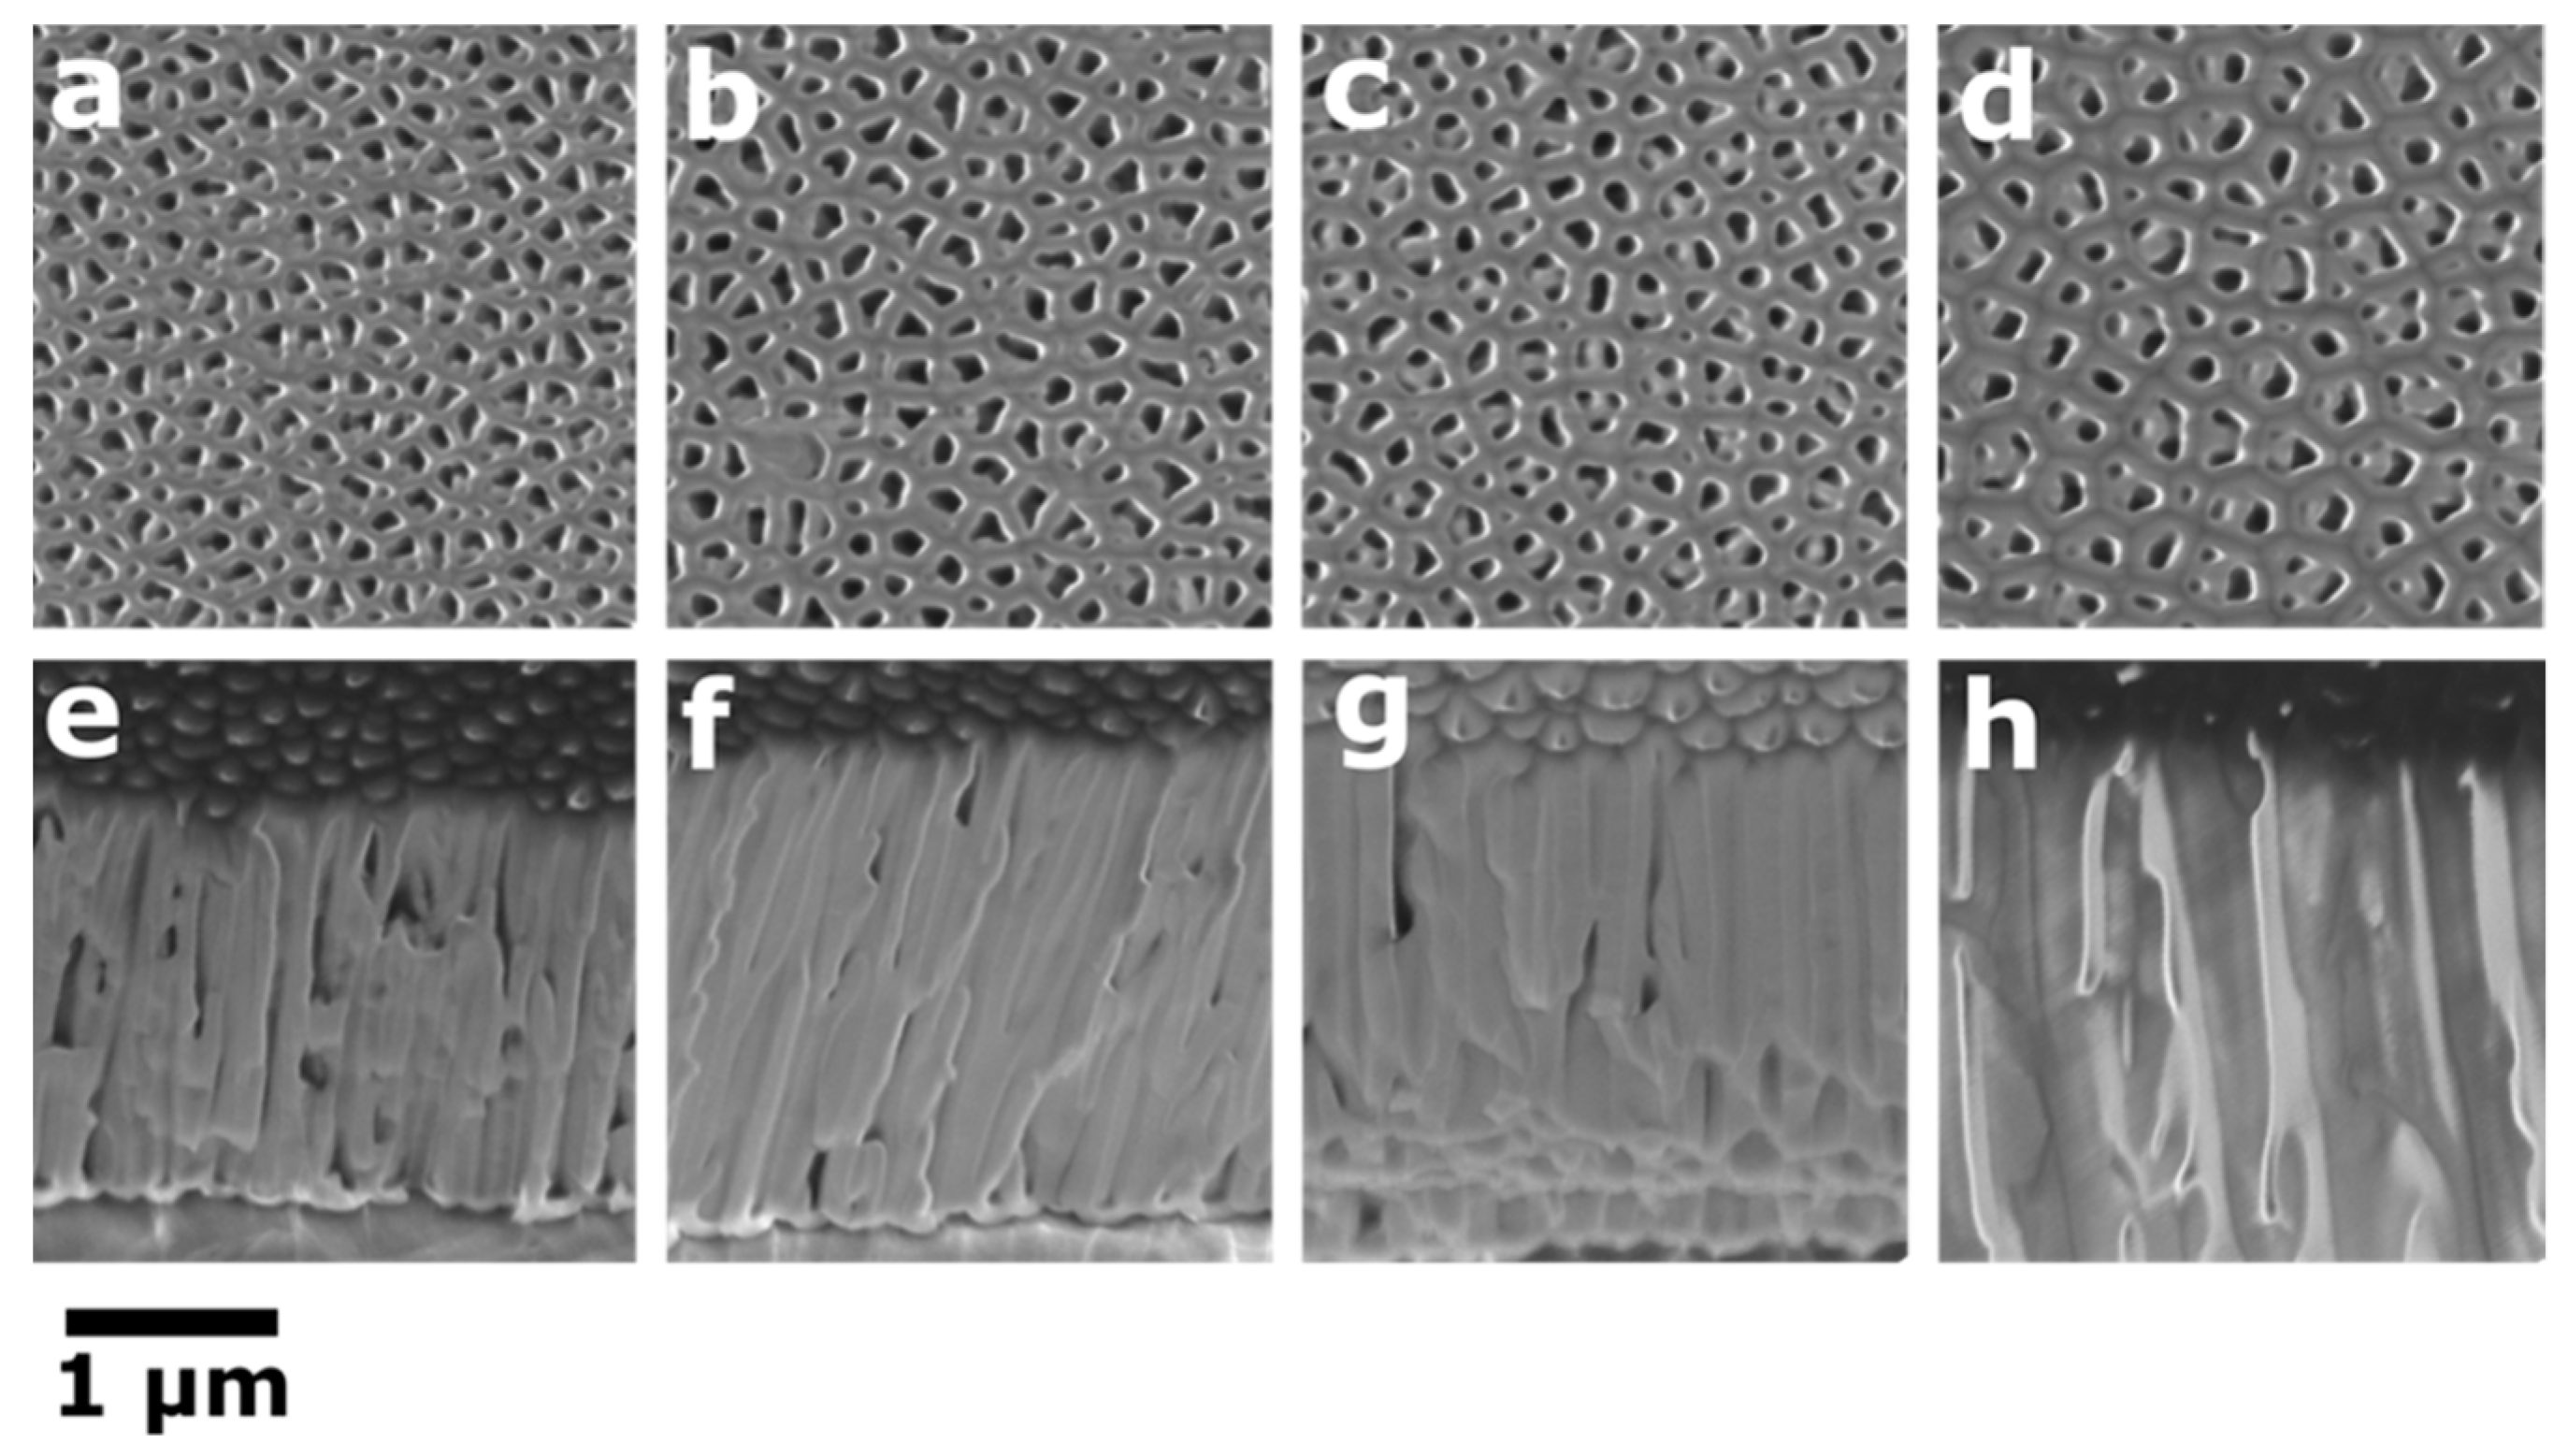
2.1. Preparation of AAO Substrates

Al foil (100 μm thick, 99.999% purity, Alfa Aesar, Ward Hill, MA, USA) was annealed for 5 h at 450 °C in order to minimize mechanical stresses and cut to 50 mm squares. The foils were subsequently surface-treated in 4 wt.% NaOH for 1 min at 60–70 °C, followed by a neutralization in 10% H2SO4 for 30 s. A negative dry photoresist was used to completely protect the back side and form a 46 mm diameter circle (16.6 cm2) of exposed aluminum on the front side for selective anodization. The exposed area was polished in 20 wt.% HClO4:C2H5OH at 5 °C for 1.5 min. Anodization was carried out at a temperature of 10 °C in an electrolyte of 5 wt.% H3PO4. Samples were prepared at four anodization potentials: 60, 80, 100, and 120 V. Two sets of samples were prepared simultaneously at each condition and used for characterization and photocatalytic experiments.

2.2. ALD Deposition of ZnO

ALD deposition of ZnO onto AAO was carried out by thermal ALD at 200 °C, employing a Beneq TFS-200 ALD system. Diethylzinc (DEZ, Zn(C2H5)2) and deionized water (H2O) were used as Zn precursor and oxidant, and N2 as a carrier and purging gas at a flow of 300 sccm. The precursor pulse duration for DEZ and H2O was 0.3 s with 3 s N2 purging time. A total of 50 ALD cycles (DEZ/purging/H2O/purging) were repeated to obtain a ZnO layer with a thickness of about 8 nm, confirmed by ellipsometry on reference Si substrates placed in the ALD reactor. Using this procedure, a conformal ZnO coverage can be achieved with a coverage up to several micrometers within the AAO pores, as confirmed in our previous study [10].
Immediately prior to the photocatalytic experiments, the samples were heat-treated at 500 °C for 1 h (5 °C min−1 heating and cooling rate) in order to improve the crystallinity of the ZnO layer and remove any organic contaminants surface-adsorbed during storage.

2.3. Characterization of ZnO/Al2O3 Composites

The morphology of the ZnO/Al2O3 photocatalysts was studied by scanning electron microscopy (SEM—Carl Zeiss Merlin microscope, 3 kV accelerating voltage). Average pore diameters and interpore distance were obtained from SEM images using the ImageJ software [11]. The geometric areas of no less than 100 pore openings were measured for at least two images for each sample (obtained near the center and the edge of the anodized alumina surface). These data were then converted into an equivalent circle diameter using Equation (1):
D = 2 A π
where A is the area of a pore opening. Geometric surface area conversion factors ( A e f f ) were also obtained from SEM image data by estimating the pore density per geometric SEM image area and correcting it with the average exposed area inside the pores (based on an AAO thickness of 2 μm and estimated average pore diameter), that is, Equation (2):
A e f f = S S E M S S E M + n   d   4 π A
where S S E M is the geometric area of a SEM image (in μm2 estimated by calibrating it with the scale marker), n is the total number of pores, d is the AAO layer thickness (2 μm), and A′ is the area covered by pore openings.
Crystallography information was obtained in the range 20–80° via grazing incidence X-ray diffraction (GI-XRD) at 0.5° angle of incidence and using CuKα radiation (λ = 1.5418 Å) on a Siemens D5000 instrument. Rietveld refinement was applied on diffractograms using the PowderCell software [12] in order to obtain the mean crystallite size and preferential orientation, using the March–Dollase (MD) texturing model [13].
UV–VIS diffuse reflectance spectra were obtained in the range 300 < λ < 800 nm on a PerkinElmer Lambda 900 spectrophotometer, equipped with a 150 mm Spectralon-coated integrating sphere.

2.4. Photocatalytic Experiments

Gas-phase PCO experiments were carried in a photocatalytic reactor setup, which has been described in detail elsewhere [14]. Briefly, a flow-mode reaction cell was used to expose the samples to a 100 mL min−1 gas flow containing 5 ppm CH3CHO in synthetic air (premixed from 90 ppm CH3CHO in N2 and 20%:80% O2/N2 mixture, Air Liquide, 99.99% purity). Illumination was provided by an array of three high-power UV LEDs, λ = 365 ± 5 nm (P8D136, Seoul Semiconductors, South Korea). UV illumination intensity ( I U V ) was in the range 0.08–3.94 mW cm−2 at the photocatalyst surface level, as measured by a calibrated thermopile radiometer (Ophir, Israel). The CH3CHO concentration profile ( C C H 3 C H O ) was monitored in situ by a chemoresistive gas sensor (HS-130AS, Sencera Co., Taiwan). Each experiment consisted of 6–11 steps of 20 min UV illumination periods, bracketed by 15 min dark periods in order to monitor the baseline signal and correct for sensor drift. The CH3CHO PCO rate constant,   r C H 3 C H O , was derived from C C H 3 C H O using Equation (3):
r C H 3 C H O   [ n m o l   m i n 1 c m 2 ] = ( 5   [ p p m ] C C H 3 C H O [ p p m ] ) 5   [ p p m ]   x   S   [ c m 2 ] x F [ n m o l   m i n 1 ]
where S is the geometric photocatalytic area (16.6 cm2), and F is the CH3CHO mass flow (0.002 nmol min−1 for a flow of 100 mL min−1 5 ppm CH3CHO). An example of C C H 3 C H O and corresponding r C H 3 C H O profiles during an experimental sequence is shown in Figure 1.

3. Results and Discussion

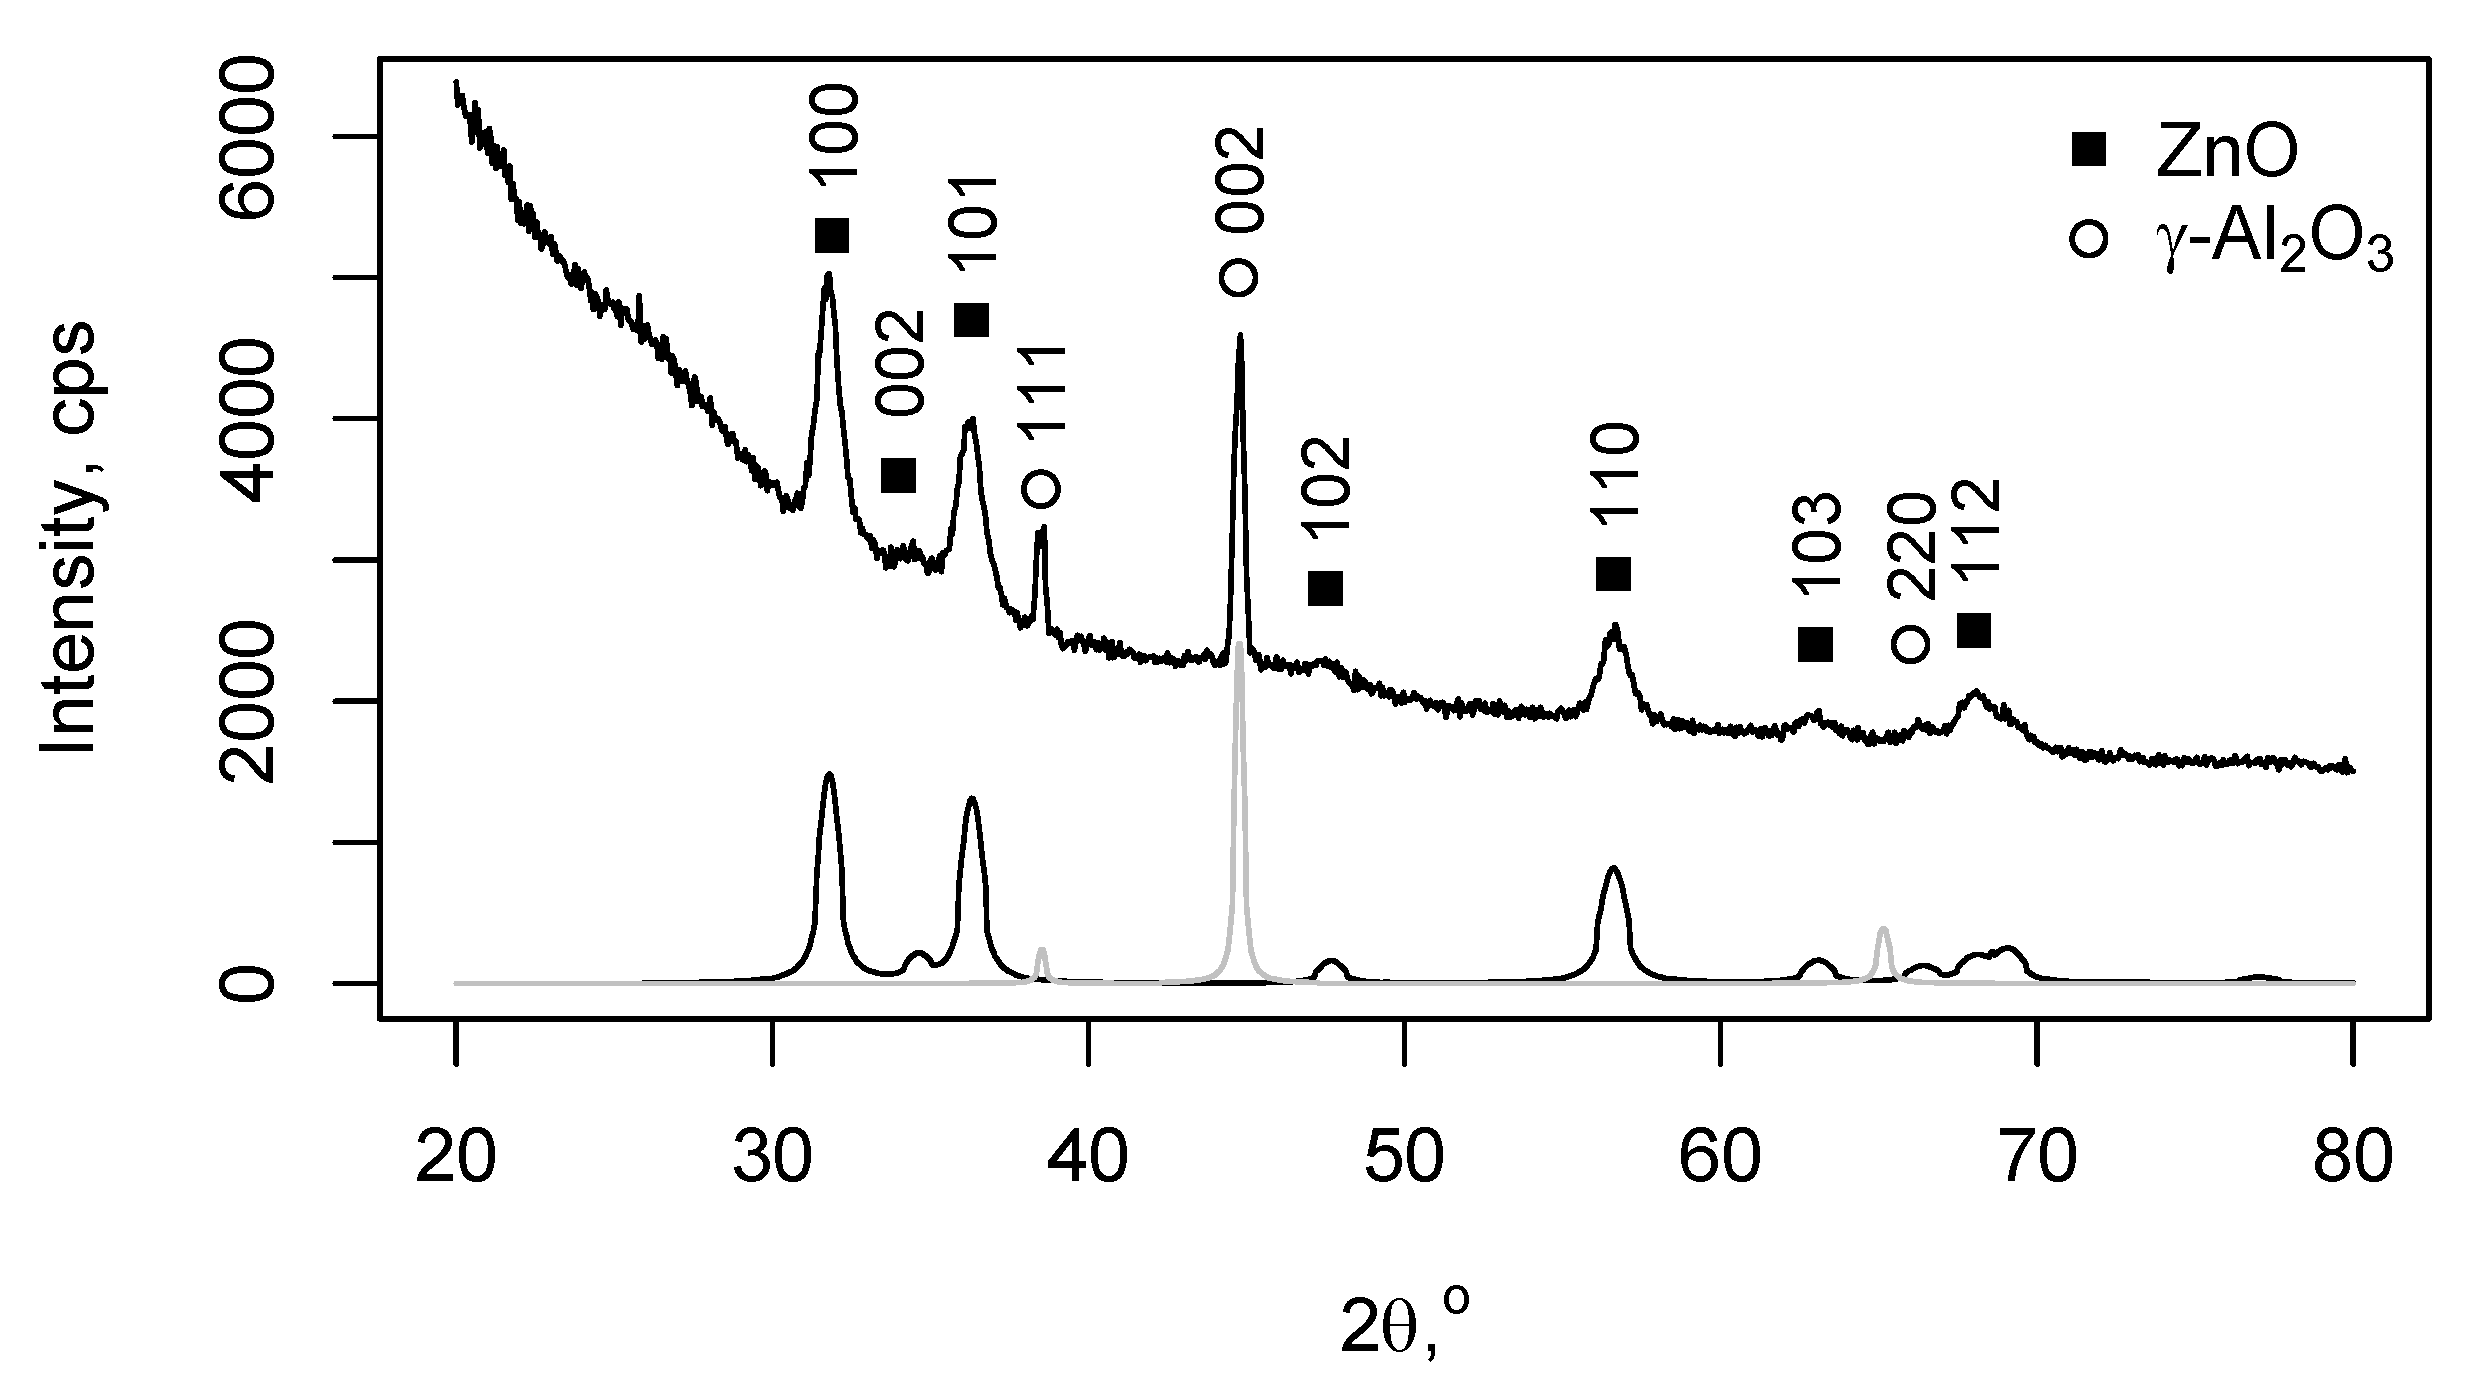
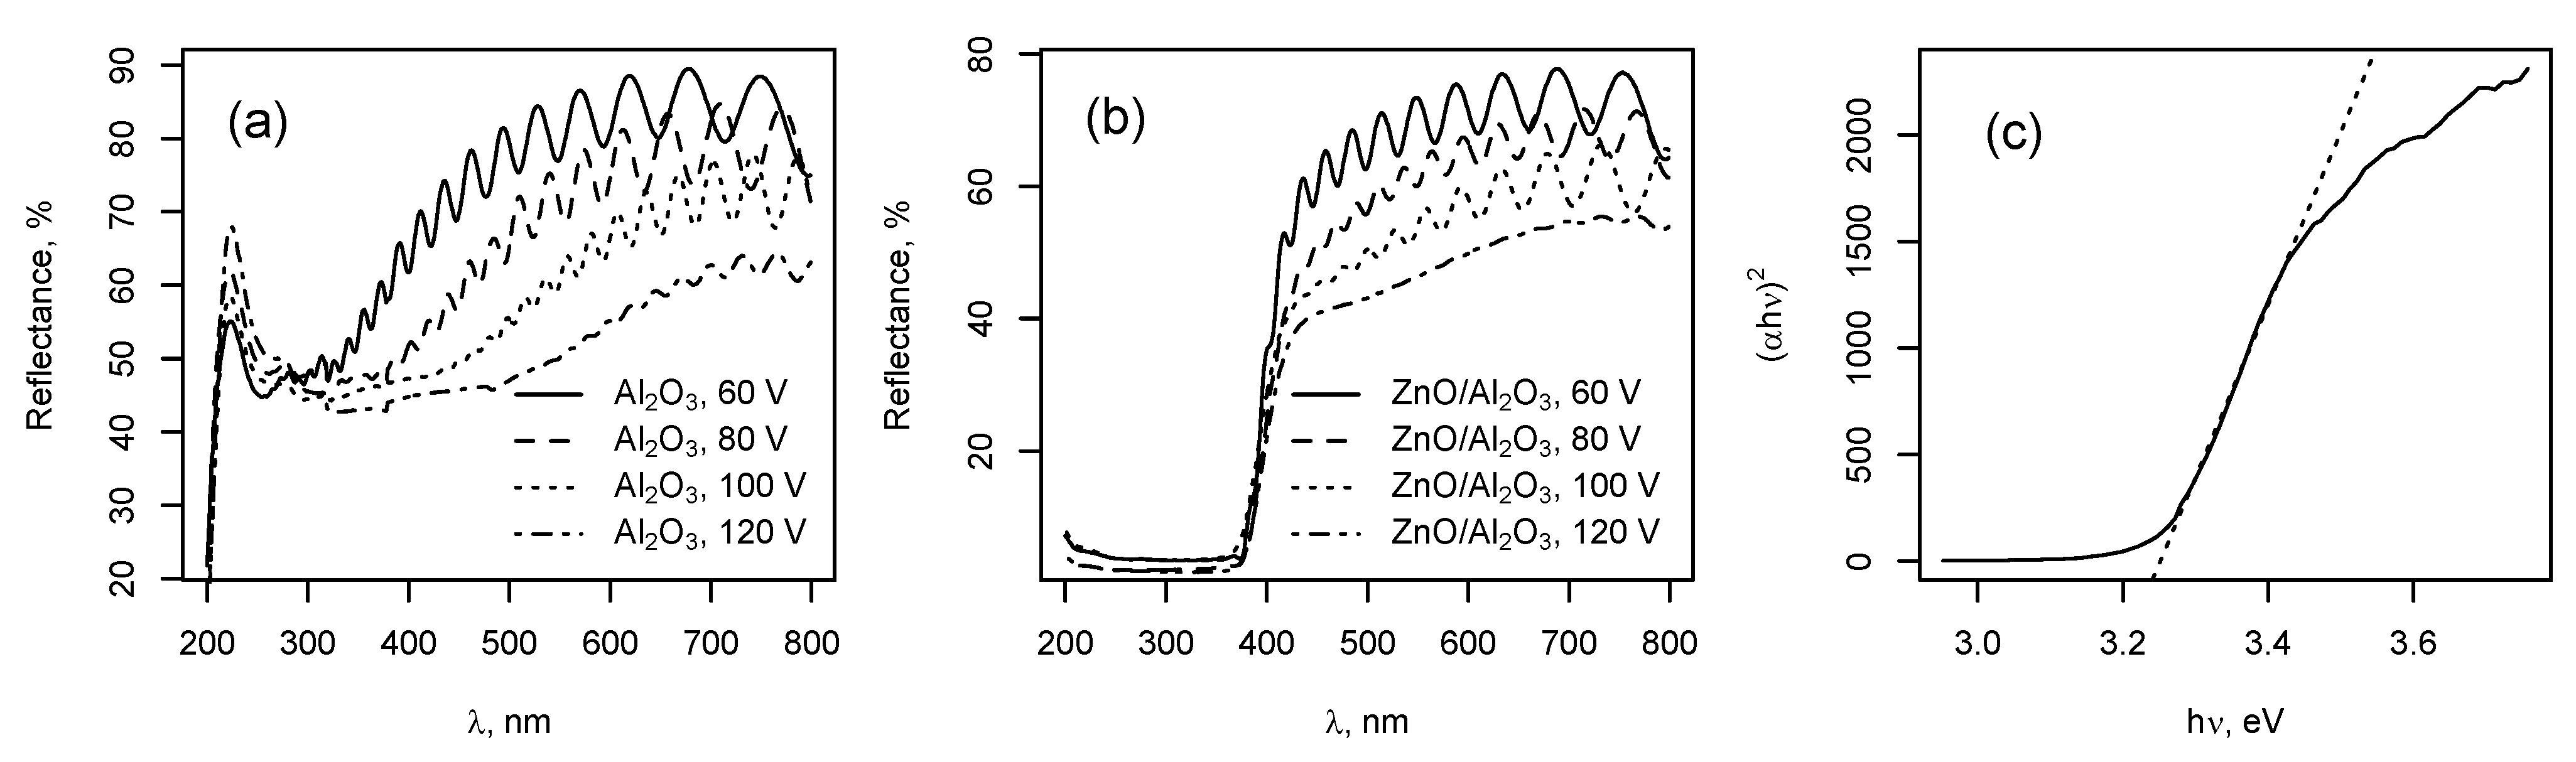
3.1. Characterization of ZnO/Al2O3

Figure 2 shows top-view and cross-section SEM images of ZnO/Al2O3 with AAO anodized at different potentials.
The AAO layer is about 2 μm thick, with a similar morphology in all samples. Increased anodization voltage increases both the average pore diameter (from 93 to 134 nm) and the average interpore distance (from 185 to 286 nm). Histograms of the AAO pore-diameter distributions at different anodization voltages are shown in Figure 3. Increasing the anodization potential, the uniformity of the pore-size distribution is altered and the mean diameter shifts towards wider pores. This observation is typical for AAO anodization processes, where the optimal self-ordering condition is achieved in a narrow potential range, depending on the electrolyte used and the operating temperature [15].
Figure 4 shows an XRD diffractogram of ZnO/Al2O3 with the characteristic diffraction peaks of hexagonal ZnO (JCPDS No. 36-1451). Peaks for γ-Al2O3 (JCPDS No. 29-0063) formed in AAO during heat treatment are also observed. Rietveld refinement reveals an average ZnO crystallite size of ~18 nm and preferred crystallographic orientation in the <100> direction (MD parameter = 0.51, corresponding to about 36% <100>-oriented crystallites).
Given the thickness of the ALD layer is only 8 nm, the larger mean crystallite size may indicate either an extended in-plane recrystallization of ZnO within the ALD layer or the formation of elongated crystals, typical for ZnO. The <100> texturing observed in the GI-XRD diffractogram is not typical for ALD-deposited ZnO, which usually grows in the <002> direction. It has however been observed by other authors employing the GI-XRD technique [16,17].
UV–VIS reflectance spectra for the uncoated AAO substrates, prepared at different anodization potentials, are shown in Figure 5a. The spectra show interference fringes, which are particularly pronounced in the 300–800 nm range for all AAO substrates, except the one prepared at an anodization potential of 120 V. The shift of the interference pattern towards longer wavelengths upon increasing the anodization potential is due to the increased effective refractive index of the AAO layer. The presence of ZnO in the ZnO/Al2O3 composites is indicated by the drop in reflectance at λ < 400 nm (Figure 5b), which can be used to calculate the optical bandgap ( E g ) of the ALD-deposited ZnO.
The reflectance data were converted using the Kubelka–Munk equation:
F ( R ) = ( 1 R ) 2 2 R ,
where F ( R ) is the Kubelka–Munk function, which can be approximated to the effective absorption coefficient ( F ( R ) α ). Then, E g for ZnO, a direct bandgap semiconductor, can be estimated by Equation (5):
α = ( h υ E g ) 1 / 2 h υ .
The cross section of ( α h υ ) 2 versus the photon energy, as shown in Figure 5c, gives the E g values listed in Table 1 for all four ZnO/Al2O3 composites. The average E g of the ZnO in all ZnO/Al2O3 photocatalysts was found to be about 3.25 eV, which is lower than the value for bulk ZnO (3.3 eV), but in agreement with literature data for ultrathin ALD ZnO layers [18].

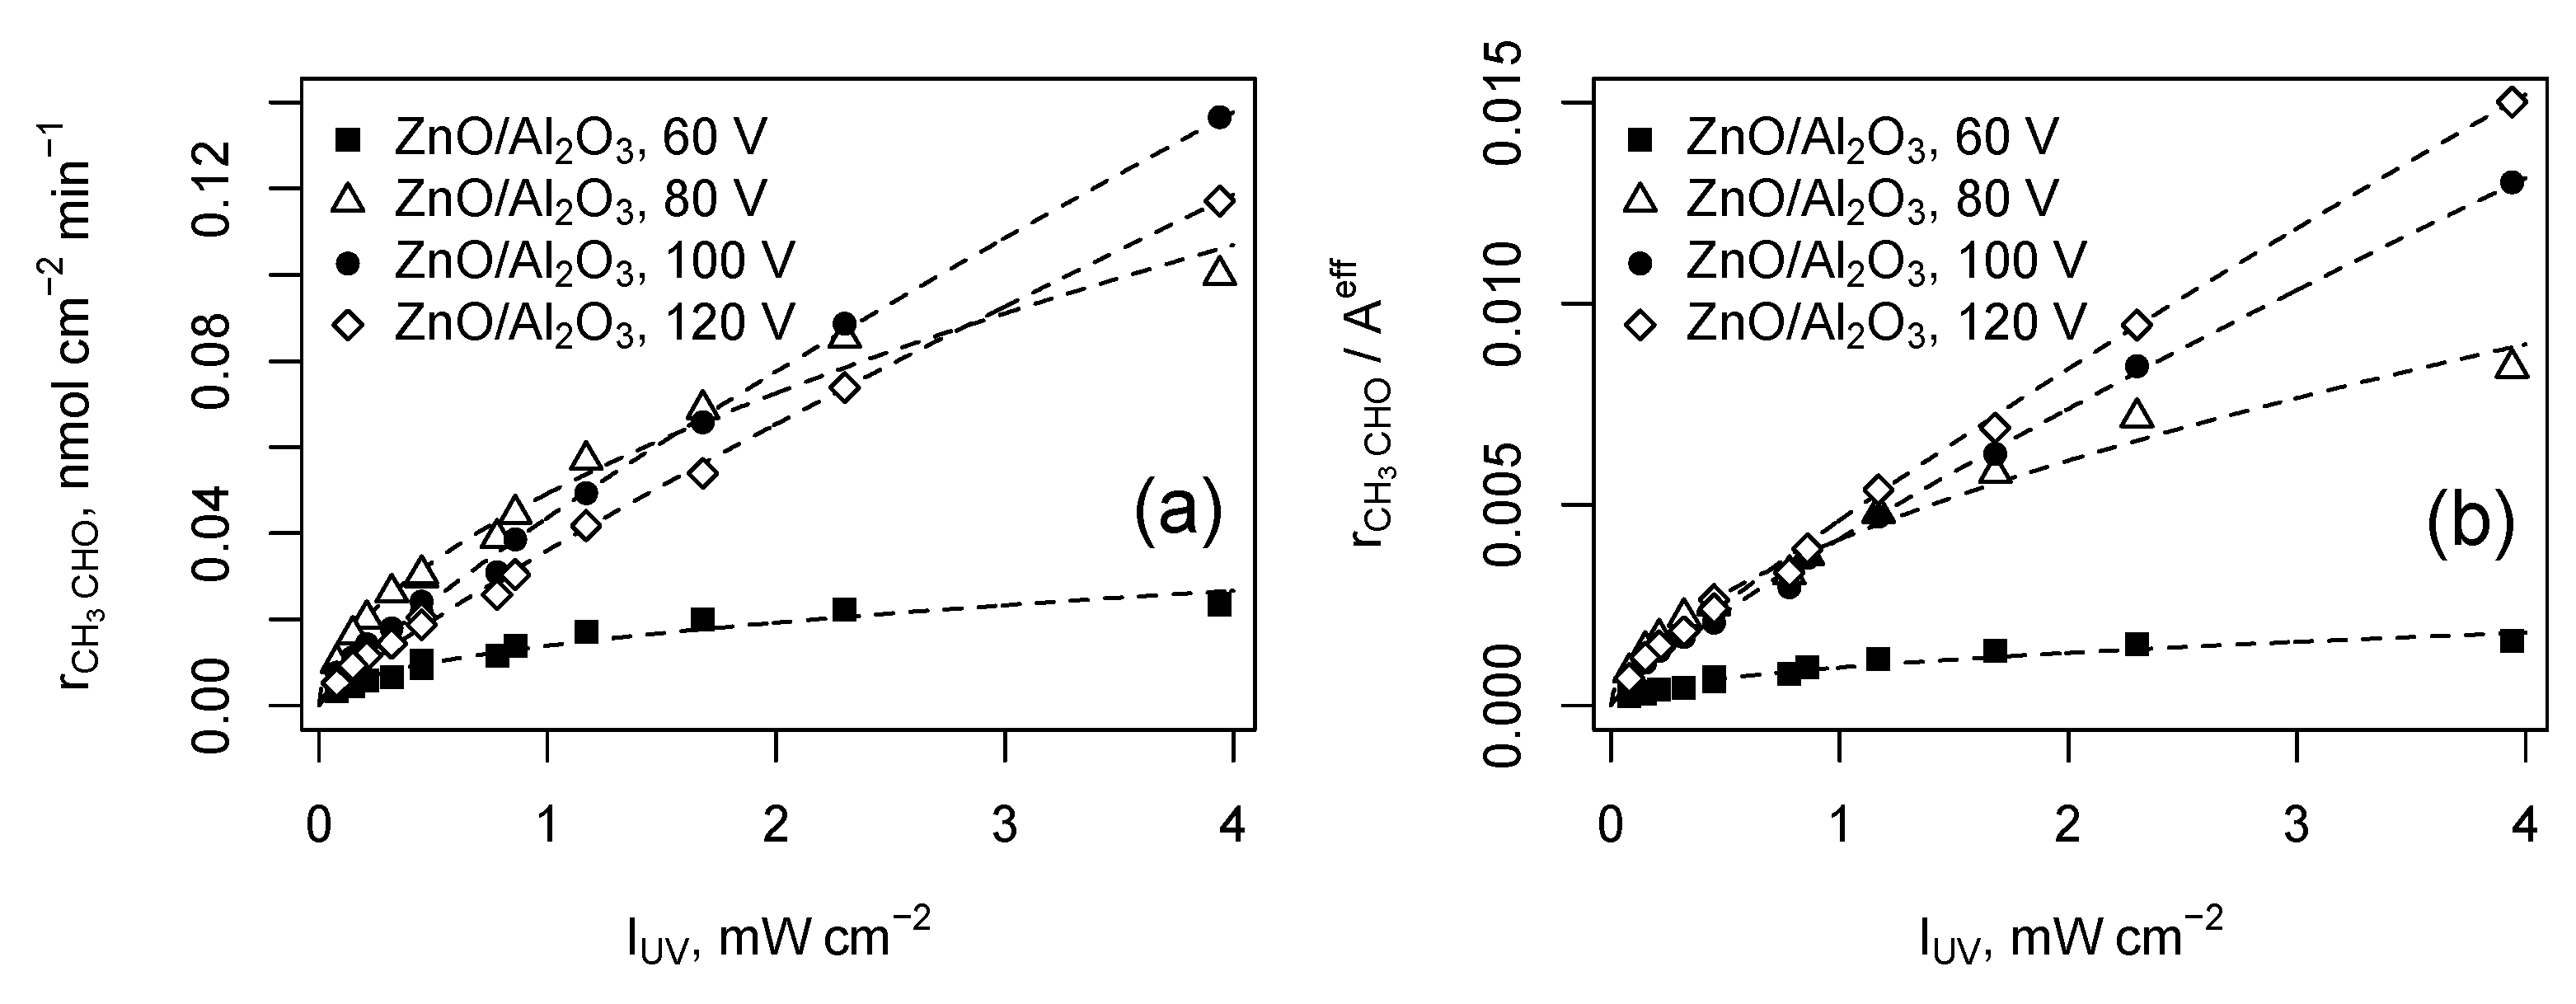
3.2. Photocatalytic Activity

Table 1 lists r C H 3 C H O rates for ZnO/Al2O3 as a function of I U V . The r C H 3 C H O dependence of I U V was modelled by least square fitting of the data to Equation (6), that is:
r C H 3 C H O = A   x   I U V b ,
where A is the I U V -independent rate constant, and b is the I U V reaction order of the PCO process. Theoretically, the PCO rate increases linearly at low intensities ( b 1 ), with a square root order at intermediate intensities ( b 0.5 ), and eventually becomes independent of I U V at high intensities ( b 0 ), where r C H 3 C H O is limited by the number of available reaction sites [19].
The results shown in Table 1 reveal that ZnO/Al2O3 photocatalysts with AAO substrates anodized at >60 V perform markedly better despite their lower effective surface area. However, there is a shift from square root to a linear PCO reaction rate dependence on I U V for samples with larger pores and a sparser pore structure, which we tentatively attribute to limited UV light penetration and mass transfer limitations. The optimal apparent performance at low-to-medium I U V (0.1–1 mW cm−2) was observed for ZnO/Al2O3 prepared at 80 V, as reflected by the highest I U V -independent rate constant ( A ) for this sample. A similar effect of optimal pore size related to maximum PCO efficiency was observed experimentally [20] and modelled theoretically by Liu et al. [21] for TiO2-nanotube-based photocatalysts, which have a similar geometry, and attributed to O2 diffusion limitations.
It is reasonable to assume that the same effect can explain the observed reactivity in our case. Figure 6a shows the UV dependence of r C H 3 C H O rates for all samples and the resulting fits from Equation (6). It can be noticed that the ZnO photocatalysts, deposited on an AAO layer with larger average pore diameters (obtained at 100 and 120 V anodization potentials), exhibit an almost linear increase in the CH3CHO PCO rates ( b > 0.8 ) in the studied I U V range, while the rates of the ZnO/Al2O3 samples with a narrower pore structure levels off (b~0.8) in the same UV intensity illumination range. The difference is even more pronounced when the r C H 3 C H O values are corrected with geometric-to-effective area correction factors ( A e f f ) obtained from SEM images by Equation (2) for each AAO substrate (Figure 6b), where it is clearly seen that catalysts based on substrates with wider AAO pores have higher intrinsic activity. These observations can be explained through diffusion limitations in the narrower pore structure [21,22]. Assuming that the ZnO coverage is reasonably uniform within the pores, as shown in our previous study [10], improving reactant diffusion and light penetration would lead to a higher number of catalytic sites utilized and hence a higher photocatalytic activity. However, any further increase in pore diameter is expected to have a detrimental effect on PCO rates due to the decrease in effective surface area (reducing the number of active sites). Thus, it is possible to purposefully design photocatalysts with optimal activity, which are based on AAOs and easy to fabricate and reproduce.

4. Conclusions

Photocatalytic ZnO/Al2O3 was prepared by ALD deposition of thin ZnO layers on a three-dimensional hexagonal periodic AAO support scaffold structure. The effect of AAO geometry on the gas-phase photocatalytic oxidation rates of CH3CHO was studied as a function of UV illumination intensity. The results show that increasing the pore diameter (93 to 134 nm) and distance (185 to 286 nm) shifts the UV intensity dependence of the PCO reaction rate from a square root to a linear dependence, thus indicating better utilization of UV light energy in the studied region (0.1–3.9 mW cm−2). Optimal photocatalytic activity was found for ZnO/Al2O3 photocatalysts with AAO supports obtained at an intermediate anodization voltage (80–100 V). Specifically, the ZnO/Al2O3 photocatalyst with a 115 nm pore diameter exhibited the highest absolute reaction rate at a low-to-medium illumination intensity, 0.1–1 mW cm−2, which, however, became saturated at UV illumination intensities >2 mW cm−2. In this region, the ZnO/Al2O3 photocatalysts with larger pores exhibited higher reactivity to CH3CHO photo-oxidation, regardless of their lower overall effective area. The study demonstrates the feasibility of AAO-based substrates to be used as a testbed for investigating the intrinsic fundamental effects of a porous substrate structure on the photocatalytic activity of ALD-deposited supported photocatalysts, and results obtained in this manner may be used as guidelines for the purposeful design of photocatalysts with a porous structure and tubular geometry.

Author Contributions

Conceptualization, B.I.S. and B.R.T.; methodology, B.I.S. and B.S.B.; validation, B.I.S. and B.R.T.; formal analysis, B.I.S. and L.Ö.; investigation, B.I.S. and L.Ö.; resources, B.R.T., B.S.B., L.Ö., and G.V.A.; data curation, B.I.S.; writing—original draft preparation, B.I.S.; writing—review and editing, B.S.B., L.Ö., G.V.A., and B.R.T.; visualization, B.I.S.; project administration, G.V.A.; funding acquisition, G.V.A. All authors have read and agreed to the published version of the manuscript.

Funding

This research was supported by the European Regional Development Fund within the Operational Program “Science and Education for Smart Growth 2014–2020” under the Project CoE “National Center of Mechatronics and Clean Technologies”, Contract No. BG05M2OP001-1.001-0008, L10S7 SynChaLab.

Institutional Review Board Statement

Not applicable.

Informed Consent Statement

Not applicable.

Data Availability Statement

Data are contained within the article.

Acknowledgments

B.I.S. is grateful to José Montero (Uppsala University) for his assistance in acquiring the SEM images. B.I.S. acknowledges financial help for career development through the Bulgarian Ministry of Education and Science program “Young Scientists and Postdoctoral Candidates”.

Conflicts of Interest

The authors declare no conflict of interest.

References

  1. Md Jani, A.M.; Habiballah, A.S.; Budiman Abdul Halim, M.Z.; Ahmad Zulkifli, F.W.; Mahmud, A.H.; Yazid, H. Nanoporous Anodic Aluminum Oxide (NAAO) for Catalytic, Biosensing and Template Synthesis Applications (A Review). Curr. Nanosci. 2018, 15, 49–63. [Google Scholar] [CrossRef]
  2. Tzaneva, B.; Naydenov, A.; Todorova, S.; Videkov, V.; Milusheva, V.; Stefanov, P. Cobalt electrodeposition in nanoporous anodic aluminium oxide for application as catalyst for methane combustion. Electrochim. Acta 2016, 191, 192–199. [Google Scholar] [CrossRef]
  3. Ali, H.O. Review of porous anodic aluminium oxide (AAO) applications for sensors, MEMS and biomedical devices. Trans. IMF 2017, 95, 290–296. [Google Scholar] [CrossRef]
  4. Takayama, O.; Cada, M. Two-dimensional metallo-dielectric photonic crystals embedded in anodic porous alumina for optical wavelengths. Appl. Phys. Lett. 2004, 85, 1311–1313. [Google Scholar] [CrossRef] [Green Version]
  5. Białek, E.; Włodarski, M.; Norek, M. Influence of Anodization Temperature on Geometrical and Optical Properties of Porous Anodic Alumina (PAA)-Based Photonic Structures. Materials 2020, 13, 3185. [Google Scholar] [CrossRef] [PubMed]
  6. Lim, S.Y.; Law, C.S.; Marković, M.; Kirby, J.K.; Abell, A.D.; Santos, A. Engineering the Slow Photon Effect in Photoactive Nanoporous Anodic Alumina Gradient-Index Filters for Photocatalysis. ACS Appl. Mater. Interfaces 2018, 10, 24124–24136. [Google Scholar] [CrossRef] [Green Version]
  7. Berger, T.; Regmi, C.; Schäfer, A.; Richards, B. Photocatalytic degradation of organic dye via atomic layer deposited TiO2 on ceramic membranes in single-pass flow-through operation. J. Membr. Sci. 2020, 604, 118015. [Google Scholar] [CrossRef]
  8. Kure-Chu, S.-Z.; Inoue, S.; Wada, K.; Li, D.; Haneda, H. Highly porous TiO2/Al2O3 composite nanostructures on glass by anodization and the sol–gel process: Fabrication and photocatalytic characteristics. J. Mater. Chem. 2003, 13, 866–870. [Google Scholar] [CrossRef]
  9. Zhao, H.; Liu, L.; Lei, Y. A mini review: Functional nanostructuring with perfectly-ordered anodic aluminum oxide template for energy conversion and storage. Front. Chem. Sci. Eng. 2018, 12, 481–493. [Google Scholar] [CrossRef]
  10. Blagoev, B.S.; Vlakhov, E.; Videkov, V.; Tzaneva, B.; Łuka, G.; Witkowski, B.; Terziyska, P.; Leclercq, J.; Krajewski, T.; Guziewicz, E.; et al. Atomic layer deposition of ZnO: Al on PAA substrates. J. Phys. Conf. Ser. 2016, 764, 012004. [Google Scholar] [CrossRef]
  11. Schindelin, J.; Arganda-Carreras, I.; Frise, E.; Kaynig, V.; Longair, M.; Pietzsch, T.; Preibisch, S.; Rueden, C.; Saalfeld, S.; Schmid, B.; et al. Fiji: An open-source platform for biological-image analysis. Nat. Chem. Biol. 2012, 9, 676–682. [Google Scholar] [CrossRef] [Green Version]
  12. Kraus, W.; Nolze, G. POWDER CELL—A program for the representation and manipulation of crystal structures and calculation of the resulting X-ray powder patterns. J. Appl. Crystallogr. 1996, 29, 301–303. [Google Scholar] [CrossRef]
  13. Dollase, W.A. Correction of intensities for preferred orientation in powder diffractometry: Application of the March model. J. Appl. Crystallogr. 1986, 19, 267–272. [Google Scholar] [CrossRef]
  14. Stefanov, B.; Niklasson, G.; Granqvist, C.; Österlund, L. Gas-phase photocatalytic activity of sputter-deposited anatase TiO2 films: Effect of <001> preferential orientation, surface temperature and humidity. J. Catal. 2016, 335, 187–196. [Google Scholar] [CrossRef] [Green Version]
  15. Domagalski, J.; Xifre-Perez, E.; Marsal, L. Recent Advances in Nanoporous Anodic Alumina: Principles, Engineering, and Applications. Nanomaterials 2021, 11, 430. [Google Scholar] [CrossRef] [PubMed]
  16. Jedrzejewska-Szczerska, M.; Wierzba, P.; Chaaya, A.A.; Bechelany, M.; Miele, P.; Viter, R.; Mazikowski, A.; Karpienko, K.; Wróbel, M. ALD thin ZnO layer as an active medium in a fiber-optic Fabry–Perot interferometer. Sens. Actuators A Phys. 2015, 221, 88–94. [Google Scholar] [CrossRef]
  17. Chaaya, A.A.; Viter, R.; Baleviciute, I.; Bechelany, M.; Ramanavicius, A.; Gertnere, Z.; Erts, D.; Smyntyna, V.; Miele, P. Tuning Optical Properties of Al2O3/ZnO Nanolaminates Synthesized by Atomic Layer Deposition. J. Phys. Chem. C 2014, 118, 3811–3819. [Google Scholar] [CrossRef]
  18. Baek, S.-H.; Lee, H.-J.; Lee, S.-N. Thickness dependence of crystal and optical characterization on ZnO thin film grown by atomic layer deposition. AIP Adv. 2018, 8, 065306. [Google Scholar] [CrossRef]
  19. Mills, A.; Wang, J.; Ollis, D.F. Kinetics of Liquid Phase Semiconductor Photoassisted Reactions: Supporting Observations for a Pseudo-Steady-State Model. J. Phys. Chem. B 2006, 110, 14386–14390. [Google Scholar] [CrossRef] [PubMed] [Green Version]
  20. Huang, J.; Lin, C.-J.; Lai, Y.-K.; Sun, L.; Li, J. Some Critical Structure Factors of Titanium Oxide Nanotube Array in Its Photocatalytic Activity. Environ. Sci. Technol. 2007, 41, 4735–4740. [Google Scholar] [CrossRef]
  21. Liu, B.; Nakata, K.; Liu, S.; Sakai, M.; Ochiai, T.; Murakami, T.; Takagi, K.; Fujishima, A. Theoretical Kinetic Analysis of Heterogeneous Photocatalysis by TiO2 Nanotube Arrays: The Effects of Nanotube Geometry on Photocatalytic Activity. J. Phys. Chem. C 2012, 116, 7471–7479. [Google Scholar] [CrossRef]
  22. Libbrecht, W.; Vandaele, K.; De Buysser, K.; Verberckmoes, A.; Thybaut, J.W.; Poelman, H.; De Clercq, J.; Van Der Voort, P. Tuning the Pore Geometry of Ordered Mesoporous Carbons for Enhanced Adsorption of Bisphenol-A. Materials 2015, 8, 1652–1665. [Google Scholar] [CrossRef] [PubMed]
Figure 1. (a) Acetaldehyde concentration, C C H 3 C H O , and (b) corresponding photocatalytic degradation rate, r C H 3 C H O , profiles during an experimental sequence consisting of six steps of increasing UV illumination intensity, I U V . Grey rectangles mark periods without UV illumination.
Symmetry 13 01456 g001
Figure 2. Top-view and cross-section SEM images of ZnO/Al2O3 with AAO anodized at 60 V (a,e), 80 V (b,f), 100 V (c,g), and 120 V (d,h).
Symmetry 13 01456 g002
Figure 3. Histograms of pore-diameter distributions for the ZnO/Al2O3 composites with an AAO substrate prepared at four increasing anodization potentials.
Symmetry 13 01456 g003
Figure 4. XRD pattern of ZnO/Al2O3 anodized at 60 V with major diffraction peaks of ZnO and γ-Al2O3 indexed. Fits from Rietveld refinement for the two phases (with the background correction removed) are overlaid bellow the diffractogram.
Symmetry 13 01456 g004
Figure 5. UV–VIS reflectance spectra of (a) bare Al2O3 anodized at increasing voltage with (b) corresponding ZnO/Al2O3 composites and (c) Tauc plot for ZnO/Al2O3 anodized at 100 V (dashed line signifies a linear fit for E g determination).
Symmetry 13 01456 g005
Figure 6. (a) Photocatalytic rate, r C H 3 C H O , as a function of UV light intensity, I U V , and (b) geometric-surface-area-corrected r C H 3 C H O values using coefficients from Equation (2) as a function of I U V for ZnO/Al2O3 photocatalysts. Dashed lines represent fits from Equation (6) in both plots.
Symmetry 13 01456 g006
Table 1. Morphological and PCO parameters for ZnO/Al2O3 samples.
Anodization Voltage (V)6080100120
Pore diameter (nm)93 ± 20115 ± 20130 ± 20134 ± 23
Interpore distance (nm)185 ± 31227 ± 32228 ± 29286 ± 42
Geometric-to-effective surface area conversion factor (Aeff)14.711.910.57.8
E g (eV)3.2473.2383.2513.253
I U V (mW cm−2)CH3CHO PCO rate, r (nmol cm−2 min−1)
0.080.00340.00980.00770.0053
0.150.00440.01640.01120.0093
0.210.00590.02010.01430.0116
0.320.00650.02620.01790.0144
0.450.00870.03050.02170.0187
0.780.01140.03890.03090.0258
0.860.01380.04450.03860.0304
1.170.01710.05700.04940.0418
1.680.02000.06890.06570.0539
2.300.02240.08540.08860.0738
3.940.02360.09990.13660.1171
Results from Equation (6) fit:
UV-independent rate ( A )0.01390.04920.04360.0360
Reaction order ( b )0.470.560.830.86
Residual standard error0.00170.00340.00200.0018
Publisher’s Note: MDPI stays neutral with regard to jurisdictional claims in published maps and institutional affiliations.

