Article

An Approach for Chart Description Generation in Cyber–Physical–Social System

School of Computer Science, Xi’an Polytechnic University, Xi’an 710048, China
*
Author to whom correspondence should be addressed.
Symmetry 2021, 13(9), 1552; https://doi.org/10.3390/sym13091552
Submission received: 18 July 2021 / Revised: 17 August 2021 / Accepted: 18 August 2021 / Published: 24 August 2021

Abstract

:
There is an increasing use of charts generated by the social interaction environment in manufacturing enterprise applications. To transform these massive amounts of unstructured chart data into decision support knowledge for demand-capability matching in manufacturing enterprises, we propose a manufacturing enterprise chart description generation (MECDG) method, which is a two-phase automated solution: (1) extracting chart data based on optical character recognition and deep learning method; (2) generating chart description according to user input based on natural language generation method and matching the description with extracted chart data. We verified and compared the processing at each phase of the method, and at the same time applied the method to the interactive platform of the manufacturing enterprise. The ultimate goal of this paper is to promote the knowledge extraction and scientific analysis of chart data in the context of manufacturing enterprises, so as to improve the analysis and decision-making capabilities of enterprises.

1. Introduction

The cyber–physical–social system (CPSS) [1,2,3] has recently attracted great attention as a new computing paradigm [4] that integrates physical systems, social systems, and information systems with development of intelligent computing, control, and communication technologies. CPSS expands social characteristics and interactions on the basis of the cyber–physical system (CPS) [5,6], aiming to understand the relationship and influence between CPS and human society, so as to better guide the network, physical, and social elements in the system. CPSS connects physical systems, information systems, and social systems through sensor networks, and intelligently manages various complex systems through intelligent human–computer interaction. Many manufacturing enterprises have adopted CPSS to integrate multi-source heterogeneous manufacturing resources and network services to coordinate and control the manufacturing process accurately [7], to realize the distribution of manufacturing resources between enterprises or cross-enterprises, to achieve more intelligent production control and decision making [8]. However, the increasing use of system in CPSS environment has resulted in explosion of data. Among these data, unstructured chart data occupies a large proportion, but it is difficult to use traditional data analysis methods to process, due to its irregular data structure. This situation consequently leaves two challenges for analysis and application of chart data.
The first challenge is the recognition and extraction of chart data in manufacturing enterprises. Manufacturing enterprises generate large number of statistical data on product research, production quality, sales, after-sales, etc., during the production process. Most of them are directly saved as chart in that the vivid graphic structure can intuitively and effectively reflect the relationship and characteristics of the data [9]. The information of chart can be used by decision makers to understand the full life cycle of the product and identify the potential problems timely so as to make better production schedule. However, a chart is generally saved in a jpg or svg format [10,11], which makes it difficult to obtain the original information to construct the chart, and it is also difficult for machines to understand the text and data in the chart like human vision. Recognizing and extracting data from chart can transform the chart images into a structured and computer-accessible form, so as to obtain a large amount of basic knowledge for data analysis. Due to the diversity of chart types and the complexity of the image structure, the extraction of chart data is a problem worthy of attention.
The second is the interpretation and application of extracted chart information. The knowledge in chart is not only the data and text information that can be directly observed but also the specific trends and other relevant characteristics of the chart itself, which is the high-level information [12,13] that can convey more important and internal knowledge. Based on what the chart messages describe, the high-level messages of the chart can be divided into: trend, level, gap, relationship, significance, comparison, calculation, and others. Therefore, predicting and inferring deeper and more valuable advanced chart information from trends, prominent elements, and relationships between data elements of chart will greatly help manufacturing companies in better application of chart data. However, the current analysis works of chart mostly rely on professional analysts to understand and interpret charts based on their own knowledge. This method is inefficient and easily affected by subjective factors, and it is also difficult for non-professionals to understand the characteristic relationships between data. Since the characteristic information between the data elements of chart in the integration and sharing of enterprise data resources is of highest importance, the manufacturing enterprises need intelligent chart analysis tools to understand the potential data relationships of the chart.
This paper adopts a two-stage data analysis method for the unstructured chart data generated by manufacturing enterprises in the CPSS environment to deal with the above two challenges, and proposes the MECDG method, as shown in Figure 1. In the first phase, convolutional neural network (CNN) and optical character recognition (OCR) methods are developed to recognize and extract data elements to obtain structured feature information from the unstructured chart, and support vector machine (SVM) [14] method is used to classify feature information. In the second phase, for obtaining high-level messages between data elements from the chart features, we built a natural language generation (NLG) model based on natural language processing technology. This model uses the long- and short-term memory (LSTM) network to analyze user intentions and generate appropriate text descriptions of chart features to help understand chart information.
The rest of this paper is organized as follows. In the second section, we review the related works in chart data extraction and natural language generation technology. In the third section, we discuss the data element extraction method based on convolutional neural network and OCR technology from chart. The fourth section details a NLG model based on LSTM to generate text descriptions that meet the needs of manufacturing enterprises. The fifth section gives the experimental details, experimental results, methods evaluation and application cases in the data analysis, and visualization interactive system of manufacturing enterprises. The final section concludes with our main contributions and future research directions.

2. Related Work

This section is to survey the advancements in two research directions related to social context extraction and text description generation, and identify the deficiencies that need to overcome.

2.1. Manufacturing Chart Data Extraction

Manufacturing chart data extraction in CPSS is to extract more useful information and knowledge from unstructured manufacturing chart. Many scholars have focused on specific chart types, such as bar charts [15], line charts [16], and scatter charts [17], due to the diversity of the charts. In addition, most of the existing research integrates OCR, image recognition, and deep learning technologies to extract knowledge from the charts. For example, Savva and Kong [18] designed ReVision system to extract data from pie charts and bar charts by locating marked points in the charts, and they used SVM to classify charts. Choudhury and Wang [19] used the clustering method to extract data from the line chart. Siegel and Horvitz [20] used CNN network to classify the chart types and extracted the chart data with legend information. Choi and Jung [21] extracted chart data from graphs based on deep neural network (DNN). Jung and Kim [22] designed a semi-automatic, interactive extraction algorithm to extract data from different chart types. Poco and Heer [23] proposed an automatic text extraction pipeline to recover the visual information coding from the chart. Luo and Li [24] extracted chart data based on OCR and key point detection network.
The above data extraction application reported two strategies. The first is a two-phase process. It classifies chart types using machine learning or deep learning methods, then extracts chart data using different methods according to the chart type. The approaches based on this strategy have great accuracy, but these methods cannot generalize well on other types of charts. For example, the extraction framework of bar chart cannot be applied to the line chart. The second strategy uses key point detection technology to extract the underlying data for all types of charts, and then transforms the underlying data into structured chart information. The second strategy can get chart information more directly in comparison with the first strategy regardless of the type of chart. This study focuses on chart data extraction from manufacturing chart, adopts the second strategy, and adds chart text extraction process to obtain legend and coordinate information.

2.2. Chart Description Generation

Significant progress of image description approaches based on NLG has been made in the field of visualization. Chart description pays more attention to precision and relevance in comparison with general image description approaches, which leads to high-level chart information understand for the statistical characteristics of chart. The current NLG methods mainly include template-based and deep learning. Most existing works use predefined templates to generate text description for a certain type of chart, and then extends the approach to other types of charts. Several approaches have been reported in the literature. Al-Zaidy and Giles [25] used image processing and text recognition technology to extract bar chart data and generate chart description by the “protoform” method [26]. Oliveira and Silva [15] defined textual description templates with relevant characteristics of chart elements to verbalize the extracted data of a bar chart. Bryan and Ma [27] presented temporal summary images as an approach for both exploring chart data and generating description from it. Hullman and Diakopoulos [28] designed Calliope system to generate visual data description that incorporates a new logic-oriented Monte Carlo tree search algorithm. Mahmood and Bajwa [29] used a template-based NLG approach to describe the data information extracted from the pie chart in the form of natural language summaries. Kallimani and Srinivasa [30] designed a system to identify and interpret bar graphs and generate bar chart description from the extracted semantic information. Liu and Xie [31] proposed an approach to automatically generate chart description, and designed a summary template that can be extended to different chart types to generate a text description of chart. These methods are simple to construct, easy to operate and implement, but the generated descriptions are relatively rigid and cannot fully meet the interactive and diverse needs of manufacturing companies in the CPSS environment.

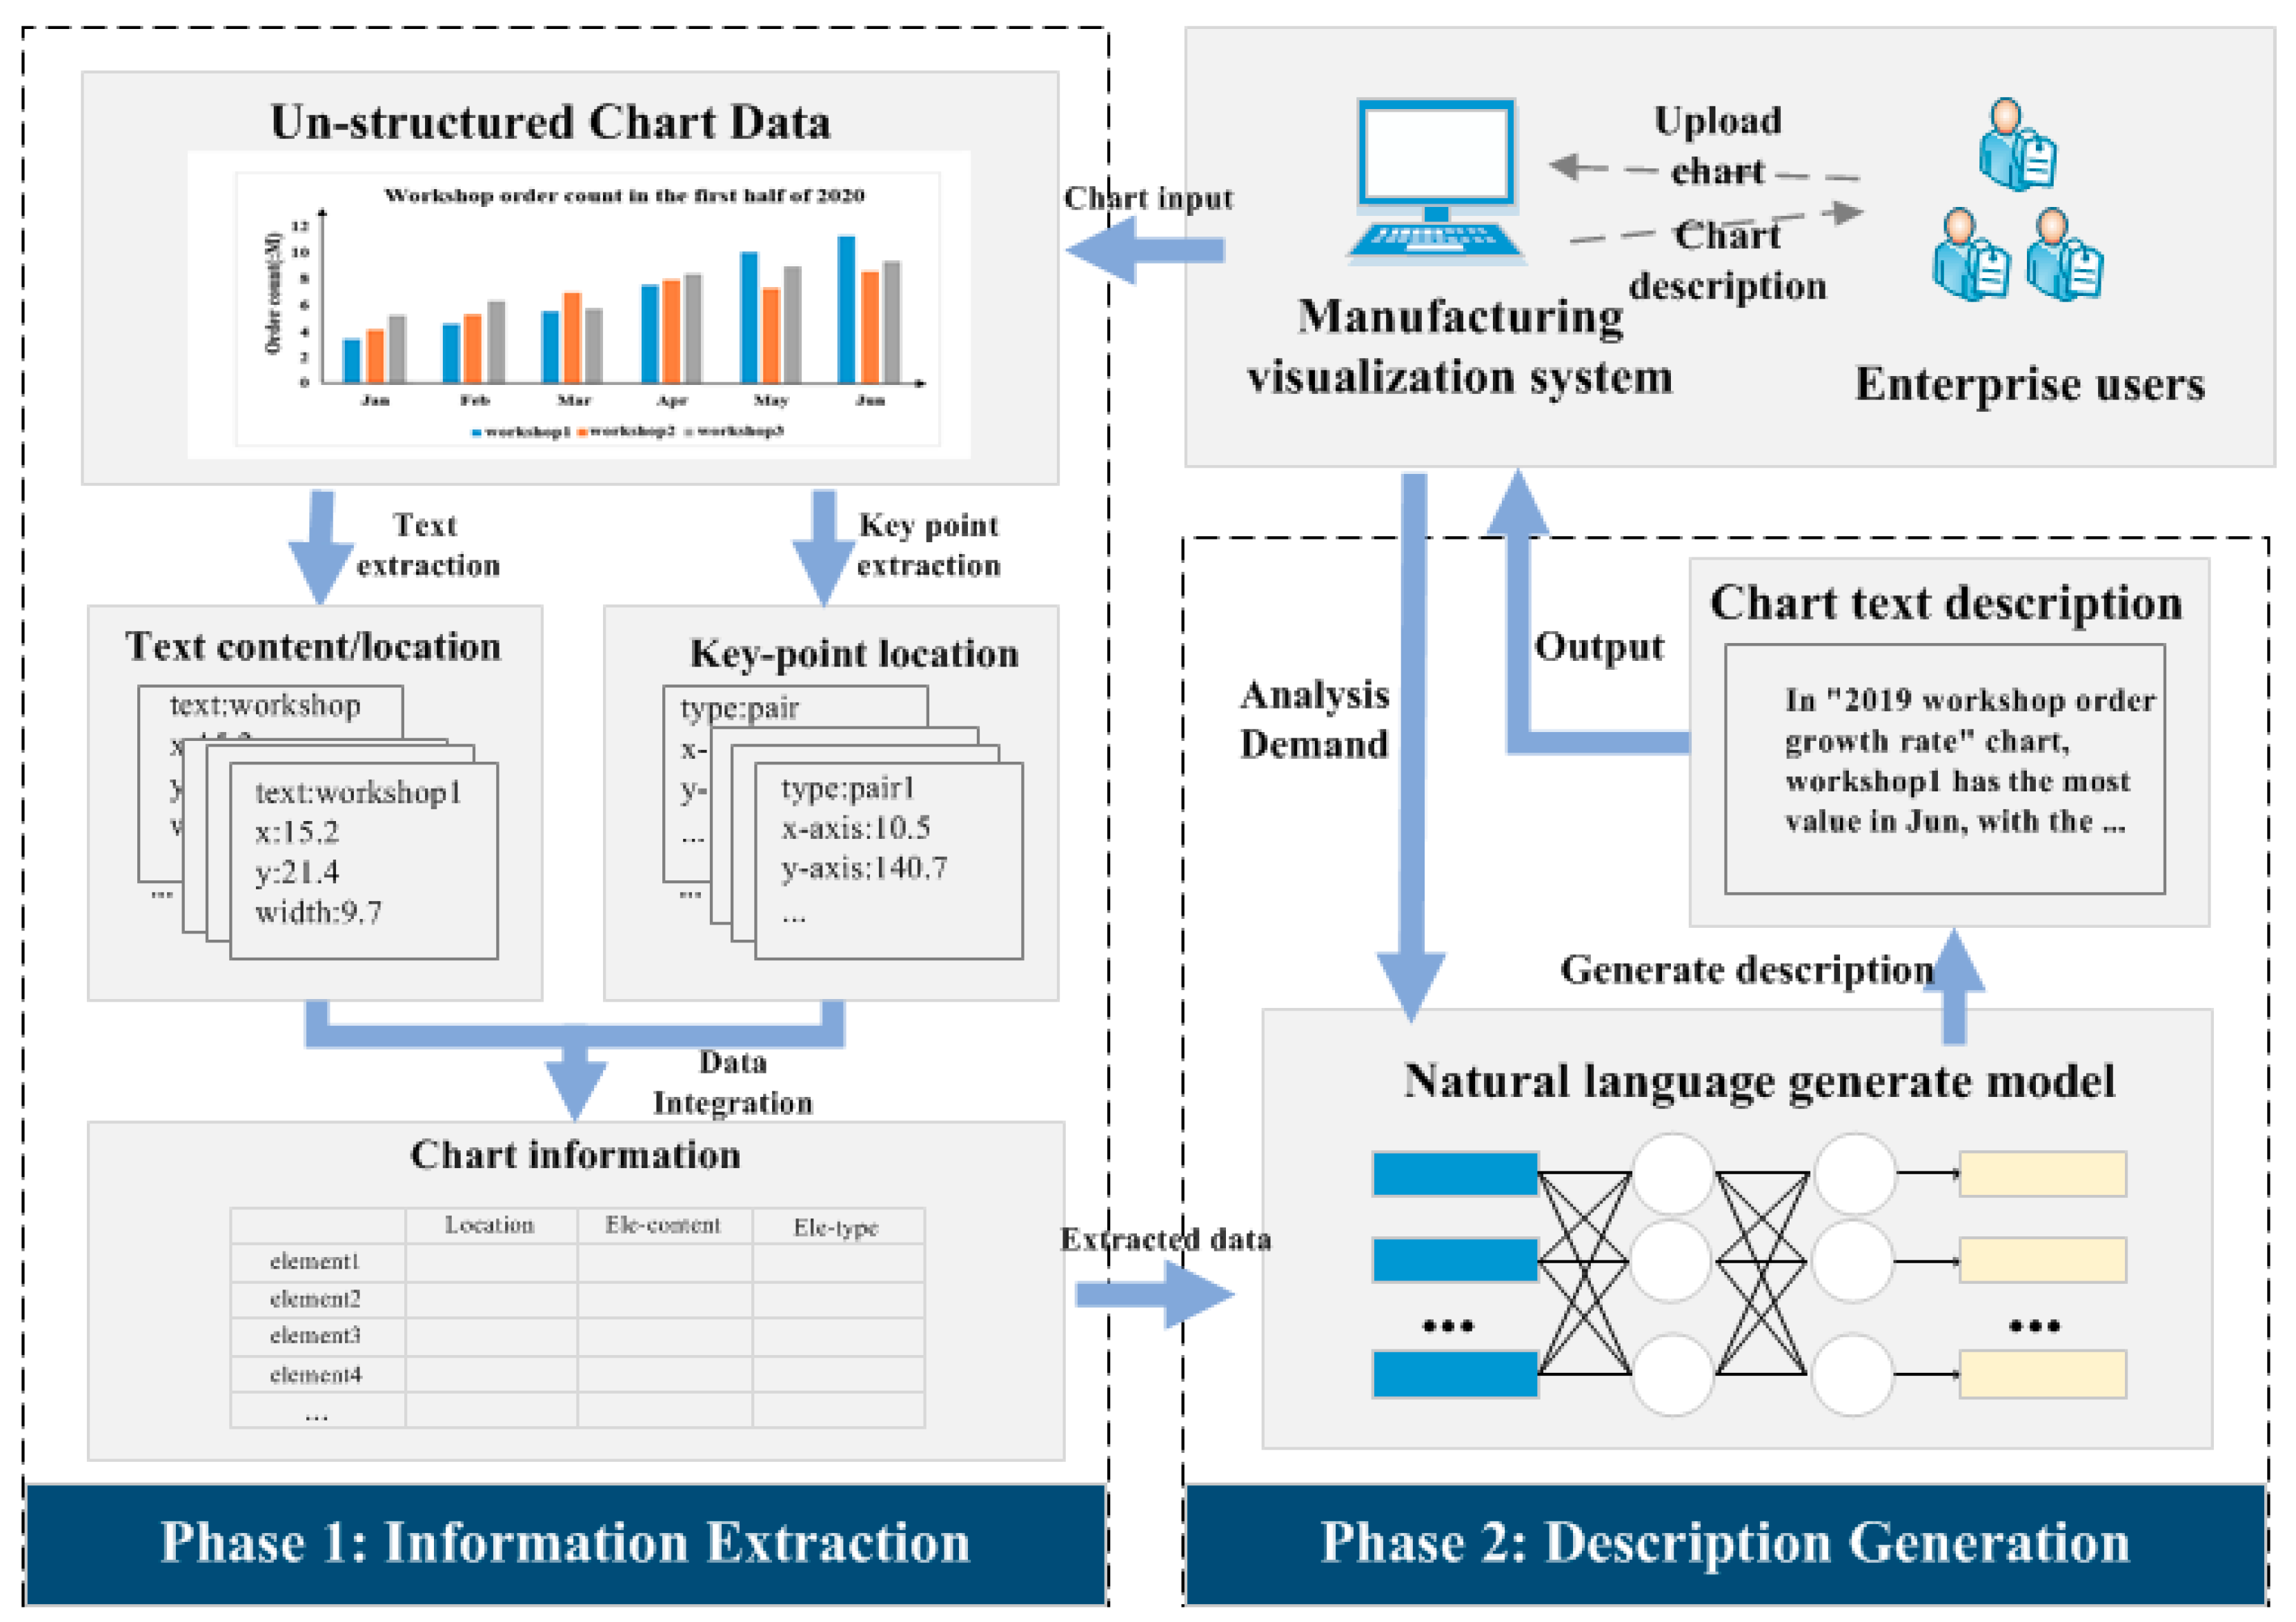
3. Data Information Extraction from Chart

Our first work is a pipeline model for chart information extraction based on OCR and deep learning technology, which can be divided into two major parts: chart text extraction and key point detection. The chart text extraction includes legend and coordinate information extraction and classification. The key point detection adopts CornerNet [32] to extract the most valuable points in the chart. Finally we can get the numerical chart information by integrating the text information and key point data.

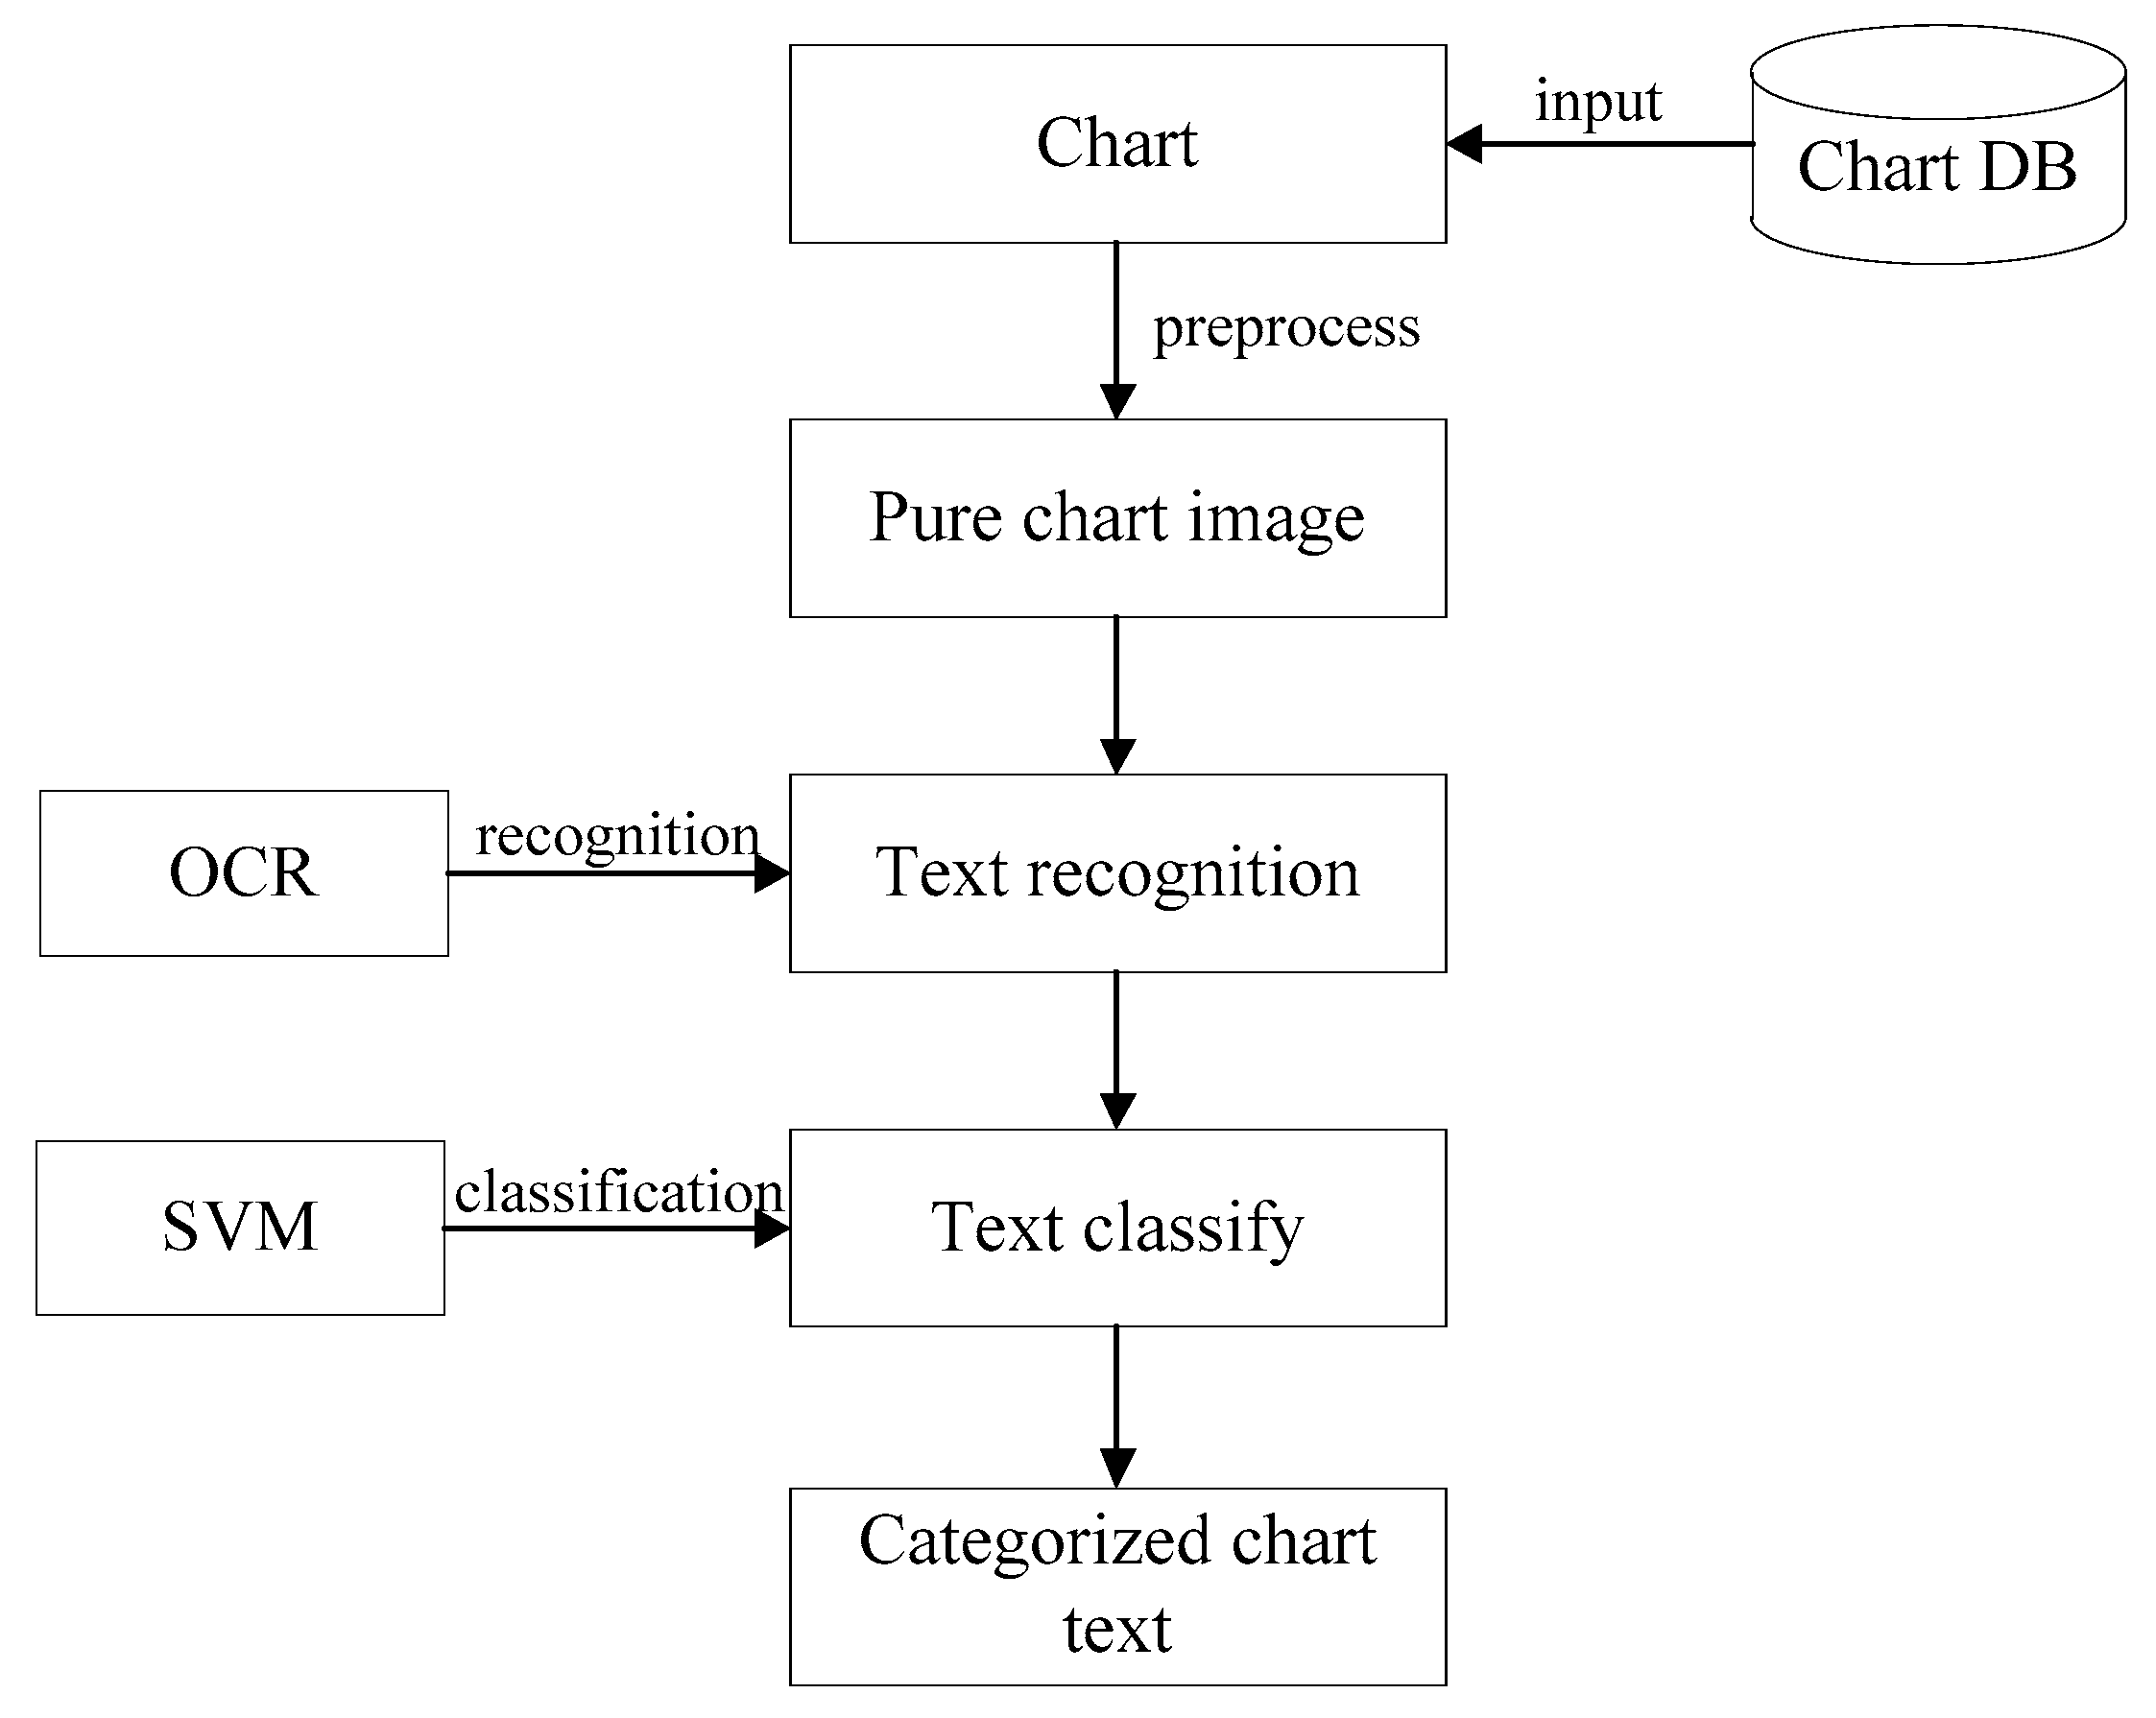
3.1. Chart Text Extraction

Chart text extraction can help obtain the common information in the chart, including chart title, legend, and coordinate range. The framework of this section is based on OCR and CNN technology, as shown in Figure 2.
Beginning with the preprocessing of the chart, we binarize the chart image with a threshold approach to facilitate subsequent processing. Then, a text pixel classifier based on CNN is used to remove non-text pixels in the chart image to obtain a pure image with only text pixels remaining, which facilitates the text recognition work. In the text recognition phase, we perform OCR using the open source engine [33] to get a set of text contents. To classify the text content more appropriately, we consider four text types, including chart title, legends, x-axis, and y axis, and we train an SVM using a radial basis function kernel to classify text elements.
In the classification task of text roles, there are many alternative machine learning classification methods, such as k-nearest neighbors (KNN) [34] and SVM. The advantages of SVM are that it can easily handle linearly separable and low-dimensions problems, and it can also solve high-dimensions problems through appropriate kernel function, while the disadvantages are that it is inefficient when dealing with large sample datasets and is sensitive to noisy feature vectors. In contrast, the advantages of the KNN classifier are that it does not require training process and is easy to understand, but it does not work well with high-dimensional problems. Considering that text role classification is a high-dimensional classification problem, when KNN calculates the similarity between the features of two texts, the cost is quite huge, and the classification speed is not particularly ideal. Meanwhile, the scale of the chart text dataset of the manufacturing enterprises is relatively small. It is prone to overfitting when using deep learning-based models, so we adopt SVM as the text role classification method.

3.2. Key Point Detection

Key point extraction allows to extract valuable chart points regardless of chart types. We adopt CornerNet with HourglassNet [35] backbone for key point proposal. After a series of down-sampling and up-sampling processing, we get a probability map that highlights the pixels in key point locations, then use it as input through the predict module to obtain the thermal feature map, embedded feature map, and offset feature map of the chart. The framework of key point detection is shown in Figure 3.
The thermal feature map is used to predict the position information of upper left corner and lower right corner point. The number of channels is the categories in training set, indicating the category probability of each corner point. The loss function of the thermal feature map is as follows:
L H = 1 N c = 1 C i = 1 H j = 1 W { ( 1 p c i j ) α log ( p c i j ) , y c i j = 1 ( 1 y c i j ) β ( p c i j ) α log ( 1 p c i j ) , o t h e r w i s e
where N is the number of key points in the chart, α and β are the hyper parameters that determine the contribution of each point, and the values are set to 2 and 3, respectively. p c i j is the score of category C at the position ( i , j ) . The higher the score, the higher the probability of the corner point. y c i j is the ground-truth thermal characteristic map calculated by Gaussian formula. ( 1 y c i j ) can be understood as the distance between the predicted corner point and the real corner point after Gaussian non-linearization.
Embedding feature map is used to match the upper left and lower right key points of the same target. The main idea is to minimize the distance of embedding feature maps belonging to the same group of targets and increase the distance that does not belong to the same target to match the same group of targets. The loss function is as follows:
L p u l l = 1 N k = 1 N [ ( e t k e k ) 2 + ( e b k e k ) 2 ]
L p u s h = 1 N ( N 1 ) i E k K max ( 0 , 1 | e k e j | )
where L p u l l is the loss of function that minimizes the distance between the corner points of the same group and L p u s h is the loss of function that distinguishes the corner points of different groups. e t k is the embedding feature of the upper left corner point of category k, e b k is the embedding feature of the upper right corner point, and e k is their average value.
The offset feature map is used to correct the position of the key points. The offset is added to the predicted corner point position to reduce the error caused by a series of up-sampling and down-sampling operations through the hourglass network.
The key point positions can be determined through the three feature maps. Finally, we combine the key point feature data with the text information to get the chart data.

4. Deep Learning Methodology for Chart Description Generation

4.1. Problem Description and Assumption

Chart descriptions with natural language generation technology can greatly improve the comprehensibility and interactivity of unstructured data for promoting the information integration and application cross-enterprise manufacturing data in the CPSS environment.
The framework of traditional NLG [36,37] methods is based on “white box” design patterns, such as template-based and grammatical rule-based methods, in which the functions of each module are relatively clear, and have strong interpretability and controllability. Deep learning-based NLG methods adopt end-to-end “black box” design patterns, which are language probability models that predict the character or word with the highest probability of appearing based on the existing text sequence.
The NLG method based on templates and grammatical rules can generate text descriptions in predefined formats. However, these descriptions are not enough for manufacturing companies in the CPSS environment. In most cases, they have higher requirements for the flexibility and interactivity of data analysis and hope to obtain the relevant descriptions that can meet user’s demands instead of the results that contain a lot of useless information. For this purpose, we decided to adopt deep learning-based NLG method to generate chart descriptions.
Compared with general deep learning-based NLG tasks, the difference in manufacturing chart description is the large amount of numerical data. Considering that numerical data cannot help the semantic representation, in fact, these data may even mislead the semantic generation process of the model. Therefore, we design a deep learning-based NLG model that ignores numerical data. We mask all the numerical data and other data that related to the chart properties during model training process to help the model focus on semantic representation generation. At the same time, an output branch is added to distinguish user’s intention. By adding corresponding numerical data according to the user’s intention to the generated semantic representation, we can get more reliable chart descriptions.

4.2. The Model of Natural Language Generation for Chart Description

We design an NLG model based on the long- and short-term memory network (LSTM) [38] to generate the text description for chart data of the manufacturing enterprise.
As shown in Figure 4, the initial sequence of the model is the input of manufacturing enterprise user, and it is first transformed into word vector through the embedding layer for the reason that neural network cannot directly process the text sequence. We chose the pre-trained Bert [39] as the embedding layer, a popular language representation model in recent years, which has achieved excellent results in many natural language processing tasks through a huge amount of corpus, complex structure, and powerful computing capabilities.
The word vector obtained through encoding layer is passed to LSTM network. Compared with the traditional recurrent neural network (RNN) [40], LSTM introduces memory module and cell state to control and store information. As shown in Figure 4, the memory module has three gates, including forget gate, input gate, and output gate. The forget gate determines the previous cell state c t 1 to be stored in current cell state c t , which is defined as
f t = σ ( w f · [ h t 1 , x t ] + b f )
where w f refers to the weight matrix of forget gate, [ h t , x t ] refers to the two vectors of splicing, σ is the sigmoid function, b f is the bias matrix. The input gate determines the input of current network x to be stored in state c t , which is defined as
i t = σ ( w i · [ h t 1 , x t ] + b i )
where w i and b i are the weight matrix and bias matrix of input gate. The cell state can be updated through the results of the forget gate and input gate as follows:
c t = f t × c t 1 + i t × tan h ( w C [ h t 1 , x t ] + b C ) .
The output o t of LSTM is determined by the output gate according to current cell state c t as
o t = σ ( w o · [ h t 1 , x t ] + b o )
In the output layer, we set up two fully connected structures, y 1 and y 2 , for semantic representation generation and user intention recognition, respectively. A softmax classification layer is added after y 1 layer to select the word with the probability according to current sequence, then add it to the sequence. In addition, this process will be continuously looped until the expected description that masks the numerical data is generated. From the perspective of probabilistic modeling, it can be expressed as:
P θ ( Y | X ) = i = 1 n P θ ( y i | Y < i , X )
where X is the input sequence, Y = ( y 1 , y 2 , , y n ) represents the output of model, and y i ( i = 1 , 2 , , n ) represents a single character or word. The purpose of model training is to obtain conditional probability P θ ( Y | X ) . The model generates a character or word y i every time by sampling through the probability distribution P θ ( y i | Y < i , X ) . To improve the interactivity of the description, we choose a smoother sampling strategy as follows:
P n e w ( Y | X ) = e log ( P o l d ( Y | X ) ) / t e log ( P o l d ( Y | X ) ) / t
where t is a parameter that controls the randomness of sampling. The larger the value of t , the stronger the diversity of sampling and the more changes in the generated description.
For example, if the input of user is “max,” we can get a chart description through the sampling process as:
“In the {chart title} chart, {y axis} get maximum value in {x value}, with a value of {y value}.”
Obviously, there are four masks needed to be replaced in the next steps. We also add a softmax layer after y 2 layer to distinguish user’s intent, but we only retain the result of the initial sequence as the intent information. For the previous example, the model can distinguish that what the user wants is the maximum value in the chart, and then we can select the numerical value and other chart properties from the extracted chart data to prepare for the description as:
“‘chart title’: Workshop order count in the first half of 2020; ‘x value’: Jan; ‘y value’: 3.4; ‘y axis’: workshop 1.”
The last step of the model is to replace the masks in the generated chart description with chart data according to user’s intent. The final chart description is as:
“In the Workshop order count in the first half of 2020 chart, workshop 1 has least orders in Jan, with a value of 3.4.”

5. Application Cases and Experiments

In this section, two sets of experiments are carried out to test the efficiency and practicality of the proposed MECDG model. The first set of experiments tests the effectiveness of chart data extraction through comparative experiments on the Vega [41] dataset and the self-collected manufacturing enterprise chart dataset (MECD), which is collected from the workshop and production system of the manufacturing enterprise. The second set of experiments tests the performance of chart description generation through questionnaires and case comparisons. Note that the dataset of the second set of experiments is built according to the analysis needs of the manufacturing enterprise users.

5.1. Dataset and Settings

We chose the charts automatically generated by the Vega system and MECD as the dataset of chart data extraction. The dataset contains bar graphs, line graphs, and line graphs. The details of the dataset are shown in Table 1. During the experiment, we divided the dataset 3:1 into training set and test set.
For chart description generation, we construct a manufacturing enterprise intention and semantic representation dataset (MEISRD). The dataset collects 4971 samples of chart descriptions and 3918 samples of users’ intent under various manufacturing enterprises’ demand.
The hardware experiment environment of this article is configured as CPU Intel Xeon E5-2630V4 (10 cores, clocked at 2.2 GHz), with a storage capacity of 128 GB. The MECDG model is deployed on a symmetric multi-processing node, which is equipped with 2 NVIDIA 2080Ti graphics cards, and the data is stored on a local disk with a storage capacity of 1TB. The experiment is based on the Keras deep learning framework, adopts Adam optimizer with learning rate 2.5 × 10⁻⁴, and decreases the learning rate to 2.5 × 10⁻⁵ for the last 100 batches to train the natural language generation model. Batch size is set as 32, whereas α and β are set to be 2 and 4, respectively. For all the types of chart images, we use the same HourglassNet -based network with 104 layers.

5.2. Comparative Experiments and Discussions

5.2.1. Chart Data Extraction Evaluation

To evaluate the performance of chart data extraction in MECDG, we introduce two benchmark models in Table 2. The first competitor employs ReVision [18] system to extract chart data. The second adopts ChartSense [22] method. The two methods are appropriate choices for us to evaluate the performance of MECDG on chart data. We used three basic evaluation methods to conduct comparative experiments including precision, recall, and f1 score as follows:
p r e c i s i o n   = t r u e   p o s i t i v e s t r u e   p o s i t i v e s + f a l s e   p o s i t i v e s
r e c a l l   = t r u e   p o s i t i v e s t r u e   p o s i t i v e s + f a l s e   n e g a t i v e s
f 1 s c o r e   = 2 · p r e c i s i o n · r e c a l l p r e c i s i o n + r e c a l l
where t r u e   p o s i t i v e s is the positive sample predicted to be positive by the model, f a l s e   p o s i t i v e s is the negative sample predicted to be positive by the model, and f a l s e   n e g a t i v e s is the positive sample predicted to be negative by the model.
The detailed comparison results are shown in Table 2. We have given the values of three indicators for each method in three different chart types, including bar chart, scatter chart, and line chart. To reflect on the overall performance more intuitively, the average value is also displayed at the bottom of Table 2. Limited by the size of the table, we use “Prec” for p r e c i s i o n , “Rec” for r e c a l l , and “F1” for f 1   score here.
It can be seen from the table that the average precision of this method in various charts is 90.1%, which is significantly higher than ReVision and ChartSense. Especially, the data extraction precision of this method can reach 91.2% on the bar graph. The intuitive reason for this result is that the key points in the bar chart are more prominent, and therefore it is more conducive to use CornerNet to extract chart data.
Since chart text extraction and key point extraction are performed independently, the evaluation value under these two steps is given respectively. In the first step, we extract the title, coordinates, and legend data from the dataset as a comparison. In the second step, we manually mark the coordinates of the key points as a comparison standard. The results are as Table 3:
It can be observed that both parts have good performance, and the result of the text extraction part is a little worse than key point extraction, but it is actually sufficient for the extraction of chart data.

5.2.2. Chart Description Generation Evaluation

The language description is flexible and changeable, as is the chart description generation. Unlike general deep learning-based tasks, the effectiveness of the chart description generated by the NLG model is difficult to measure. In many cases, the expressions are different but the description may be appropriate. We adopt bilingual evaluation understudy (BLEU) [42] as the evaluation method, which is used to evaluate the quality of translated text in machine translation. This method mainly evaluates the text by comparing the similarity between the machine-translated text and the human-translated text. Generally, the higher the similarity, the higher the quality. Based on this concept, we can also use BLEU to evaluate the chart description by comparing the generated description with the high-quality expected description. First calculate the score of each generated description, and then average the scores of all descriptions to get the overall quality score. The relevant equation is defined as:
P n = i E k K min ( h k ( c i ) , min j M h k ( s i , j ) ) i E k K min ( h k ( c i ) )
BP = { 1 , i f ( l c > l s ) e 1 l s l c , i f ( l c < l s )
BLEU = BP · exp ( n = 1 N W n log ( P n ) )
where P n represents n-gram precision of generated description c i compared with standard description s i , j , BP represents the brevity penalty, and BLEU represents the final score. h k ( c i ) represents the number of the k-th phrase in the generated description. h k ( s i , j ) represents the number of the k-th phrase in the standard description. Generally, P n is sufficient for effective evaluation, but the precision of n-gram may get better as the sentence length becomes shorter. BP is introduced to punish too short descriptions. l c represents the length of generated description and l s represents the length of standard description. To balance the effect of the n-order statistics, calculate the geometric weighted average, and then multiply it by the length penalty factor to get the BLEU score. The value of BLEU is always a number between 0 and 1, and the closer to 1, the higher the quality of the generated description.
In this section of the comparative experiment, we introduce two benchmark models, including origin RNN and LSTM models. The BLEU value results are as follows in Table 4:
Obviously, MECDG greatly improves the quality of description by splitting the chart description into two parts, including intention recognition and description generation. In this way, the adverse effects of the chart attribute values and numerical data on the semantic understanding of the model are avoided.

5.3. Application Case in Manufacturing Enterprise

We apply MECDG proposed in this paper to an enterprise’s quality data integration and visual analysis platform [43], which integrates, manages, and analyzes the data generated by the company in a unified manner. There are four main parts in this platform: data management, algorithm management, data analysis, and data visualization, so we add MECDG to the algorithm management module according to the access rules and specifications of the platform, and apply it as one of the analysis algorithms for manufacturing chart data. In the analysis platform, we upload the chart data in data management module first, then use MECDG to analyze the chart in data analysis module to get chart description, and finally we display the description in the data visualization module.
Figure 5 shows the implementation of the MECDG method for chart analysis on the enterprise interactive platform. The figure on the left lists the interaction statistics in the platform, including interaction time, content, and user information, while other two figures show the operation of chart information analysis and extraction.
Firstly, manufacturing users manually upload a chart image that needs to be analyzed. Below the image are the requirements for the uploaded image, including format and size. Secondly, click the “Start Extraction” button to extract the data information of the chart image. In the result interface, manufacturing users can directly click “Extraction Result” to obtain the extracted chart data, which is displayed in a table on the web page, including data serial number, data type, and content, or click “Analysis Result” to enter the chart analysis page. In the chart analysis page, manufacturing users enter analysis requirements and click the “Search” button to obtain the desired chart analysis description on the web page.

5.4. Evaluation and Discussion

In this section, we mainly evaluate the MECDG method applied in manufacturing enterprises of the CPSS environment from two aspects of practicality and effectiveness.

5.4.1. Evaluating the Practicality of MECDG Model

The goal of the first phase is to collect as much feature information as possible from the chart of the manufacturing enterprises for further text description generation. We first create the chart dataset MECD of the manufacturing enterprises and then run the extraction algorithm on these charts to capture text and data information. We use two methods to extract data and text information, respectively, to ensure the completeness and accuracy of information extraction. The dataset includes two parts: the charts generated by the Vega system and the charts of the manufacturing companies for the reason of that the number of chart collected by the manufacturing companies is limited. We use the Vega system, which the dataset generates and is also used in many chart data extraction researches to improve the generalization ability of the model. Our dataset contains three chart types, which can roughly represent the chart types of manufacturing companies.
Based on these extracted chart information, the second phase is illustrated by a practical example of the chart description in the manufacturing enterprise’s workshop, which is described as: “In the ‘Workshop order count in the first half of 2020’ chart, workshop 1–3 have an increase trend.” Figure 5 presents the graphical user interface for the chart text description in the manufacturing enterprise data analysis platform. In the search box below the uploaded chart, the users enter the key text of the chart analysis that they want to get and press “Enter.” Then, the platform will call the model to obtain the results that need to be displayed through two parts: chart data extraction and description generation. The final chart description will be displayed in the result part below the figure. This method greatly improves the ability of manufacturing enterprises to analyze and understand chart data.

5.4.2. Evaluating the Effectiveness of MECDG Model

A difficulty in generating chart text description is, how to evaluate the quality of the generated results. There is no uniform standard. Therefore, a model of generating chart text description is usually evaluated by the performance based on “ground truth,” which relies on human objective evaluation. We assembled a questionnaire with the ground truth generated by the model conduct computational experiments to assess the statistical accuracy of the model.
To evaluate the description quality generated by the model, we randomly sent online questionnaires to data analysts, information graphics designers, UI designers, data visualization technicians, and corporate management users of a manufacturing company, and obtained a total of 60 valid responses. In the questionnaire, the respondents mainly evaluated the descriptions generated by using the model. The questionnaire contained the processing results of 10 different types of chart data. Design scores were based on the recognition of the description text. After collecting and analyzing the questionnaires, the results were statistically analyzed. The specific results are shown in Figure 6.
The results in the figure show that among the four evaluation criteria for the description text, most of the respondents gave quite satisfactory evaluations, which means that our model can meet the needs of users and generate correct and understandable descriptions. We also received many suggestions that look forward to more diversified text descriptions, and these problems can be further improved by expanding the corpus data in the future.
We also compared the results with the traditional natural language template generation method. Figure 7 shows the semantic expression using the template method in manufacturing enterprise platform and pre-setting the maximum and minimum expression methods. As shown in Figure 7, compared with the chart description generated by the MECDG method in Figure 5, the traditional template-based method requires rigid expressions to be set in advance, and when the needs increase, the semantic description will be more cumbersome and difficult to read. However, the corresponding analysis results displayed according to the input requirements can make the chart analysis results more targeted and readable.

5.4.3. Discussion

The MECDG approach is more user-friendly and interactive than the traditional pipeline model of chart analysis, because in the process of enterprise application, chart images and analysis requirements are given by the user in the interactive system, which can achieve “what you want is what you get.” Especially in manufacturing enterprises under the CPSS scenario, what is valuable is not only the results of data analysis but also the interaction information between the enterprise and the platform, such as interaction requirements. Through the analysis of the interactive information in the application process, enterprises and society can explore the deeper needs of users, so as to make more intelligent decisions on the production and future planning of manufacturing enterprises.
As mentioned above, each functional module in the MECDG method is independent. The advantage is that the results produced at each phase of the model are very intuitive and interpretable, but the model will appear more redundant. At the same time, in the analysis and generation phase, the model uses self-collected manufacturing enterprise dataset for training, and the dataset is relatively small. In future research, we consider organizing the chart data extraction and analysis process into an integrated model using more appropriate strategies, and at the same time use larger and more credible datasets in training process to improve the quality of chart analysis results.
The MECDG method is actually an image description model. It can extract data from different types of chart image and use the extraction results to generate chart descriptions. This method can be easily extended to other fields, such as using the extracted chart data to redesign and improve chart visualization to improve the comprehensibility of chart, reducing chart design bias or improving their aesthetics, and designing accessibility systems with generated chart description, which can express the chart information in a sound or tactile way through wearable devices to help visually impaired users understand charts.

6. Conclusions

This paper proposes a two-phase unified model to analyze the unstructured chart data of manufacturing enterprises in the CPSS environment. The first phase presents an approach to recognize and extract data and text information from different types of charts. The model uses convolutional neural network and OCR technology to obtain chart data characteristics as basic data for further generating description. The second phase presents an approach to generate corresponding chart feature information descriptions according to user needs. The contributions of this study include the following aspects: (1) Instead of analyzing specific type of chart, the proposed MECDG method can analyze three different types of charts. (2) The MECDG method allows manufacturing users to obtain visual analysis from the chart in a more interactive way. The chart description generated according to user needs makes the application of the method more flexible. (3) The experiments proved that the proposed MECDG method is efficient for manufacturing a chart description generation than other latest methods.
However, our model applied to the manufacturing enterprise data analysis platform is in an early phase of and has some limitations.
(1) To analyze more types and more complex charts, the proposed model should optimize the model in the data extraction phase.
(2) To generate more accurate and flexible language descriptions, we need to continuously enrich the corpus to improve the language quality of the generated text descriptions and descriptive ability.

Author Contributions

Conceptualization and investigation, L.C. and K.Z.; data curation, K.Z.; writing—original draft preparation, L.C.; writing—review and editing, L.C. and K.Z. Both authors have read and agreed to the published version of the manuscript.

Funding

This research was funded by the National Science Fund Subsidized Project, grant number 51675108, Shaanxi Industrial Research Project, grant number 2014K05-43, and the Guangdong Provincial Key Laboratory of Computer Integrated Manufacturing, grant number CIMSOF2016001.

Institutional Review Board Statement

Not applicable.

Informed Consent Statement

Not applicable.

Data Availability Statement

Part of the chart data can be found on the public data set on the Internet, the address is https://vega.github.io/vega/ (accessed on 18 July 2021).

Conflicts of Interest

The authors declare no conflict of interest.

References

  1. Leng, J.; Jiang, P.; Liu, C.; Wang, C. Contextual self-organizing of manufacturing process for mass individualization: A cyber-physical-social system approach. Enterp. Inf. Syst. 2020, 14, 1124–1149. [Google Scholar] [CrossRef]
  2. Zhou, Y.; Yu, F.R.; Chen, J.; Kuo, Y. Cyber-physical-social systems: A state-of-the-art survey, challenges and opportunities. IEEE Commun. Surv. Tutor. 2020, 22, 389–425. [Google Scholar] [CrossRef]
  3. Yilma, B.A.; Panetto, H.; Naudet, Y. Systemic formalisation of cyber-physical-social system (CPSS): A systematic literature review. Comput. Ind. 2021, 129, 103458. [Google Scholar] [CrossRef]
  4. Leng, J.; Jiang, P. A deep learning approach for relationship extraction from interaction context in social manufacturing par-adigm. Knowl. Based Syst. 2016, 100, 188–199. [Google Scholar] [CrossRef]
  5. Leng, J.; Zhang, H.; Yan, D.; Liu, Q.; Chen, X.; Zhang, D. Digital twin-driven manufacturing cyber-physical system for parallel controlling of smart workshop. J. Ambient. Intell. Humaniz. Comput. 2019, 10, 1155–1166. [Google Scholar] [CrossRef]
  6. Jha, A.V.; Appasani, B.; Ghazali, A.N.; Pattanayak, P.; Gurjar, D.S.; Kabalci, E.; Mohanta, D.K. Smart grid cyber-physical systems: Communication technologies, standards and challenges. Wirel. Netw. 2021, 27, 2595–2613. [Google Scholar] [CrossRef]
  7. Feng, J.; Yang, L.T.; Gati, N.J.; Xie, X.; Gavuna, B.S. Privacy-preserving computation in cyber-physical-social systems: A survey of the state-of-the-art and perspectives. Inf. Sci. 2020, 527, 341–355. [Google Scholar] [CrossRef]
  8. Leng, J.; Jiang, P. Evaluation across and within collaborative manufacturing networks: A comparison of manufacturers’ in-teractions and attributes. Int. J. Prod. Res. 2018, 56, 5131–5146. [Google Scholar] [CrossRef]
  9. Luo, X.; Yuan, Y.; Zhang, K.; Xia, J.; Zhou, Z.; Chang, L.; Gu, T. Enhancing statistical charts: Toward better data visualization and analysis. J. Vis. 2019, 22, 819–832. [Google Scholar] [CrossRef]
  10. Ren, D.; Lee, B.; Brehmer, M. Charticulator: Interactive construction of bespoke chart layouts. IEEE Trans. Vis. Comput. Graph. 2019, 25, 789–799. [Google Scholar] [CrossRef] [PubMed]
  11. Zeng, W.; Dong, A.; Chen, X.; Cheng, Z.-L. VIStory: Interactive storyboard for exploring visual information in scientific publications. J. Vis. 2021, 24, 69–84. [Google Scholar] [CrossRef]
  12. Davila, K.; Setlur, S.; Doermann, D.; Bhargava, U.K.; Govindaraju, V. Chart mining: A survey of methods for automated chart analysis. IEEE Trans. Pattern Anal. Mach. Intell. 2020, 1. [Google Scholar] [CrossRef]
  13. Burns, R.; Carberry, S.; Schwartz, S.E. An automated approach for the recognition of intended messages in grouped bar charts. Comput. Intell. 2019, 35, 955–1002. [Google Scholar] [CrossRef]
  14. Xu, Z.; Huang, D.; Min, T.; Ou, Y. A fault diagnosis method of rolling bearing integrated with cooperative energy feature extraction and improved least-squares support vector machine. Math. Probl. Eng. 2020, 2020, 6643167. [Google Scholar]
  15. De Oliveira, C.L.T.; Silva, A.T.D.A.; Campos, E.M.; Araujo, T.D.O.; Mota, M.P.; Meiguins, B.S.; De Morais, J.M. Proposal and evaluation of textual description templates for bar charts vocalization. In Proceedings of the 2019 23rd International Conference Information Visualisation (IV); Institute of Electrical and Electronics Engineers (IEEE), Paris, France, 2–5 July 2019; pp. 163–169. [Google Scholar]
  16. Sohn, C.; Choi, H.; Kim, K.; Park, J.; Noh, J. Line Chart Understanding with Convolutional Neural Network. Electronics 2021, 10, 749. [Google Scholar] [CrossRef]
  17. Cliche, M.; Rosenberg, D.; Madeka, D.; Yee, C. Scatteract: Automated extraction of data from scatter plots. In Transactions on Petri Nets and Other Models of Concurrency XV; Springer Science and Business Media LLC: Berlin, Germany, 2017; pp. 135–150. [Google Scholar]
  18. Savva, M.; Kong, N.; Chhajta, A.; Fei-Fei, L.; Agrawala, M.; Heer, J. ReVision: Automated classification, analysis and redesign of chart images. In Proceedings of the 24th Annual ACM Symposium on User Interface Software and Technology, Santa Barbara, CA, USA, 16–19 October 2011; pp. 393–402. [Google Scholar]
  19. Choudhury, S.R.; Wang, S.; Giles, C.L. Curve separation for line graphs in scholarly documents. In Proceedings of the 16th ACM/IEEE-CS on Joint Conference on Digital Libraries; Association for Computing Machinery (ACM), Newark, NJ, USA, 19–23 June 2016; pp. 277–278. [Google Scholar]
  20. Siegel, N.; Horvitz, Z.; Levin, R.; Divvala, S.; Farhadi, A. FigureSeer: Parsing result-figures in research papers. In Transactions on Petri Nets and Other Models of Concurrency XV; Springer: Amsterdam, The Netherlands, 2016; pp. 664–680. [Google Scholar] [CrossRef]
  21. Choi, J.; Jung, S.; Park, D.G.; Choo, J.; Elmqvist, N. Visualizing for the non-visual: Enabling the visually impaired to use visualization. Comput. Graph. Forum 2019, 38, 249–260. [Google Scholar] [CrossRef]
  22. Jung, D.; Kim, W.; Song, H.; Hwang, J.I.; Lee, B.; Kim, B.; Seo, J. Chartsense: Interactive data extraction from chart images. In Proceedings of the 2017 CHI Conference on Human Factors in Computing Systems, Denver, CO, USA, 6–11 May 2017; pp. 6706–6717. [Google Scholar]
  23. Poco, J.; Heer, J. Reverse-engineering visualizations: Recovering visual encodings from chart images. Comput. Graph. Forum 2017, 36, 353–363. [Google Scholar] [CrossRef]
  24. Luo, J.; Li, Z.; Wang, J.; Lin, C.-Y. ChartOCR: Data extraction from charts images via a deep hybrid framework. In Proceedings of the 2021 IEEE Winter Conference on Applications of Computer Vision (WACV), Virtual. 5 January 2021; pp. 1916–1924. [Google Scholar]
  25. Al-Zaidy, R.A.; Giles, C.L. Automatic extraction of data from bar charts. In Proceedings of the 8th International Conference on Knowledge Capture, ACM, Palisades, NY, USA, 7–10 October 2015; p. 30. [Google Scholar]
  26. Zadeh, L. A prototype-centered approach to adding deduction capability to search engines-the concept of protoform. In Proceedings of the IEEE Intelligent Systems, New Orleans, LA, USA, 7 August 2002; pp. 523–525. [Google Scholar]
  27. Bryan, C.; Ma, K.; Woodring, J. Temporal summary images: An approach to narrative visualization via interactive annotation generation and placement. IEEE Trans. Vis. Comput. Graph. 2017, 23, 511–520. [Google Scholar] [CrossRef]
  28. Hullman, J.; Diakopoulos, N.; Adar, E. Contextifier: Automatic generation of annotated stock visualizations. In Proceedings of the SIGCHI Conference on Human Factors in Computing Systems, Paris, France, 27 April–2 May 2013; pp. 2707–2716. [Google Scholar]
  29. Mahmood, A.; Bajwa, I.; Qazi, K. An automated approach for interpretation of statistical graphics. In Proceedings of the International Conference on Intelligent Human-Machine Systems and Cybernetics, Hangzhou, China, 26–27 August 2014; pp. 376–379. [Google Scholar]
  30. Kallimani, J.S.; Srinivasa, K.G.; Eswara, R.B. Extraction and interpretation of charts in technical documents. In Proceedings of the 2013 International Conference on Advances in Computing, Communications and Informatics (ICACCI), IEEE, Mysore, India, 22–25 August 2013; pp. 382–387. [Google Scholar]
  31. Liu, C.; Xie, L.; Han, Y.; Wei, D.; Yuan, X. AutoCaption: An approach to generate natural language description from visualization automati-cally. In Proceedings of the IEEE Pacific Visualization Symposium (PacificVis), Tianjin, China, 14–17 April 2020; pp. 191–195. [Google Scholar]
  32. Law, H.; Deng, J. CornerNet: Detecting Objects as Paired Keypoints. arXiv 2018, arXiv:1808.01244. [Google Scholar]
  33. Smith, R. An overview of the Tesseract OCR engine. In Proceedings of the Ninth International Conference on Document Analysis and Recognition (ICDAR 2007), Curitiba, Parana, 23–26 September 2007; Volume 2, pp. 629–633. [Google Scholar]
  34. Geler, Z.; Kurbalija, V.; Ivanović, M.; Radovanović, M. Weighted kNN and constrained elastic distances for time-series classification. Expert Syst. Appl. 2020, 162, 113829. [Google Scholar] [CrossRef]
  35. Newell, A.; Yang, K.; Jia, D. Stacked Hourglass Networks for Human Pose Estimation. In European Conference on Computer Vision; Springer International Publishing: New York, NY, USA, 2016; pp. 483–499. [Google Scholar]
  36. Cambria, E.; White, B. Jumping NLP Curves: A review of natural language processing research. IEEE Comput. Intell. Mag. 2014, 9, 48–57. [Google Scholar] [CrossRef]
  37. Young, T.; Hazarika, D.; Poria, S.; Cambria, E. Recent trends in deep learning based natural language processing. IEEE Comput. Intell. Mag. 2018, 13, 55–75. [Google Scholar] [CrossRef]
  38. Bai, X. Text classification based on LSTM and attention. In Proceedings of the 2018 Thirteenth International Conference on Digital Information Management (ICDIM), Porto, Portugal, 19–21 September 2018; pp. 29–32. [Google Scholar]
  39. Devlin, J.; Chang, M.W.; Lee, K.; Toutanova, K. BERT: Pre-training of deep bidirectional transformers for language understanding. arXiv 2018, arXiv:1810.04805. [Google Scholar]
  40. Park, J.; Yi, D.; Ji, S. Analysis of Recurrent Neural Network and Predictions. Symmetry 2020, 12, 615. [Google Scholar] [CrossRef]
  41. Satyanarayan, A.; Russell, R.; Heer, J.; Hoffswell, J.; Heer, J. Reactive vega: A streaming dataflow architecture for declarative interactive visual-ization. IEEE Trans. Vis. Comput. Graph. 2016, 22, 659–668. [Google Scholar] [CrossRef]
  42. Papineni, K.; Roukos, S.; Ward, T.; Zhu, W.J. BLEU: A method for automatic evaluation of machine translation. In Proceedings of the 40th Annual Meeting on Association for Computational Linguistics, Philadelphia, PA, USA, 7–12 July 2002; pp. 311–318. [Google Scholar]
  43. Chen, L.; Wu, M. Intelligent Workshop Quality Data Integration and Visual Analysis Platform Design. Comput. Integr. Manuf. Syst. 2021, 27, 1641–1649. [Google Scholar] [CrossRef]
Figure 1. Logic flow of MECDG method.
Symmetry 13 01552 g001
Figure 2. Chart text extraction process.
Symmetry 13 01552 g002
Figure 3. Key point extraction process of chart.
Symmetry 13 01552 g003
Figure 4. The MECDG model structure.
Symmetry 13 01552 g004
Figure 5. Application case results in manufacturing enterprise platform.
Symmetry 13 01552 g005
Figure 6. Questionnaire results statistics.
Symmetry 13 01552 g006
Figure 7. Semantic results generated by template method in manufacturing enterprise platform.
Symmetry 13 01552 g007
Table 1. Dataset table.
Vega ChartsManufacture Charts
Bar charts53582123
Line charts33601254
Scatter charts2123674
Table 2. Evaluation comparison with other methods.
MECDGReVisionChartSense
PrecRecF1PrecRecF1PrecRecF1
Bar91.2%94.6%92.9%78.3%84.6%81.3%90.7%92.1%91.3%
Scatter90.5%95.1%92.7%79.1%87.1%82.9%86.9%90.4%88.6%
Line88.7%92.4%90.5%73.8%79.8%76.6%78.2%85.3%81.5%
Average90.1%94.0%92.1%77.1%83.8%80.3%85.3%89.3%87.2%
Table 3. Experimental results of chart text extraction and key point extraction.
PrecRecF1
Chart text extraction88.2%96.3%92.1%
Key point extraction91.8%95.2%93.5%
Table 4. Comparison of the BLEU value of three methods.
BLEU
RNN63.2%
LSTM73.5%
MECDG92.7%
Publisher’s Note: MDPI stays neutral with regard to jurisdictional claims in published maps and institutional affiliations.

