Abstract
To beat competition and obtain valuable information, decision-makers must conduct in-depth machine learning or data mining for data analytics. Traditionally, clustering and classification are two common methods used in machine mining. For clustering, data are divided into various groups according to the similarity or common features. On the other hand, classification refers to building a model by given training data, where the target class or label is predicted for the test data. In recent years, many researchers focus on the hybrid of clustering and classification. These techniques have admirable achievements, but there is still room to ameliorate performances, such as distributed process. Therefore, we propose clustering and classification based on distributed automatic feature engineering (AFE) for customer segmentation in this paper. In the proposed algorithm, AFE uses artificial bee colony (ABC) to select valuable features of input data, and then RFM provides the basic data analytics. In AFE, it first initializes the number of cluster k. Moreover, the clustering methods of k-means, Wald method, and fuzzy c-means (FCM) are processed to cluster the examples in variant groups. Finally, the classification method of an improved fuzzy decision tree classifies the target data and generates decision rules for explaining the detail situations. AFE also determines the value of the split number in the improved fuzzy decision tree to increase classification accuracy. The proposed clustering and classification based on automatic feature engineering is distributed, performed in Apache Spark platform. The topic of this paper is about solving the problem of clustering and classification for machine learning. From the results, the corresponding classification accuracy outperforms other approaches. Moreover, we also provide useful strategies and decision rules from data analytics for decision-makers.
1. Introduction
With the rapid changes of the marketing environment, it is fiercely competitive and is becoming more and more complicated for decision-making [1,2]. The decision-makers always want to process data analytics to pursue the maximum profits. To make profits, the primary task is to discover the useful information of customers. In addition, there is a need to carry out strategies for customer segmentation to promote the number of customers and amount of consumption [3,4,5]. Generally, a dataset obtained from marketing always includes much raw data, such as products and items. It is hard for machine mining to find the useful information between customer, transaction log, and purchase behavior. It is also impossible to make an effective strategy based on the basic statistics, because it may not be able to find the useful decision information.
In related works, RFM and clustering are used for customer segmentation. RFM means recency, frequency, and monetary value for marketing analysis [6,7,8]. It can analyze the important information for purchase amount, sales volume, and customer behavior, and it is a useful preprocess method for data analytics. For the clustering method, it is a process of aggregating datasets into different segmentations according to their similarities. It is a widely used algorithm in marketing analytics [9,10,11,12]. Recently, the integration of RFM and clustering provides more useful information for customer segmentation [13]. Combining clustering and RFM, it can adopt differentstrategies for various customers according to the results of clustering [14,15,16,17,18]. The hybrid of clustering and RFM is, indeed, able to divide the customers well, but it lacks interpretation and verification means [19]. The clustering method also needs to guess the initial number of clusters. Although several methods for guessing the initial number of clusters have been developed, they cannot clearly reflect the differences between variant customers and are difficult to use in real applications [20]. The classification method, such as a decision tree, could discover rules for decision-making [21]. A classification and regression tree (CART) uses the Gini index to create tree-like rules for decision-makers, and could provide useful information. However, CART could ameliorate the classification accuracy by improving the Gini index [22,23].
To solve the above drawbacks, AFE is a novel way to develop strategies for selecting useful subset features. It can find these useful features in datasets to generate a new set of features for clustering, and can promote the performance by deleting the irrelevant feature and the redundant features [24]. Moreover, it can initialize the number of clusters for clustering and adjust the value of parameters for classification. In this paper, we propose the most up-to-date issue of clustering and classification based on distributed automatic feature engineering for customer segmentation. In the proposed algorithm, AFE uses ABC to select valuable features and initialize the number of clusters. RFM provides the basic data analytics. The clustering methods of k-means, Wald method, and FCM are processed for customer segmentation. The classification method of an improved fuzzy decision tree generates classification accuracy and decision rules. AFE also determines the value of the split number in the improved fuzzy decision tree to increase classification accuracy. The proposed clustering and classification based on automatic feature engineering for customer segmentation is distributed performed in Apache Spark platform. It is dedicated to ameliorating the performance of machine learning in computer and engineering science and symmetry. The contributions of this paper are as follows:
- To use clustering technologies of Wald method, k-means, and FCM, which provides better clustering for customer segmentation.
- The proposed classification algorithm of the improved fuzzy decision tree can ameliorate the classification accuracy and provides decision rules for decision-makers.
- The proposed algorithm integrates the symmetry merit of clustering and classification for machine learning.
- AFE is used to select the useful features and adjust the number of clusters and the value of parameters of the improved fuzzy decision tree.
- Apache Spark provides the distributed environment for these above methods to improve the performance.
- We provide some useful strategies and decision rules for decision-makers.
We organize the sections in this paper as follows. First, we introduce the related approaches about AFE, RFM, Wald method, k-means, FCM, and the decision tree in Section 2. We present the proposed method of clustering and classification based on distributed AFE and data used in Section 3. In Section 4, we present results and discussions. Section 5 contains conclusions and suggestions.
2. The Related Approaches
In this section, we introduce the related approaches in the proposed methods. These approaches include AEF, RFM, k-means, Ward method, FCM, and the decision tree.
2.1. The Introduction of AFE and RFM
AFE is an important data preprocessing in many applications. It can ameliorate the performance of the classifier, because it can build models using the important selected features. In AFE, we use the wrapper method to assess the quality of selected features. It creates a subset of features by adopting the accuracy rate of the classifier as the performance measure, and then the classifier assesses the quality of the feature subset. Thereafter, the feature subset with the best performance is set as the selected features.
For RFM, it means recency, frequency, and monetary. It is a useful tool to rank customers in certain categories in numerical values. For recency, this means that customers have purchased products and it is more likely that they will remember the products for subsequent purchases [25]. The frequency of customers’ transactions may be affected by product type, purchase price, replenishment, or replacement demand. For monetary, the value of currency comes from the profit margin between the customer and the expenditure during the transaction.
2.2. The Introduction of k-Means, Ward Method, and FCM
k-means is one of the famous unsupervised learning techniques for cluster analysis. Cluster analysis is used to aggregate or divide a dataset into several clusters according to the similarity value. For k-means, it needs to decide the number of clusters (k) in advance. It starts with randomly generated centroids and iteratively calculates new centroids to converge to the final clusters. There are four steps in k-means [26].
Step 1: The positions of k centroids are generated randomly.
Step 2: Each data point in the dataset will be assigned to its nearest centroid, and then new centroids are generated.
Step 3: To recalculate the new clusters by assigning all data points to their nearest centroids, and then new clusters are created.
Step 4: The process will be iterated between step 2 and step 3 until the stop criteria has been met.
Ward method uses the minimum within-cluster variance to generate clusters. The method uses the error sum of squares (ESS) to calculate the distances from data points to the mth cluster. It is defined as the following equation:
where is the centroid of the mth cluster, and Xlm is the lth data point in the mth cluster.
Fuzzy c-means are one of the famous clustering techniques that assigns every data point (n) in a dataset belonging to every cluster (m) with a certain fuzzy value [27]. The fuzzy membership value is calculated as follows:
where is the fuzzy membership value for the data point belonging to the m cluster.
2.3. The Introduction of the Decision Tree
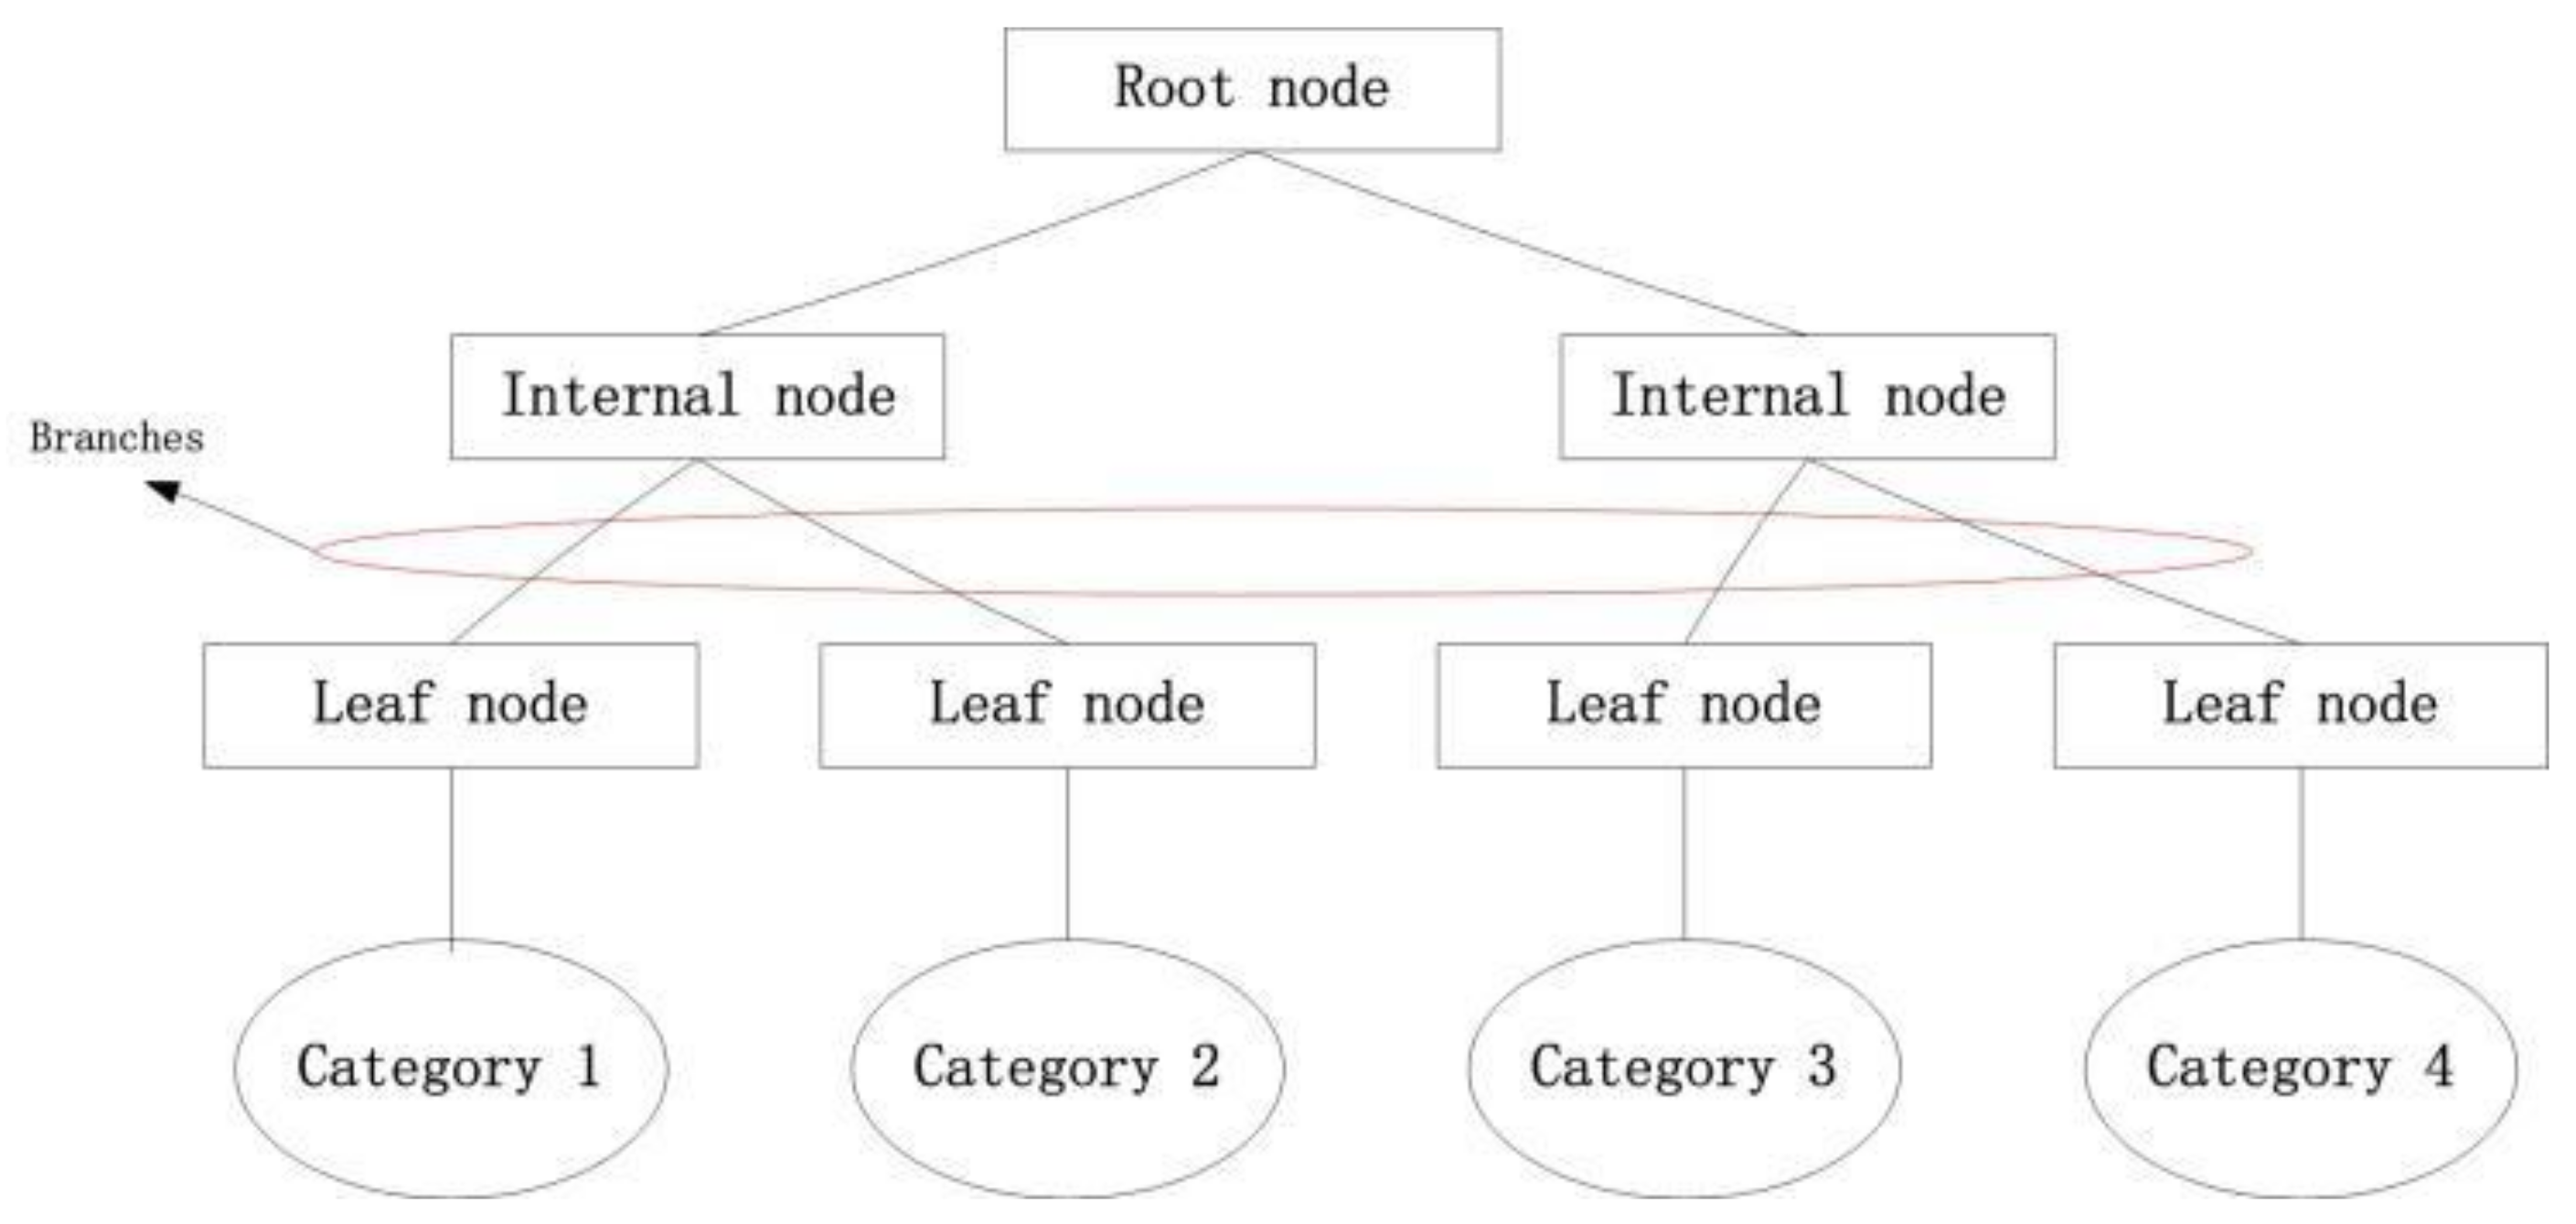
A decision tree is a tree structure that contains one root node, internal nodes, and leaf nodes [28]. Each leaf node corresponds to a decision rule. The root node and the internal node correspond to the attribute test that selects the best split data and the partition threshold of this attribute. Each node will divide the dataset into two nodes, respectively, according to the test attribute. The root node contains all the data points of the dataset, and so recursively moves down to the leaf node. Figure 1 shows the tree structure of a decision tree.
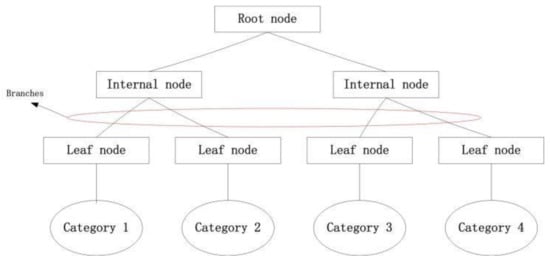
Figure 1.
The tree structure of a decision tree.
The Gini index is used to select the best explanatory variable and determine the split point of the best dichotomy of the explanatory variable. If there are k classes with the probability of data points belonging to class l for classification problems, the Gini index of the probability distribution is presented as follows [29]:
If a dataset T with n data points is split into k subsets with sizes , respectively, the Gini index of the split data is given by the following equation:
If a dataset T is divided into two parts: T1 and T2, according to whether the characteristic takes a specific value or not:
Under a binary decision tree, the Gini index of dataset T is defined as follows:
The Gini index represents the uncertainty for a dataset. The higher the Gini index is, the higher the purity of classification will be.
3. Methods and Data
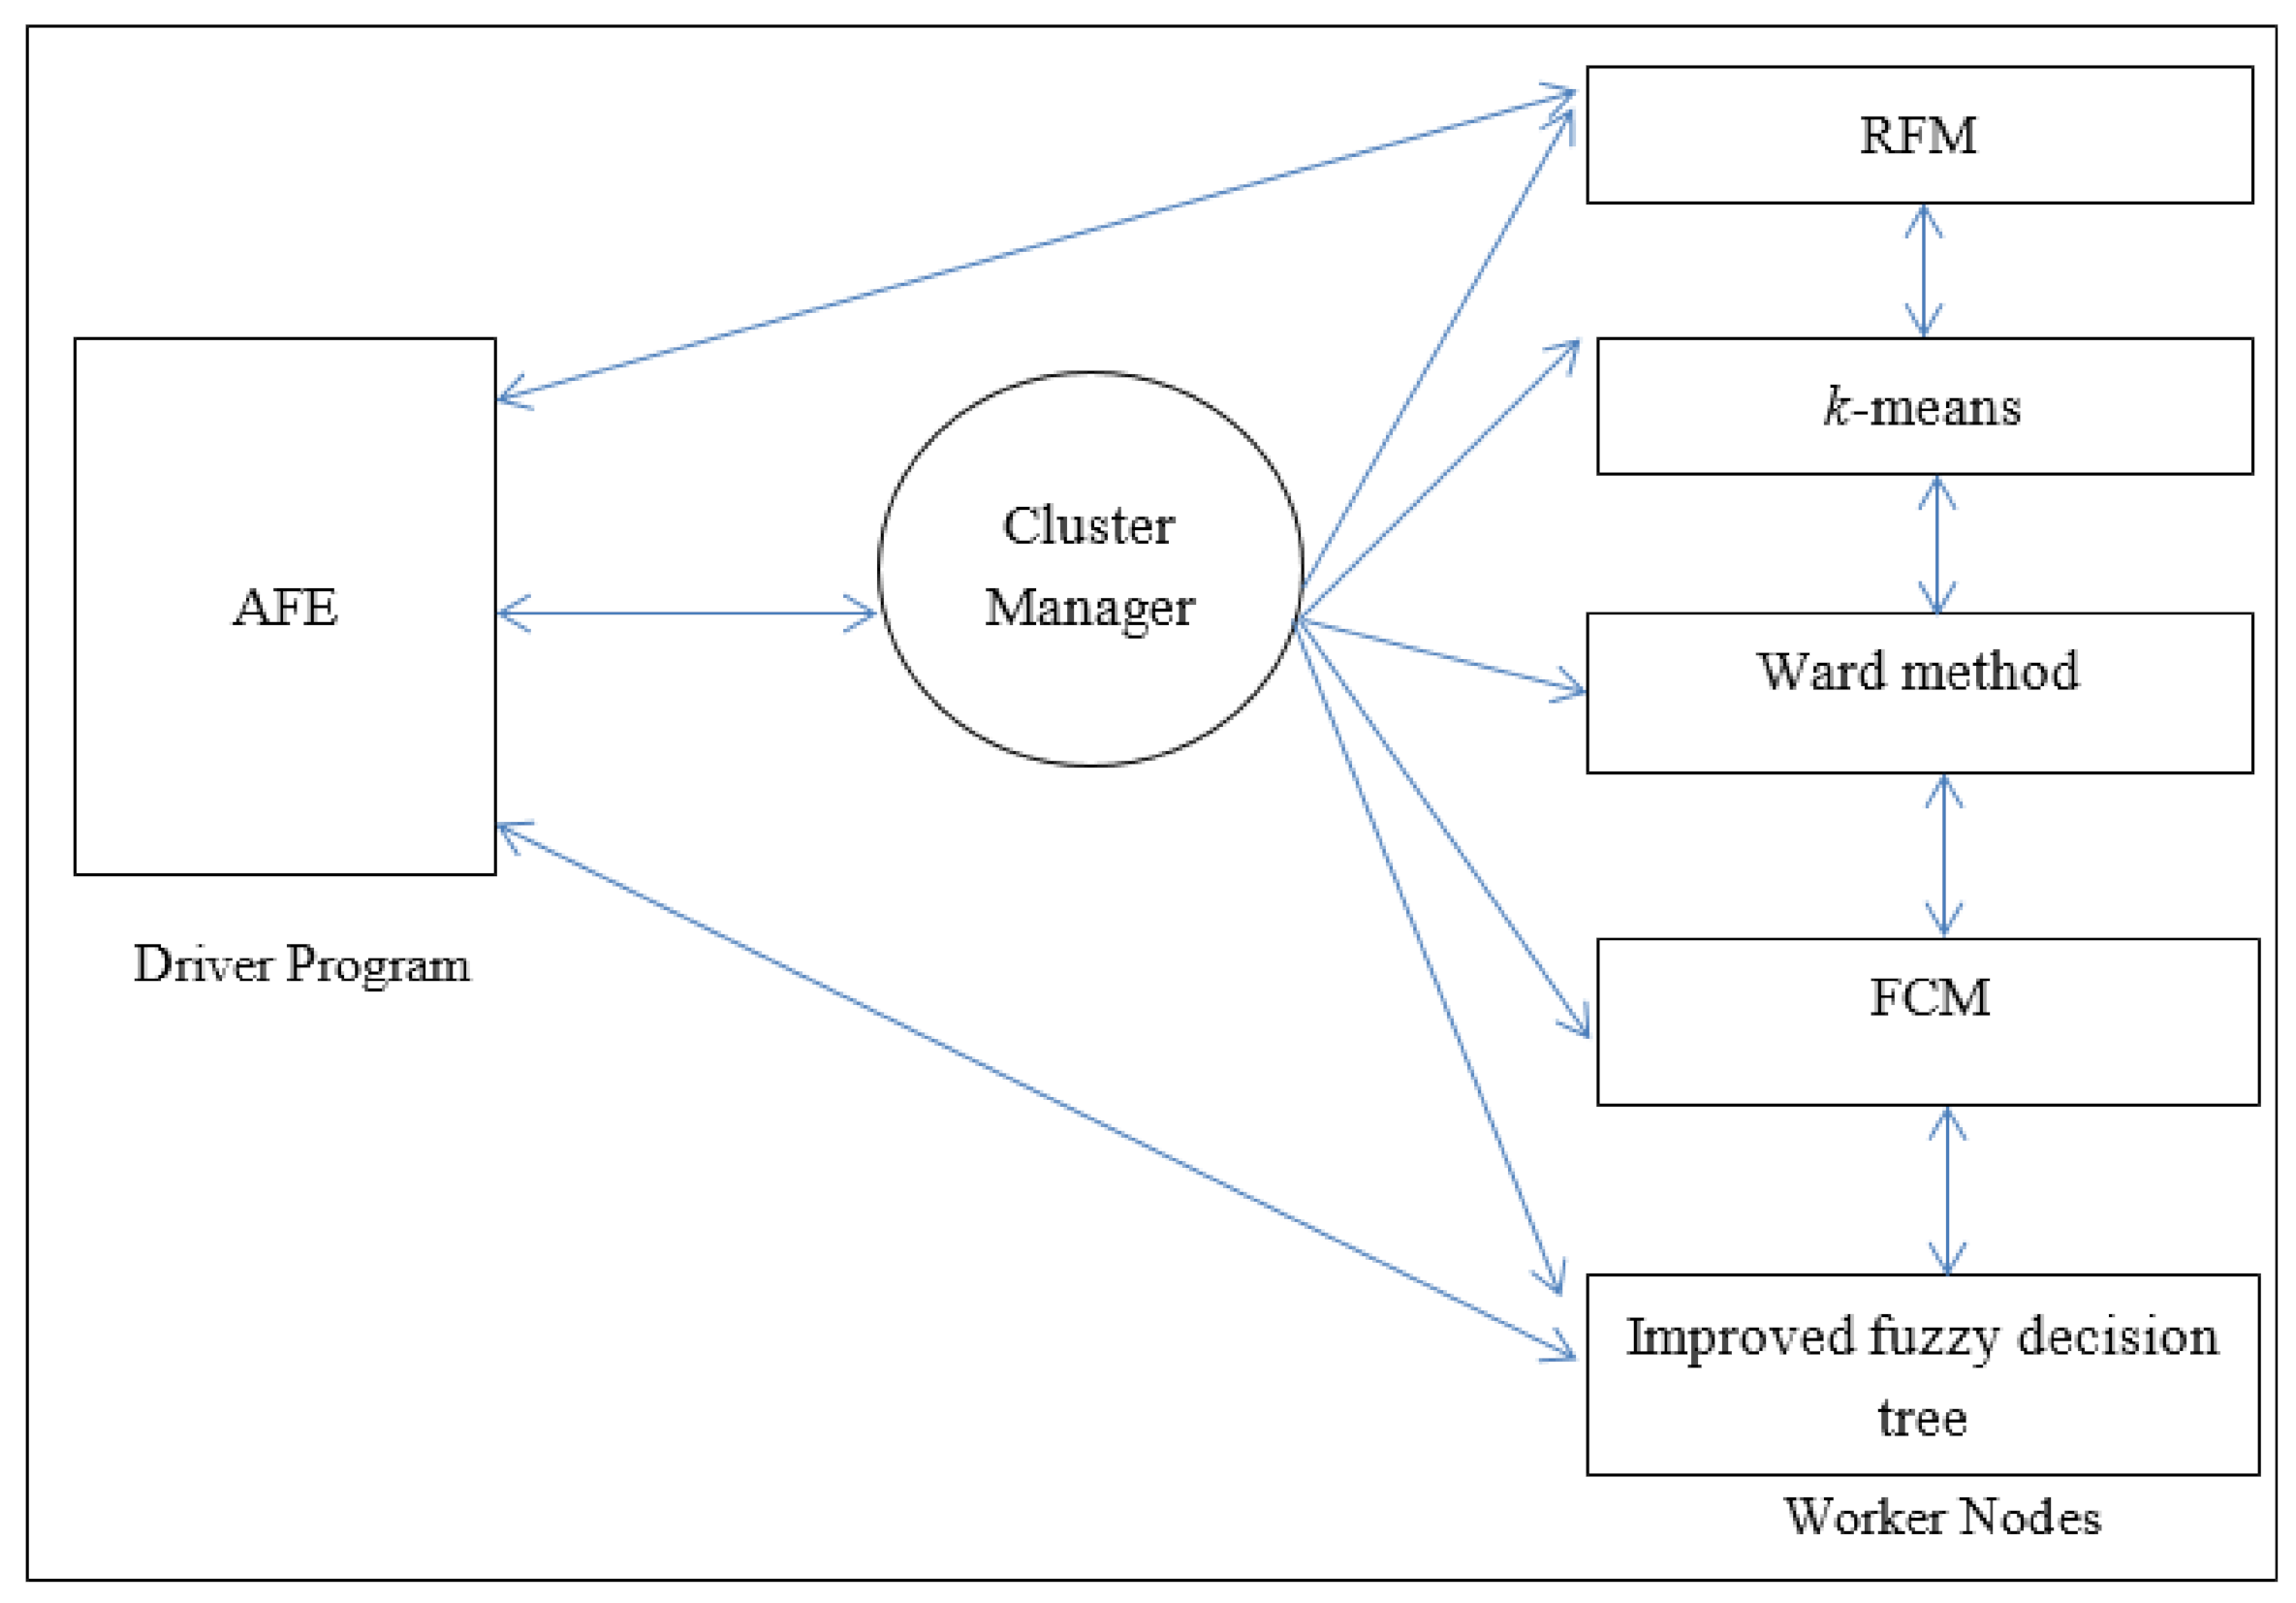
In this paper, we propose clustering and classification based on distributed AFE. In the proposed algorithm, it is based on Apache Spark with AFE, RFM, Wald method, k-means, FCM, and the improved fuzzy decision tree. Spark is an open and useful platform for large-scale data processing [30,31]. Moreover, it can run fast analytics against data of any size with in-memory execution. Figure 2 shows the architecture of the proposed algorithm. In Spark, AFE is the driver and main program that controls worker nodes to start or stop processes. Cluster manager dominates the resources of CPU and memory in the Spark platform. Worker nodes are processes which run computations according to the driver program. Figure 3 presents the flow chart of the proposed algorithm. In Figure 3, AFE selects useful features, determines the number of clusters (k), and adjusts the value of the split number for the improved fuzzy decision tree. Wald method, k-means, and FCM are executed to calculate the samples as predetermined clusters from AFE. Thereafter, the improved fuzzy decision tree is executed to generate decision rules and ameliorate the classification accuracy for decision-makers. It is noted that the value of the split number of the improved fuzzy decision tree is also determined by AFE. Finally, the proposed clustering and classification based on distributed AFE is recursively processed until the stop criterion has been met.
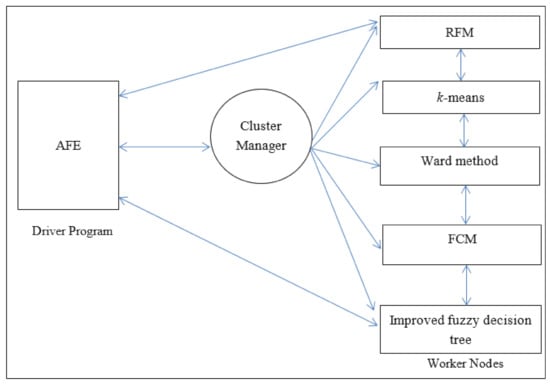
Figure 2.
The proposed clustering and classification based on distributed AFE.
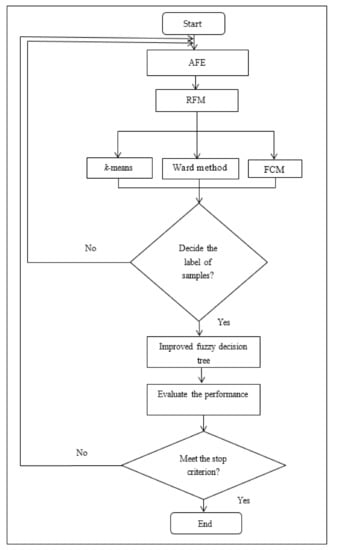
Figure 3.
The flow chart of the proposed clustering and classification based on distributed AFE.
In this paper, a supermarket provides the dataset from 1 January 2017 to 31 December 2018. There are 4376 customers, 105,170 transaction logs, and 11,171 products. This dataset is well preprocessed, and there are no missing values in this dataset. The detailed dataset is described in Table 1.

Table 1.
The used dataset.
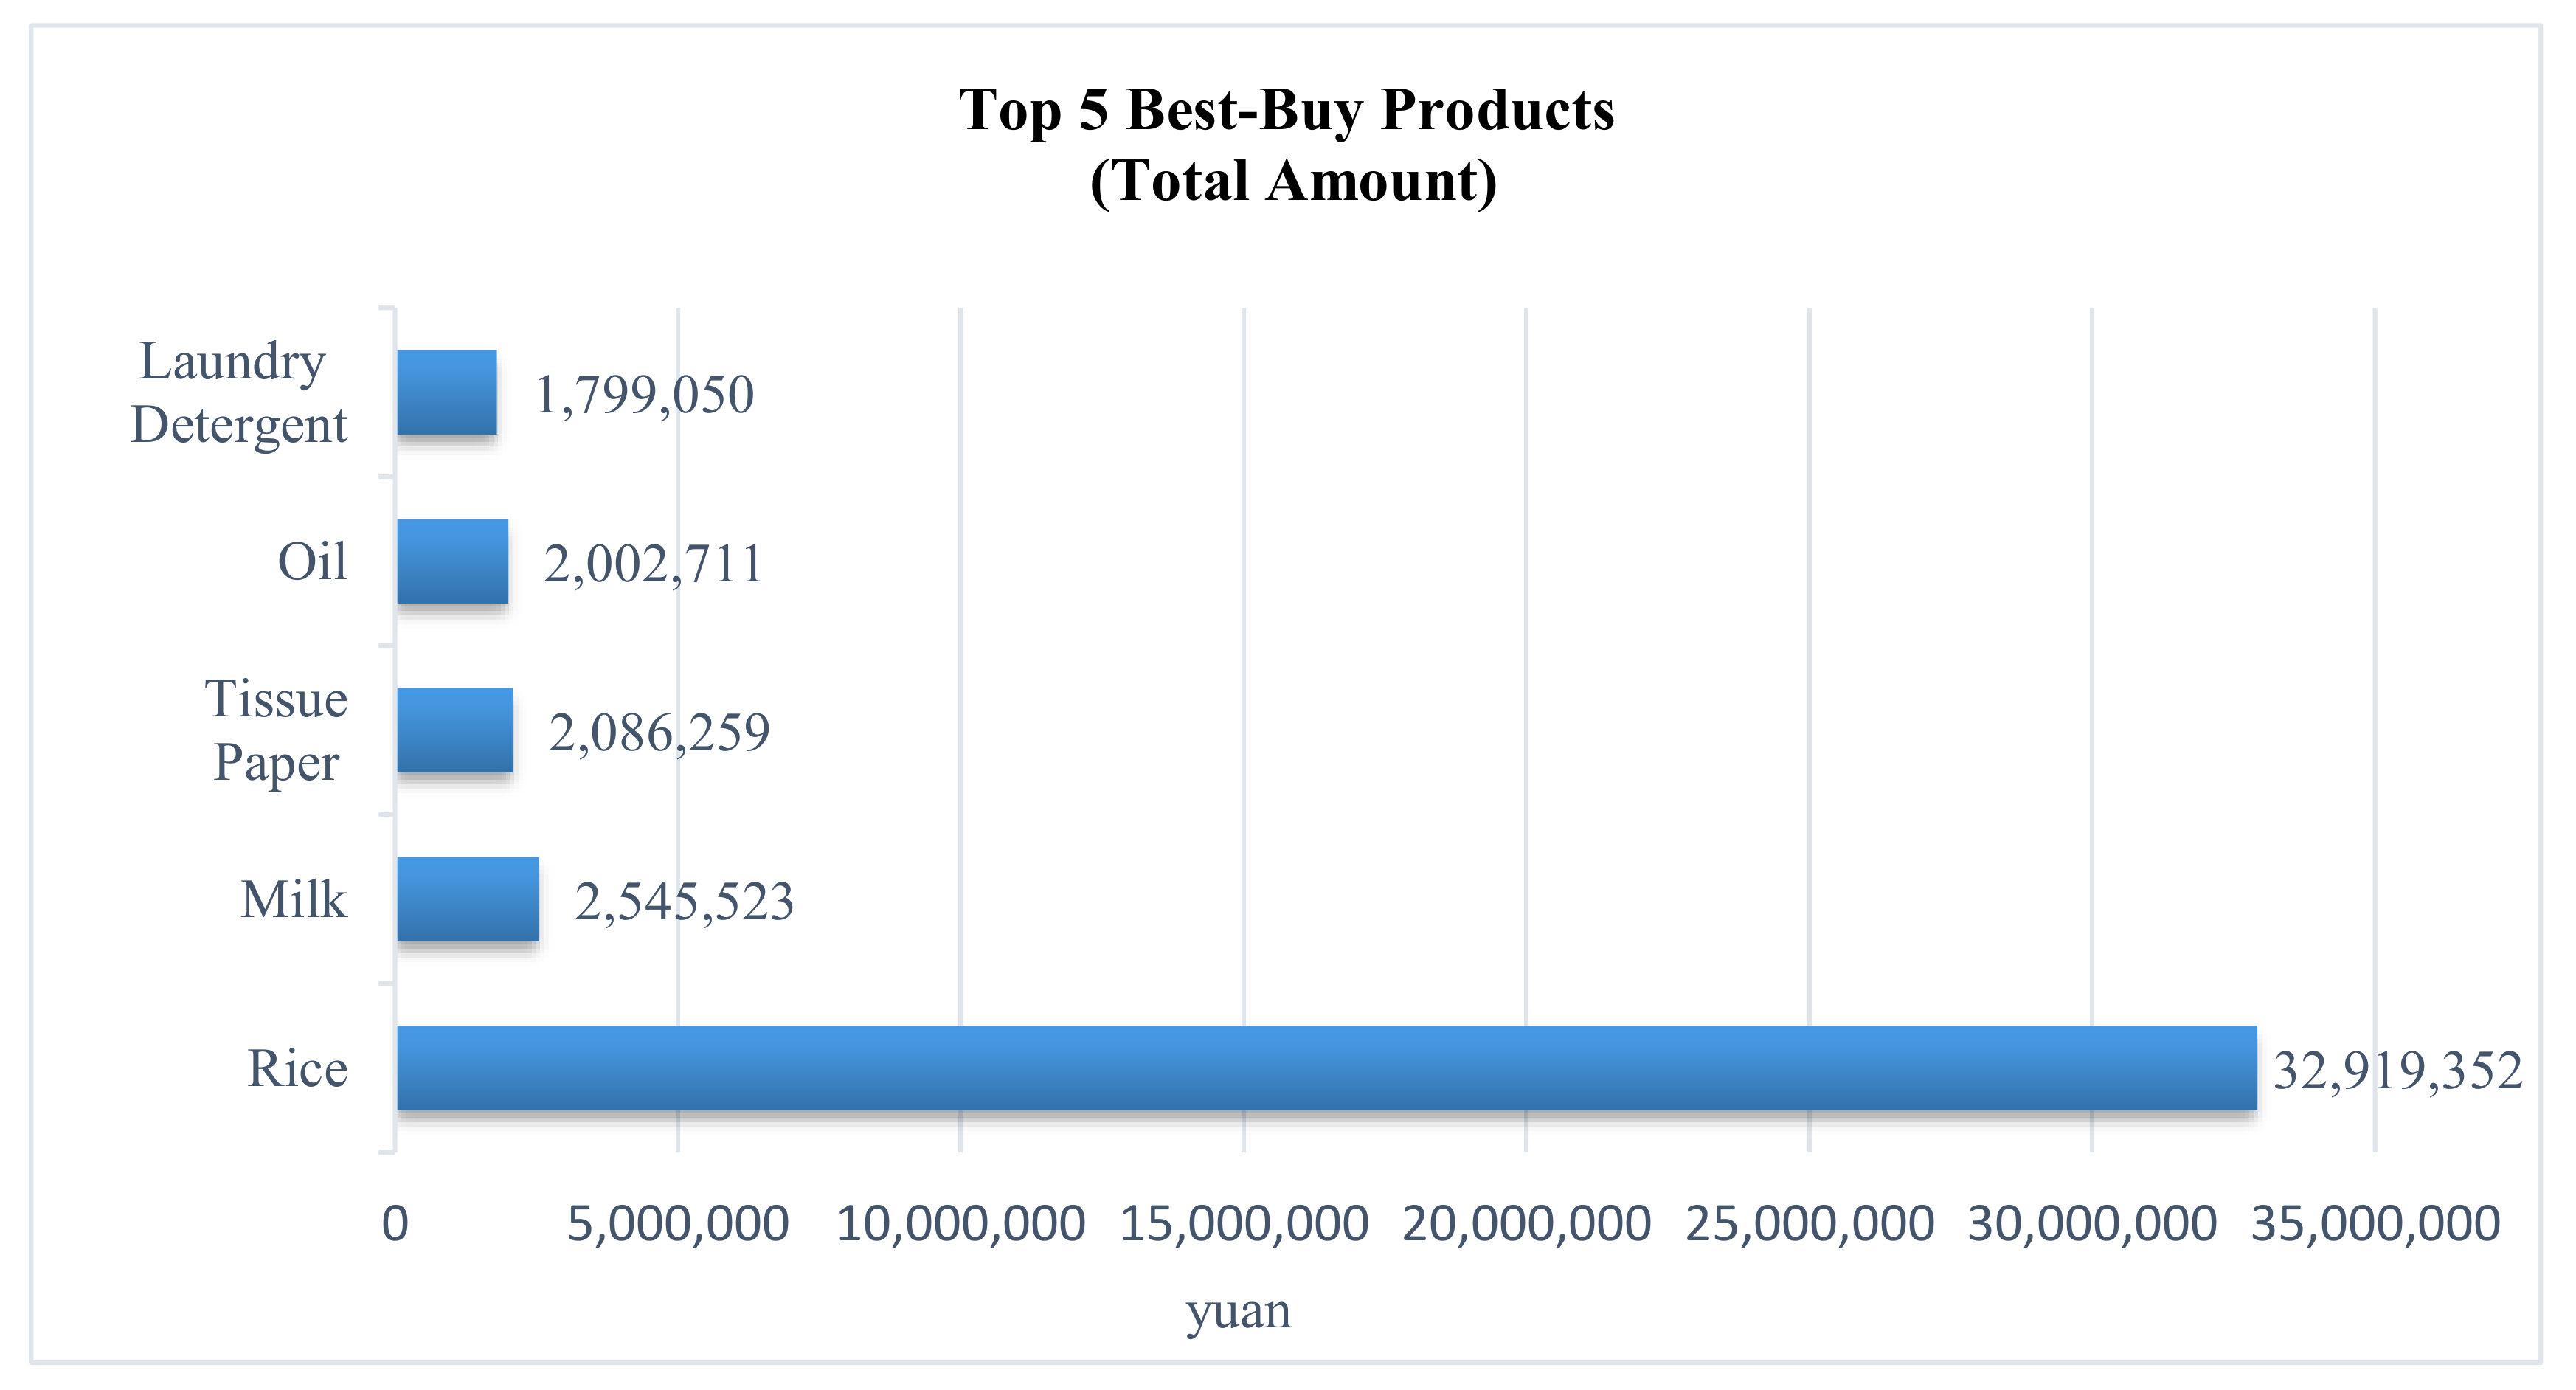
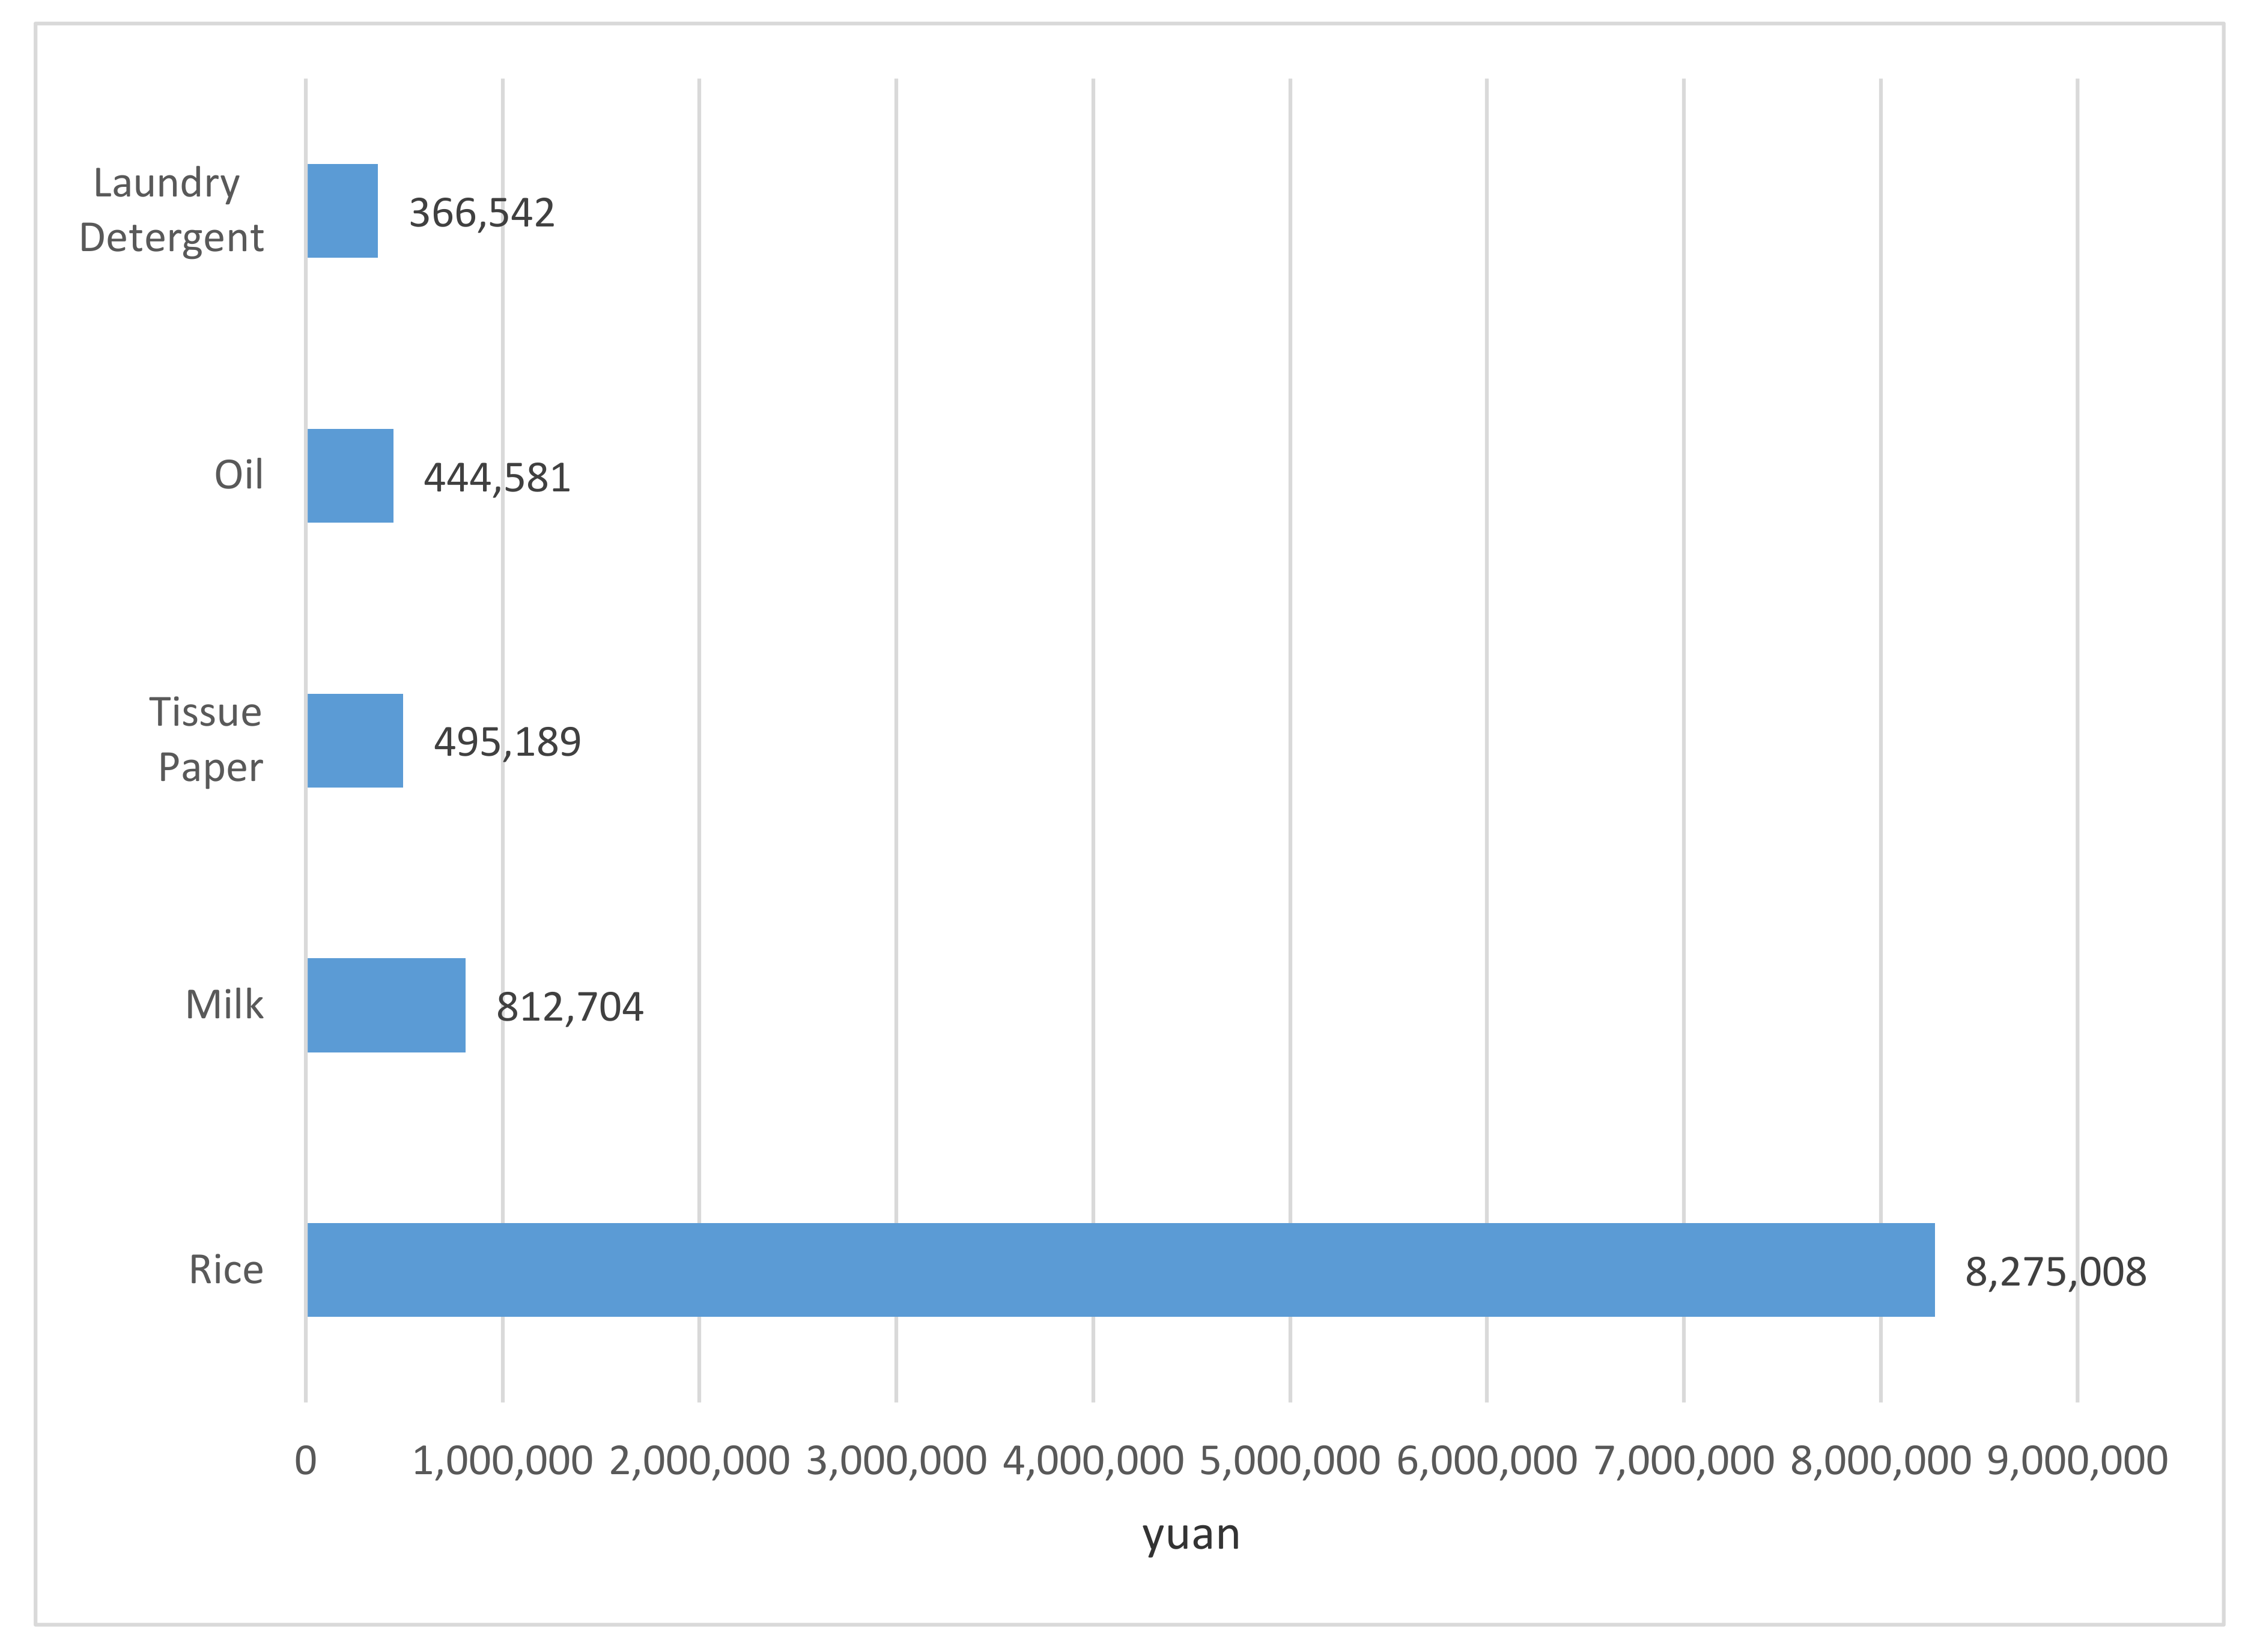
There are 11,171 products in this dataset. The top 5 most-bought products for all customers are shown in Figure 3. These products include rice, milk, tissue paper, oil, and laundry detergent as shown in Figure 4.

Figure 4.
The top 5 most-bought products.
Because there are many products in the dataset, it is very important to distinguish valuable features (products) and the number of clusters (customer segmentation). Traditionally, grid search is used to search intervals. It will not take intolerable computing power when the search interval is very large. On the other hand, it is impossible to render a satisfactory performance for setting this search interval [32]. We implement AFE to solve this problem. In AFE, N is the number of products, k is the cluster number, and a is the value for dividing a dataset T into two parts. The representation of solution is set in the artificial bee colony (ABC). The artificial bee colony (ABC) algorithm simulates the bee function of employees, onlookers, and scouters [33]. The initially generated number of the population is of m-dimension.
where is the position, m = N + 2, is the object value (classification accuracy) of the solution. A feasible position from is updated according to the following equation:
where is a new feasible solution, } and }, is different from , and is a random number in [−1, 1]. For the onlooker, it assesses the information on nectar from all employees. The probability of choosing a solution by the onlooker is defined as follows:
where is the value of the solution with the object value. If it cannot find any further solution, these employed bees will become scout bees. Therefore, the solution is abandoned. The new solution is chosen by the scout bee as follows:
where is a random number in [0, 1], and and are the low bound and upper bound for the solution of dimension j.
After selecting features, RFM is used to aggregate related information. For recent purchase date, this is the number of days from the last purchase day to the beginning day. The smaller the calculation value is, the more recently the customer has purchased goods in the supermarket. In contrast, if the value is higher, the customer has not purchased goods in the supermarket for a long time. For frequency of purchase, this means the number of times that a customer purchases products from 1 January 2017 to 31 December 2018. The higher the value is, the more frequently the customer purchases. In contrast, the smaller the value is, the less frequently the customer purchases. For monetary, this is the average total amount of products purchased by customers from 1 January 2017 to 31 December 2018. The higher the value is, the higher the customer’s consumption ability is.
Thereafter, k-means, Ward method, and FCM are used for clustering. The majority of labels (target variables) for the above three methods will be set as the label of customer segmentation. This process will be repeated until the label of samples has been completely distinguished. The performance of clustering is evaluated by the proposed improved fuzzy decision tree. In the improved fuzzy decision tree, we modify the Gini index to ameliorate the classification performance. Let |T| be the sum of membership values in a fuzzy set of dataset T. If the dataset T is split into k fuzzy subsets , the Gini index of the split data is calculated by the following equation [34]:
where the sum of membership values for all data points in fuzzy set . The sum of membership values in the fuzzy set. It is noted that the membership values are obtained from the method of FCM.
4. Results and Discussions
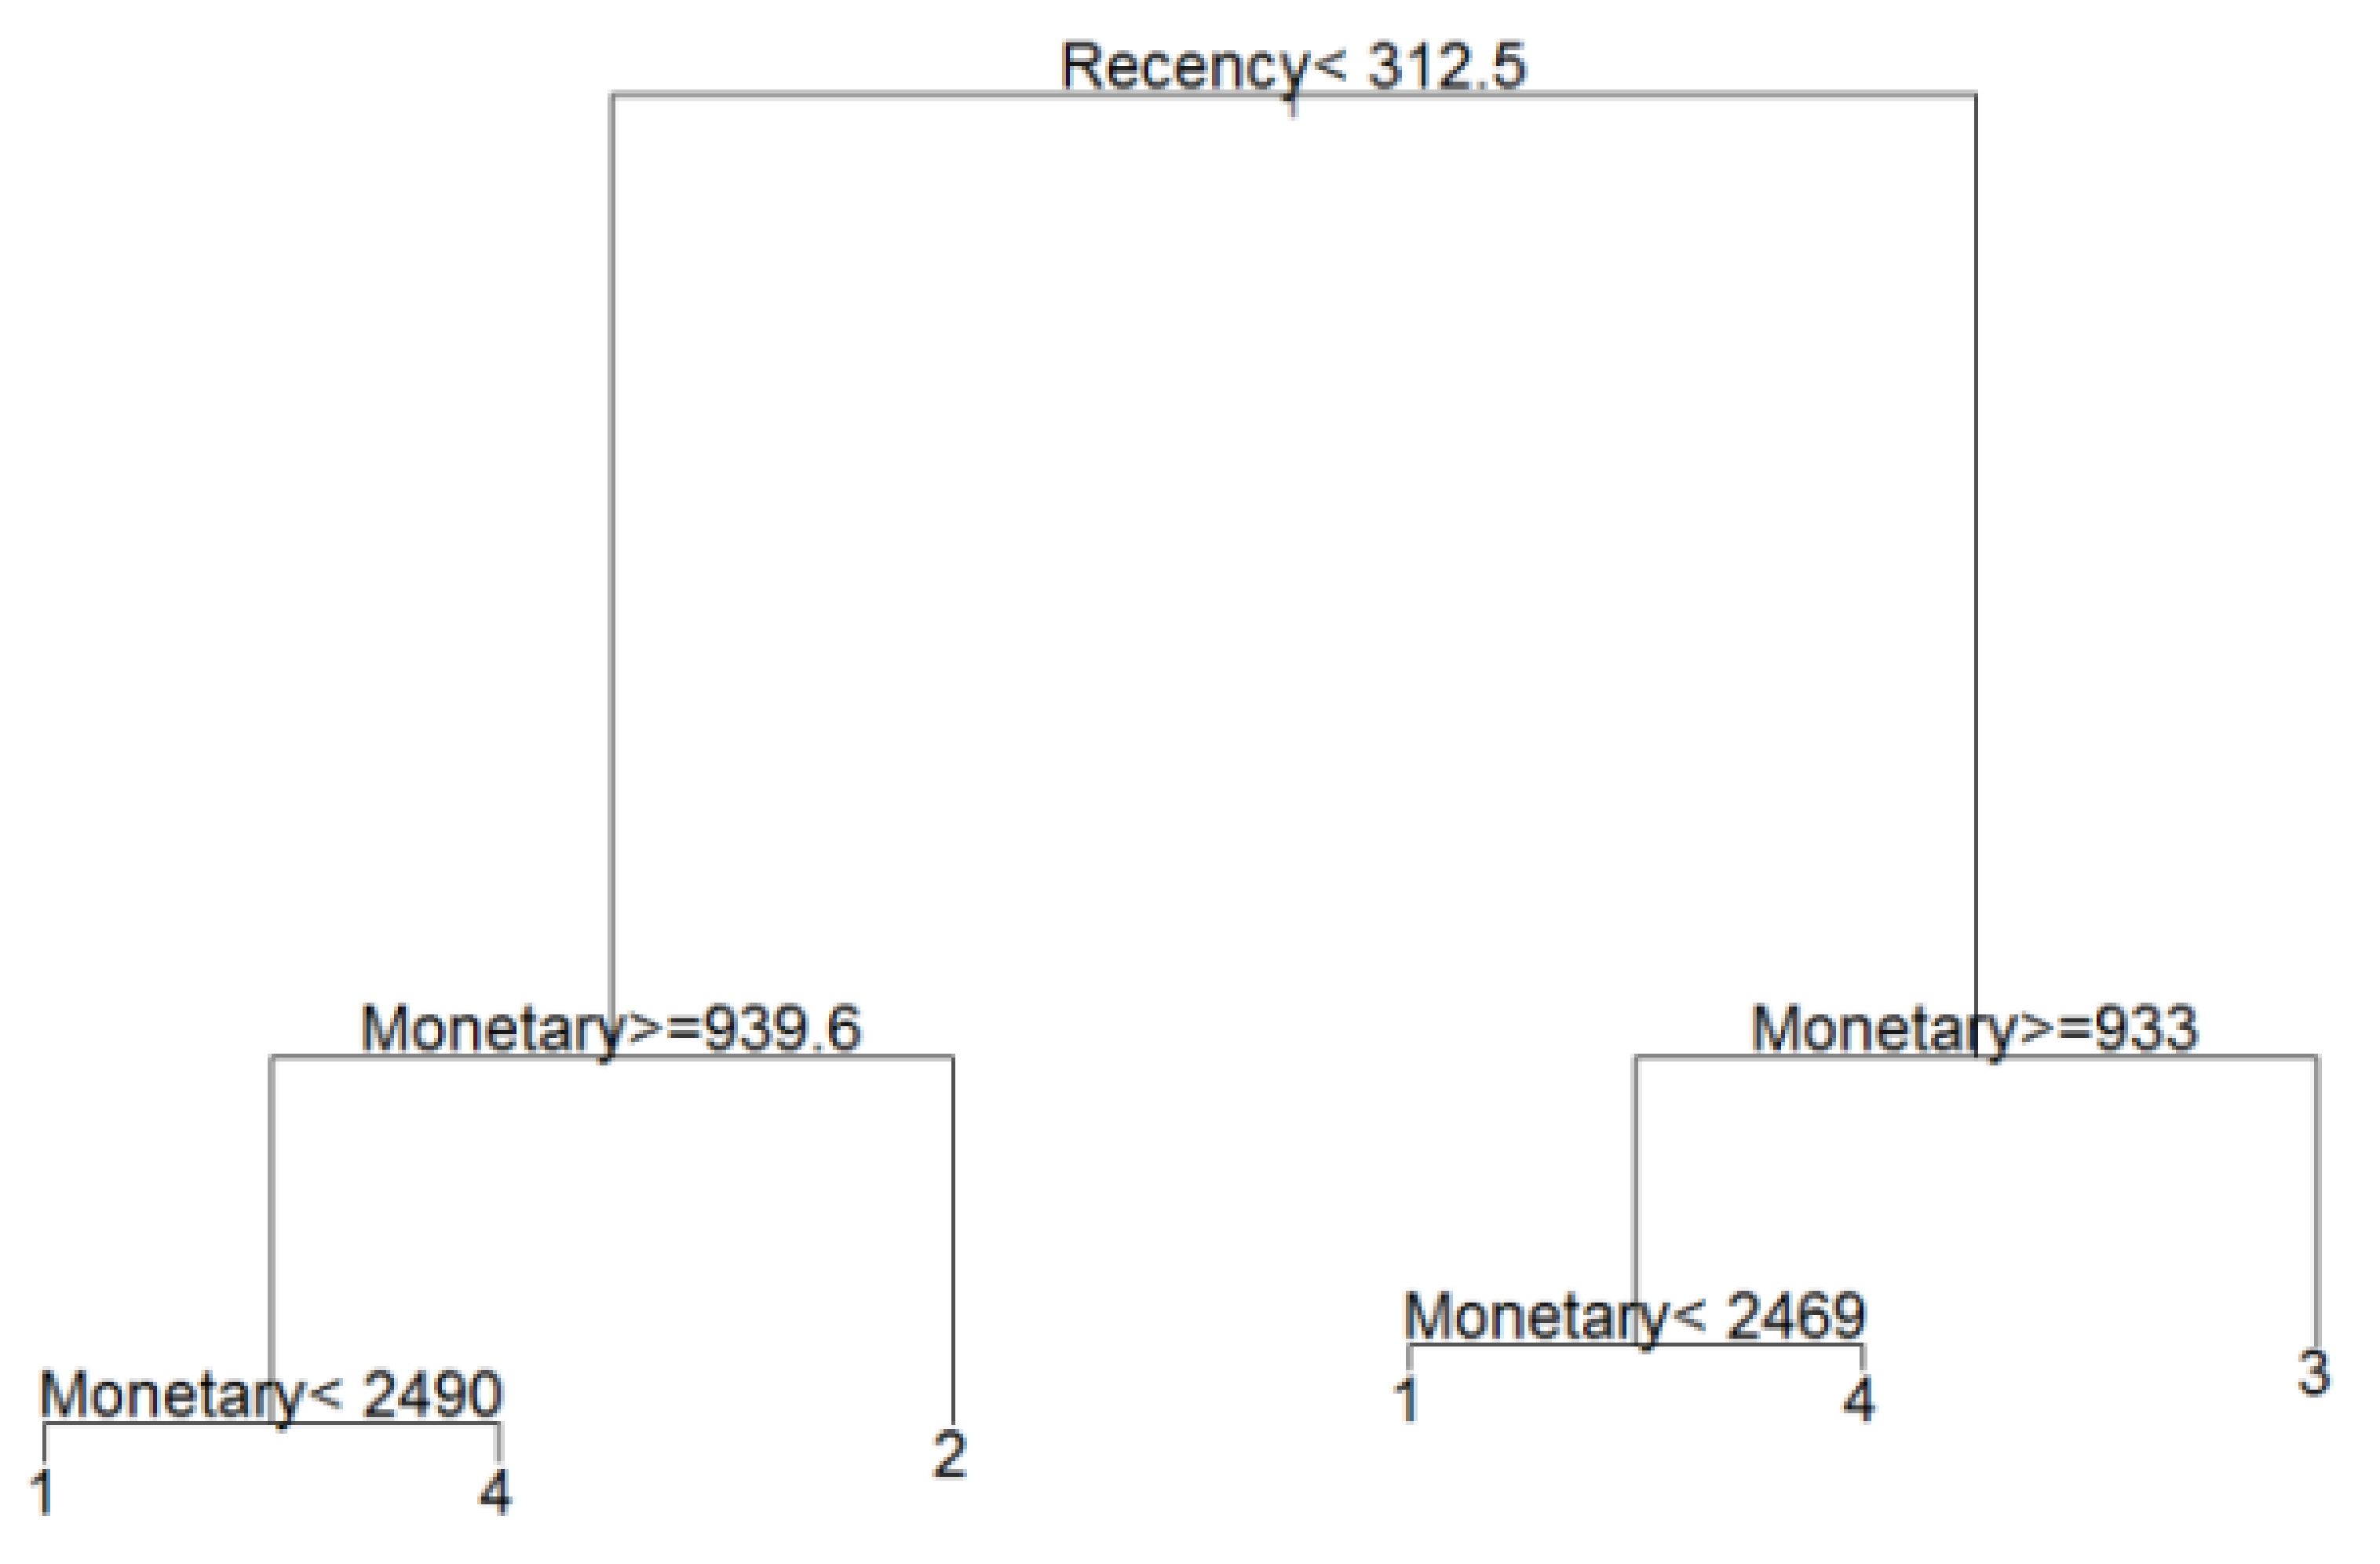
In the proposed algorithm, the best number of customer segmentation is k = 4, obtained from AFE. Then, k-means, Ward method, and FCM use k to find the label for all samples. Finally, we use the improved fuzzy decision tree to discover six decision rules. The proposed clustering and classification based on distributed AFE is processed in Spark. In Spark, we use the broadcast variables to send a read-only value to worker nodes for starting or stopping operation. Figure 5 shows the tree structure of customer segmentation.
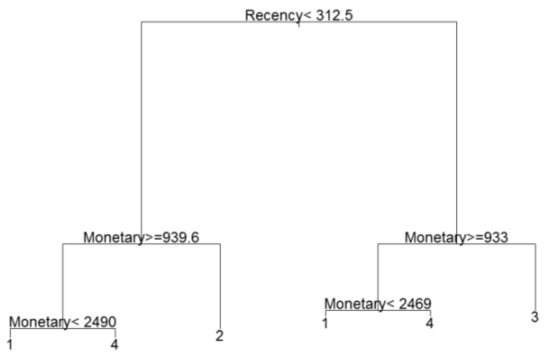
Figure 5.
The tree structure of customer segmentation.
According to the rules of the improved fuzzy decision tree, we summarize four customer segmentations, namely high-value customer (#4), loyal customer (#1), potential customer (#2), and lost customer (#3). These decision rules are shown in Table 2.
Table 2.
The decision rules of four customer segmentations.
The number of customers in each segmentation is shown in Table 3, and the related proportion of customer for four segmentations is shown in Figure 6. The proportion of loyal customers (#1) is 10.96% with 480 customers, potential customers (#2) is 24.91% with 1090 customers, lost customer (#3) is 2.7% with 118 customers, and high-value customers (#4) is 61.44% with 2690 customers. It is obvious that the high-value customers play an important role in this supermarket.
Table 3.
The number of customers in each segmentation.
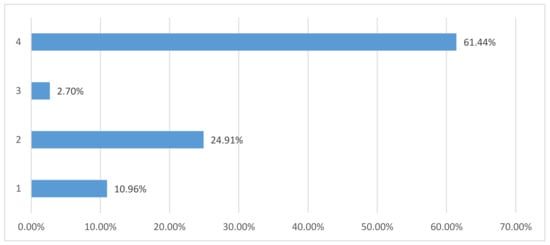
Figure 6.
The proportion of four customer segmentations.
Loyal customers belong to segmentation #1. In either number or purchase amount, the proportion of loyal customer segmentation is not high, at about 11%. Loyal customers are the people who come to consume frequently and spend more than a certain amount of money in all segmentations. The top five most-bought products for loyal customers are shown in Figure 7. The loyal customers have the same top five most-bought products and the same ranking as all customers.
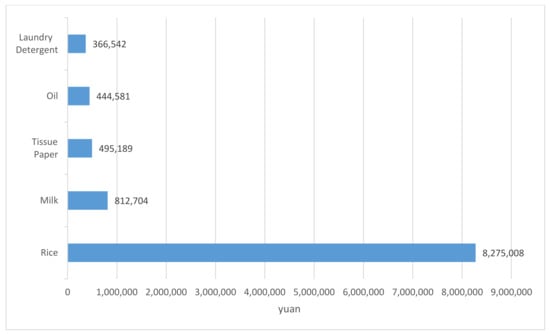
Figure 7.
The top 5 most-bought products for loyal customers.
The results show the main demographics of the loyal customers:
- A.
- The proportion of male consumers has increased significantly (23.5%, 2018), but the main consumers are still women (76.5%, 2018).
- B.
- Educational background in 2017 was mainly below high school (54.7%, 2017), but it changed to university in 2018 (64.4%, 2018).
- C.
- Consumers are mostly married (92.0%, 2018).
- D.
- In 2017, the family population was mainly concentrated in seven or more people (66.8%, 2017), but, in 2018, it was replaced by a family of three to four people (54.0%, 2018).
- E.
- In 2017, occupation was dominated by the service industry (63.8%, 2017), but it was scattered in business (40.2%, 2018), service industry (32.0%, 2018), and housewife (21.7%, 2018) in 2018.
- F.
- The income/month is concentrated in the range of CNY 10,000 to 15,000 (30.6%, 2018) and more than CNY 15,000 (53.5%, 2018).
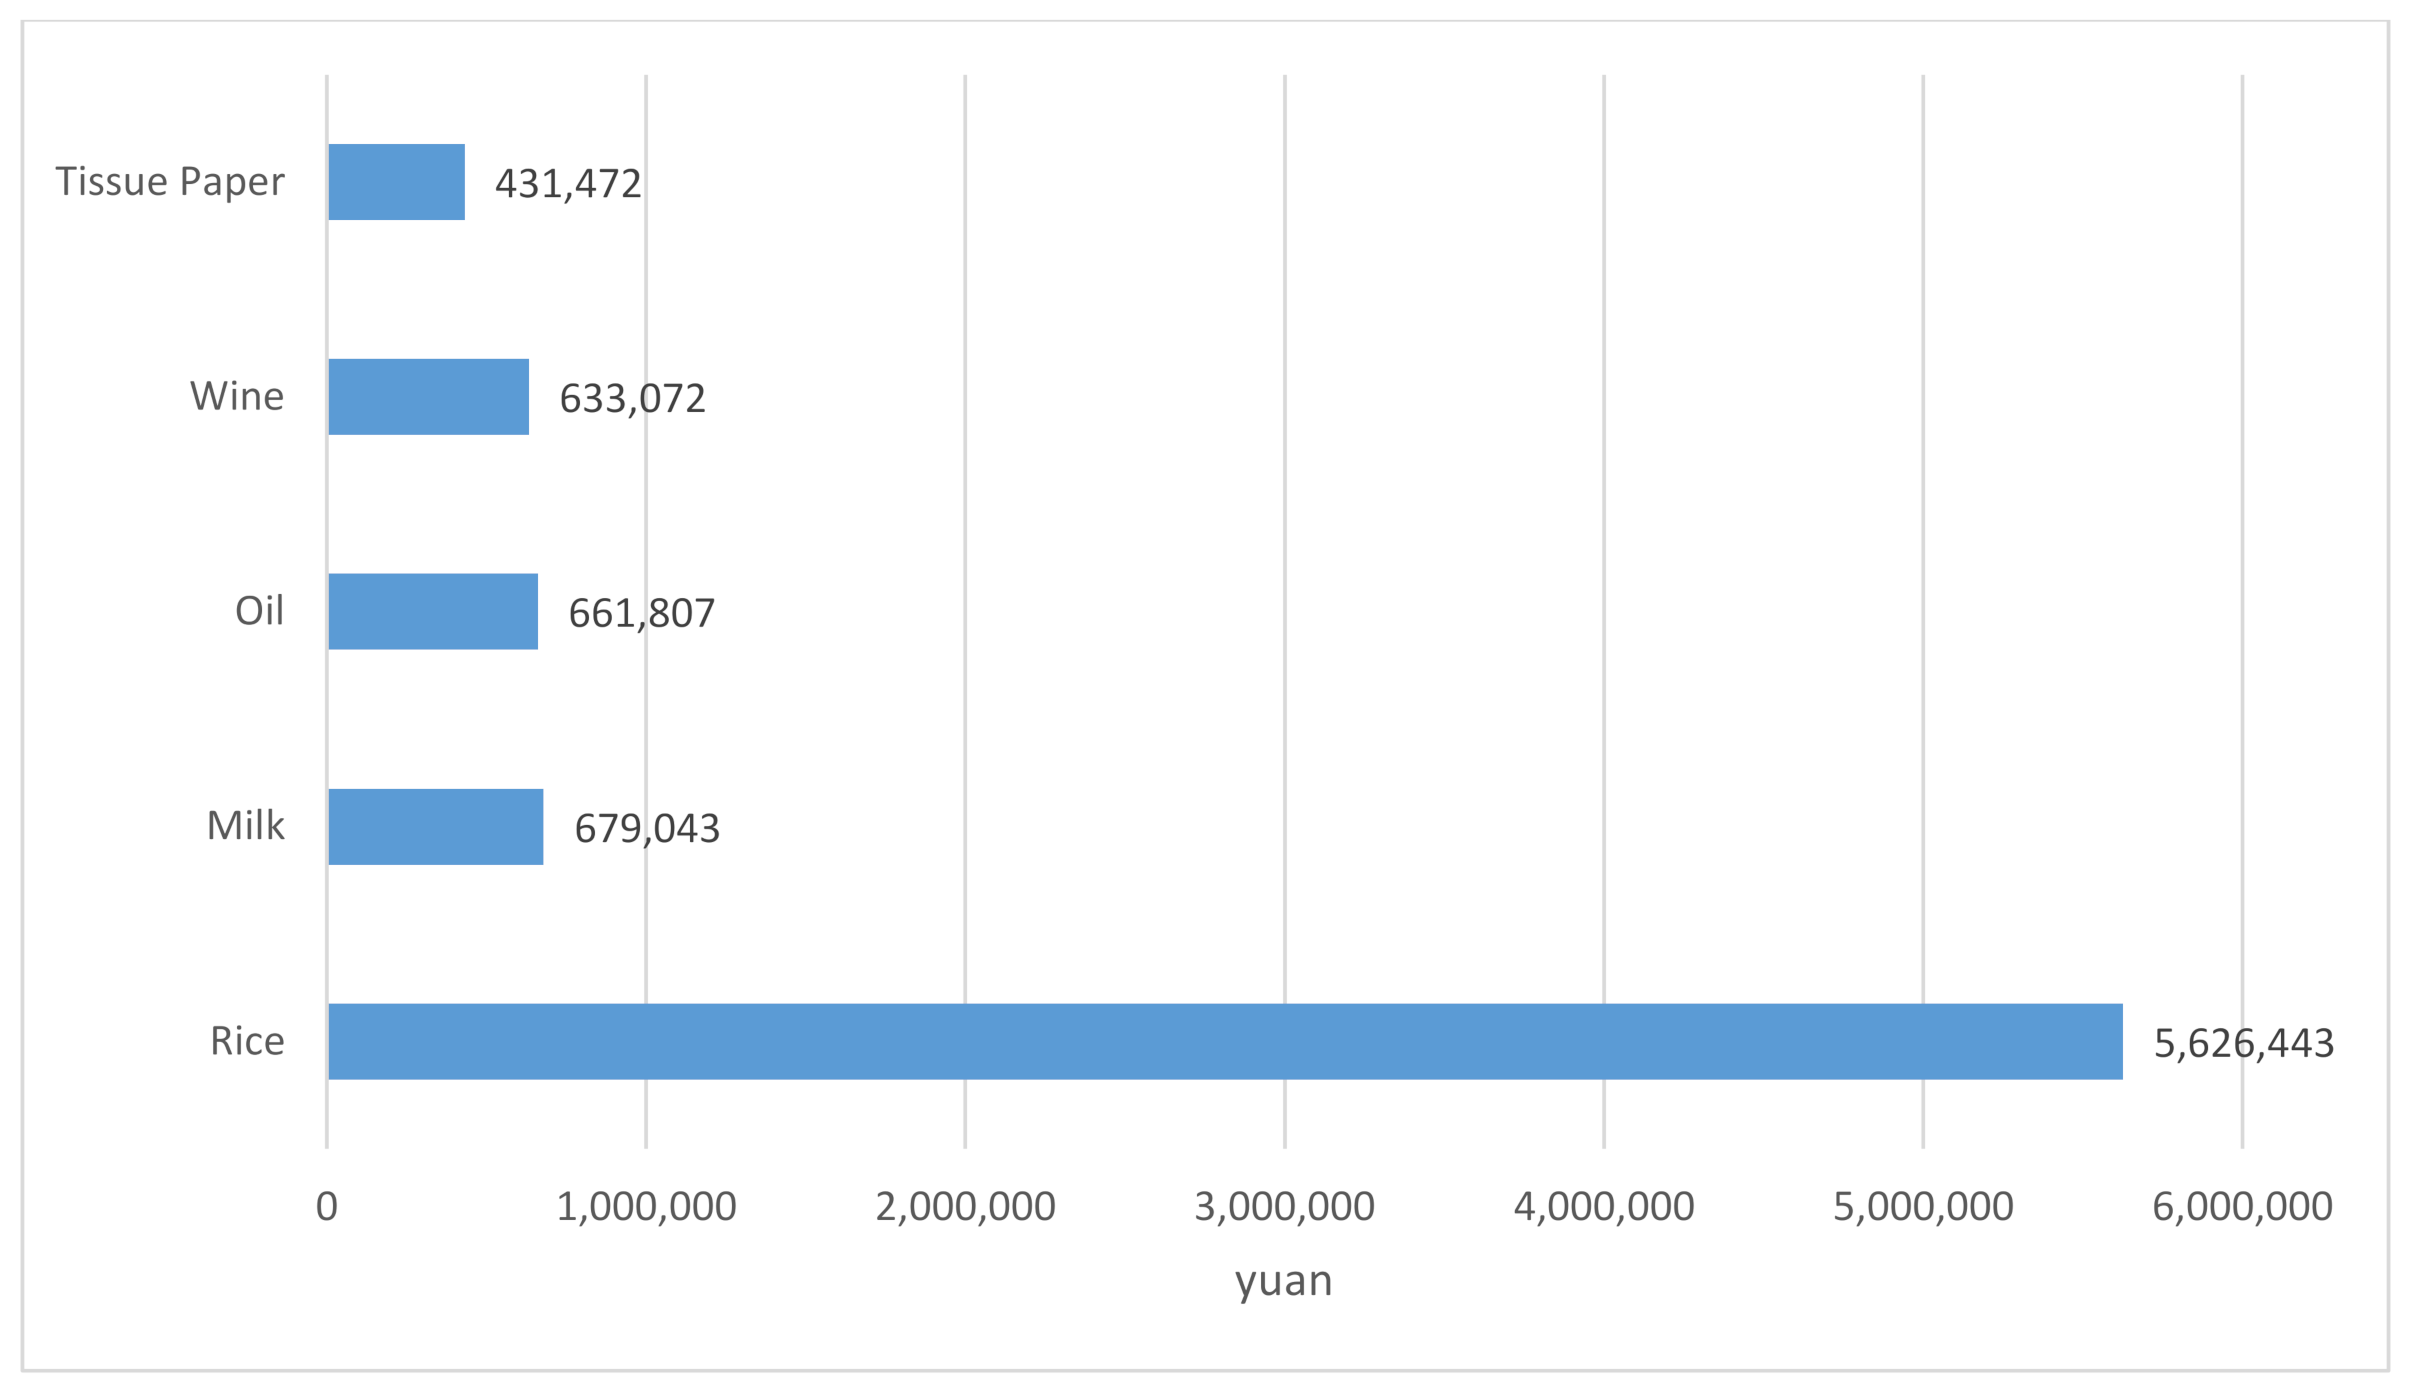
Potential customers are segmentation #2. They refer to those whose last purchase time is less than 312.5 days, but the transaction amount is less than CNY 939.6. They have a certain degree of activity to the supermarket, but their purchasing power is not strong enough. For the supermarket, it can develop appropriate marketing strategies to improve their consumptions and cultivate them to the loyal customer segmentation. The top five most-bought products for potential customers are shown in Figure 8. It is noted that wine is a most-bought product for potential customers.

Figure 8.
The top 5 most-bought products for potential customers.
It can be seen from the results that the potential customers have the following characteristics:
- A.
- In terms of gender, women accounted for the majority in 2017 and 2018 (about 76%).
- B.
- In terms of education background, they are mainly university graduates within the two years.
- C.
- The majority of people are married, but the number of married people has decreased from 82% to 69% from the perspective of marital status from 2017 to 2018.
- D.
- In terms of family population, the family has three to four people (about 50%), followed by more than seven people (about 30%) within two years.
- E.
- In terms of occupation, the largest occupation is housewife, followed by business in 2017 and 2018.
- F.
- From the perspective of family monthly income, this is CNY 5000 to 10,000 in 2017, and more than CNY 15,000 in 2018.
Lost customers belong to segmentation #3. In either number or purchase amount, it accounts for the smallest proportion of the whole customer segmentation, at about 2.7%. The supermarket owner does not want to produce this customer segmentation. However, there is no significant difference between the most-bought products purchased by the lost customers and other customers. Because there are many college students in this segmentation, students like products such as yogurt, frozen pasta, frozen fast food, and so on. Therefore, it can be found that students’ diet habits are fast and convenience-oriented. The results show that the lost customers have the following characteristics between 2017 and 2018:
- A.
- The female consumer is the largest proportion (66.52% and 67.14% in 2017 and 2018).
- B.
- Education background is mainly college students (30.92% and 37.66% in 2017 and 2018).
- C.
- The family population is mainly concentrated in three to four people (49.92%, 2017), but 12 people (29.46%, 2018) and more than seven people (28.96%, 2018) have an increasing trend.
- D.
- The monthly income of the family changes from CNY 15,000 to CNY 50,000–10,000 between 2017 and 2018.
High-value customers have been regarded as the valuable assets of supermarkets. In supermarket information, high-value customers accounted for 61.44% of total customers, and the total transaction amount was CNY 63,059,718, which also accounted for 61.4% of the total amount. The supermarket’s sales are mainly from high-value customers, and this is the main source of customers. It is an important issue to predict the future revenue of the supermarket for high-value customers. Compared with loyal customers, high-value customers have the largest transaction amount, but, in terms of purchase time, i.e., the time from the latest consumption, it is relatively long. Therefore, it is necessary to find effective means to shorten purchase time through marketing strategy. The top five most-bought products for high-value customers are shown in Figure 9.
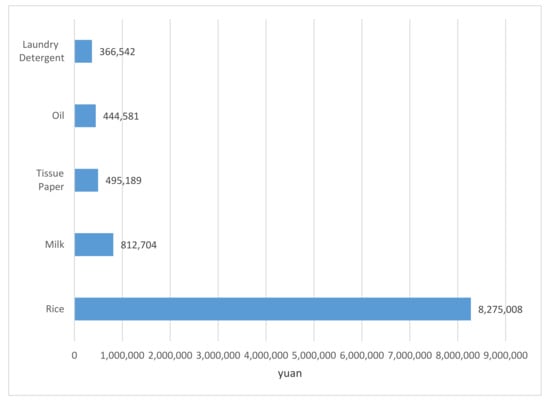
Figure 9.
The top five most-bought products for high-value customers.
The results show that the high-value customers have the following characteristics between 2017 and 2018:
- A.
- The largest proportion of consumers is male (67.14%, 2018), but the proportion of female consumers cannot be ignored (32.86% in 2018).
- B.
- Most consumers are married, but there is a decreasing trend (77.38%, 2018)
- C.
- The family population is more than seven people (47.54%, 2017), gradually replaced by more than three to four people (44.07%, 2018)
- D.
- Housewife accounted for the most common job in 2017 and 2018.
- E.
- The income/month of the family is CNY 10,000–15,000 (33.76%, 2018).
We use 80% of the dataset as training data, and the other 20% of the dataset as test data. To test the performance of the proposed algorithm, different methods, such as decision tree (DT), k-nearest neighbor (KNN), back-propagation network (BPN), and random forest (RF), are compared. DT is a pure decision tree without fuzzy function. KNN classifies data points based on the nearest neighbors, and it is similar to k-means. BPN is a useful neural network behavior, which focuses on the input/output data points. In BPN, we use three layers, and the number of the neuron is the same as the initial population of ABC. RF is an ensemble learning method that constructs multiple decision trees. Table 4 shows the results of classification accuracy, and it is noted that these compared methods are under the same condition without Spark. From Table 4, the classification accuracy of the proposed algorithm for customer segmentation is 98.49%. From Table 4, it is obvious that the proposed algorithm outperforms all compared methods. The proposed algorithm has the best classification accuracy among those well-known approaches for customer segmentation.
Table 4.
The classification accuracy for compared approaches.
5. Conclusions and Suggestions
In this paper, we propose clustering and classification based on distributed AFE for customer segmentation. The dataset has 4376 customers, 105,170 transaction logs, and 11,171 products. The proposed algorithm includes AFE, RFM, Wald method, FCM, k-means, and an improved fuzzy decision tree. In the proposed algorithm, AFE uses ABC to select valuable products for RFM, and then RFM provides the basic data analytics for customer segmentation. AFE also adjusts the number of customer segmentation k. Thereafter, k-means, Wald method, and FCM find the customers in those of four customer segmentations. The four customer segmentations are high-value customer, loyal customer, potential customer, and lost customer. Finally, AFE determines the value of the split number for the improved fuzzy decision tree. Moreover, we use the improved fuzzy decision tree to find six decision rules for decision-makers. The proposed algorithm is based on Spark, because Spark provides the distributed environment to improve the performance for data analytics. From the results, the classification accuracy of the proposed algorithm is up to 98.49%.
Finally, some marketing strategies are suggested for decision-makers. The customers in the loyal segmentation are mainly families with three to four or more than seven people, so the products with a large package usually have a certain appeal to them. According to the characteristics, potential customers are highly active to the supermarket, but the total amount is not high. The marketing suggestions are mainly to promote high unit price products and stimulate the purchase quantity to increase the total consumption amount, such as wine. The lost customers are the consumers who seldom come to consume and they buy products less. Therefore, it is necessary to increase the frequency of customers coming to the store and increase the consumption amount through marketing strategy. The composition of high-value customers is mainly married men, and most of the products purchased are related to family necessities. We advocate the combination of multiple products and lengthen the time of the series activities to improve the frequency of coming to the supermarket. In the future, Apache Spark can also be performed to predict the performance of the proposed method in the case of big data collections.
Author Contributions
Conceptualization, Z.-J.L.; methodology, Z.-J.L. and C.-Y.L.; investigation, L.-Y.C.; data curation, N.S.; writing—original draft preparation, Z.-J.L.; writing—review and editing, C.-Y.L. and N.S.; supervision, Z.-J.L. All authors have read and agreed to the published version of the manuscript.
Funding
This research received no external funding.
Institutional Review Board Statement
Not applicable.
Informed Consent Statement
Not applicable.
Data Availability Statement
Not applicable.
Acknowledgments
This research was partially supported by Fujian Province research Grant No. FZTPY-2019004 and ZS20048. It was also supported by Fuzhou University of International Studies and Trade research Grant No. H2021004, H2020074, 2018KYTD-02, and BRJF-01.
Conflicts of Interest
The authors declare no conflict of interest.
References
- Lal, R.; Rao, R. Supermarket Competition: The Case of Every Day Low Pricing. Mark. Sci. 1997, 16, 60–80. [Google Scholar] [CrossRef]
- Florack, A.; Egger, M.; Hübner, R. When products compete for consumers attention: How selective attention affects preferences. J. Bus. Res. 2019, 111, 117–127. [Google Scholar] [CrossRef]
- Dospinescu, O.; Anastasiei, B.; Dospinescu, N. Key Factors Determining the Expected Benefit of Customers When Using Bank Cards: An Analysis on Millennials and Generation Z in Romania. Symmetry 2019, 11, 1449. [Google Scholar] [CrossRef] [Green Version]
- Glanz, K.; Chung, A.; Morales, K.H.; Kwong, P.L.; Wiebe, D.; Giordano, D.P.; Brensinger, C.M.; Karpyn, A. The healthy food marketing strategies study: Design, baseline characteristics, and supermarket compliance. Trans. Behav. Med. 2020, 10, 1266–1276. [Google Scholar]
- Cava, W.L.; Moore, J.H. Learning feature engineering for classification. In Proceedings of the Twenty-Sixth International Joint Conference on Artificial Intelligence (IJCAI-17), Melbourne, Australia, 19–25 August 2017; pp. 2312–2314. [Google Scholar]
- Aliyev, M.; Ahmadov, E.; Gadirli, H.; Mammadova, A.; Alasgarov, E. Segmenting Bank Customers via RFM Model and Unsupervised Machine Learning. arXiv 2020, arXiv:2008.08662. [Google Scholar]
- Kabasakal, İ. Customer Segmentation Based On Recency Frequency Monetary Model: A Case Study in E-Retailing. Int. J. Inf. Technol. 2020, 13, 47–56. [Google Scholar]
- Chen, D.; Sain, S.L.; Guo, K. Data mining for the online retail industry: A case study of RFM model-based customer segmentation using data mining. J. Database Mark. Cust. Strat. Manag. 2012, 19, 197–208. [Google Scholar] [CrossRef]
- Gustriansyah, R.; Suhandi, N.; Antony, F. Clustering optimization in RFM analysis Based on k-Means. Indones. J. Electr. Eng. Comput. Sci. 2020, 18, 470–477. [Google Scholar] [CrossRef]
- Rahman, S. Customer Segmentation Using RFM Analysis. 2020. Available online: http://dspace.daffodilvarsity.edu.bd:8080/handle/123456789/5158 (accessed on 17 July 2021).
- Kansal, T.; Bahuguna, S.; Singh, V.; Choudhury, T. Customer segmentation using k-means clustering. In Proceedings of the 2018 International Conference on Computational Techniques, Electronics and Mechanical Systems (CTEMS), Belgaum, India, 21–22 December 2018. [Google Scholar]
- Syakur, M.A.; Khotimah, B.K.; Rochman, E.M.S.; Satoto, B.D. Integration K-Means Clustering Method and Elbow Method for Identification of The Best Customer Profile Cluster. IOP Conf. Series Mater. Sci. Eng. 2018, 336, 012017. [Google Scholar] [CrossRef] [Green Version]
- He, Y.; Cheng, Y. Customer Segmentation and Management of Online Shops Based on RFM Model. In Proceedings of the International Conference on Application of Intelligent Systems in Multi-Modal Information Analytics, Changzhou, China, 18–19 June 2020; Springer: Cham, Switzerland, 2020. [Google Scholar]
- Akbar, Z.; Liu, J.; Latif, Z. Discovering Knowledge by Comparing Silhouettes Using K-Means Clustering for Customer Segmentation. Int. J. Knowl. Manag. 2020, 16, 70–88. [Google Scholar] [CrossRef]
- Anitha, P.; Malini, M.P. RFM model for customer purchase behavior using K-Means algorithm. J. King Saud Univ. Comput. Inf. Sci. 2019; in press. [Google Scholar] [CrossRef]
- Huang, Y.; Zhang, M.; He, Y. Research on improved RFM customer segmentation model based on K-Means algorithm. In Proceedings of the 2020 5th International Conference on Computational Intelligence and Applications (ICCIA), Beijing, China, 19–21 June 2020. [Google Scholar]
- Maryani, I.; Riana, D.; Astuti, R.D.; Ishaq, A.; Pratama, E.A. Customer Segmentation based on RFM model and Clustering Techniques With K-Means Algorithm. In Proceedings of the 2018 Third International Conference on Informatics and Computing (ICIC), Palembang, Indonesia, 17–18 October 2018; pp. 1–6. [Google Scholar] [CrossRef]
- Roshan, Hadi, and Masoumeh Afsharinezhad, The new approach in market segmentation by using RFM model. J. Appl. Res. Ind. Eng. 2017, 4, 259–267.
- Keriven, N.; Tremblay, N.; Traonmilin, Y.; Gribonval, R. Compressive K-means. In Proceedings of the 2017 IEEE International Conference on Acoustics, Speech and Signal Processing (ICASSP), New Orleans, LA, USA, 5–9 March 2017. [Google Scholar]
- Masud, A.; Huang, J.Z.; Wei, C.; Wang, J.; Khan, I.; Zhong, M. I-nice: A new approach for identifying the number of clusters and initial cluster centres. Inf. Sci. 2018, 466, 129–151. [Google Scholar] [CrossRef]
- Shang, W.; Qu, Y.; Zhu, H.; Huang, H.; Lin, Y.; Dong, H. An Adaptive Fuzzy kNN Text Classifier Based on Gini Index Weight. In Proceedings of the 11th IEEE Symposium on Computers and Communications (ISCC’06), Cagliari, Italy, 26–29 June 2006; pp. 448–453. [Google Scholar] [CrossRef]
- Rizvi, S.; Bart, R.; Shakeel, A.K. The role of demographics in online learning: A decision tree based approach. Comput. Educ. 2019, 137, 32–47. [Google Scholar] [CrossRef]
- Lechthaler, B.; Christoph, P.; Frank, M. Objective homogeneity quantification of a periodic surface using the Gini index. Sci. Rep. 2020, 10, 1–17. [Google Scholar] [CrossRef]
- Zhao, G.; Wang, H.; Jia, D.; Wang, Q. Feature Selection of Grey Wolf Optimizer Based on Quantum Computing and Uncertain Symmetry Rough Set. Symmetry 2019, 11, 1470. [Google Scholar] [CrossRef] [Green Version]
- Gao, L.L.; Bien, J.; Witten, D. Selective Inference for Hierarchical Clustering. arXiv 2020, arXiv:2012.02936. [Google Scholar]
- Wei, J.T.; Lin, S.Y.; Wu, H.H. A review of the application of RFM model. Afr. J. Bus. Manag. 2010, 4, 4199–4206. [Google Scholar]
- Dubey, A.K.; Gupta, U.; Jain, S. Comparative Study of K-means and Fuzzy C-means Algorithms on The Breast Cancer Data. Int. J. Adv. Sci. Eng. Inf. Technol. 2018, 8, 18–29. [Google Scholar] [CrossRef]
- Olaru, C.; Wehenkel, L. A complete fuzzy decision tree technique. Fuzzy Sets Syst. 2003, 138, 221–254. [Google Scholar] [CrossRef] [Green Version]
- Lee, Z.-J.; Lee, C.-Y.; Chou, S.-T.; Ma, W.-P.; Ye, F.; Chen, Z. A hybrid system for imbalanced data mining. Microsyst. Technol. 2019, 26, 3043–3047. [Google Scholar] [CrossRef]
- Guo, R.; Zhao, Y.; Zou, Q.; Fang, X.; Peng, S. Bioinformatics applications on Apache Spark. GigaScience 2018, 7, giy098. [Google Scholar] [CrossRef] [PubMed]
- Lee, Z.J.; Lee, C.Y.; Yuan, X.J.; Chu, K.C. Rainfall Forecasting of Landslides Using Support Vector Regression. In Proceedings of the 2020 3rd IEEE International Conference on Knowledge Innovation and Invention (ICKII), Kaohsiung, Taiwan, 21–23 August 2020; pp. 1–3. [Google Scholar]
- Lin, S.-W.; Lee, Z.-J.; Chen, S.-C.; Tseng, T.-Y. Parameter determination of support vector machine and feature selection using simulated annealing approach. Appl. Soft Comput. 2008, 8, 1505–1512. [Google Scholar] [CrossRef]
- Wang, H.; Wang, W.; Xiao, S.; Cui, Z.; Xu, M.; Zhou, X. Improving artificial Bee colony algorithm using a new neighborhood selection mechanism. Inf. Sci. 2020, 527, 227–240. [Google Scholar] [CrossRef]
- Shu, H.; Xiong, P. The Gini index structure and its application for the evaluation of regional balance development in China. J. Clean. Prod. 2018, 199, 668–686. [Google Scholar] [CrossRef]


Publisher’s Note: MDPI stays neutral with regard to jurisdictional claims in published maps and institutional affiliations. |
© 2021 by the authors. Licensee MDPI, Basel, Switzerland. This article is an open access article distributed under the terms and conditions of the Creative Commons Attribution (CC BY) license (https://creativecommons.org/licenses/by/4.0/).