Article

Soil Arching of Piled Embankment in Equal Settlement Pattern: A Discrete Element Analysis

1
School of Civil Engineering, Zhejiang University of Technology, Hangzhou 310014, China
2
Department of Civil Engineering, Zhejiang University City College, Hangzhou 310015, China
3
Zhejiang Jiaogong Group Co., Ltd., Hangzhou 310000, China
*
Author to whom correspondence should be addressed.
Symmetry 2021, 13(9), 1627; https://doi.org/10.3390/sym13091627
Submission received: 19 August 2021 / Revised: 29 August 2021 / Accepted: 30 August 2021 / Published: 3 September 2021
(This article belongs to the Section Computer)

Abstract

:
Soil arching, which occurs in the piled embankments, plays an important role in stress redistribution between the relatively soft subsoil and the stiffer piles. The formation of the soil arching depends on the differential settlement of the embankment fill above the pile and the subsoil. The soil arching effect is barely investigated in the literature from the perspective of differential settlement of piles and soils. Based on the discrete element method (DEM), this paper develops a classic trapdoor test model to investigate the differential settlement in piled embankment during the downward movement of the trapdoor, and to explore the formation mechanism of soil arching in equal settlement pattern by changing the width of the pile cap and the height of the embankment. Due to symmetry, only one section of the laboratory test model is simulated herein. It was found that the soil arching formed under the equal settlement pattern remained unchanged after a certain degree of development, and the height of the equal settlement did not change at 0.7(s-a), where s is the pile spacing, and a is the width of the pile cap. The height of the embankment (H) and the width of the pile cap (a) have a significant influence on the formation of the equal settlement pattern when the width of the trapdoor is kept constant. Both the decrease in “H” and the increase in “a” facilitate the differential settlement of the soil between the piles and the pile-soil, enabling the slip surface to develop upward gradually, thereby hindering the formation of the equal settlement pattern.

1. Introduction

Piled embankments have been widely adopted to overcome intolerable total or differential settlements, large lateral displacements of highway, and railway engineering, especially for embankments constructed over soft soils [1,2,3,4,5,6,7,8,9]. Soil arching effect is a ubiquitous phenomenon occurred in the piled embankment to transfer the vertical stress from the relatively stiff pile to the softer soil due to the differential settlement [10,11,12,13,14,15,16,17].
Some arching models have been developed to help characterization the load transfer mechanism in piled embankments; however, they are considerably different. Terzaghi [10] first introduced a two-dimensional (2D) soil arching model by performing a series of trapdoor model tests, and concluded that the internal slip surface of the soil changes from a curved shape to a vertical shear surface under the soil arching effect. Hewlett and Randolph [11] proposed a semispherical arching model (termed the H&R model) to identify the soil arching in piled embankments, and assumed that the soil arching failed either at the crown of the arch or just above the pile cap. On the basis of the H&R model [11], Kempfert et al. [18] established a soil arching model, which was consisted of multiple semispheres with different centers. Following the H&R model [11] and the multiple semispheres model [19], Van Eekelen et al. [20,21] considered the soil arching as the concentric hemispheres, and derived the corresponding analytical method to calculate the load distribution of the embankment. Iglesia et al. [22] performed a series of 2D single-trapdoor tests under centrifugal conditions, and indicated that the formation of the soil arching evolved from an initially curved configuration to a triangular shape and ultimately to a prismatic sliding mass with vertical sides. Based on a number of model tests carried out using the 2D multiple trapdoor system, Rui et al. [23,24] carried out a series of 2D multiple trapdoor model tests, indicating that three soil arching evolution patterns typically occurred in the piled embankments, named the triangular expanding pattern, the tower-shaped evolution pattern, and the equal settlement pattern, respectively. Recently, some advanced test techniques, especially for CT scanning [25,26] and particle image velocimetry (PIV) [23,27], have been used to identify the soil arching shape in the laboratory model tests.
The soil arching effect has the merit of reducing the local differential settlements of piled embankments. Among the aforementioned various soil arching models, the arching in an equal settlement pattern may play an important role in ensuring the serviceability performance of the embankment. The critical height Hcr was generally recommended to approximately account the potential behavior of soil arching [23,24,28,29,30]. Hewlett and Randolph [11] indicated that the crown of the arch in three-dimensional situation was approximately hemispherical, whose radius equaled to half the diagonal spacing of piles arranging in square pattern. As a result, the critical height is 1.4 times the clear spacing between the pile caps, this is the same as the assumption in BS8006-1 [31]. Jenck et al. [28] performed a number of model tests, concluding that uniform settlement at the embankment surface can be observed for embankment heights larger than 2.0(s-a), while differential settlement may be occurred when H ≈ 1.3(s-a), where H is the embankment height, s is the pile spacing, and a is the width of the pile cap. Chen et al. [29] concluded that differential settlement occurs at the embankment surface if H < 1.4(s-a), whereas the uniform settlement occurs when H > 1.6(s-a). Zhuang et al. [32] concluded that the critical height of arching in piled embankment was 2.0–2.5 times the clear spacing between pile caps (s-a). Rui et al. [23,24] proposed that uniform settlement at the surface of embankments may be occurred for that case of H/(s-a) > 1.75 and (s-a)/a ≥ 2.5. In summary, existing arching models pose some confusion in practical design. Moreover, the formation mechanism of the soil arching in equal settlement patterns is not fully discussed.
The Discrete Element Method (DEM) has been recently applied to simulate the soil arching in piled embankments [15,25,33,34,35], which showed that DEM simulations can closely characterize the qualitative features of soil arching in piled embankments [35]. However, most of these DEM simulations still attempt to identify the soil arching according to the deformation pattern of the embankment, rather than the redistributions of the stress or contact force chains [15]. Generally, the soil arching formed in the piled embankments considerably enhanced the load transfer from the relatively stiff piles to the softer subsoil [5,12,13,14,15,16,28,29,30,36]. In this regard, this study investigated the soil arching in piled embankments with the 2D DEM modeling software, Particle Flow Code in Two Dimensions (PFC2D), version 5.0, developed by Itasca [37]. In this paper, the DEM model to simulate the 2D trapdoor model presented by Rui et al. [24] is developed to analyze the soil arching of piled embankments in equal settlement patterns.

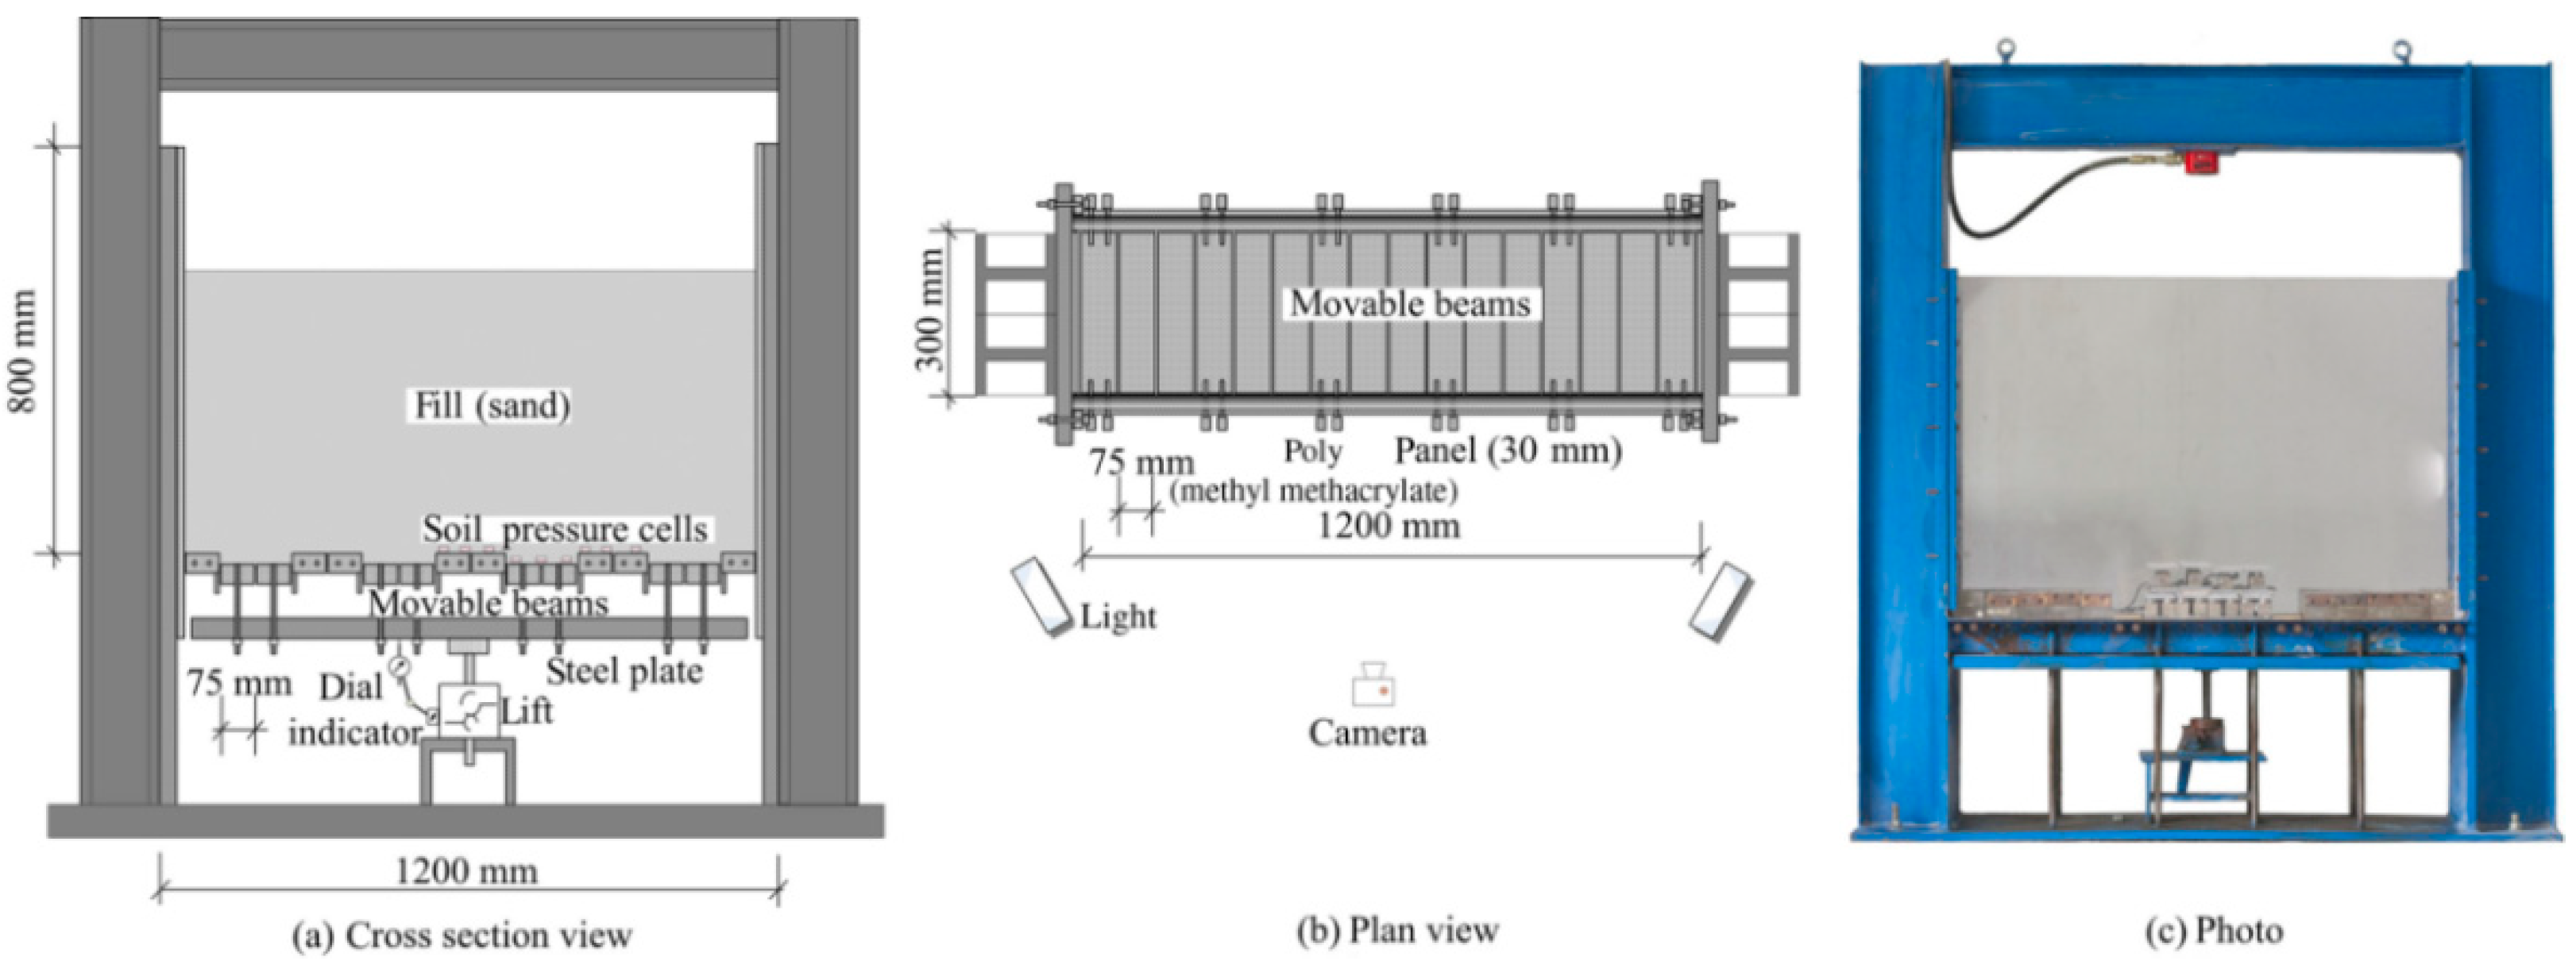
2. Piled Embankment Model Test

The 2D trapdoor model tests carried out by Rui et al. [24] were selected herein to simulate the trapdoor using discrete element modeling. The laboratory test setup are illustrated in Figure 1. The fill bottom is supported by 16 movable steel beams. In order to accurately simulate the trapdoor, the movable beam is fixed either to the frame to represent the piles or to the steel plate. The vertical displacement of trapdoor, which terms as the pile–subsoil relative displacement (Δs), was simulated by moving the trapdoor-like steel plate downwards. Sixteen tests were conducted using the system shown in Figure 1 with the beam width a, fill height H, trapdoor width (s-a), and different grain sizes d. Soil pressure cells were installed at the surfaces of the movable beam to measure the pressures carried by the pile and trapdoor. The particle image velocimetry (PIV) technique was utilized to identify the embankment deformation. More information about the model test can be found elsewhere [24]. Three reference cases covered in this study are summarized in Table 1.

3. DEM Modeling and Verification
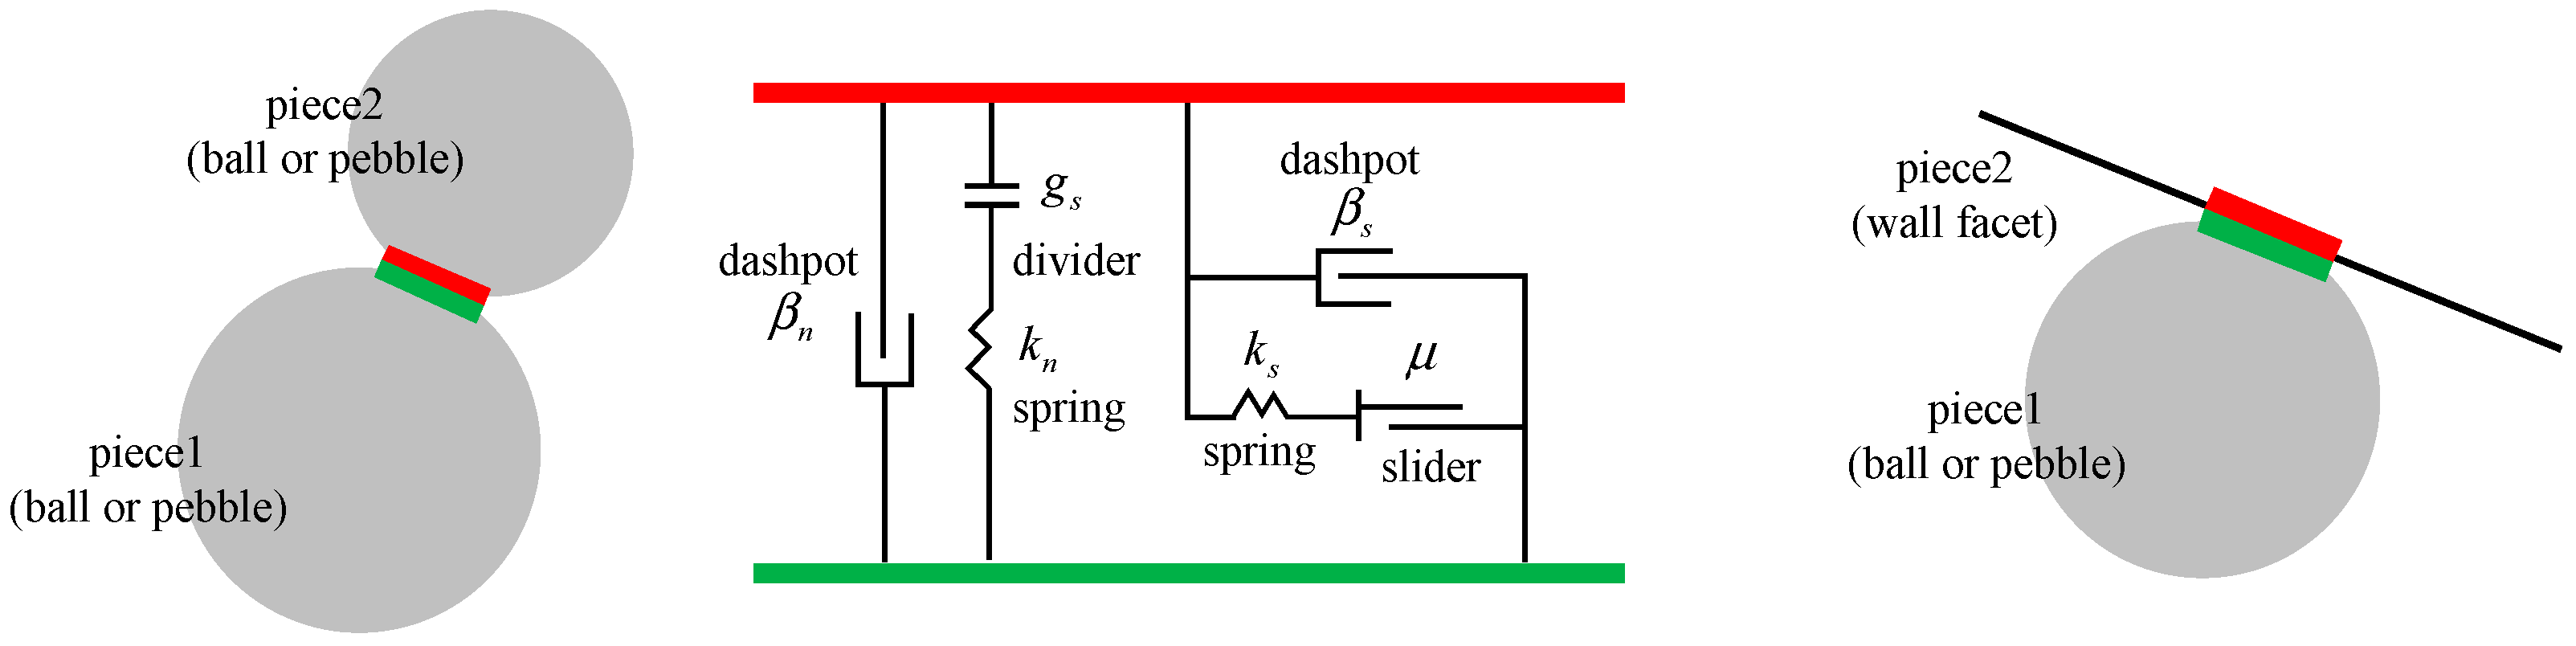
3.1. DEM Modeling

Numerical modeling of three laboratory tests are presented in this section. It is worth noting that such comparison is required to prove the reliability of numerical results. Bearing in mind that the laboratory tests do not provide a large amount of data to gauge the correlation between the settlement pattern on the ground surface or the shear plane geometry and key parameters (i.e., value of height, trapdoor width, pile width, and diameter of sand), additional numerical simulations were performed and are presented in Section 4.
The DEM computer code PFC2D Itasca was used in this study to run the simulations. The linear model depicted in Figure 2 is used to represent the contacts between particles as well as between particles and rigid boundaries [37,38]. The contact force is resolved into linear and dashpot components. The linear component provides linear elastic (no-tension), frictional behavior, while the dashpot component provides viscous behavior (see Figure 2). The linear force is produced by linear springs with constant normal and shear stiffnesses, kn and ks. The dashpot force is produced by dashpots with viscosity given in terms of the normal and shear critical damping ratios, βn and βs. The linear springs act in parallel with the dashpots. The linear springs cannot sustain tension, and slip is accommodated by imposing a Coulomb limit on the shear force using the friction coefficient, μ [37]. The force–displacement law for the linear model calculates the contact force as in Equation (1).
F c = F d + F l
where F d is the dashpot force and F l is the linear force.
The linear force F l includes the normal force F n l and the shear force F s l . The normal force F n l is calculated by Equation (2).
F n l = k n g s
The shear force F s l is calculated by Equation (3).
F s * = ( F s l ) 0 k s Δ δ s
Where ( F s l ) 0 is the linear shear force at the beginning of the timestep, and Δ δ s is the adjusted relative shear displacement increment. More information about the linear model can be found elsewhere [37].
Due to the symmetry of the laboratory test setup, it is sufficient to simulate only one section of the trapdoor test model. The geometric model of the DEM simulations is shown in Figure 3a. The model boundaries and piles are simulated by walls. The pile–subsoil relative displacement (Δs) is simulated by moving down the trap wall at the bottom. To capture the influence of the irregular shapes of sand particles, the soil was modelled with two-ball clumps (as shown in Figure 3b). The random number N decides the diameter of a minor circle ranging from 0.0 to 1.0. This method has been successfully used by Lai et al. [15]. Figure 3c shows the embankment filler generated by the particles. It is recommended to scale up the numerical grain sizes to increase the calculation efficiency [39]. For this purpose, the average grain size of the enlarged grains was considered 1/90 of the width of the trap wall. The micromechanical parameters for the DEM modeling were determined by numerical biaxial compression tests [40]. The material parameters are listed in Table 2.

3.2. Preparation Methods: Laboratory Sample and Numerical Model

The multilayer with under-compaction method (UCM) proposed by Jiang et al. [39] was used to prepare homogeneous specimens by calculating the porosity ratio before compaction. Lai et al. [30] improved Jiang’s packing method and introduced the improved multilayer compaction method (IMCM). However, the compaction process of each layer becomes slower as the number of layers increases, which requires prolonged calculation time. Moreover, special-shaped particles tend to stratify when packed using these methods. This study improves these methods by presenting the following simple and quick sample preparation steps:
(1)
Use the wall to layer the soil sample, generate overlapping balls in each layer according to the specified gradation and porosity. The micromechanical parameters were set as shown in Table 2, where both the interparticle friction coefficient μ and the acceleration of gravity were set to zero to obtain a dense state.
(2)
Cycle enough steps to make the balls collide and squeeze in each layer to make the particles evenly distributed.
(3)
Delete the wall between each layer and cycle enough steps to gain a new equilibrium.
(4)
Replace the ball with a clump in the original position. Follow the principle of equivalent area and mass when replacing. At the same time, the clump is randomly rotated by an angle around the center point to ensure that the particle arrangement is random. Subsequently, the model is cycled through enough steps to reach equilibrium.
(5)
The gravity is restored to the normal level. The frictional coefficient μ is reset to the values in Table 2. The model cycles until reaching the final equilibrium state.
By arranging the measurement circles (with a radius of (s-a)/7) along the height at the center of the trap wall, the distribution of the vertical stress along the height in the embankment can be obtained. The theoretical gravity stresses are calculated by the equation σv = γH, where γ = 16.8 kN/m3 [24]. The initial at rest stress distributions above the center of the trap wall are presented in Figure 4. It can be seen that the numerical results are in good agreement with the theoretical results, which means that a reasonable and uniform initial stress state has been generated by this method.

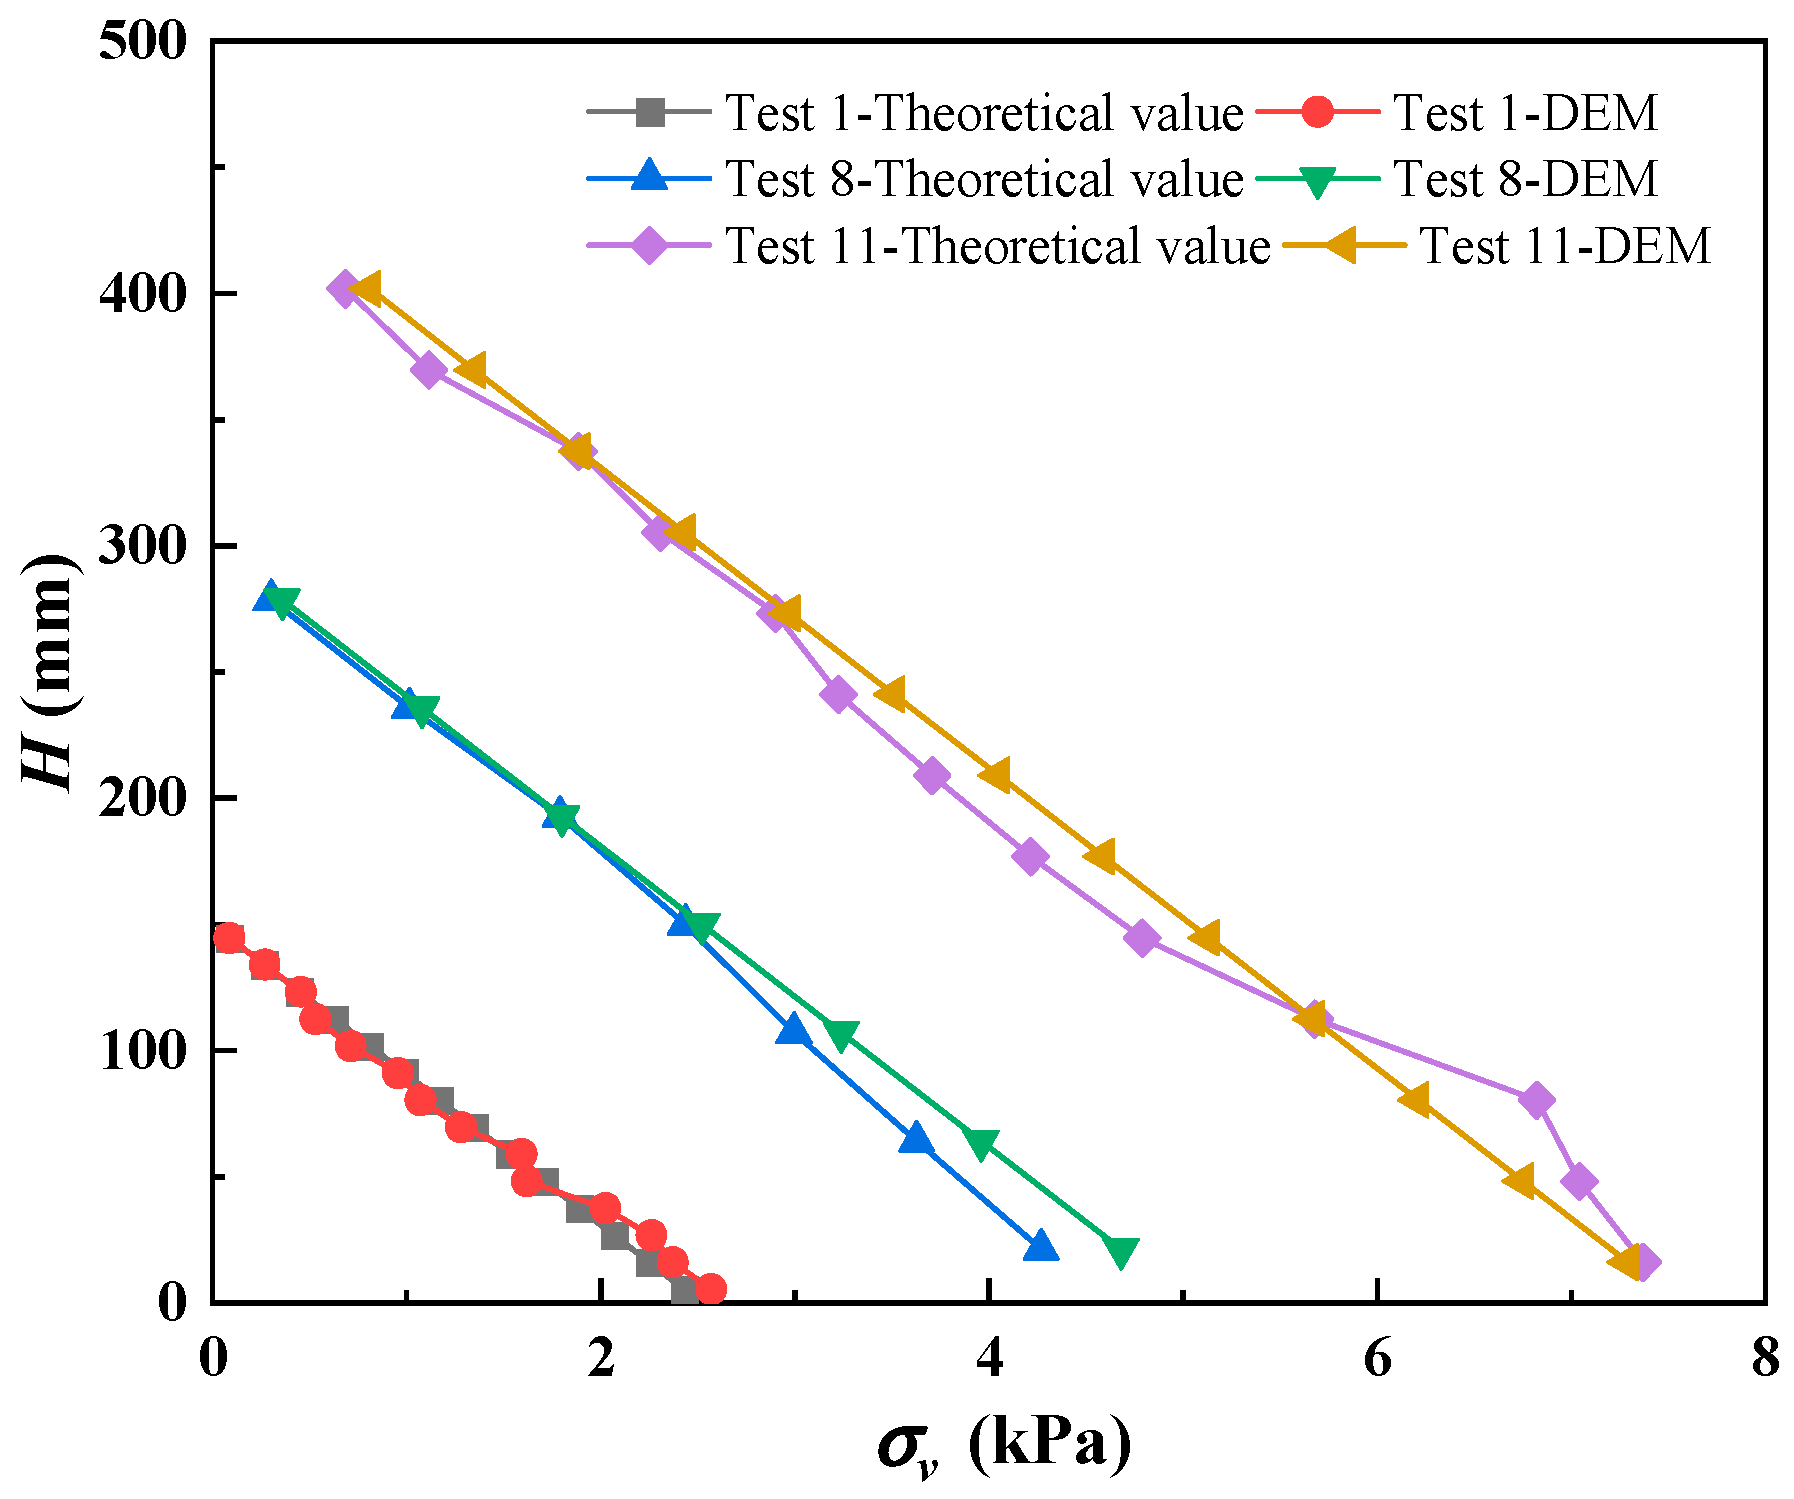
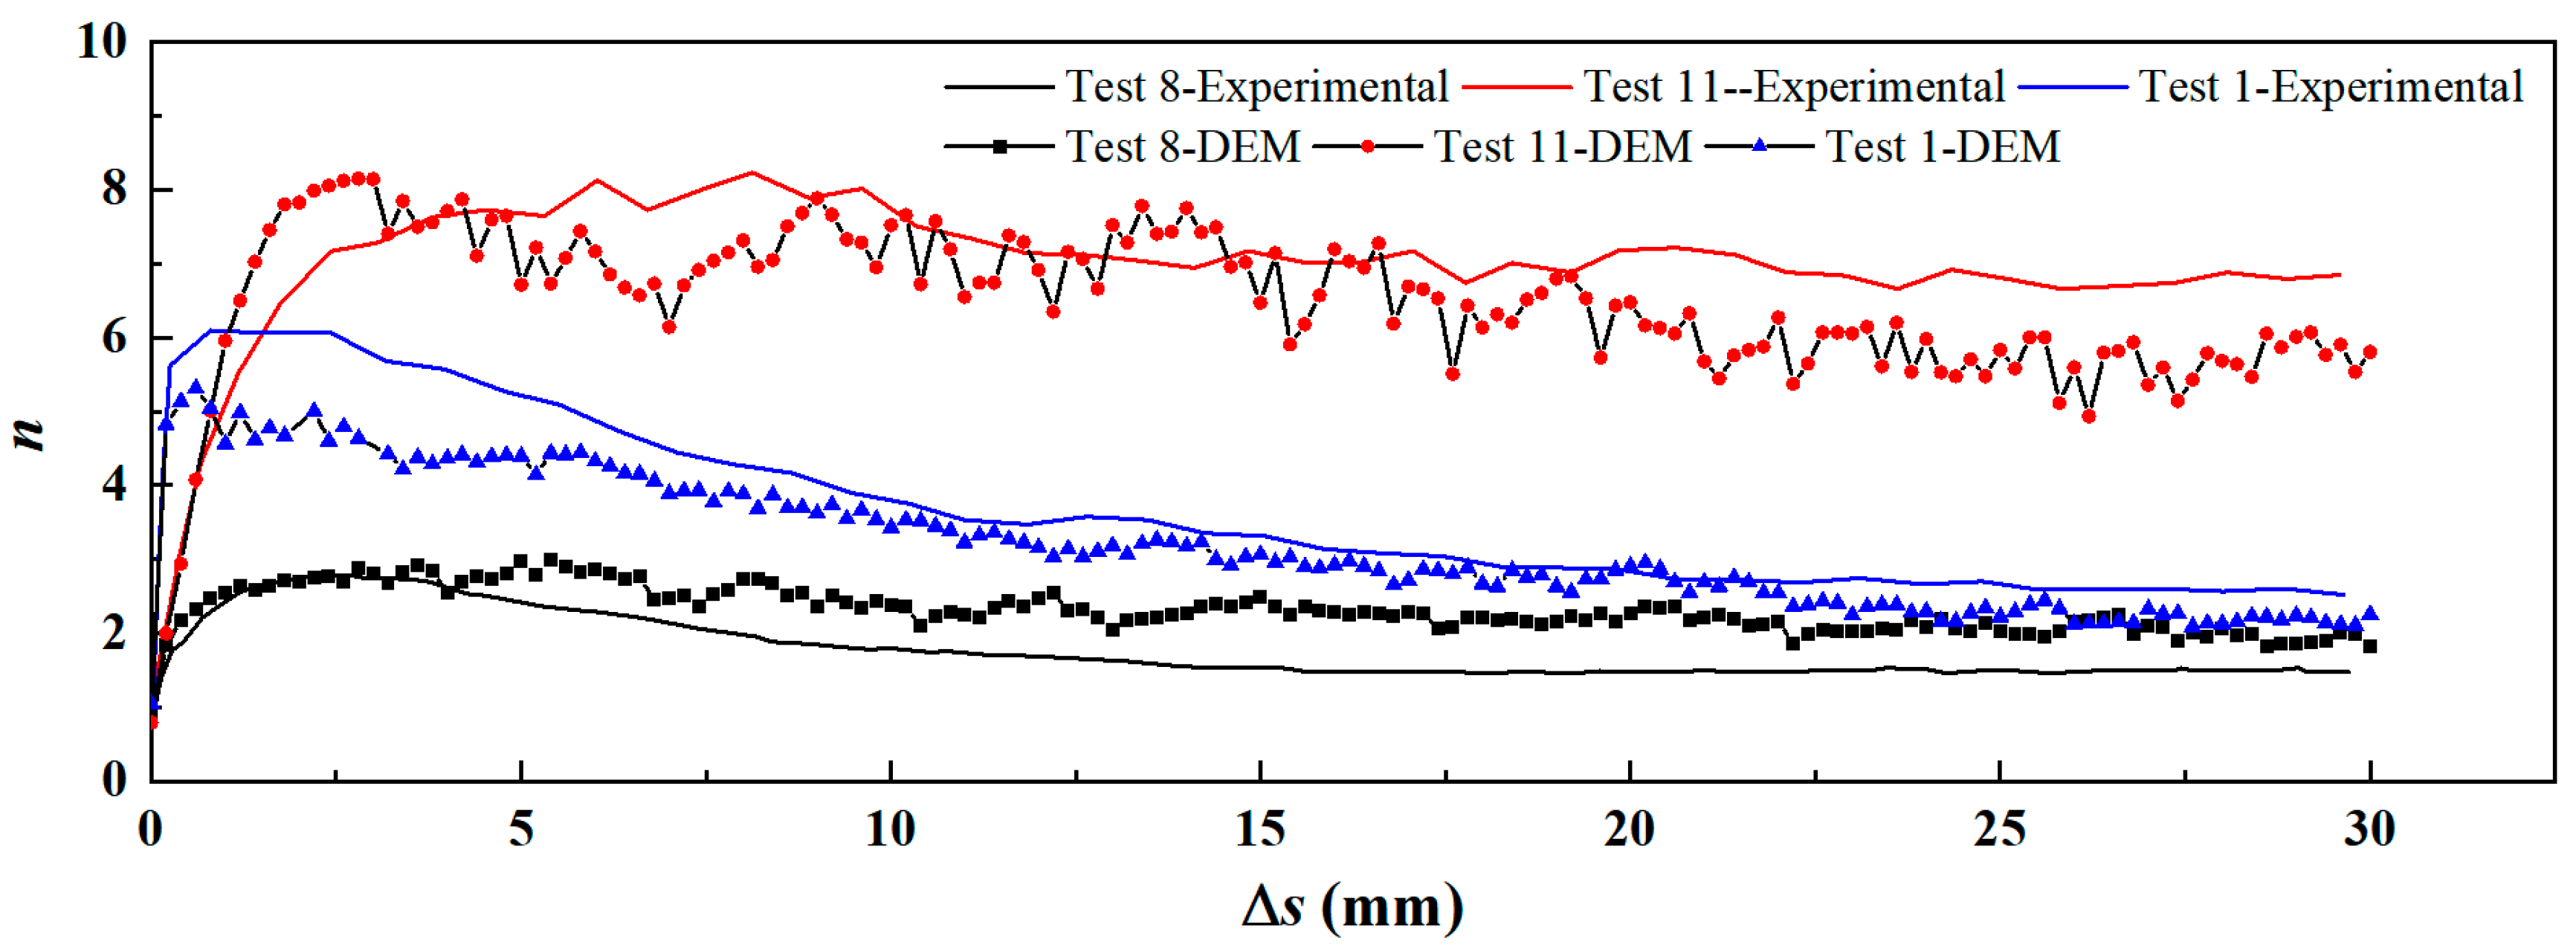
3.3. Validation of DEM Modeling

The results obtained from the numerical simulation were validated with the experimental results presented by Rui et al. [24]. The trap wall speed is always kept at 0.004 m/s to improve the calculation efficiency in the numerical model. The displacement interval of the trap wall is 0.2 mm for each stage (the same as that used for the laboratory test) until the downward movement amount reaches 30 mm. The vertical force acting on a trap wall and pile is recorded throughout the DEM numerical simulations.
Figure 5 shows the comparison between the slip surfaces obtained from the laboratory tests and DEM models (Δs = 30 mm). The sliding surface in Test 1 obtained by the DEM models is a tower-shaped upward development of the embankment surface, the slip surface of Test 8 is a triangle, and the embankment surface develops significant differential settlement. The slip surface in Test 11 has a certain height with almost no differential settlement on the embankment surface. The slip surfaces are similar in both simulation and experimental results, indicating that the numerical simulation results can reflect the three slip surface development models.
Han and Gabr [41] proposed the concept of pile-soil stress ratio to describe the extent of the soil arching, as shown by Equation (4):
n = σ p σ s
where σp is the average pressure acting on the pile head (or pile cap) and σs is the average pressure acting on the subsoil. The larger the value of n, the more prominent the soil arching effect. For Δs = 0 mm, the value of n would be 1.0.
In the DEM models, σp is the average vertical stress on the two halves of the pile, and σs is the average vertical stress on the trap wall. Figure 6 exhibits a comparison between the pile–subsoil stress ratio n obtained from the laboratory tests and DEM models. According to this figure, as the trap wall moves down, Test 1 and Test 8 quickly reached the peak, while Test 11 reached the peak at about Δs = 2 mm. After reaching the peak, Test 1 decreased with Δs increasing, indicating that the soil arching effect was weakening, and Test 8 remained unchanged after a period of decline. Test 11 remained stable for a long period after reaching the peak, indicating that the soil arching effect in Test 11 remained stable after reaching the peak. The numerical simulation curve agrees with the curve from the experiment. This affirms that the selection of parameters and the modeling steps are reasonable and can reflect the actual soil arching effect.

3.4. Analysis of the Equal Settlement Pattern

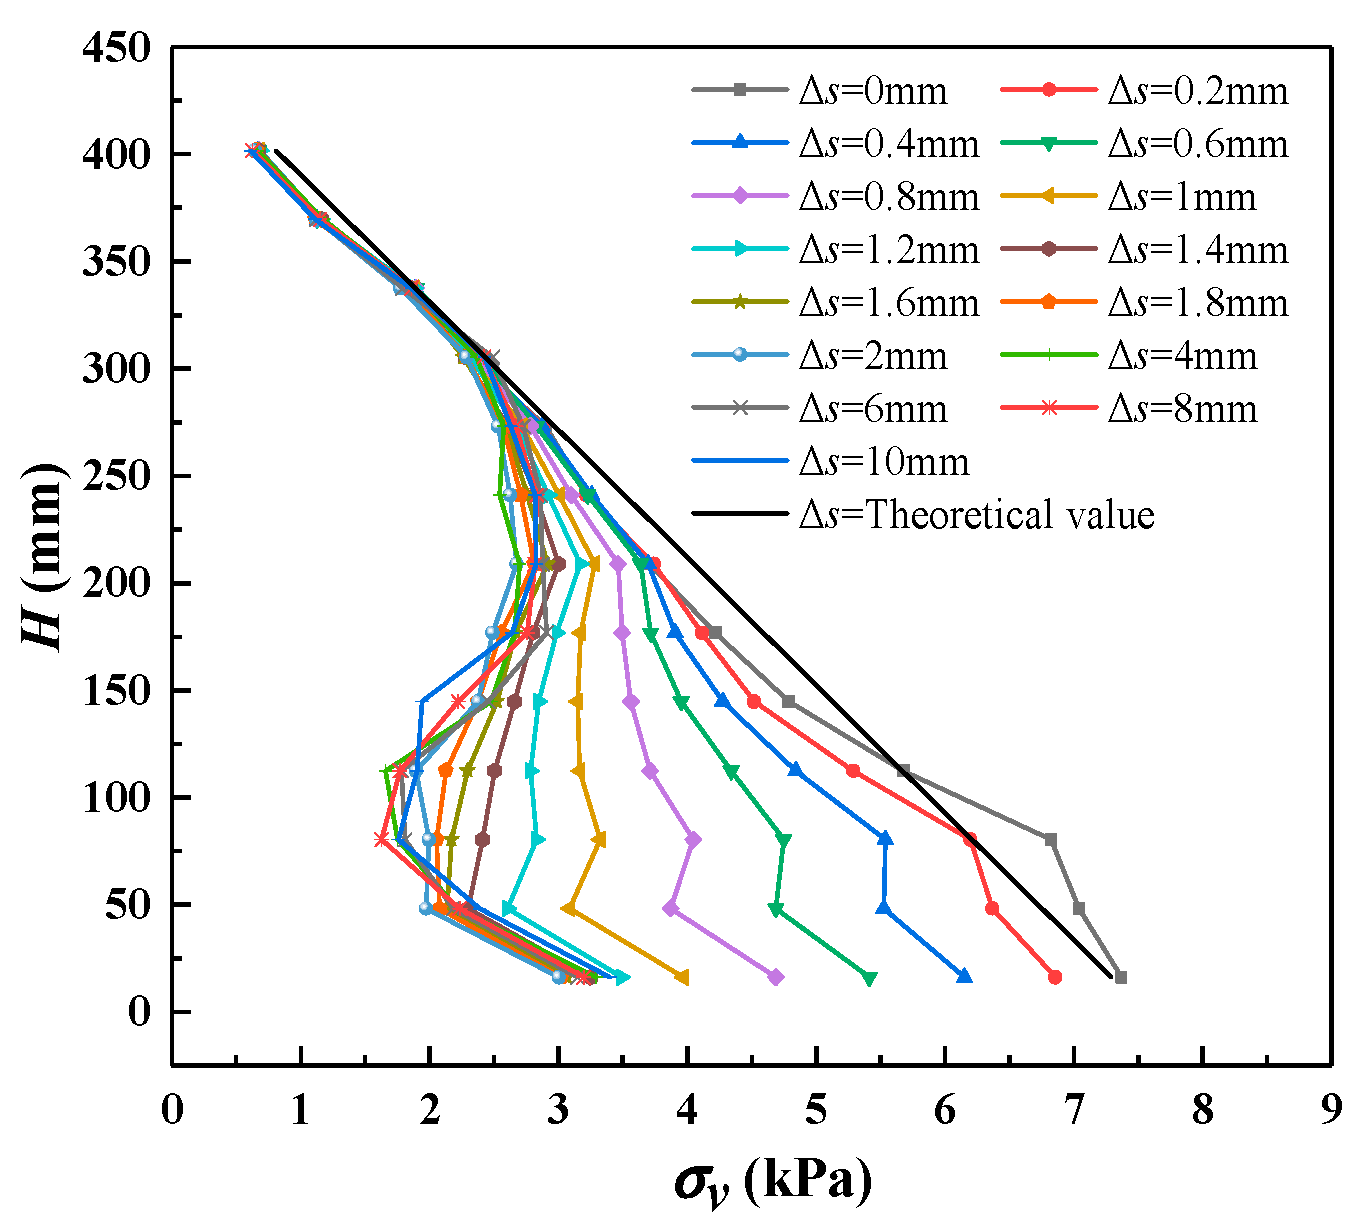
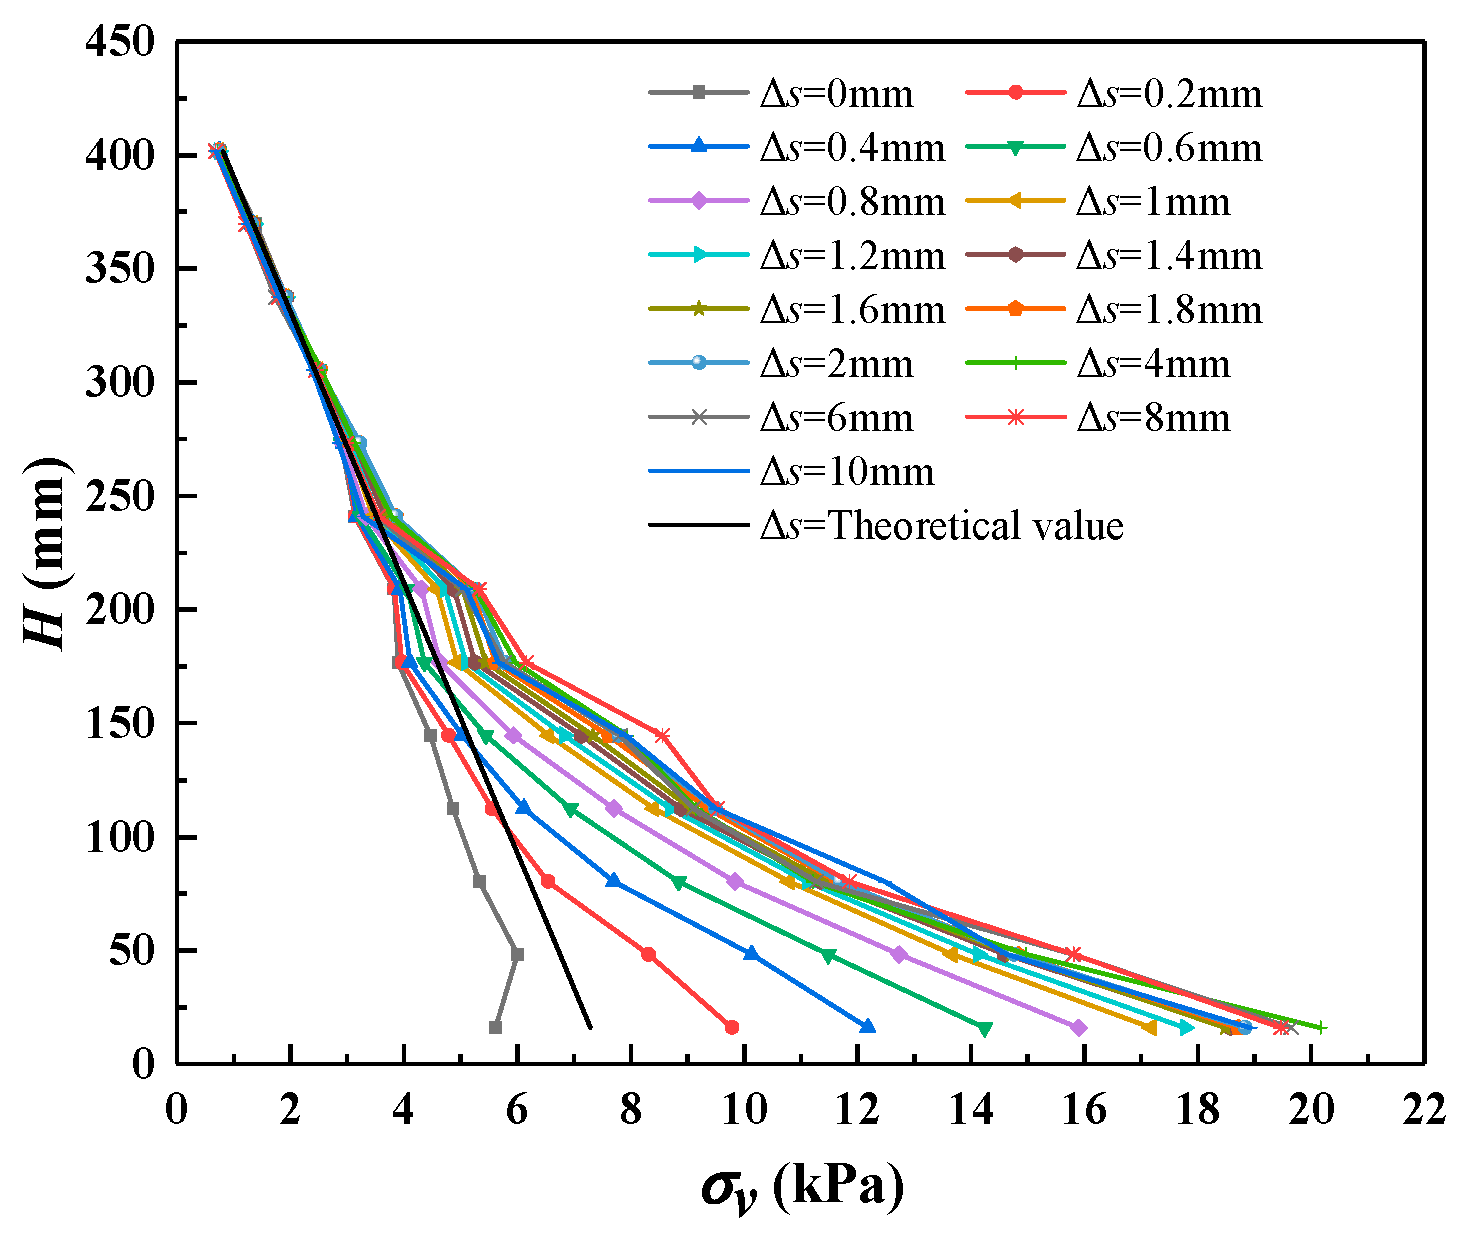
3.4.1. Vertical Stress

According to the previous research findings, the soil arching of the equal settlement pattern is a “full arch”, and there is no differential settlement on the embankment surface [15,24]. This pattern is exactly what the actual project needs. Next, macro- and microanalysis of the soil arching structure in the equal settlement pattern is carried out for Test 11.
For the equal settlement pattern in Test 11, the deflection of principal stress and contact force chains (the thicker, the greater the force) for different Δs values are presented in Figure 7. It can be seen that the soil arching in the embankment formed gradually as the trap wall moved downwards. In Δs = 2 mm, the soil arching formed a semi-elliptical shaped structure, which remained stable afterwards.
By arranging the measurement circles at the center of the trap wall and the center of the half-pile on both sides, the vertical stress at the center of the movable door and the center of the half-pile (taking the average value of both sides) under different Δs along the height of the embankment can be obtained, as shown in Figure 8 and Figure 9. According to Figure 8, with the increase in Δs, the vertical stress above the center of the trap wall gradually deviates from the theoretical value. In Δs = 2 mm, the vertical stress curve remained unchanged, and the final vertical stress curve was Z-shaped. This is consistent with the semicircular soil arching hypothesis of the H&R method. Figure 9 displays that the vertical stress above the center of the half-pile increases gradually with the downward movement of the trap wall. In Δs = 2 mm, the vertical stress curve remained unchanged. This is due to the formed soil arching being stabilized, and the vertical stress on the trap wall and the pile stays stable.

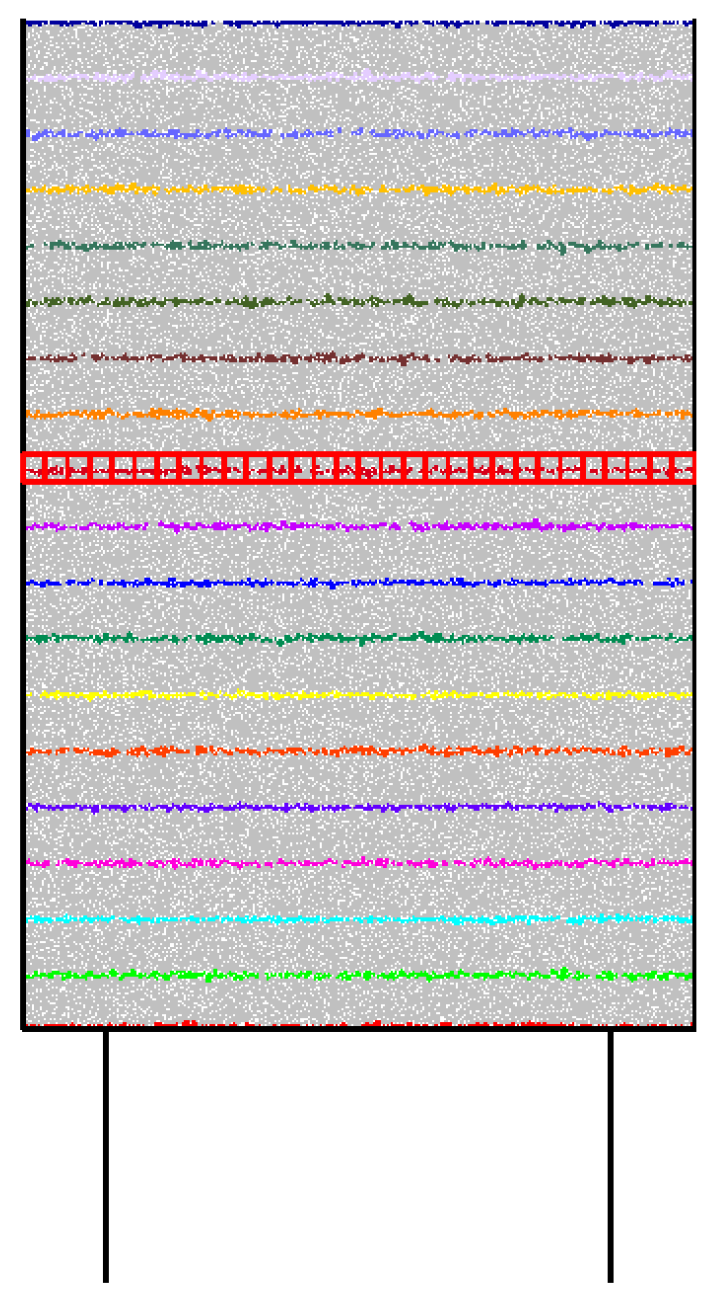
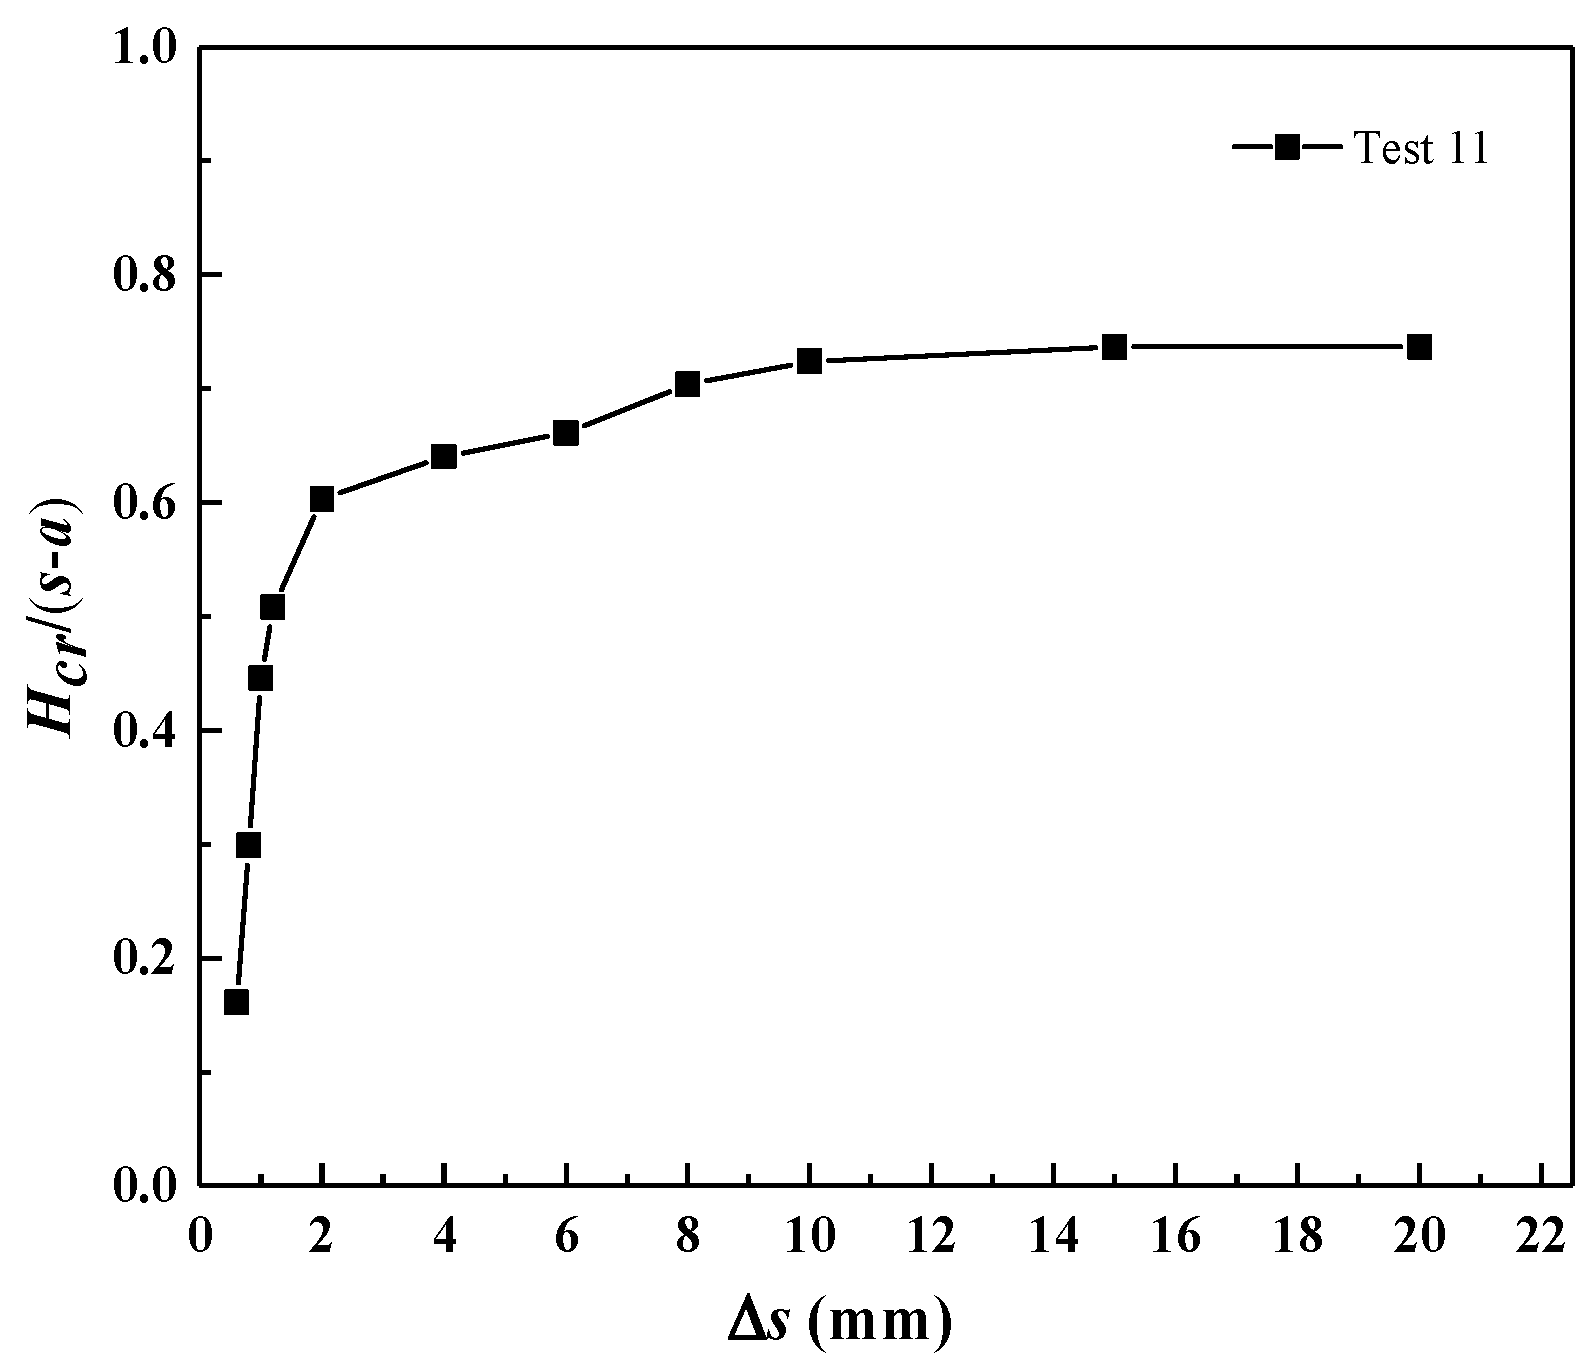
3.4.2. Equal Settlement

The formation of soil arching depends on the displacement of soil particles in the embankment, and a significant vertical displacement takes place during the downward movement of the trap wall. Therefore, the vertical displacement was monitored for the equal settlement pattern in Test 11.
Before moving the trap wall down, the particles of the same height are divided into layers, the layer spacing is 25 mm, and the particles of the same layer are divided into multiple sections at intervals of 10 mm, as shown in Figure 10. In calculation of the vertical displacement, the average value of the vertical displacement of the particles in the partition is taken. To eliminate the asymmetry on both sides of the soil arching, half the average value of vertical displacement was considered and the upward direction was taken as positive. Then, the vertical displacement range ΔU (vertical displacement of the soil particles in the numerical models) at a certain layer can be expressed as:
Δ U = d max d min
where dmax and dmin are the maximum and minimum value of the average vertical displacement in all sections after averaging each layer in half, respectively.
Figure 11 shows the vertical displacement for each section layer when Δs = 10 mm. It can be seen that as the height of the embankment increases, the vertical displacement of the soil on the trap wall is gradually reduced, while the vertical displacement of the soil on the pile is gradually increased. When the vertical displacement of the soil on the trap wall and the soil on the pile is the same, an equal settlement is formed, and the soil above this height sinks simultaneously.
According to Chen et al. [35], the vertical displacement of a layer (ΔU) in equal settlement patterns is less than (s-a)/500 (i.e., 0.45 mm in Test 11). The maximum value of the average height of each section in this layer is the critical height Hcr.
Figure 12 shows the vertical displacement range (ΔU) of each layer for different Δs, where the height of the equal settlement is standardized. The red line indicates that the range is 0.45 mm, the layer particles within the red line sink synchronously, and the layer particles outside the red line settle unevenly. The intersection of the red line and the broken line is the current critical height (Hcr).
Figure 13 shows the changes in height of the equal settlement when the trap wall moves downwards. Initially, the position of the equal settlement shifts upward as the trap wall moves down. In Δs smaller than 2 mm, a sharp increase in the equal settlement is observed, after which the increase in the equal settlement is gradual. As the trap wall moves down by 10 mm, the position of the equal settlement remains unchanged and stable at 0.7(s-a), which is smaller than the 0.8(s-a) reported by Lai et al. [15]. Moreover, it was shown in Section 3.4.1 that the internal soil arching remained unchanged after the trap wall moved down 2 mm, indicating that the equal settlement is still moving up after the soil arching in the equal settlement pattern is stabilized, and the equal settlement does not move up after reaching a critical point.

4. Influence of Pile Cap Width and Embankment Height on the Formation of the Equal Settlement Pattern

4.1. DEM Simulation Conditions

Rui et al. [24] found that the width of the pile cap and the height of the embankment have an important influence on the formation of the equal settlement pattern, but did not explain the mechanism. Therefore, five DEM simulation conditions as shown in Table 3 were designed with reference to the conclusions made on the three expected displacement patterns presented by Rui et al. [24]. The width of the trap wall of the five DEM simulation conditions is 250 mm, and the particle size ranges between 0.25 mm and 0.425 mm.

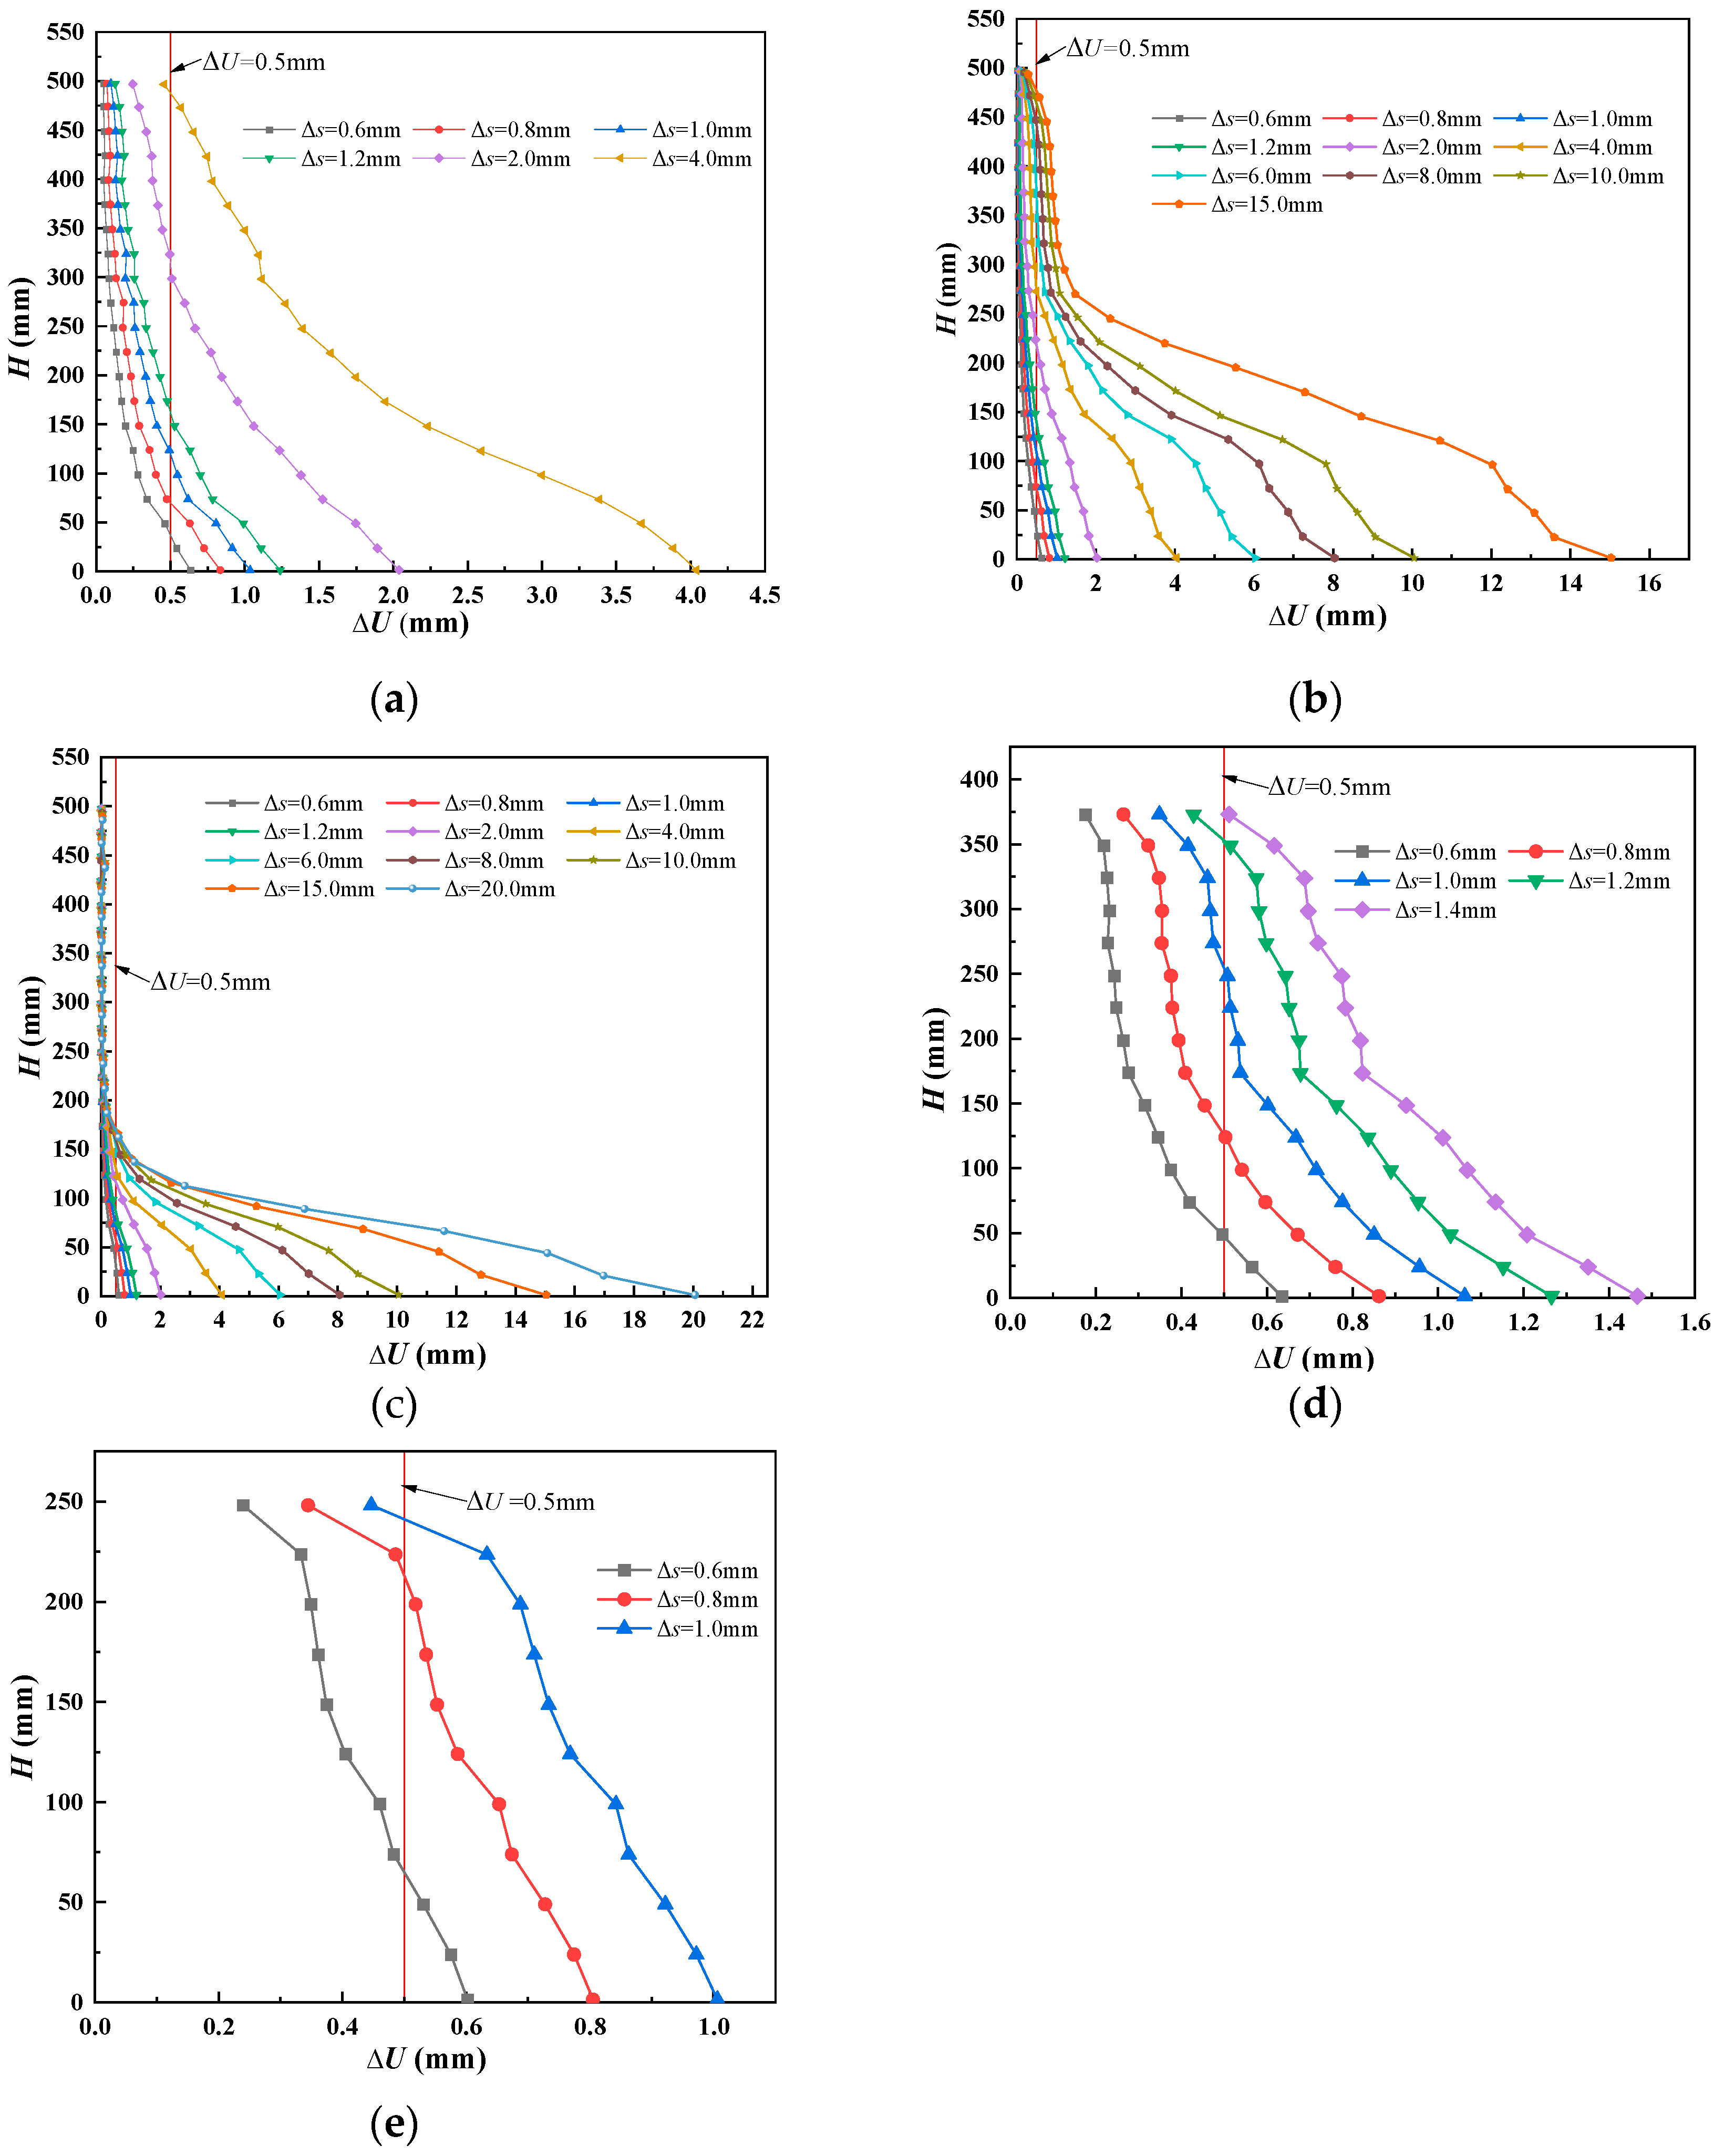
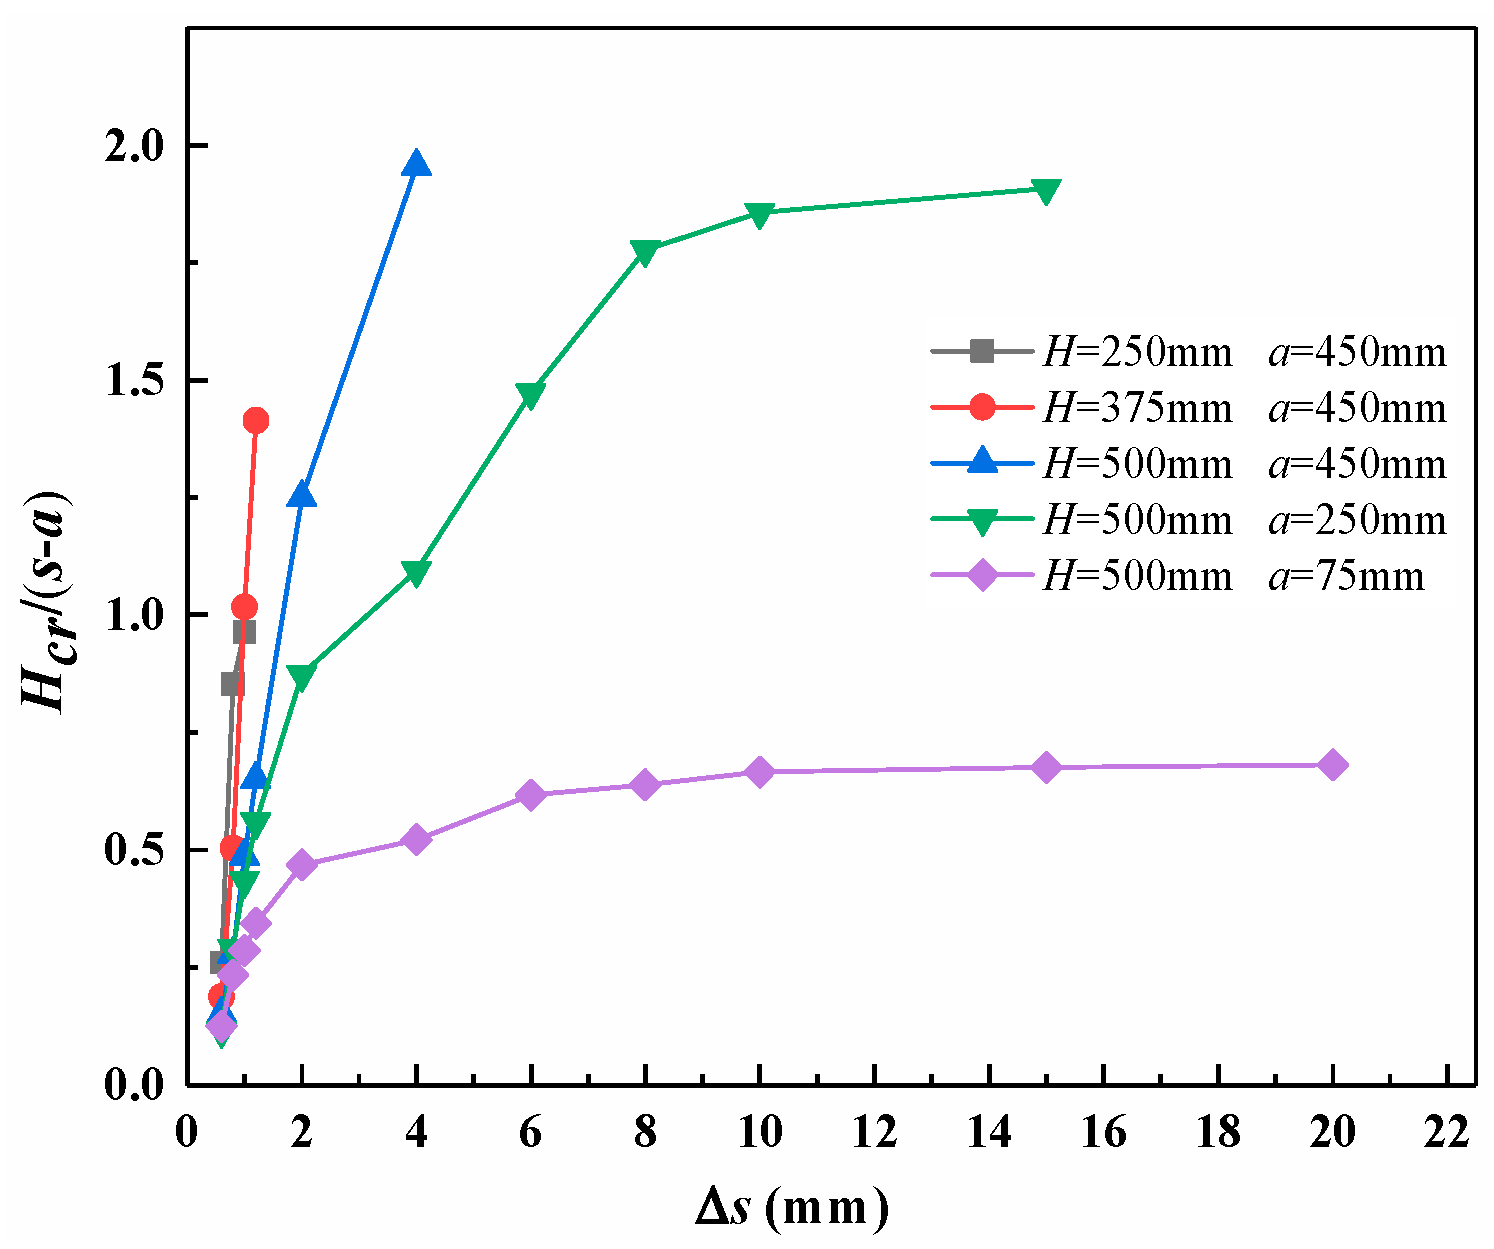
4.2. Vertical Displacement
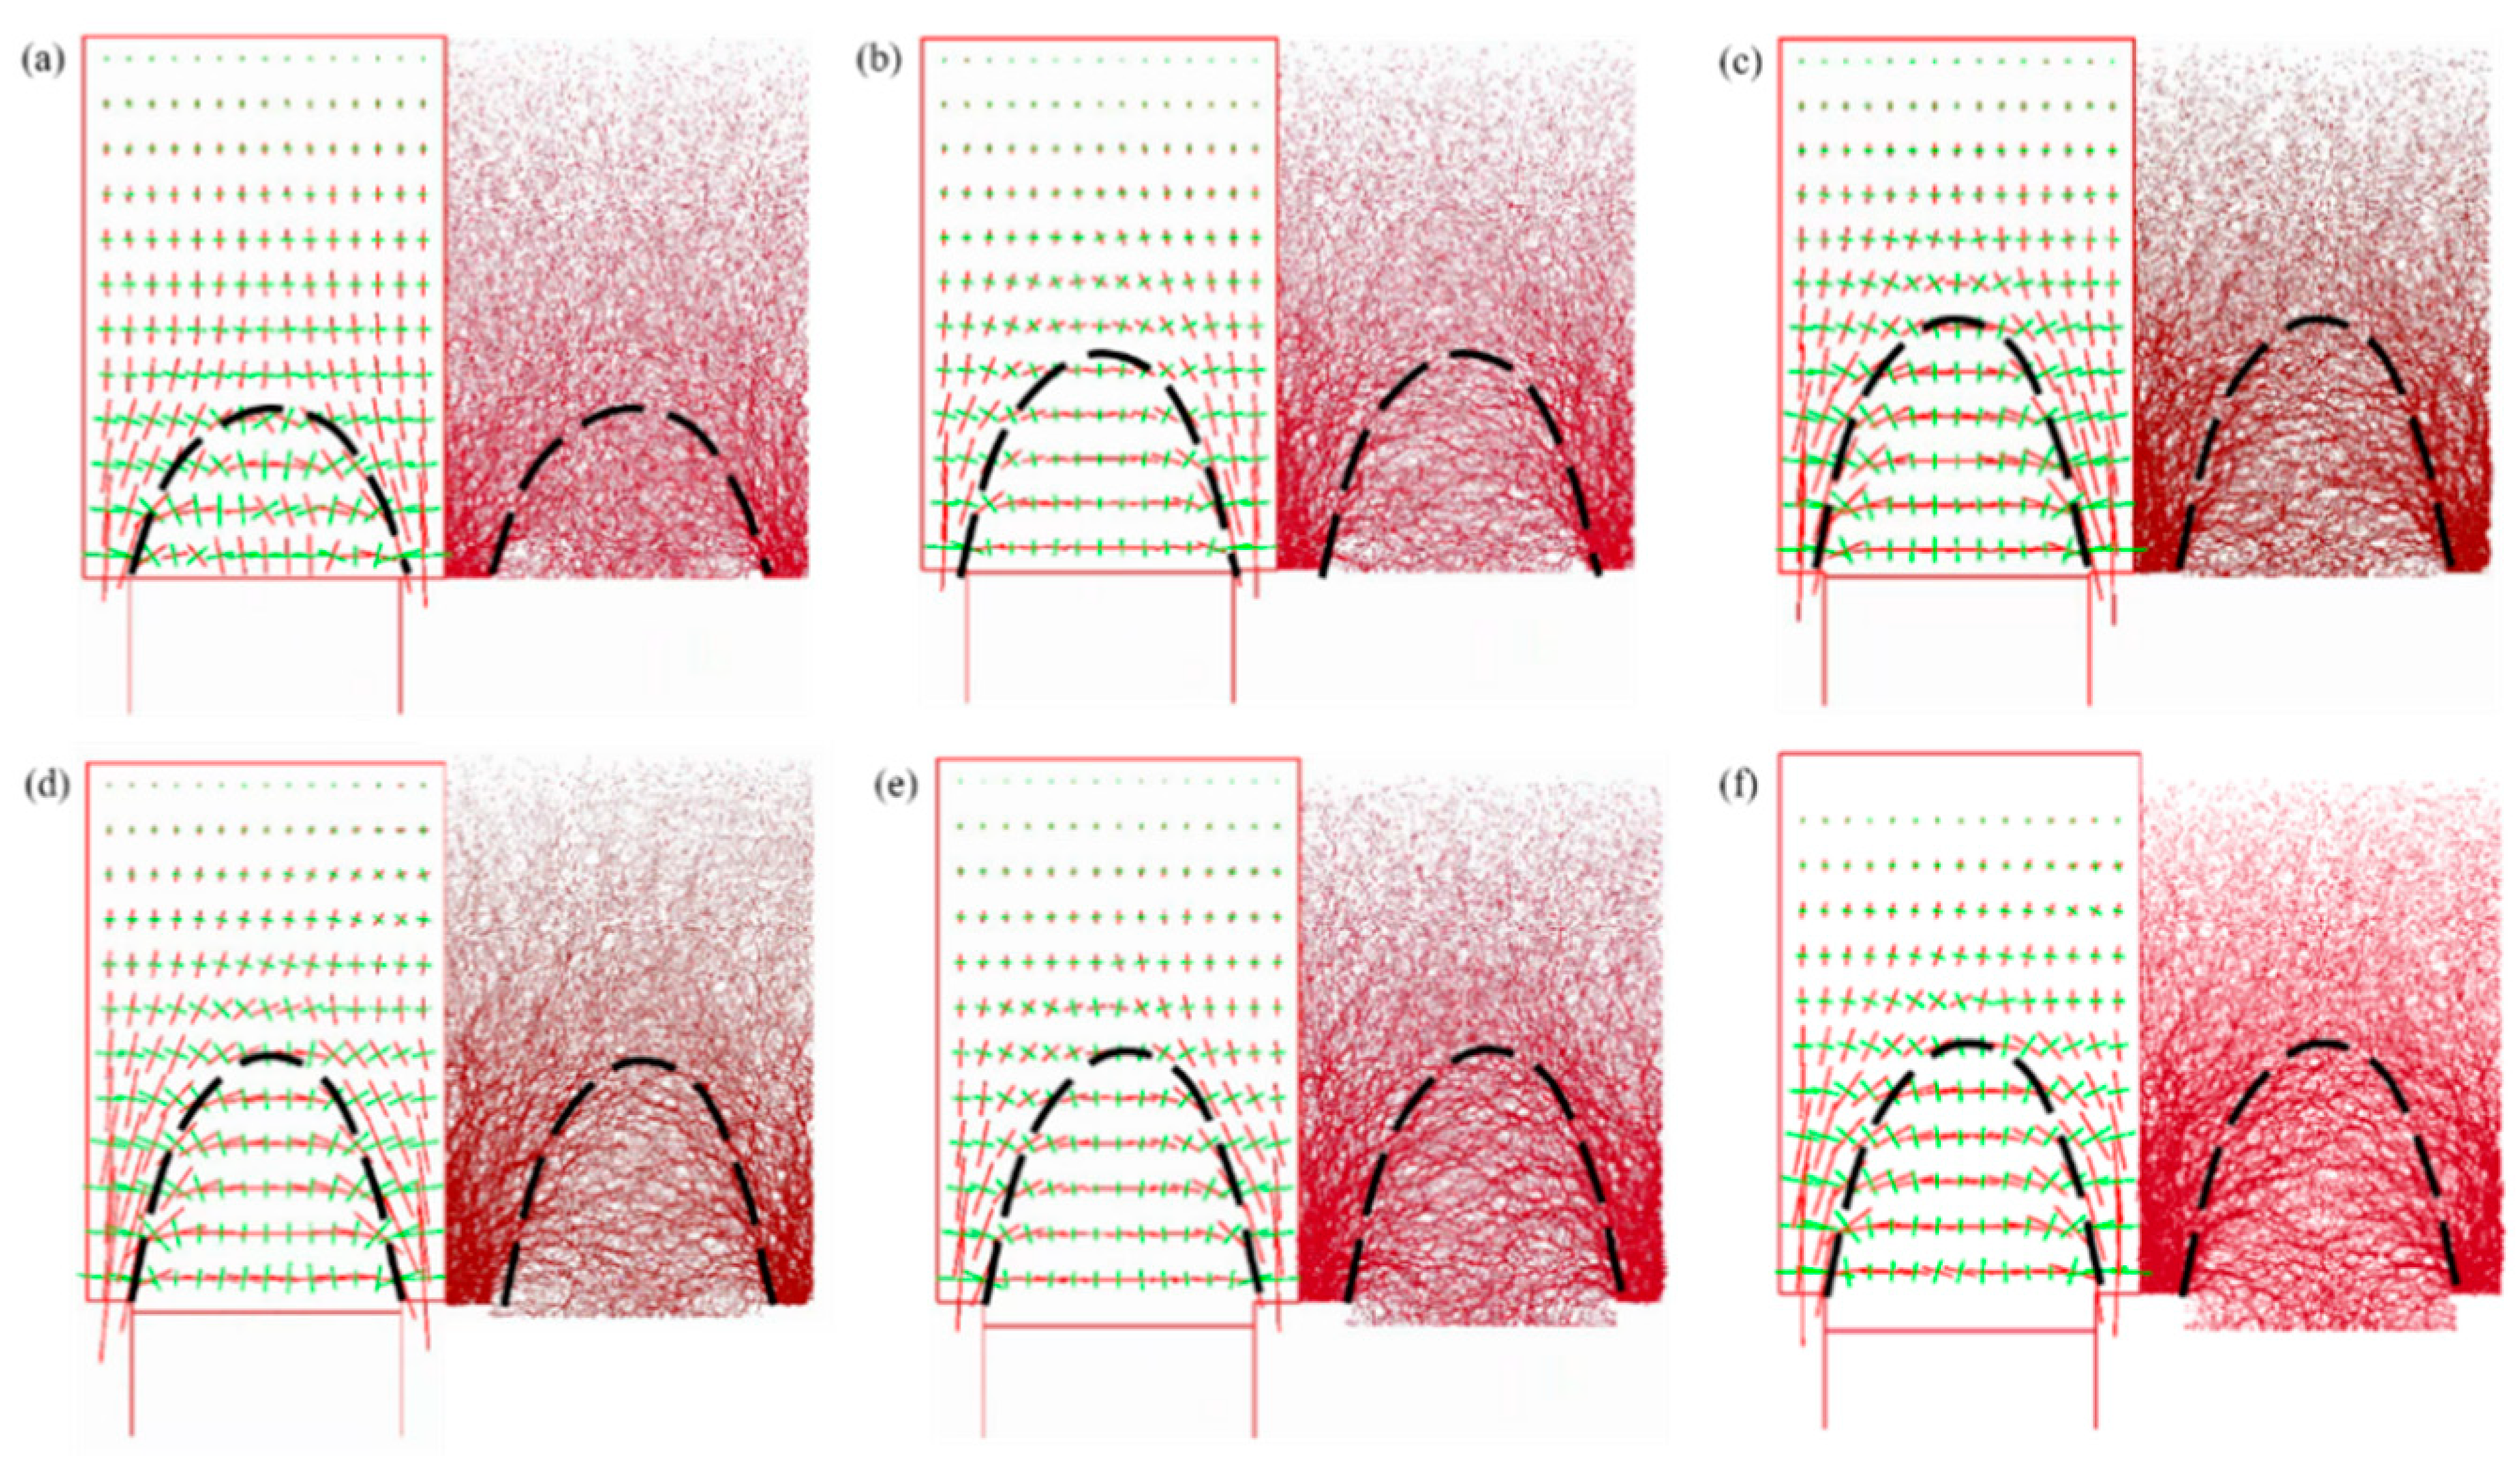
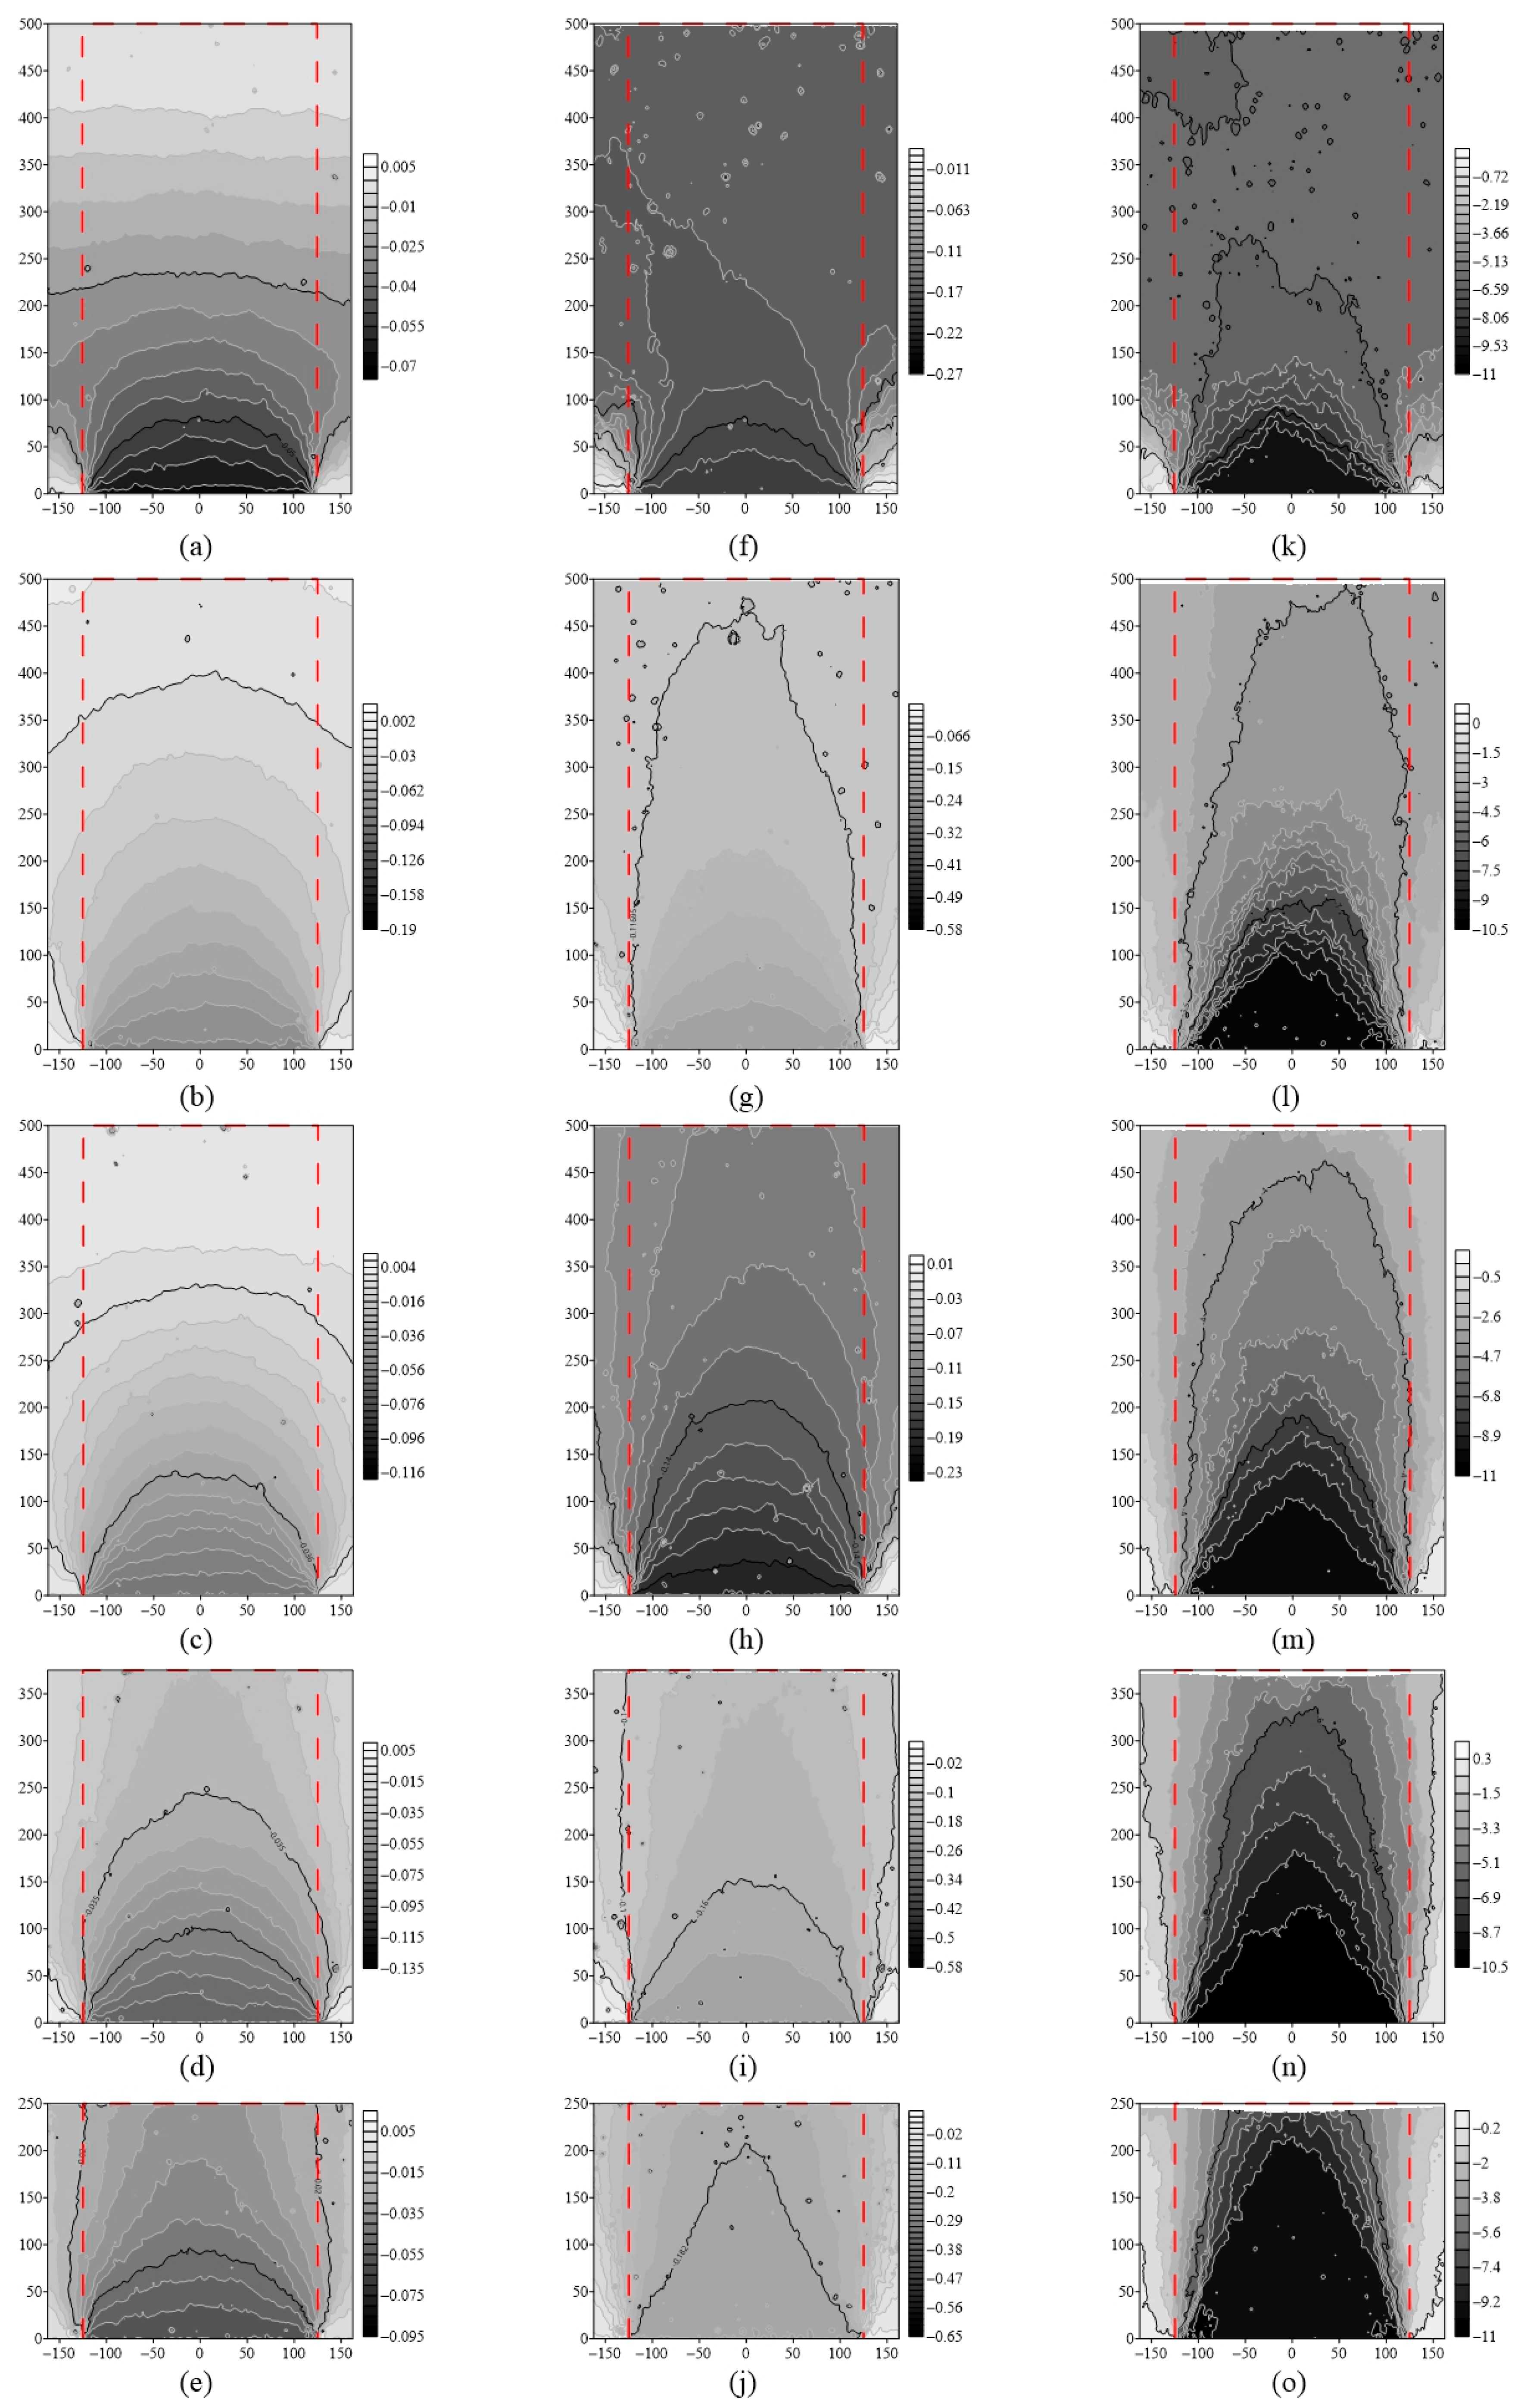
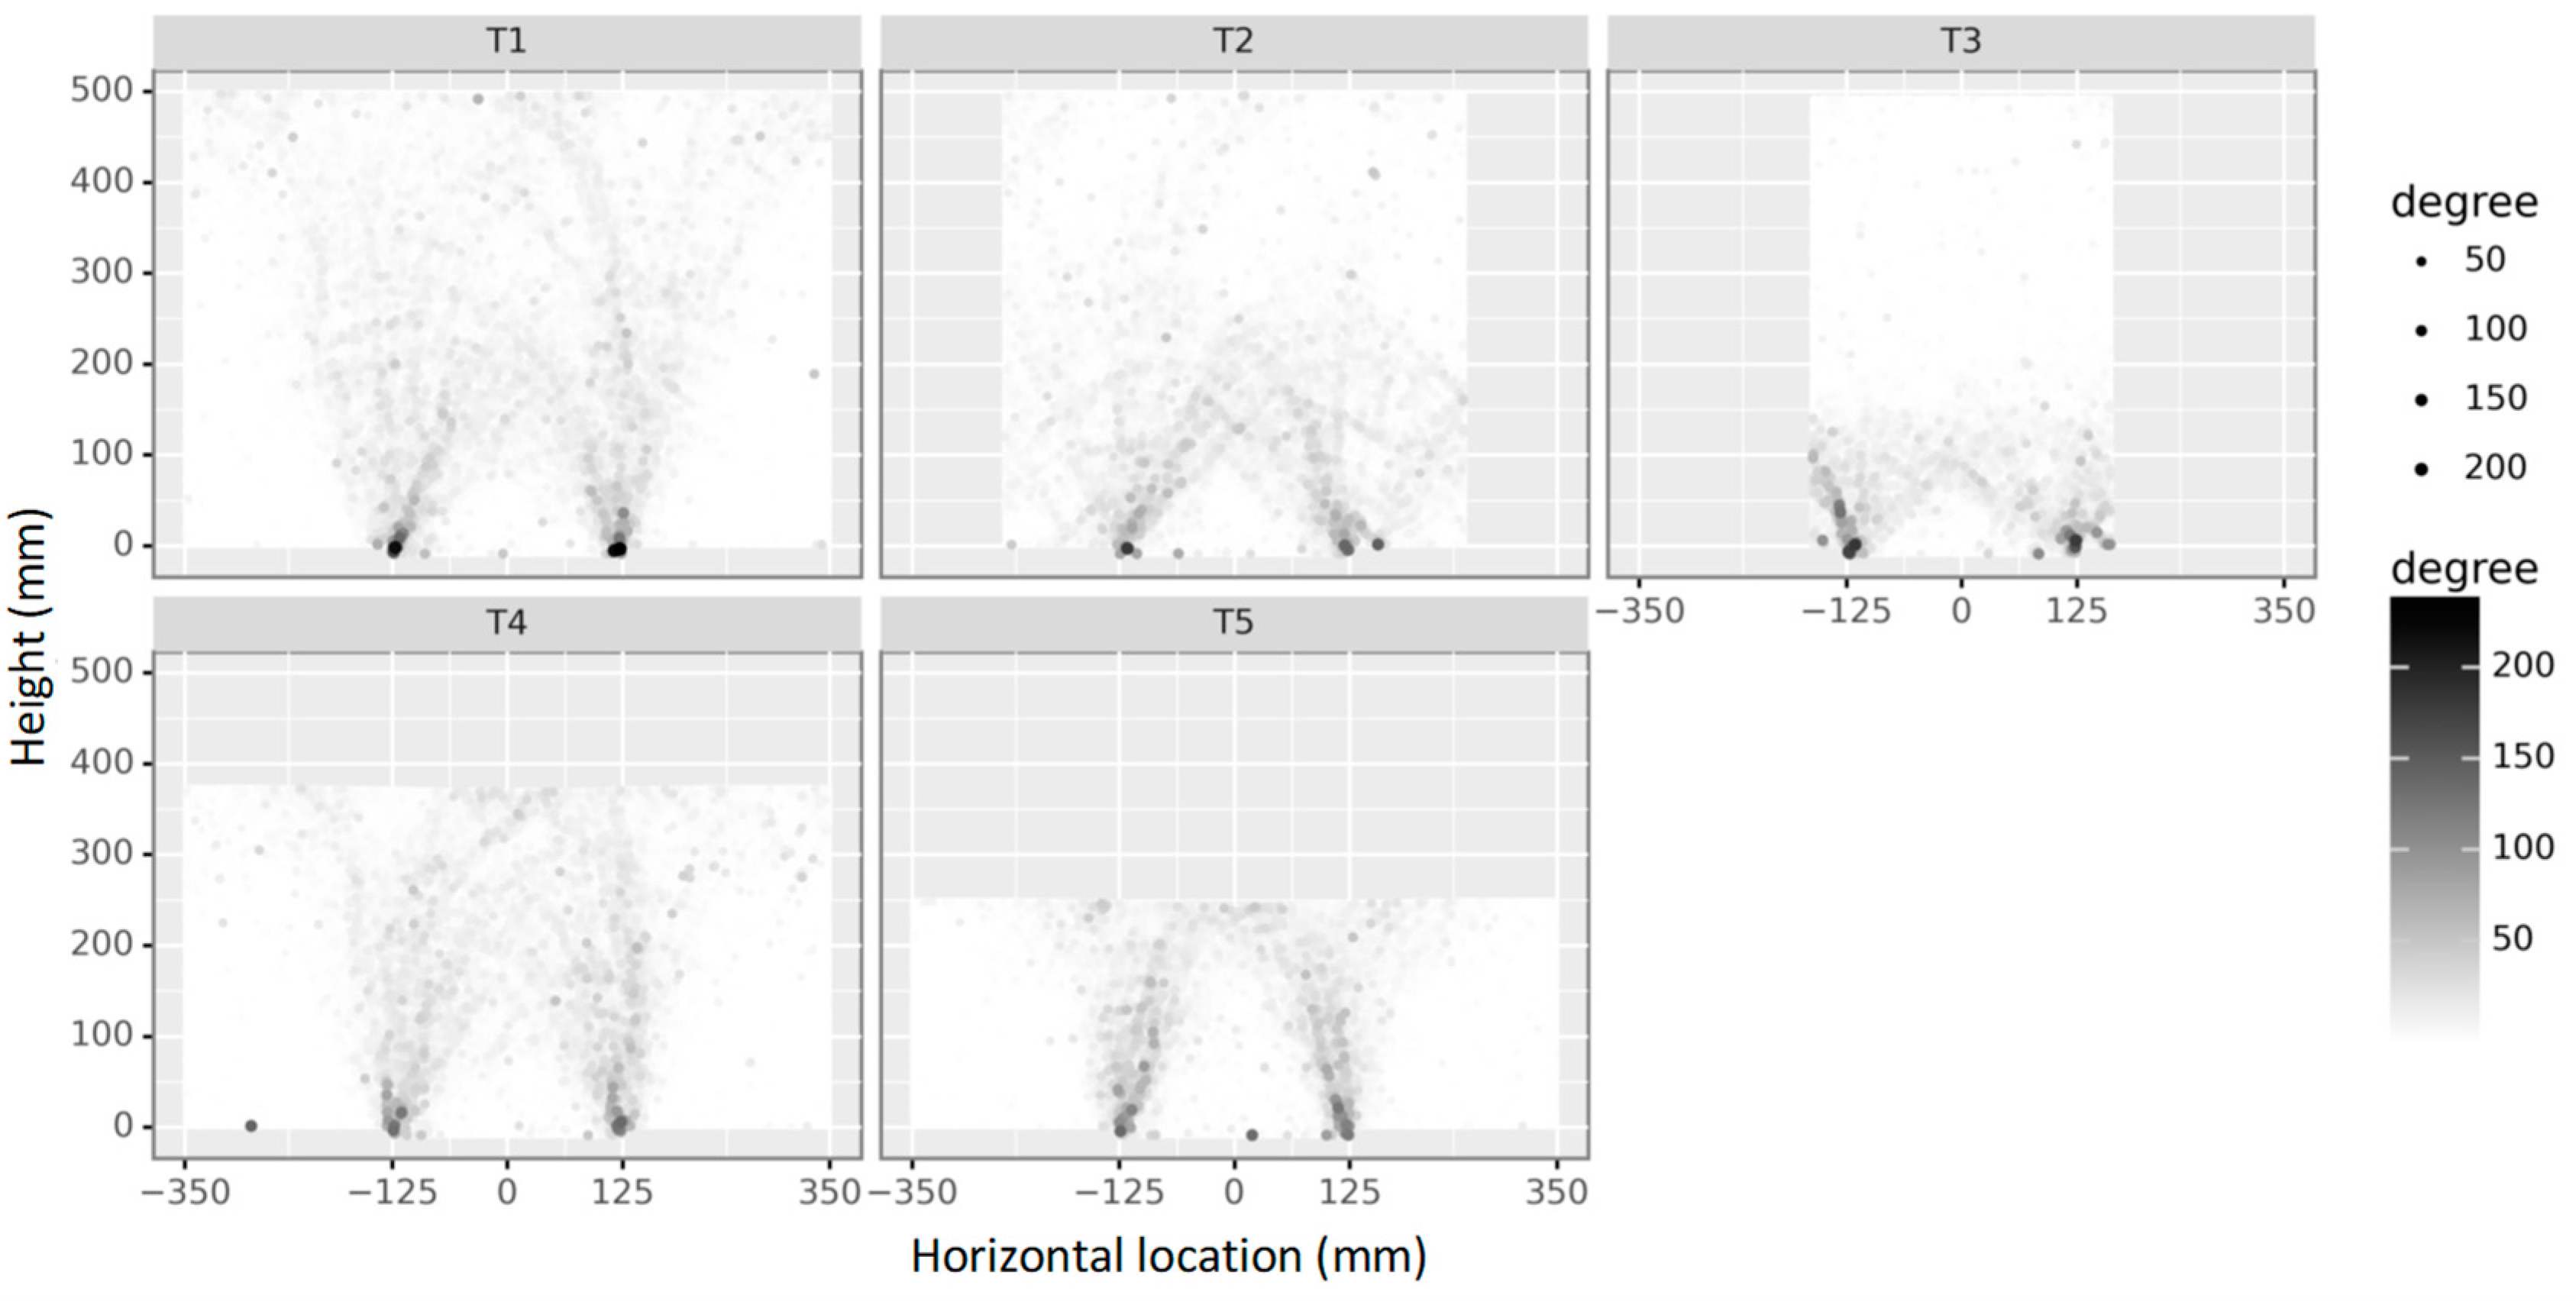
To compare the effects of pile cap width (a) and embankment height (H) on the vertical displacement of soil particles in the embankment and equal settlement, the soil particles within 160 mm from the center of the trap wall were used for vertical displacement analysis. As discussed in Section 3.4.2, the particles in the area under each condition are divided into layers, and the vertical displacement range value in different Δs is counted, as shown in Figure 14a–e. The red line indicates that the range value is 0.5 mm. The height of the equal settlement is determined by the intersection of the red line and the curve, so that the upward movement of the equal settlement in the process of moving the trap wall under each condition is obtained, as illustrated in Figure 15, where the height of the equal settlement is normalized.
Figure 14a,d,e displays the position the equal settlement has reached on the surface of the embankment, and uneven settlement begins to occur on the surface of the embankment for the T5 case and when Δs = 1 mm. For the T4 case and when Δs = 1.4 mm, uneven settlement occurs on the surface of the embankment. A similar situation takes place for the T1 case and when Δs = 4 mm. Figure 15 shows that the height of the equal settlement decreases with the increase in the height of the embankment (H) for the constant Δs. For instance, when Δs = 0.8 mm, the height of the equal settlement for the T5, T4, and T1 cases are 0.85(s-a), 0.50(s-a), and 0.27(s-a), respectively. When Δs = 1 mm, the height of the equal settlement for the T5 case is lower than that of T4 because the particles in the middle of the embankment surface are squeezed and moved up. These observations indicate that as the height of the embankment (H) increases, the differential settlement decreases and the equal settlement moves more slowly with the increase in Δs, which facilitates the formation of the equal settlement pattern.
Figure 14a–c indicates that the equal settlement in the T1 and T2 cases moves up gradually to the surface of the embankment as the trap wall moves down. The embankment surface is unevenly settled in the T1 case when Δs = 4 mm. The uneven settlement of the embankment surface occurs at Δs = 15 mm for the T2 case. The height of the equal settlement (Hcr) in the T3 case does not increase further after moving up to about 0.7(s-a), forming the equal settlement pattern, which is the same as the Test 11 findings. Figure 15 illustrates when Δs is constant, the height of the equal settlement decreases with the reduction in the width of the pile cap (a). For example, when Δs = 4 mm, the embankment surface in T1 has already undergone uneven settlement, and the heights of the equal settlement in the T2 and T3 cases are 1.09(s-a) and 0.52(s-a), respectively. This shows that as the width of the pile cap (a) decreases, the differential settlement of the pile-soil decreases. As the trap wall moves down, the equal settlement moves more slowly, which is beneficial to the formation of the equal settlement pattern.
Figure 16 shows the vertical displacement range for each layer. Among the T1, T4, and T5 cases, T1 with an embankment height of 500 mm has the smallest differential settlement in each layer, T5 with an embankment height of 250 mm has the largest differential settlement, and T4 with an embankment height of 375 mm is placed between T1 and T5, indicating that the increase in the height of the embankment (H) facilitates the reduction in the differential settlement of pile-soil. Between T1, T2, and T3 cases, T3 with a pile cap width of 75 mm has the smallest differential settlement in each layer, T1 with a pile cap width of 450 mm has the largest differential settlement in each layer, and T2 with a pile cap width of 250 mm is between T1 and T3, indicating the reduction of pile cap width is beneficial to reduce the differential settlement of pile-soil.
Rui et al. [24] investigated the conditions which influence the formation of the equal settlement pattern through different combinations of H, a, and (s-a): (s-a)/a ≥ 2.5. This ignores the influence of the embankment height (H) on the equal settlement pattern. The increase of the embankment height (H) helps to reduce the differential settlement of pile-soil. Therefore, the conditions for the formation of the equal settlement pattern should also include the embankment height (H).
When the trap wall just starts to move, a layer of particles close to the trap wall moves down synchronously to form the first displacement contour, and the particles near this layer fall synchronously with the particles of this layer to form the second displacement contour. Cyclically, the vertical displacement of the particles is transmitted upwards, forming the displacement wave, but due to the limitation of the soil on the pile, the vertical displacement is smaller as it is transmitted upwards. Therefore, the development of the displacement wave in the embankment along with the movement of the trap wall can be analyzed by looking at the vertical displacement contour in the embankment.
PFC2D can easily obtain the vertical displacement of particles at any time, something which cannot be done in the experiment. The displacement information of the particles when the trap wall had just started to move (Δs = 0.08 mm), when the first moving stage was over (Δs = 0.2 mm), and when the equal settlement no longer moved up (Δs = 10 mm) was imported into the Surfer software and the kriging interpolation method was employed to draw the vertical displacement contour map, as shown in Figure 17.
Figure 17a–e shows that when the trap wall just starts to move, the displacement waves in the five DEM simulation conditions are all transmitted upward from the trap wall. Due to the limitation of the soil on the pile, the displacement wave on the trap wall closer to the soil on the pile transmits more slowly, and the displacement wave at the center of the movable door transmits the fastest. The more the displacement wave moves upwards, the weaker the restriction effect of the soil on the pile to the pile-soil, and the weaker the restriction effect of the pile to the soil on the pile. The soil on the piles is easily affected by the pile-soil. When there is the same mutual influence in the soil between the piles, a horizontal displacement wave is formed, as depicted in Figure 17a.
Figure 17a–c indicates that the greater the increase in the width of the pile cap (a), the stronger the restriction of the pile to the soil on the pile, meaning the soil on the pile is less likely to move down under the influence of the pile-soil, and the harder it is to generate horizontal displacement waves. There is no horizontal displacement wave in the T1 and T2 cases, as shown in Figure 17b,c.
From Figure 17c–e, it can be concluded that unlike the T1 case, the displacement waves in the T4 and T5 cases with a smaller height of the embankment (H) are on the trap wall during the process of transmitting from the trap wall to the surface of the embankment, within the red dotted line. This is due to the height of the embankment in T4 and T5 being too low, and the restriction effect of the pile to the soil on the pile is strong, resulting in a significant differential settlement during the upward transmission of the displacement wave, and the horizontal displacement wave cannot be formed.
Figure 17f–o shows that with the increase in Δs, the differential settlement of pile-soil becomes more noticeable. Unlike the T3 case, the pile restricts the displacement of the soil on the pile strongly due to the wider pile cap in the T1 and T2 cases, and the soil on the pile is not easily affected by the pile soil. When Δs = 0.2 mm, the displacement waves in the T1 and T2 cases propagate upward in the form of a tower until the surface of the embankment does not spread to the soil on the pile. In Δs = 10 mm, the dense section of the contour moves up, forming the tower-shaped evolution pattern. Unlike T1, the displacement wave in T5 almost always travels upward in a triangle from Δs = 0.08 mm to Δs = 10 mm, forming a triangular displacement mode due to the low embankment height. A significant differential settlement is observed in the embankment surface when Δs = 10 mm. The soil on the pile is easily affected by the pile-soil and moves down in Δs = 0.2 mm and Δs = 10 mm in the T3 case due to the small width of the pile cap. The displacement waves in Figure 17f,k are destroyed after being uploaded to a certain height, and the pile-soil and the soil on the pile settle together.

4.3. Shear Plane

As the trap wall moves down, the differential settlement of pile-soil becomes more recognizable, and the shear plane will be formed in the embankment. The shear plane will trigger the rotation of the particles due to the relative movement of the particles. Hence, the development of the shear plane in the embankment can be obtained through the diagram of particle rotations.
PFC2D can detect the value of particle rotation in the embankment during the downward movement of the trap wall by turning on the particle rotation detection switch. The absolute value of the particle rotation of each DEM simulation condition was exported at Δs = 10 mm, and a bubble chart was plotted by Python’s plotnine drawing package. The larger and darker bubbles represent the larger absolute value of the particle rotation, as shown in Figure 18.
Figure 18 illustrates that the shear planes in T4 and T5 extend from the junction of the trap wall and the pile to the surface of the embankment approximately perpendicularly. This is due to the displacement waves in T4 and T5 never diffusing the soil on both sides of the pile during the process of uploading to the surface of the embankment, which leads to huge differential settlements at the junction of the pile-soil and the soil on the piles, which triggers the formation of vertical shear planes. Although T1 has a shear plane on the surface of the direct channel embankment, the shear zone is relatively wide since the embankment height is higher than that of T4 and T5.
Figure 18 illustrates that as the pile cap width (a) reduces, the height of the shear plane in the embankment decreases. This is because differential settlement of the pile-soil decreases and restricts the formation of the vertical shear plane. In the equal settlement pattern of T3, the particle rotation mainly occurs below the equal settlement, similar to the findings reported by Chen et al. [35]. This is the case because the displacement wave is destroyed when it is transmitted to the equal settlement, and the differential settlement of the pile-soil above the equal settlement is small, and the shear plane cannot be formed.
Therefore, the reduction of the height of the embankment (H) and the increase of the width of the pile cap (a) will make it easier to form a vertical shear plane in the embankment, and will shift the shear plane, a situation that will not favor the formation of the equal settlement pattern.

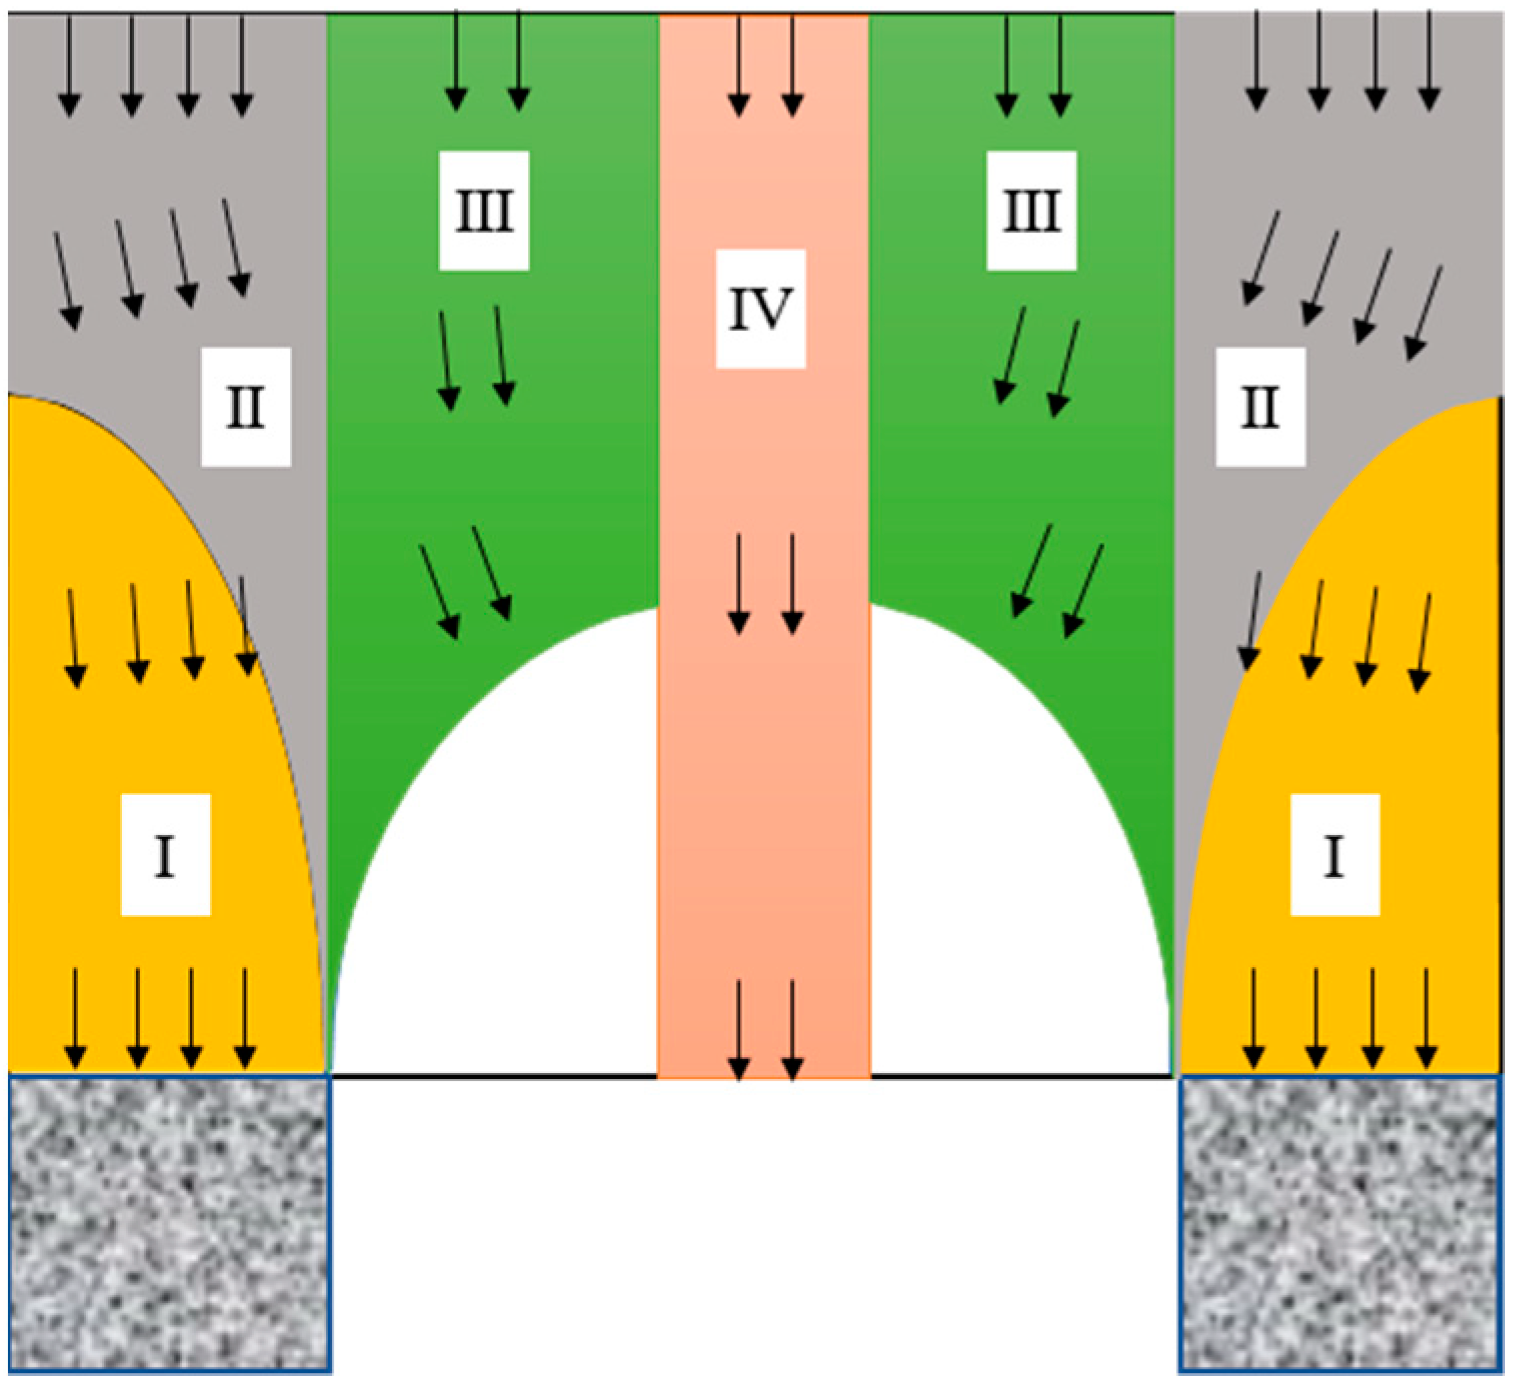
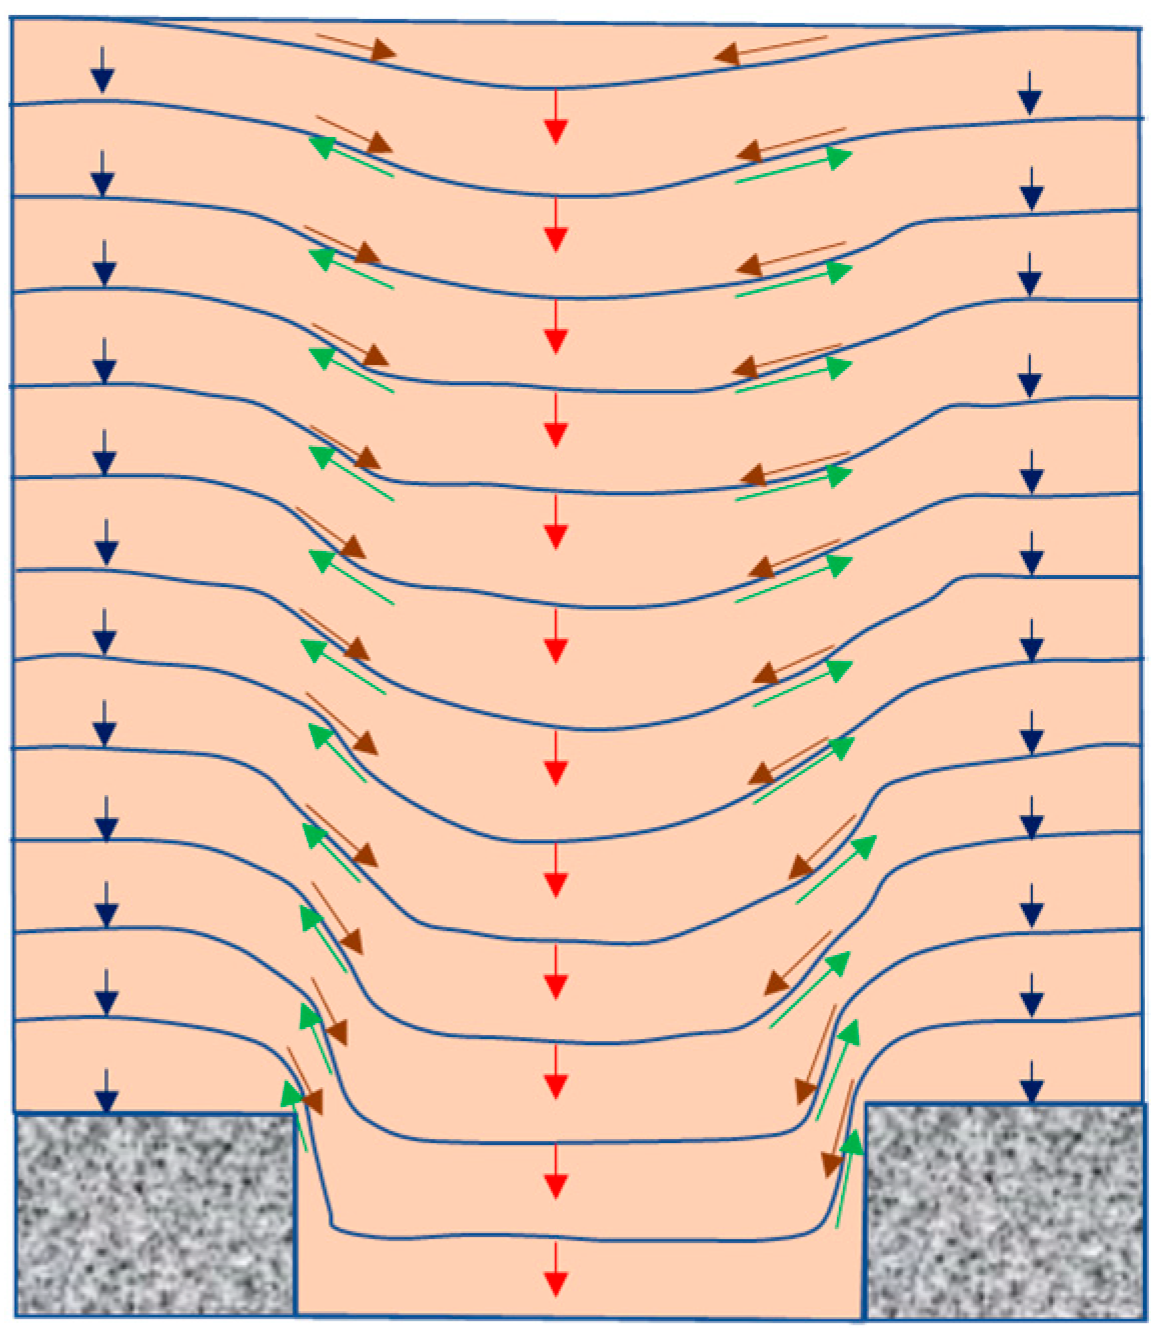
4.4. Formation Mechanism of the Equal Settlement Pattern

The height of the embankment (H) and the width of the pile cap (a) have a great influence on the differential settlement of pile soil in the embankment. The decrease in the height of the embankment (H) and the increase in the width of the pile cap (a) will make the differential settlement of the pile-soil more noticeable, as shown in Figure 17, which is not conducive to the formation of the equal settlement pattern. This effect is mainly caused by the restriction that piles impose on soil displacement. Figure 19 is a schematic diagram of the movement of the soil in the embankment during the downward movement of the trap wall.
Zone I represents the restriction effect of the pile on the soil above it. The lowermost soil is subject to the strongest restriction, and the higher the soil is positioned, the weaker the restriction and easier it is for the soil to be pulled down by the downward movement of the pile-soil. Zone II represents the soil above and far away from the pile, which is weakly restricted by the pile and is easily affected by the downward movement of the pile-soil. Zone III means that the part of the soil on the movable gate close to the soil on the pile is affected and slowed down due to the restriction of the soil on the pile, and the affected area becomes larger as the height of the embankment increases. Zone IV indicates the downward movement of the soil at the center of the trap wall. The soil at the center is weakly restricted by the soil on the pile and sinks fastest, so the movement direction of the soil on both sides of the center is inclined to the center of the trap wall due to the symmetry.
With an increase in the width of the pile cap, the expansion of zone I will intensify the restriction of the soil at higher levels, and the soil on the piles is less likely to be affected by the downward movement of the pile-soil. In this way, the displacement wave is not easy to spread to the soil on the piles during the uploading process. As depicted in Figure 17g–i,m, the differential settlement of pile-soil is observed in such conditions, and it is easier for a vertical shear plane to be formed near the movable door, which in turn results in the upward movement of the slip, and formation of the tower-shaped evolution and triangular expanding patterns.
Figure 20 is a schematic diagram of soil movement in the DEM of Test 1 (Δs = 30 mm). The black arrow indicates that the soil on the pile moves down under the action of gravity, and the red arrow implies that the soil at the center is sinking under the action of gravity due to the downward movement of the trap wall. The green arrow signifies that the downward movement of the pile-soil is restrained by the soil on the pile, which hinders the settlement of the soil between the piles, and uses friction to transfer a part of gravity of the pile-soil to the soil on the piles, and then from load transfer. The brown arrow indicates that the soil on the pile begins to sink and produces lateral displacement due to the settlement of the pile-soil. The degree of this influence increases with the elevation of height. After reaching a certain height, the settlement amount of the pile-soil and the soil on the piles is the same. At this time, this plane is referred to as the equal settlement.
When the height of the embankment (H) decreases and the surface of the embankment is close to zone I, the differential settlement becomes more visible as the trap wall moves downwards, and a shear plane forms extending from the junction of the trap wall and the pile to the surface of the embankment approximately vertically. Figure 18 displays the uneven settlement quickly spreading to the embankment surface. Therefore, by reducing the width of the pile cap (a) which corresponds to a reduction in the height of zone I and increasing the height of the embankment (H) to drive the surface of the embankment farther away from zone I, the displacement wave will be destroyed upon reaching a certain height. The shear plane stops moving in the upward direction, as shown in Figure 18 for the T3 case, resulting in the formation of the equal settlement pattern.

5. Conclusions

In this study, PFC discrete element software was used to investigate the soil arching effect of the equal settlement pattern from the perspective of vertical displacement and vertical stress. Additionally, the influence of soil arching on the formation of the equal settlement pattern was studied by changing the height of the embankment (H) and the width of the pile cap (a). A new method for preparing the specimens in the DEM was proposed by combining the improved multilayer compaction method (IMCM) and multilayer with under-compaction method (UCM), which yields a similar and reasonable initial stress state. Moreover, the development of the shear plane was monitored through the lens of the vertical displacement contour and the particle rotation. Based on the analysis and discussion of the numerical results, the following conclusions can be drawn:
(1) In the equal settlement pattern, as the trap wall moves down, the soil arching in the embankment forms gradually, and the height of the equal settlement increases slowly. Finally, a stable semi-elliptical soil arching is formed in the embankment. At this time, the vertical stress curve along the height in the middle of the embankment is Z-shaped. This is consistent with the semicircular soil arching hypothesis of the H&R method. As the trap wall moves down, the height of the equal settlement hardly moves up and stabilizes at 0.7(s-a).
(2) When the width of the trapdoor is constant, the height of the embankment (H) and the width of the pile cap (a) have a great influence on the formation of the equal settlement pattern. Both the decrease of H and the increase of a will make the differential settlement of the soil between the piles and the pile-soil more obvious, resulting in the gradual upward development of the slip surface, thereby hindering the formation of the equal settlement pattern.
This paper mainly focused on the numerical simulation of soil arching in equal settlement patterns based on the trapdoor model test. The mechanical behavior of soil arching and its influencing factors have been analyzed. The general behavior of arching in other different patterns, i.e., the tower-shaped evolution pattern and the equal settlement pattern, should be further investigated. In addition, both the experimental study and the numerical analysis were under 2D plane strain conditions, for which the findings are relevant to the case of piled embankments with piles arranged in beam patterns; nevertheless, investigation of soil arching under a 3D condition is recommended to better understand soil arching when piles are arranged in square or triangular patterns.

Author Contributions

Conceptualization, methodology, and writing—original draft preparation, K.W.; software and validation, J.C.; supervision and writing—review and editing, X.W.; and data curation, Y.N. All authors have read and agreed to the published version of the manuscript.

Funding

The financial support of Natural Science Foundation of China (52109139), and Zhejiang Provincial Natural Science Foundation of China (LQ20E080022) is acknowledged.

Institutional Review Board Statement

Not applicable.

Informed Consent Statement

Not applicable.

Data Availability Statement

Not applicable.

Conflicts of Interest

The authors declare no conflict of interest.

References

  1. Briançon, L.; Simon, B. Performance of pile-supported embankment over soft soil: Full-scale experiment. J. Geotech. Geoenviron. Eng. 2012, 138, 551–561. [Google Scholar] [CrossRef]
  2. Liu, H.L.; Kong, G.Q.; Chu, J.; Ding, X.M. Grouted gravel column supported highway embankment over soft clay: Case study. Can. Geotech. J. 2015, 52, 1725–1733. [Google Scholar] [CrossRef]
  3. Cao, W.Z.; Zheng, J.J.; Zhang, J.; Zhang, R.J. Field test of a geogrid-reinforced and floating pile-supported embankment. Geosynth. Inter. 2016, 23, 348–361. [Google Scholar] [CrossRef]
  4. Pan, Y.T.; Liu, Y.; Xiao, H.W.; Lee, F.H.; Phoon, K.K. Effect of spatial variability on short- and long-term behaviour of axially-loaded cement-admixed marine clay column. Comput. Geotech. 2018, 94, 150–168. [Google Scholar] [CrossRef]
  5. Al-Naddaf, M.; Han, J.; Xu, C.; Jawad, S.; Abdulrasool, G. Experimental investigation of soil arching mobilization and degradation under localized surface loading. J. Geotech. Geoenviron. Eng. 2019, 145, 04019114. [Google Scholar] [CrossRef]
  6. Chalak, C.; Briancon, L.; Villard, P. Coupled numerical and experimental analyses of load transfer mechanismsin granular-reinforced platform overlying cavities. Geotext. Geomembr. 2019, 19, 587–597. [Google Scholar] [CrossRef]
  7. da Silva Burke, T.S.; Elshafie, M.Z.E.B. Geosynthetic-reinforced soils above voids: Observation of soil and geosynthetic deformation mechanisms. Geotext. Geomembr. 2021, 49, 1–18. [Google Scholar] [CrossRef]
  8. Ghosh, B.; Fatahi, B.; Khabbaz, H.; Nguyen, H.H.; Kelly, R. Field study and numerical modelling for a road embankment built on soft soil improved with concrete injected columns and geosynthetics reinforced platform. Geotext. Geomembr. 2021, 49, 804–824. [Google Scholar] [CrossRef]
  9. Lee, T.; Lee, S.H.; Lee, I.W.; Jung, Y.H. Lessons from Full-Scale Experiments on Piled Embankments with Different Geosynthetic Reinforcements. KSCE J. Civ. Eng. 2021, 25, 442–450. [Google Scholar] [CrossRef]
  10. Terzaghi, K. Theoretical Soil Mechanics; Wiley: New York, NY, USA, 1943. [Google Scholar]
  11. Hewlett, W.J.; Randolph, M.F. Analysis of piled embankment. Ground Eng. 1988, 21, 12–18. [Google Scholar]
  12. Zhuang, Y.; Wang, K.Y. Finite-element analysis of arching in highway piled embankments subjected to moving vehicle loads. Geotechnique 2018, 68, 857–868. [Google Scholar] [CrossRef]
  13. Tran, Q.A.; Villard, P.; Dias, D. Discrete and continuum numerical modeling of soil arching between piles. Int. J. Geomech. 2019, 19, 04018195. [Google Scholar] [CrossRef] [Green Version]
  14. Alonso, J.; Moya, M.; Asensio, L.; de la Morena, G.; Galve, J.P.; Navarro, V. A catenary model for the analysis of arching effect in soils and its application to predicting sinkhole collapse. Géotechnique 2020, 1–46. [Google Scholar] [CrossRef]
  15. Lai, H.J.; Zheng, J.J.; Cui, M.J.; Chu, J. “Soil arching” for piled embankments: Insights from stress redistribution behaviour of DEM modelling. Acta Geotech. 2020, 15, 2117–2136. [Google Scholar] [CrossRef]
  16. Rui, R.; Han, J.; Zhang, L.; Zhai, Y.; Cheng, Z.; Chen, C. Simplified method for estimating vertical stress-settlement responses of piled embankments on soft soils. Comput. Geotech. 2020, 119, 103365. [Google Scholar] [CrossRef]
  17. Pham, T.A.; Dias, D. Comparison and evaluation of analytical models for the design of geosyntheticreinforced and pile-supported embankments. Geotext. Geomembr. 2021, 49, 528–549. [Google Scholar] [CrossRef]
  18. Kempfert, H.G.; Stadel, M.; Zaeske, D. Berechnung von geokunstst off between trags chichten über pfahlelementen. Bautechnik 1997, 74, 818–825. (In German) [Google Scholar]
  19. Zaeske, D.; Kempfert, H.G. Calculation and Behaviour of Unreinforced and Reinforced Bearing Layers over Point- or Line-Shaped Bearing Elements. Bauingenieur 2002, 77, 80–86. (In German) [Google Scholar]
  20. van Eekelen, S.J.M.; Bezuijen, A.; van Tol, A.F. An analytical model for arching in piledembankments. Geotext. Geomembr. 2013, 39, 78–102. [Google Scholar] [CrossRef]
  21. van Eekelen, S.J.M.; Bezuijen, A.; van Tol, A.F. Validation ofanalytical models for the design of basal reinforced piled embankments. Geotext. Geomembr. 2015, 43, 56–81. [Google Scholar] [CrossRef] [Green Version]
  22. Iglesia, G.R.; EinsteinI, H.H.; Whitman, R.V. Investigation of soil arching with centrifuge tests. J. Geotech. Geoenviron. Eng. 2014, 140, 04013005. [Google Scholar] [CrossRef]
  23. Rui, R.; van Tol, A.F.; Xia, X.L.; van Eekelen, S.J.M.; Hu, G.; Xia, Y.Y. Evolution of soil arching; 2D DEM simulations. Comput. Geotech. 2016, 73, 199–209. [Google Scholar] [CrossRef]
  24. Rui, R.; van Tol, A.F.; Xia, Y.Y.; van Eekelen, S.J.M.; Hu, G. Investigation of soil-arching development in dense sand by 2D model tests. Geotech. Test. J. 2016, 39, 415–430. [Google Scholar] [CrossRef] [Green Version]
  25. Chevalier, B.; Combe, G.; Villard, P. Experimental and discrete element modeling studies of the trapdoor problem: Influence of the macro-mechanical frictional parameters. Acta Geotech. 2012, 7, 15–39. [Google Scholar] [CrossRef]
  26. Eskisar, T.; Otani, J.; Hironaka, J. Visualization of soil arching on reinforced embankment with rigid pile foundation using X-ray CT. Geotext. Geomembr. 2012, 32, 44–54. [Google Scholar] [CrossRef]
  27. Xu, C.J.; Liang, L.J.; Chen, Q.Z.; Chen, Y.F. Experimental study of soil arching effect under seepage condition. Acta Geotech. 2019, 14, 2031–2044. [Google Scholar] [CrossRef]
  28. Jenck, O.; Dias, D.; Kastner, R. Soft ground improvement by vertical rigid piles twodimensional physical modelling and comparison with current design methods. Soils Found. 2005, 45, 15–30. [Google Scholar] [CrossRef] [Green Version]
  29. Chen, Y.M.; Cao, W.P.; Chen, R.P. An experimental investigation of soil arching within basal reinforced and unreinforced piled embankments. Geotext. Geomembr. 2008, 26, 164–174. [Google Scholar]
  30. Lai, H.J.; Zheng, J.J.; Zhang, R.J.; Cui, M.J. Visualization of the formation and features of soil arching within a piled embankment by discrete element method simulation. J. Zhejiang Univ.-Sci. A 2016, 17, 803–817. [Google Scholar] [CrossRef] [Green Version]
  31. BSI (British Standards Institution). Code of Practice for Strengthened/Reinforced Soils and Other Fills; BSI: London, UK, 2010; BSI: BS8006-1. [Google Scholar]
  32. Zhuang, Y.; Ellis, E.; Yu, H.S. Three-dimensional finite-element analysis of arching in a piled embankment. Géotechnique 2012, 62, 1127–1131. [Google Scholar] [CrossRef]
  33. Jenck, O.; Dias, D.; Kastner, R. Discrete element modelling of a granular platform supported by piles in soft soil-validation on a small scale model test and comparison to a numerical analysis in a continuum. Comput. Geotech. 2009, 36, 917–927. [Google Scholar] [CrossRef]
  34. Han, J.; Bhandari, A.; Wang, F. DEM analysis of stresses and deformations of geogrid-reinforced embankments over piles. Int. J. Geomech. 2012, 12, 340–350. [Google Scholar] [CrossRef]
  35. Chen, R.P.; Liu, Q.W.; Wu, H.N.; Wang, H.L.; Meng, F.Y. Effect of particle shape on the development of 2D soil arching. Comput. Geotech. 2020, 125, 103662. [Google Scholar] [CrossRef]
  36. He, G.F.; Li, Z.G.; Yuan, Y.; Li, X.H.; Hu, L.H.; Zhang, Y. Optimization analysis of the factors affecting the soil arching effect between landslide stabilizing piles. Nat. Resour. Model. 2018, 31, e12148. [Google Scholar] [CrossRef]
  37. Itasca. Particle Flow Code in Two Dimensions, Version 5.0; Itasca Consulting Group Inc.: Tokyo, Japan, 2016. [Google Scholar]
  38. Cundall, P.A.; Strack, O.D.L. A discrete numerical model for granular assemblies. Geotechnique 1979, 29, 47–65. [Google Scholar] [CrossRef]
  39. Badakhshan, E.; Noorzad, A.; Bouazza, A.; Zameni, S.; King, L. A 3D-DEM investigation of the mechanism of arching within geosynthetic-reinforced piled embankment. Int. J. Solids Struct. 2020, 187, 58–74. [Google Scholar] [CrossRef]
  40. Jiang, M.J.; Konrad, J.M.; Leroueil, S. An efficient technique for generating homogeneous specimens for DEM studies. Comput. Geotech. 2003, 30, 579–597. [Google Scholar] [CrossRef]
  41. Han, J.; Gabr, M.A. Numerical analysis of geosynthetic-reinforced and pile-supported earth platforms over soft soil. J. Geotech. Geoenviron. Eng. 2002, 128, 44–53. [Google Scholar] [CrossRef]
Figure 1. Cross-section view, plan view, and photo of the test setup.
Symmetry 13 01627 g001
Figure 2. Micromechanical model and rheology of the particle contact.
Symmetry 13 01627 g002
Figure 3. DEM of trapdoor test: (a) geometrical model; (b) two-ball clump; and (c) structural diagram of two-ball clumps.
Symmetry 13 01627 g003
Figure 4. At rest stress distributions of the sample.
Symmetry 13 01627 g004
Figure 5. Comparison between the slip surfaces obtained from the laboratory tests and DEM models (Δs = 30 mm).
Symmetry 13 01627 g005
Figure 6. Comparison between the pile–subsoil stress ratio n obtained from the laboratory tests and DEM models.
Symmetry 13 01627 g006
Figure 7. Deflection of principal stress and contact force chains for Test 11: (a) Δs = 0.6 mm; (b) Δs = 1 mm; (c) Δs = 2 mm; (d) Δs = 10 mm; (e) Δs = 20 mm; and (f) Δs = 30 mm.
Symmetry 13 01627 g007
Figure 8. Evolution of vertical stress at the center of the trap wall with the increase in Δs.
Symmetry 13 01627 g008
Figure 9. Evolution of vertical stress at the center of the half-pile with the increase in Δs.
Symmetry 13 01627 g009
Figure 10. Layering and zoning of the numerical models adopted to gauge the vertical displacements.
Symmetry 13 01627 g010
Figure 11. Vertical displacement of each layer (Δs = 10 mm).
Symmetry 13 01627 g011
Figure 12. Vertical displacement range for each layer with the increase in Δs (Test 11).
Symmetry 13 01627 g012
Figure 13. Moving of equal settlement with the increase in Δs.
Symmetry 13 01627 g013
Figure 14. Vertical displacement range for each layer with the increase in Δs: (a) T1; (b) T2; (c) T3; (d) T4; and (e) T5.
Symmetry 13 01627 g014
Figure 15. Moving of equal settlement under differential conditions.
Symmetry 13 01627 g015
Figure 16. Vertical displacement range for each layer under differential conditions (Δs = 10 mm).
Symmetry 13 01627 g016
Figure 17. Vertical displacement contour: (ae) Δs = 0.08 mm; (fj) Δs = 0.2 mm; and (ko) Δs = 10 mm.
Symmetry 13 01627 g017
Figure 18. The particle rotations for different DEM simulation conditions (Δs = 10 mm).
Symmetry 13 01627 g018
Figure 19. Particle movement in the embankment.
Symmetry 13 01627 g019
Figure 20. Particle movement in the embankment (DEM of Test 1).
Symmetry 13 01627 g020
Table 1. The reference cases covered in this study.
TestHeight
H (mm)
Trapdoor Width
(s-a) (mm)
Pile Width
a (mm)
Diameter of Sand
d (mm)
Test 115075750.25–0.425
Test 83003002250.425–1.0
Test 11450225750.425–1.0
Table 2. Material parameters used in DEM analysis.
ParametersValues
Pebble–pebble
Normal stiffness of clump kn5.0 × 106 N/m
Shear stiffness of clump ks5.0 × 106 N/m
Friction coefficient of clump μ0.6
Density of clump ρ2000 kg/m3
Local damping ratio0.7
Pebble–facet
Normal stiffness of wall kn8.0 × 107 N/m
Shear stiffness of wall ks8.0 × 107 N/m
Friction coefficient of wall μ0
Porosity of assembly0.16
Table 3. DEM simulation conditions assumed for the parametric analysis.
CaseHeight
H (mm)
Trapdoor
Width
(s-a) (mm)
Pile Width
a (mm)
H/(s-a)(s-a)/aDiameter of Sand
d (mm)
Expected Displacement Pattern
T150025045020.560.25–0.425TSE
T2500250250210.25–0.425TSE
T35002507523.30.25–0.425ES
T43752504501.50.560.25–0.425TSE
T525025045010.560.25–0.425TE
Note: TE = Triangular expanding pattern, TSE = Tower-shaped evolution pattern, ES = Equal settlement pattern.
Publisher’s Note: MDPI stays neutral with regard to jurisdictional claims in published maps and institutional affiliations.

