Article

Voronoi Entropy vs. Continuous Measure of Symmetry of the Penrose Tiling: Part I. Analysis of the Voronoi Diagrams

1
Chemical Engineering Department, Engineering Faculty, Ariel University, P.O.B. 3, Ariel 407000, Israel
2
Department of Mechanical Engineering & Mechatronics, Faculty of Engineering, Ariel University, P.O.B. 3, Ariel 407000, Israel
3
Department of Industrial Engineering and Management, Faculty of Engineering, Ariel University, P.O.B. 3, Ariel 407000, Israel
*
Author to whom correspondence should be addressed.
Symmetry 2021, 13(9), 1659; https://doi.org/10.3390/sym13091659
Submission received: 29 July 2021 / Revised: 3 September 2021 / Accepted: 5 September 2021 / Published: 8 September 2021
(This article belongs to the Special Issue Symmetry, Topology and Phases of Condensed Matter)

Abstract

:
A continuous measure of symmetry and the Voronoi entropy of 2D patterns representing Voronoi diagrams emerging from the Penrose tiling were calculated. A given Penrose tiling gives rise to a diversity of the Voronoi diagrams when the centers, vertices, and the centers of the edges of the Penrose rhombs are taken as the seed points (or nuclei). Voronoi diagrams keep the initial symmetry group of the Penrose tiling. We demonstrate that the continuous symmetry measure and the Voronoi entropy of the studied sets of points, generated by the Penrose tiling, do not necessarily correlate. Voronoi diagrams emerging from the centers of the edges of the Penrose rhombs, considered nuclei, deny the hypothesis that the continuous measure of symmetry and the Voronoi entropy are always correlated. The Voronoi entropy of this kind of tiling built of asymmetric convex quadrangles equals zero, whereas the continuous measure of symmetry of this pattern is high. Voronoi diagrams generate new types of Penrose tiling, which are different from the classical Penrose tessellation.

1. Introduction

The notion of ordering is one of the most fundamental and, at the same time, controversial notions in physics. The Cambridge dictionary, for example, defines ordering as “the process of putting something in a particular order”. Thus, “ordering” is defined via “order”, which is at least problematic from the logical point of view. An ordered field in mathematics is defined as a field together with the total ordering of its elements, which is compatible with the field operations. The field of real numbers is a basic example of an ordered field, and every Dedekind-complete ordered field is isomorphic to the reals [1]. However, even in mathematics, the notion of ordering is ambiguous, and lays on the crossroad of mathematics and psychology [2]. In physics, the situation is much more complicated. an excellent review of the problem is found in Ref. [3], discussing the relation between ordering, complexity, and information. In our paper, we address ordering in 2D patterns. Consider a set of N points located in the same plane. How can the orderliness of this pattern be quantified? There exist various pathways of quantifying an order in 2D patterns, including calculation of the Voronoi entropy [4,5,6,7,8,9,10,11,12,13], and use of the Minkowski functionals [14,15] and correlation functions [16]. The Voronoi tessellation was already known to Rene Descartes in the 17th century [5]. Descartes proved that the distribution of matter in the Universe is characterized by vortices that are centered at fixed stars, using these tessellations [5,13]. The idea was developed by Georgy Voronoi in 1908 [4], and it was broadly implemented for quantifying the ordering inherent for 2D patterns [6,7,8,9,10,11,12].
We put forward the hypothesis that actual ordering in physical systems may be identified with symmetrizing of the system. That is, presenting elements of symmetry into an initially disordered physical system will necessarily order the system and consequently decrease its entropy [17,18]. It was demonstrated that imposing symmetry restrictions on an initially disordered system of elementary magnets diminishes its entropy [17,18]. The reasonable question is formulated as follows: how can symmetrizing of the system be quantified? Avnir, Zabrodsky and other co-workers [19,20,21,22,23] recently presented a continuous measure of a pattern (seen as a 2D set of points), which is a fundamentally new approach to quantifying symmetry. According to their measure, the symmetry can be quantified by the sum of minimum squared distances that are required to move the points of an original shape in order to obtain a symmetrical shape. The suggested measure is applicable in any dimensions and to various types of symmetry [19,20,21,22,23,24]. This continuous measure broke the binary “yes-no” paradigm traditionally used for the analysis of symmetry of patterns [19,20,21,22,23,24]. This approach was successfully exploited for quantification of the symmetry of nano-clusters [25], protein oligomers [26], transition metal oxide octahedral molecules [27], electronic wave functions [28], droplet clusters [29] and biological objects [30].
We propose to compare the quantifying of the ordering of 2D patterns attained with the Voronoi entropy with that estimated with the continuous measure of symmetry, introduced and developed in Refs. [19,20,21,22,23,24]. As an example, we take the P3-type Penrose tiling [31]. A Penrose tiling, depicted in Figure 1, is an aperiodic tiling that has a five-fold symmetry. Translational symmetry is absent in Penrose tiling; on the other hand, the Penrose tiling has reflection symmetry as well as five-fold rotational symmetry [31,32,33]. Penrose tiling is crucial for understanding the physical structure of quasicrystals [32,33,34]. We analyze ordering in Penrose tiling in parallel with the Voronoi entropy and the continuous measure of symmetry (as shown in Figure 2 and discussed in detail below).

2. Materials and Methods

The continuous measure of symmetry of the studied patterns was calculated, using MATLAB. The Voronoi diagrams were constructed by the special moduli developed at the Department of Physics and Astronomy at the University of California (Department of Physics and Astronomy University of California, Irvine, CA, USA) (https://www.physics.uci.edu/~foams/do_all.html (accessed on 1 June 2021)).

3. Results and Discussion

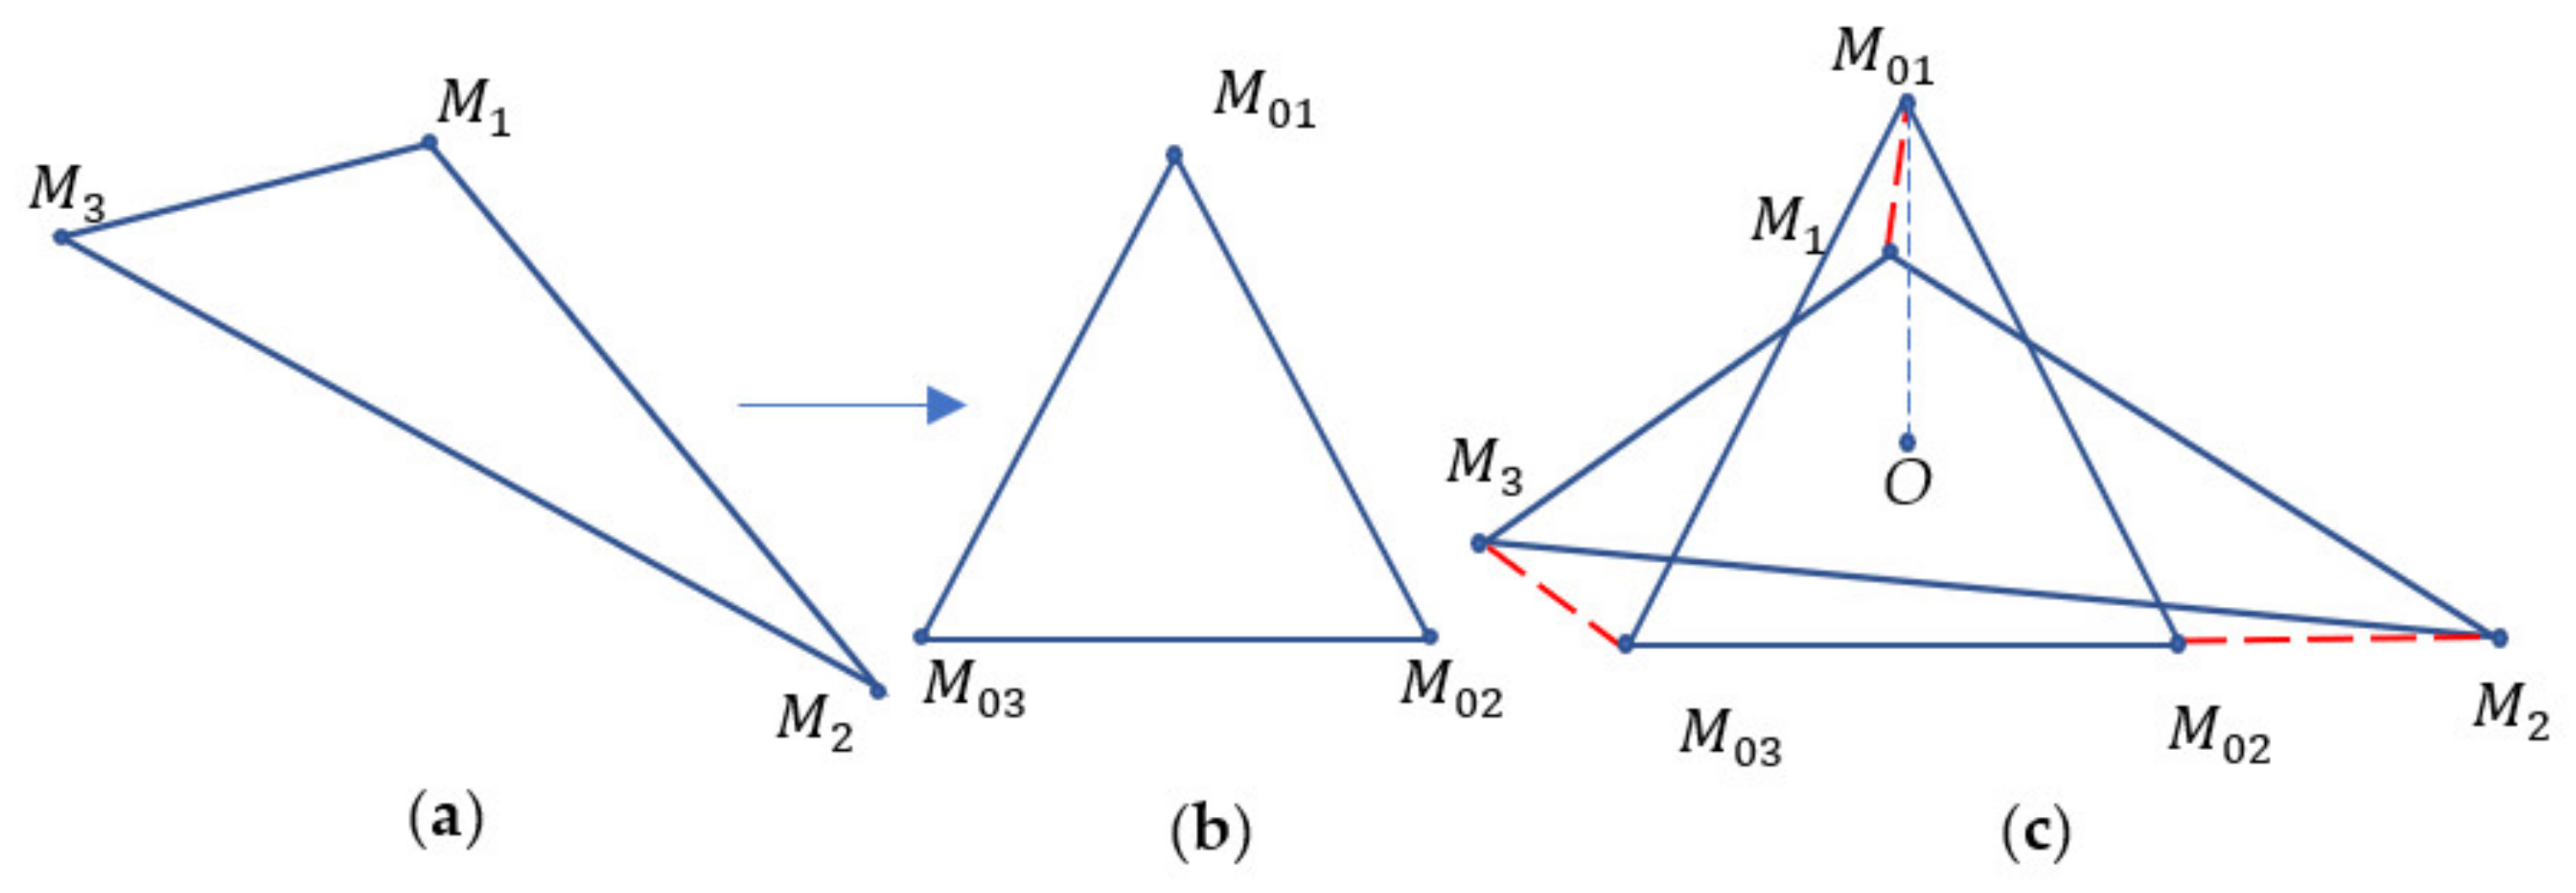
3.1. Voronoi Entropy and the Continuous Symmetry Measure of the Set of Points

Partitioning of an infinite plane into regions based on the distance to a specified discrete set of points (called seeds or nuclei and shown with red points in Figure 3) constructs the Voronoi tessellation. There is a corresponding region for each seed, consisting of all points closer to that seed point (also called generators) than to any other point [6,7,13]. The Voronoi diagram of the addressed Penrose tiling was composed of N polygons. The continuous symmetry measure (abbreviated below CSM) was calculated for each polygon, normalized and averaged, as discussed below. For any given set of points corresponding to the Voronoi tessellation or diagram, the Voronoi entropy quantifies the ordering of this set [6,7,13]. The Voronoi entropy (abbreviated VE) of a given set of points located in a plane is given by the following:
S v o r = i P i l n P i ,
where P i is the portion of the polygons possessing n edges in a given Voronoi diagram (also called the coordination number of the polygon) and i is the total number of polygon types with different number of edges [4,5,6,7,8,9,10,11,12,13]. The summation in Equation (1) is performed from i = 3 (the smallest possible polygon—a triangle) to the largest coordination number of the polygon, e.g., for a hexagon, the largest value of i is 6.
Now, let us acquaint the continuous symmetry measure, as it was introduced in Refs. [19,20,21,22,23,24]. Consider a non-symmetrical shape consisting of n k points M i , i = 1 , 2 n k and a given symmetry group G. The continuous symmetry measure abbreviated CSM and denoted S G is determined by the minimal average square displacement of the points M i that the shape has to undergo in order to acquire the prescribed G-symmetry. Assume that the G-symmetrical shape, emerges from the set of points M ^ i . Since the set M ^ i is established, a CSM is defined as follows:
S G = 1 n p i = 1 n p M i M ^ i 2
(the square values in Equation (2) provide a function that is isotropic, continuous, and differentiable). At the first step, the points of the nearest shape possessing the G-symmetry must be identified. An algorithm that identifies the set of points M ^ i that constitute this symmetrical shape was introduced in Refs. [19,20,21,22,23]. Figure 2 depicts equilateral triangle M 01 M 02 M 03 , representing the symmetric shape that corresponds to the given non-symmetric triangle M 1 M 2 M 3 .
Figure 2. Given non-symmetric triangle M 1 M 2 M 3 (a). The equilateral triangle M 01 M 02 M 03 represents the symmetrical shape (namely equilateral triangle) corresponding to the non-symmetric triangle M 1 M 2 M 3   b . Calculation of the CSM where point O is the common centroid is shown (c).
Symmetry 13 01659 g002
The transformation of the non-symmetric triangle M 1 M 2 M 3 to the symmetric equilateral triangle M 01 M 02 M 03 is performed as follows: vertex M i is rotated counterclockwise around the common centroid O of triangle M 1 M 2 M 3 by 2 π i 1 3 radians (one vertex of triangle M 1 M 2 M 3 remains fixed); thus, triangle M 1 M 2 M 3 emerges. Next, the location of the centroid O of the intermediate triangle M 1 M 2 M 3 is determined. Centroid O is then rotated clockwise around the centroid O by 2 π i 1 3 radians (for the details see ref. [29]).
Therefore, the equilateral triangle M 01 M 02 M 03 shown in Figure 2, represents the closest symmetrical shape to the pristine non-symmetrical triangle M 1 M 2 M 3 [19,20,21,22,23]. Since the set M ^ i is established, the CSM is calculated with Equation (2). Notice that the CSM of the Voronoi diagram of the Penrose tiling is calculated and not of the tiling itself. The point group of symmetry of the polygonal Voronoi cells coincides with the group of symmetry of the given Penrose tiling.
As suggested in Refs. [19,20,21,22,23,24], the CSM introduced by Equation (2) estimates the “minimal effort” required for transforming an original shape into the symmetric one. This concept of “minimal effort” is analogous to the Gauss principle of least constraint, which is equivalent to Hamilton’s principle in classical mechanics [35]. Minimization of CSM and the Gauss principle of least constraint represents the least squares principles [19,20,21,22,23,24,35]. Minimization of CSM using the aforementioned procedure still requires a rigorous mathematical proof. However, following the procedure introduced in Refs. [19,20,21,22,23] in our treatment of symmetry of “droplet clusters” yielded the quantitative treatment of the problem of ordering [29]. The same approach was also successfully employed for the quantification of symmetry of organic molecules [27,36,37,38].
The CSM of the non-symmetric triangle M 1 M 2 M 3 corresponds to the sum S G given by Equation (2) as illustrated in Figure 2. Obviously, the CSM in this case is given as follows:
C S M = 1 3 ( M 1 M 01 2 + M 2 M 02 2 + M 3 M 03 2 )
The algorithm that enables the calculation of CSM is provided in Refs. [19,20,21,22,23,24]. We applied this approach for the calculation of the CSM for the Penrose tilings, such as that depicted in Figure 1, with one essential difference: the CSM was normalized to the distance between the pristine and eventual centroids. This distance was denoted as r and shown as the line segment O M 01 in Figure 2 r = O M 01 actually equals the distance from the center of mass of an ideal polygon (triangle in our case) to one of its vertices. Considering the suggested normalization procedure, Equations (2) and (3) are re-shaped as follows:
C S M ˜ = 1 3 r 2 ( M 1 M 01 2 + M 2 M 02 2 + M 3 M 03 2 )
S ˜ G = 1 n p i = 1 n p M i M ^ i r 2 = 1 n p r 2 i = 1 n p M i M ^ i 2
where C S M ˜ and S ˜ G are the normalized, dimensionless continuous symmetry measures re-defined for the arbitrary triangle and polygon, respectively. It is convenient and reasonable to quantify the symmetry of the shape with the square root taken from Equation (5), namely, the following:
Λ G = 1 n p i = 1 n p M i M ^ i r 2 × 100 % = 1 r 1 n p i = 1 n p M i M ^ i 2 × 100 %

3.2. Voronoi Entropy and the Continuous Symmetry Measure of the Penrose Tiling

We calculated the CSM ( S ˜ G and Λ G ) and the VE S v o r   for the Voronoi diagrams emerging from Penrose tiling, depicted in Figure 1a. Consider that a given Penrose tiling gives rise to a number of the Voronoi diagrams, shown in Figure 3a–g (depicted in the left column of Figure 3).
Figure 3. The Voronoi tessellations (right) and Penrose tiling (left). (a) a-type Voronoi tessellation; (b) b-type; (c) c-type; (d) ab-type (a and b-types combined); (e) ac-type; (f) bc-type; (g) abc-type (a, b, and c-types combined). Color mapping: magenta polygons are triangles, green are tetragons, yellow are pentagons, grey are hexagons, blue are heptagons.
Symmetry 13 01659 g003aSymmetry 13 01659 g003b
We distinguish three main types of the Voronoi diagrams, generated by the Penrose tiling, namely, the following:
a-type Voronoi diagrams (abbreviated a-diagrams), where the centers of the Penrose rhombs are taken as the seeds, shown in Figure 3a;
b-type Voronoi diagrams (abbreviated b-diagrams), where the vertices of the rhombs constituting the Penrose tiling, are taken as the seeds, depicted in Figure 3b;
c-type Voronoi diagrams (abbreviated c-diagrams), where the centers of the edges of Penrose rhombs are taken as the seeds, shown in Figure 3c.
In addition, combinations of the a, b and c diagrams were addressed, denoted as a b , a c , b c and a b c , correspondingly. These Voronoi diagrams are shown in Figure 3d–g. For example, a b —diagram (depicted in Figure 3d) is the Voronoi diagram arising from the merging of the seed points appearing in a- and b-diagrams. Note that a-, b-, c-, ab-, ac-, bc- and abc-type Voronoi diagrams possess the same groups of symmetry, reflecting the groups of symmetry of the seed points. In particular, all of the diagrams are characterized by the five-fold rotational symmetry as well as the mirror plane symmetry, which can be recognized from Figure 3. Translational symmetry is absent at the Voronoi diagrams as well as in the original Penrose tiling.
The values of the continuous symmetry measure ( S ˜ G and Λ G ) and the Voronoi entropy S v o r were calculated with MATLAB software. The results of the calculations for seven investigated Penrose tiling are summarized in Table 1. The number of polygons n p o l constituting the studied patterns is supplied in Table 1. We established that the quantitative characteristics of patterns are only slightly dependent on the number of polygons n p o l ; for example, for the abc patterns S v o r n p o l = 221 = 0.5026 ;   Λ n p o l = 221 = 22.7 % and, correspondingly, S v o r n p o l = 631 = 0.498 ;   Λ n p o l = 631 = 22.9 % . Thus, we found it possible and valid to compare patterns built of various, despite the “large” number of polygons.
Distribution of polygons in the studied tessellations is shown in Figure 4. The CSM of Voronoi tessellations was calculated for each polygon separately with Equations (5) and (6), as discussed in Section 3.1, and averaged across the given diagram (the arithmetic mean was calculated). It is noteworthy that the problem of averaging is far from being trivial, and it should be addressed in the next parts of our investigation.
It seems from the comparison of the quantification of ordering inherent for the a-type and b-type diagrams, represented in Table 1, that VE and CSM necessarily correlate. Indeed, both VE and CSM of the sets of points comprising centers of rhombs (a-type) are much higher than those calculated for sets of points built of vertices of the Penrose rhombs (b-type). So, from the first glance, it seems that VE and CSM are correlated, and “symmetry” correlates with “ordering”, quantified in the terms of the Voronoi entropy.
This idea is strengthened by quantitative analysis of the a- and abc-diagrams. Both values of CSM and VE calculated from the a-type diagrams are relatively high. This means that a-type diagrams are less symmetrical and disordered when compared to other Voronoi diagrams emerging from the Penrose tiling. The abc diagrams, contrastingly, are characterized by the low values of CSM and VE; in other words, the abc diagrams are relatively simultaneously ordered and symmetrical. Moreover, for the tessellations ab, ac and bc, both the Voronoi entropy and continuous measure of symmetry are relatively high (see Table 1).
However, the closest inspection of the problem demonstrates a much more perplexed situation arising from the detailed analysis of the correlation of VE and CSM. The striking contra-example demonstrating the fallacy of the aforementioned suggestion is supplied by the paradoxical c-type Voronoi diagram, in which the centers of the edges of the Penrose rhombs are taken as the seeds (nuclei), as illustrated by Figure 3c. This tessellation is built from the convex quadrangles only. Thus, it is immediately recognized from Equation (1) that the Voronoi entropy of this tiling equals zero. On the other hand, the CSM of this tiling is relatively high, namely: S ˜ G = 0.1099 ;   Λ G = 33.15 % . This surprising finding is easily explained. Indeed, the c-type tiling comprises shapes, which are not symmetrical (more correctly speaking: some of the quadrangles have no elements of symmetry). Moreover, no one of the quadrangles appearing in Figure 3c is a rhomb, which is typical for the classical Penrose tiling. Thus, we conclude the following:
(i)
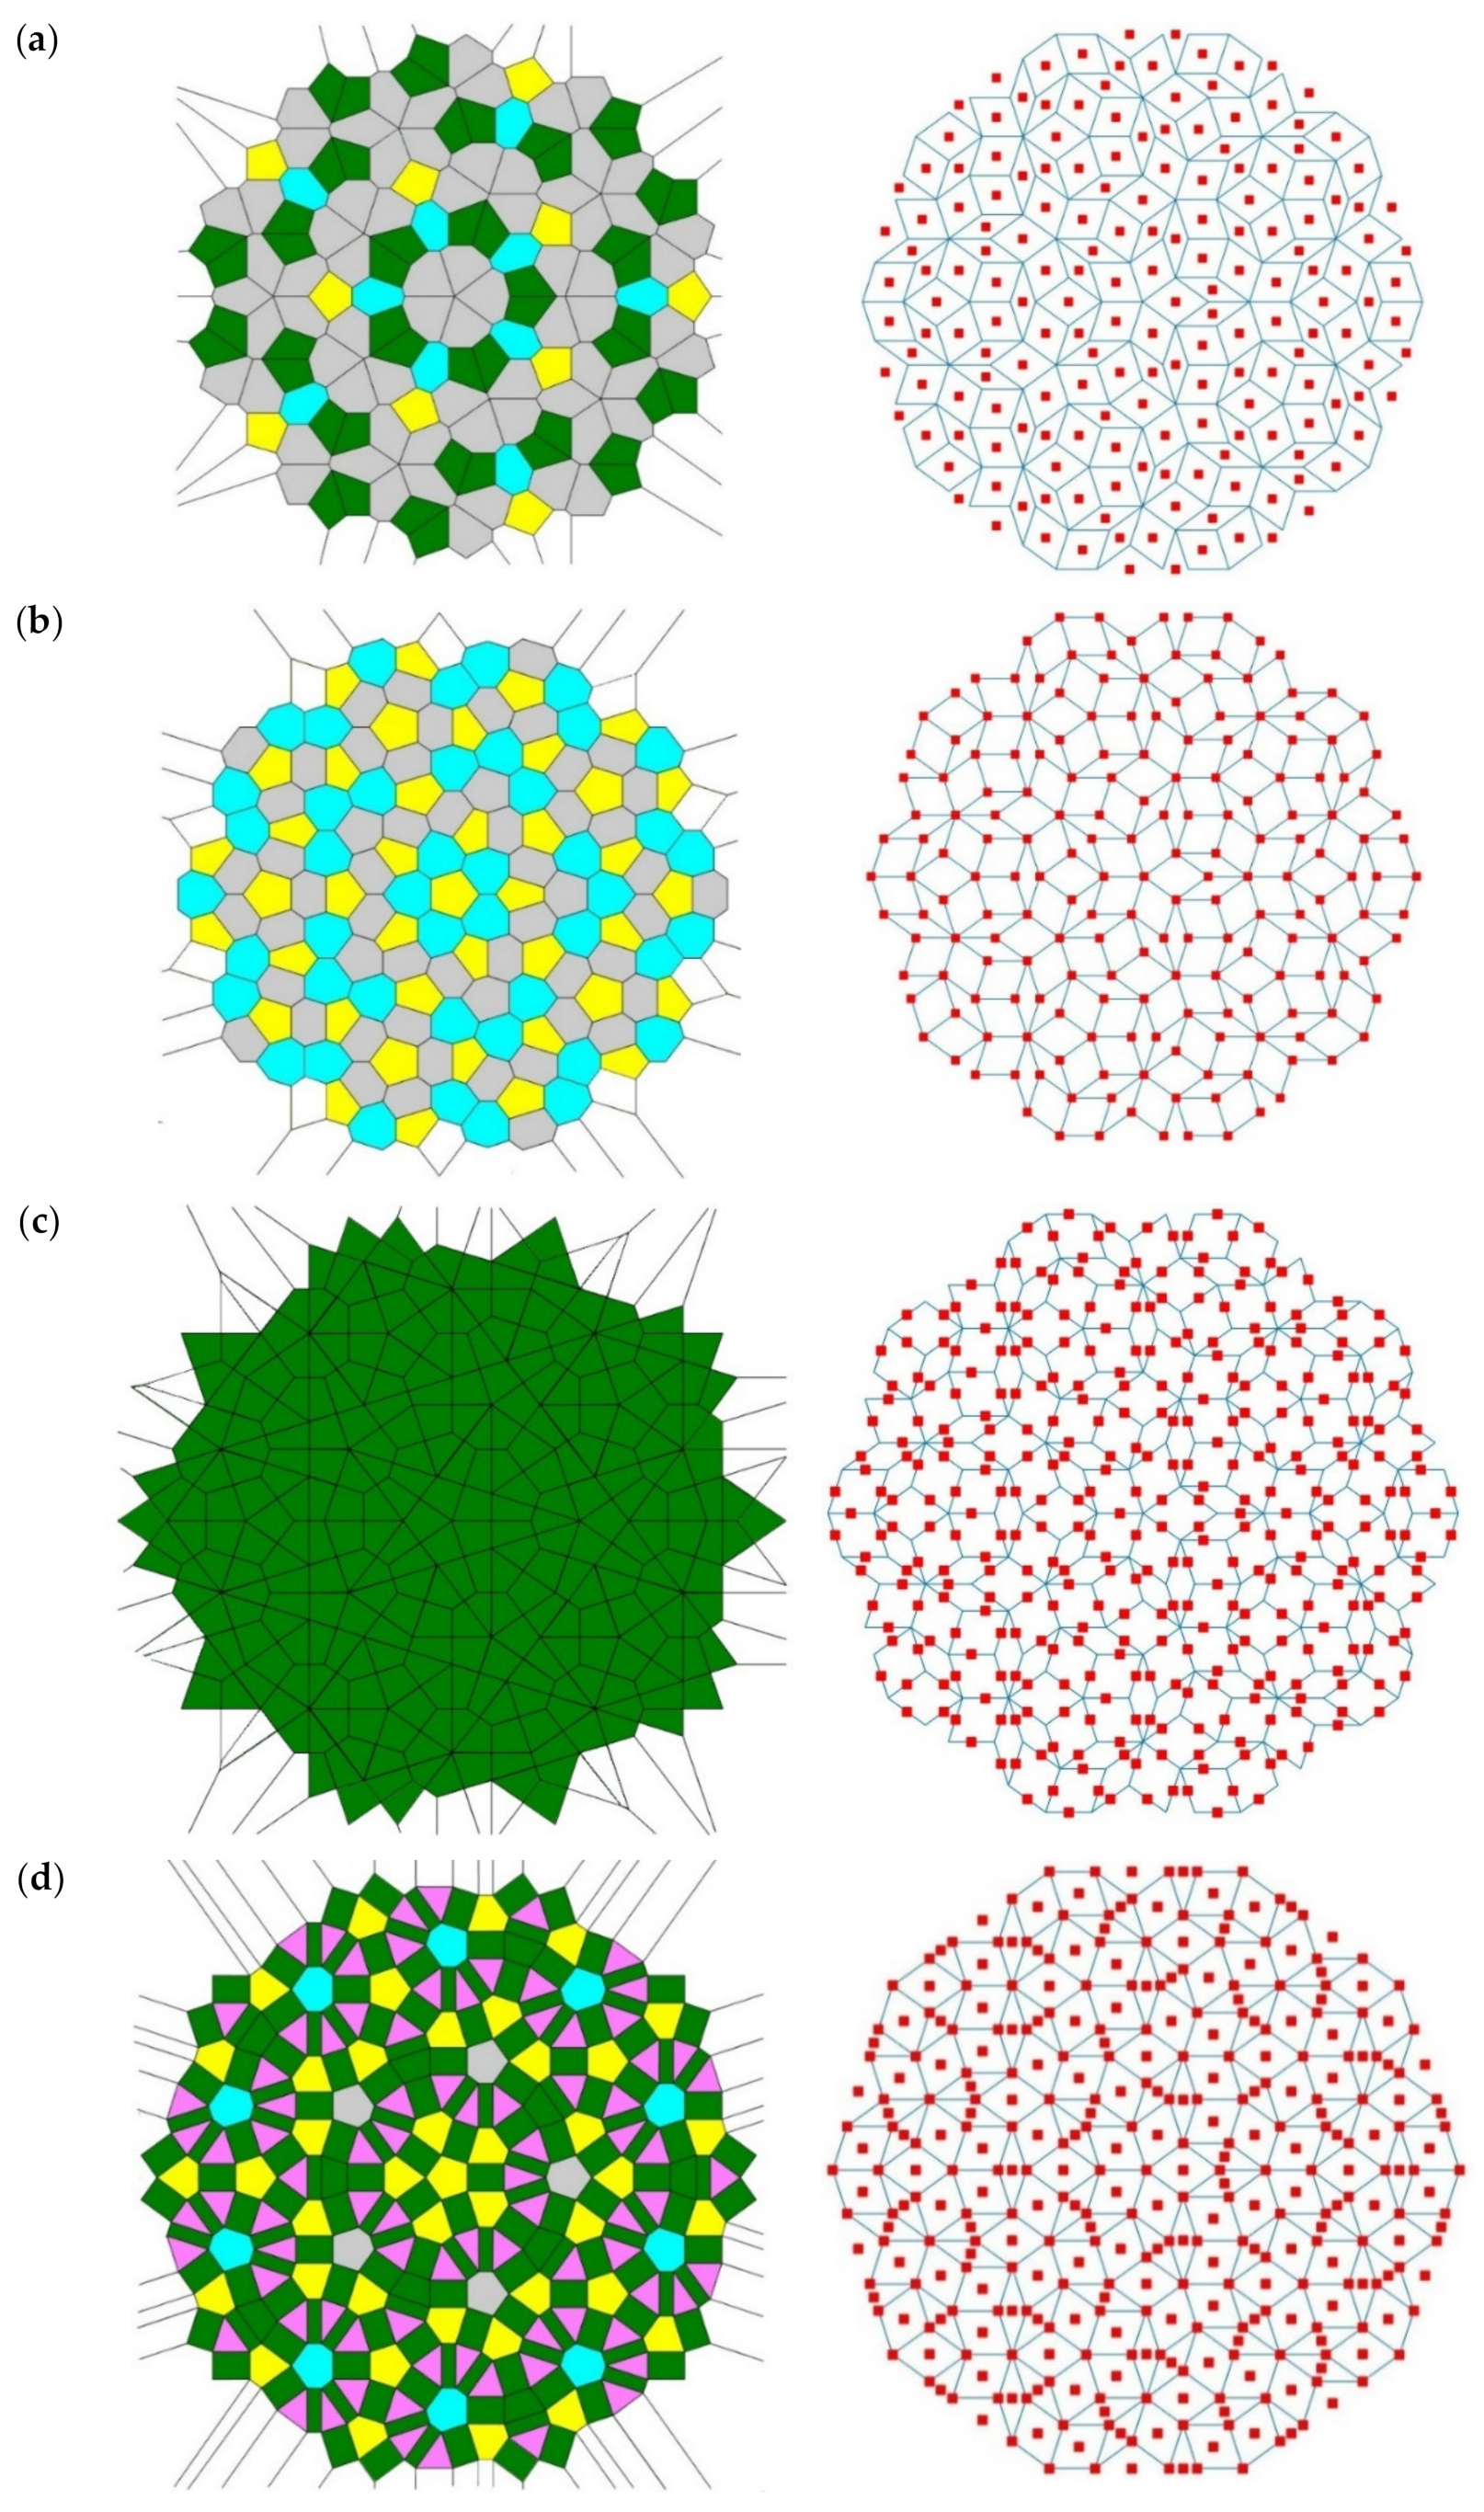
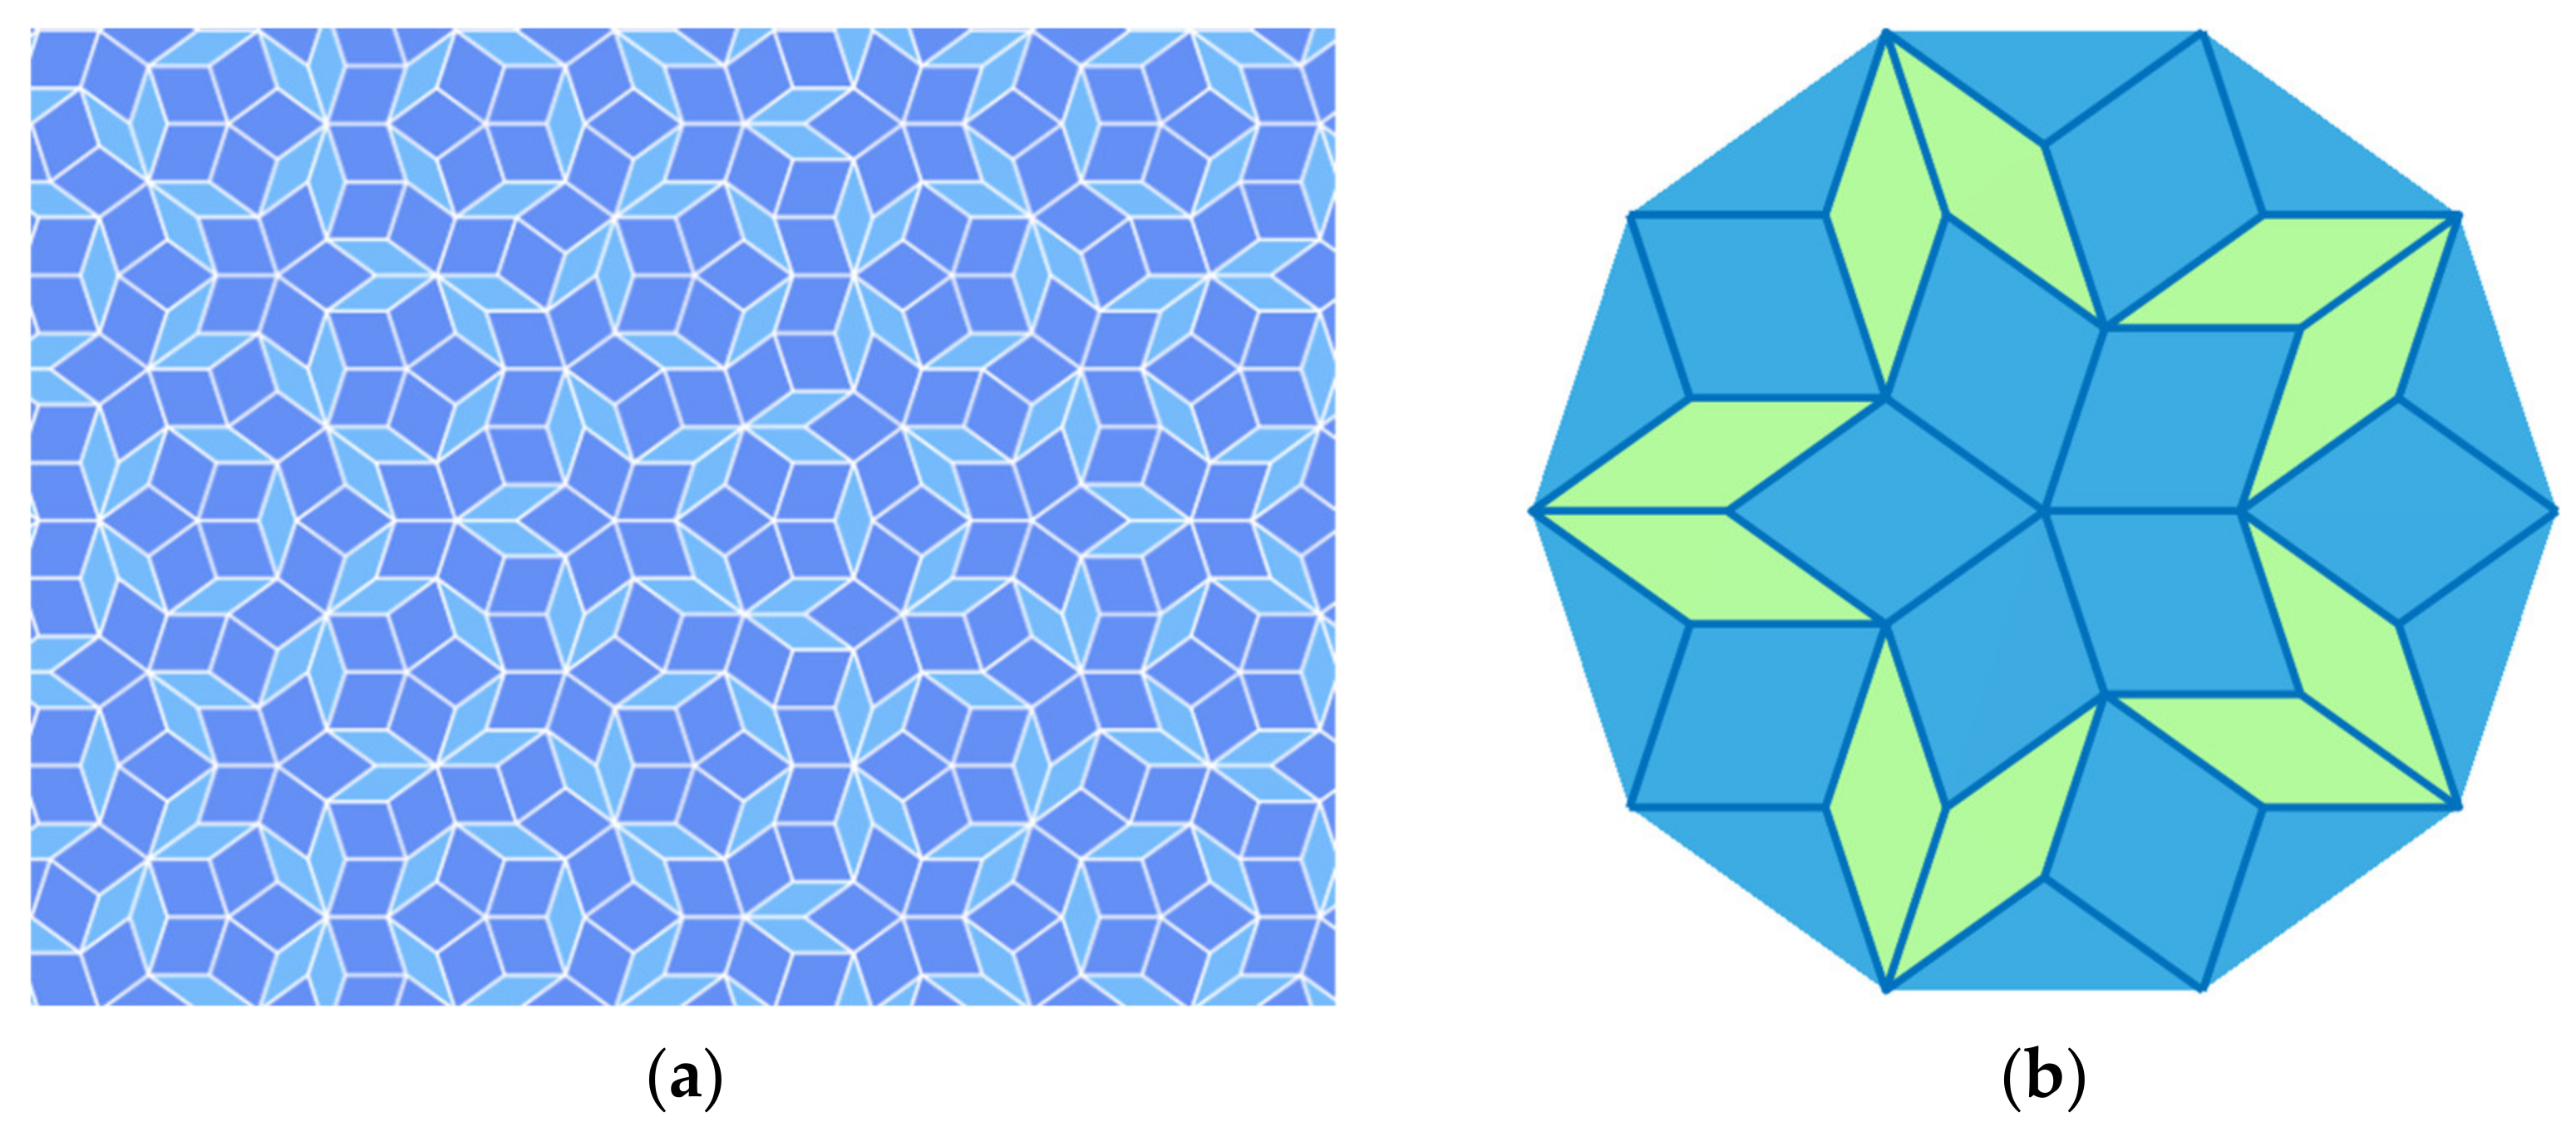
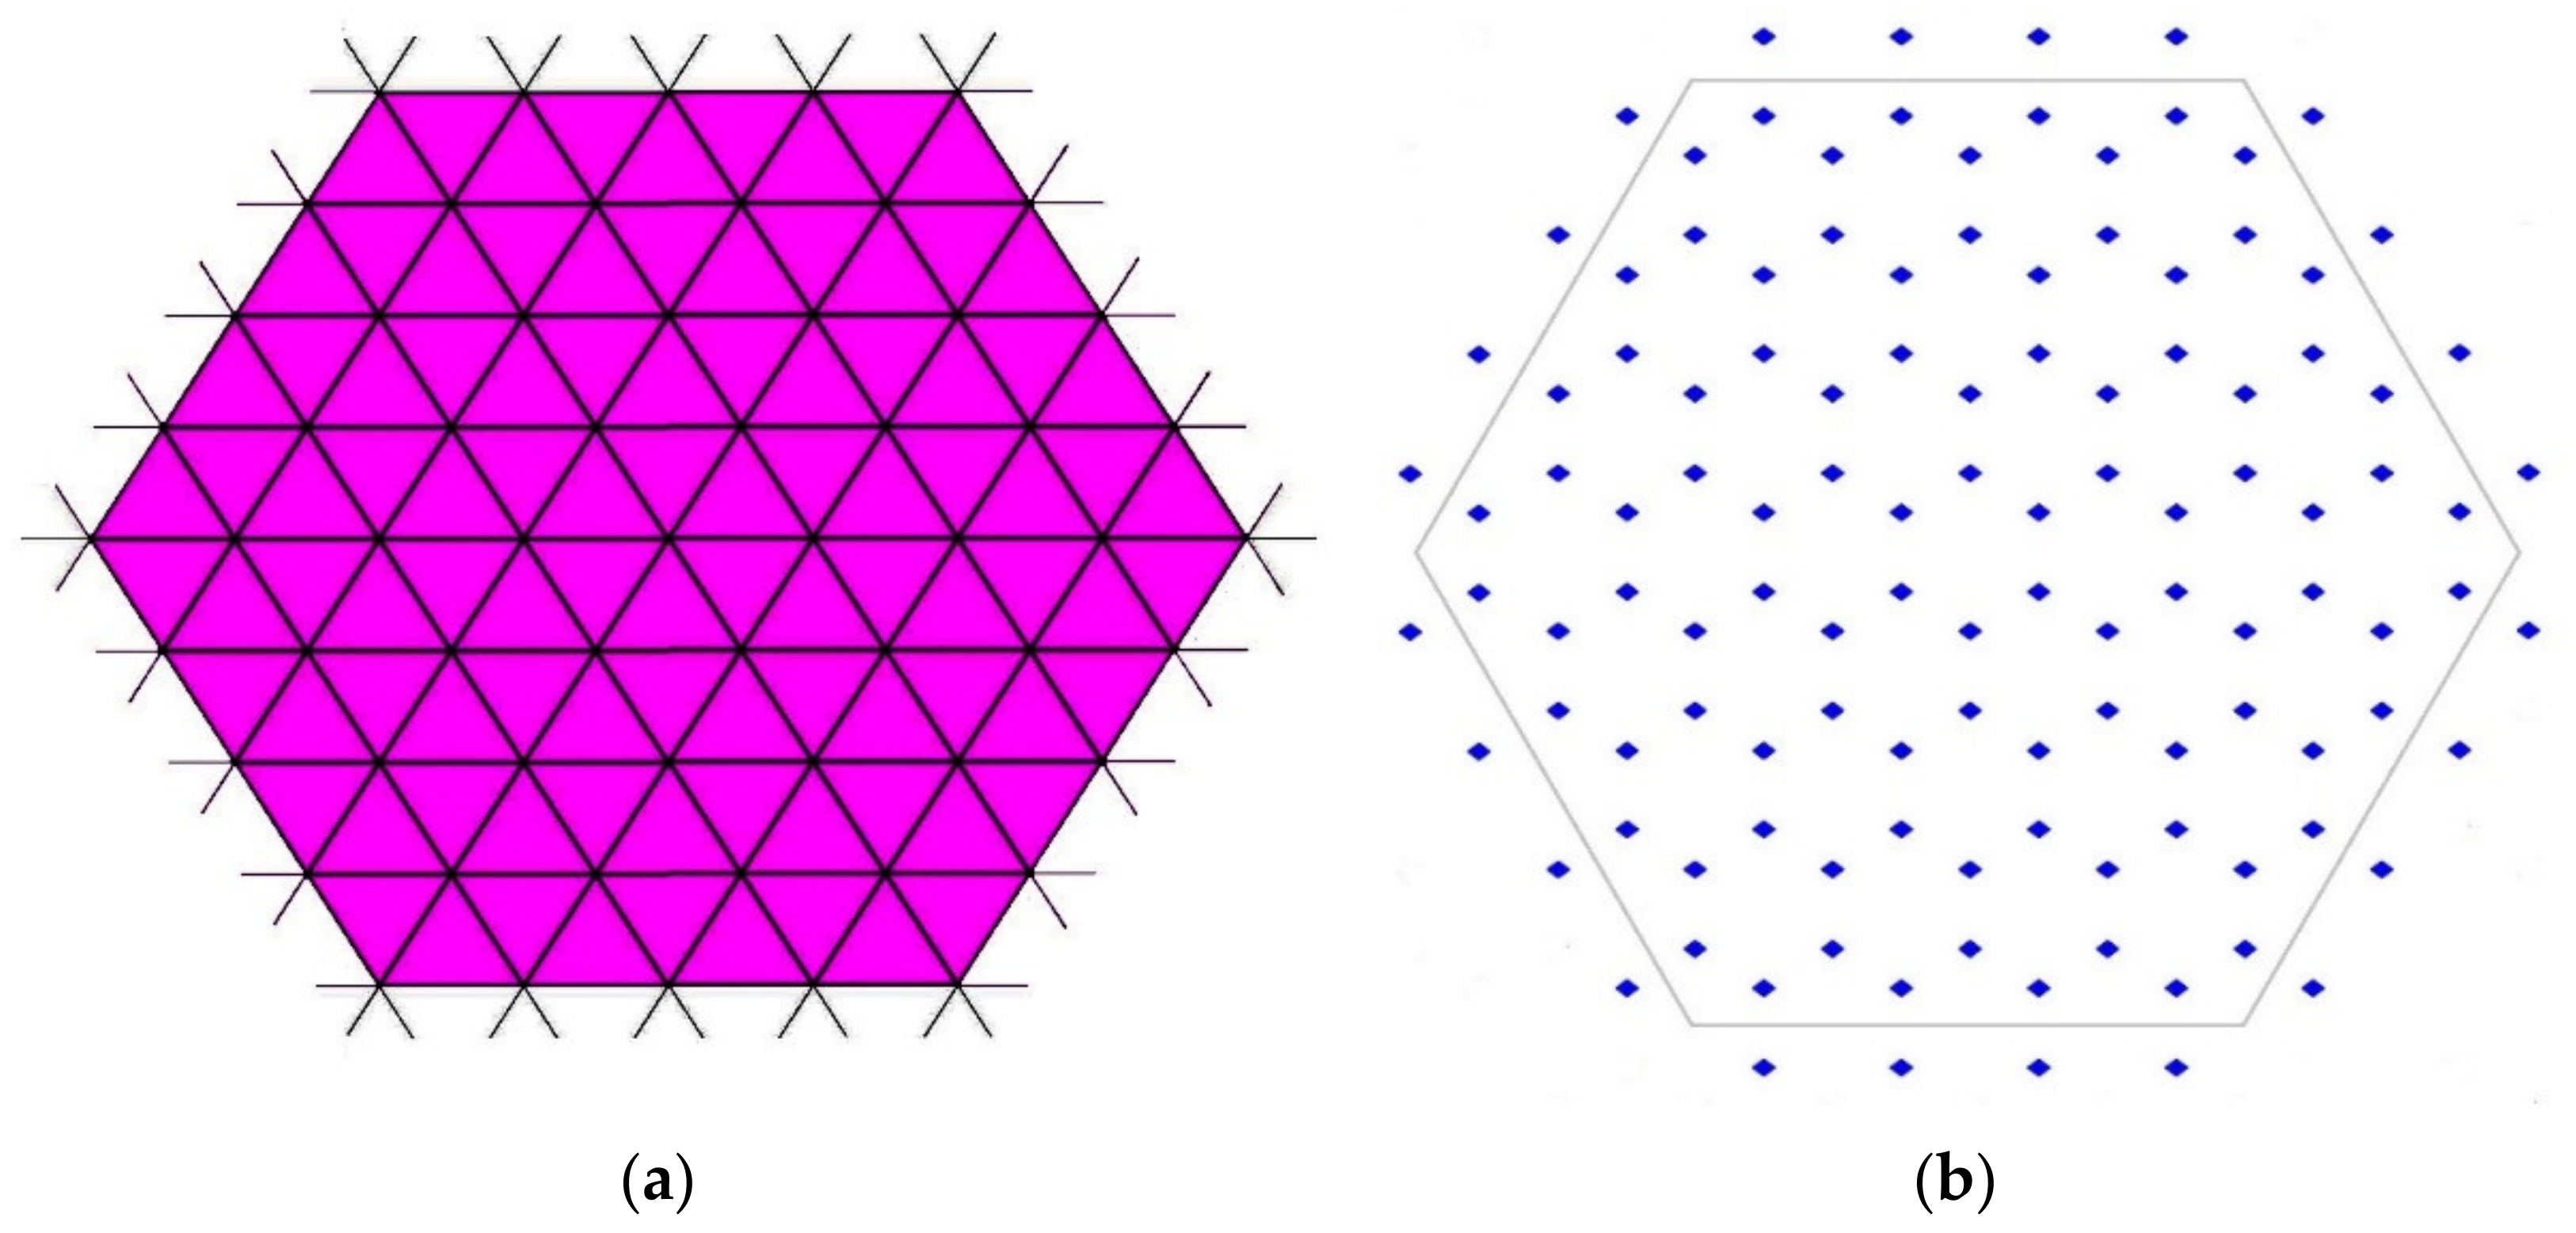
Voronoi diagrams generate new types of the Penrose tiling, which are different from the classical ones as shown in Figure 1.
(ii)
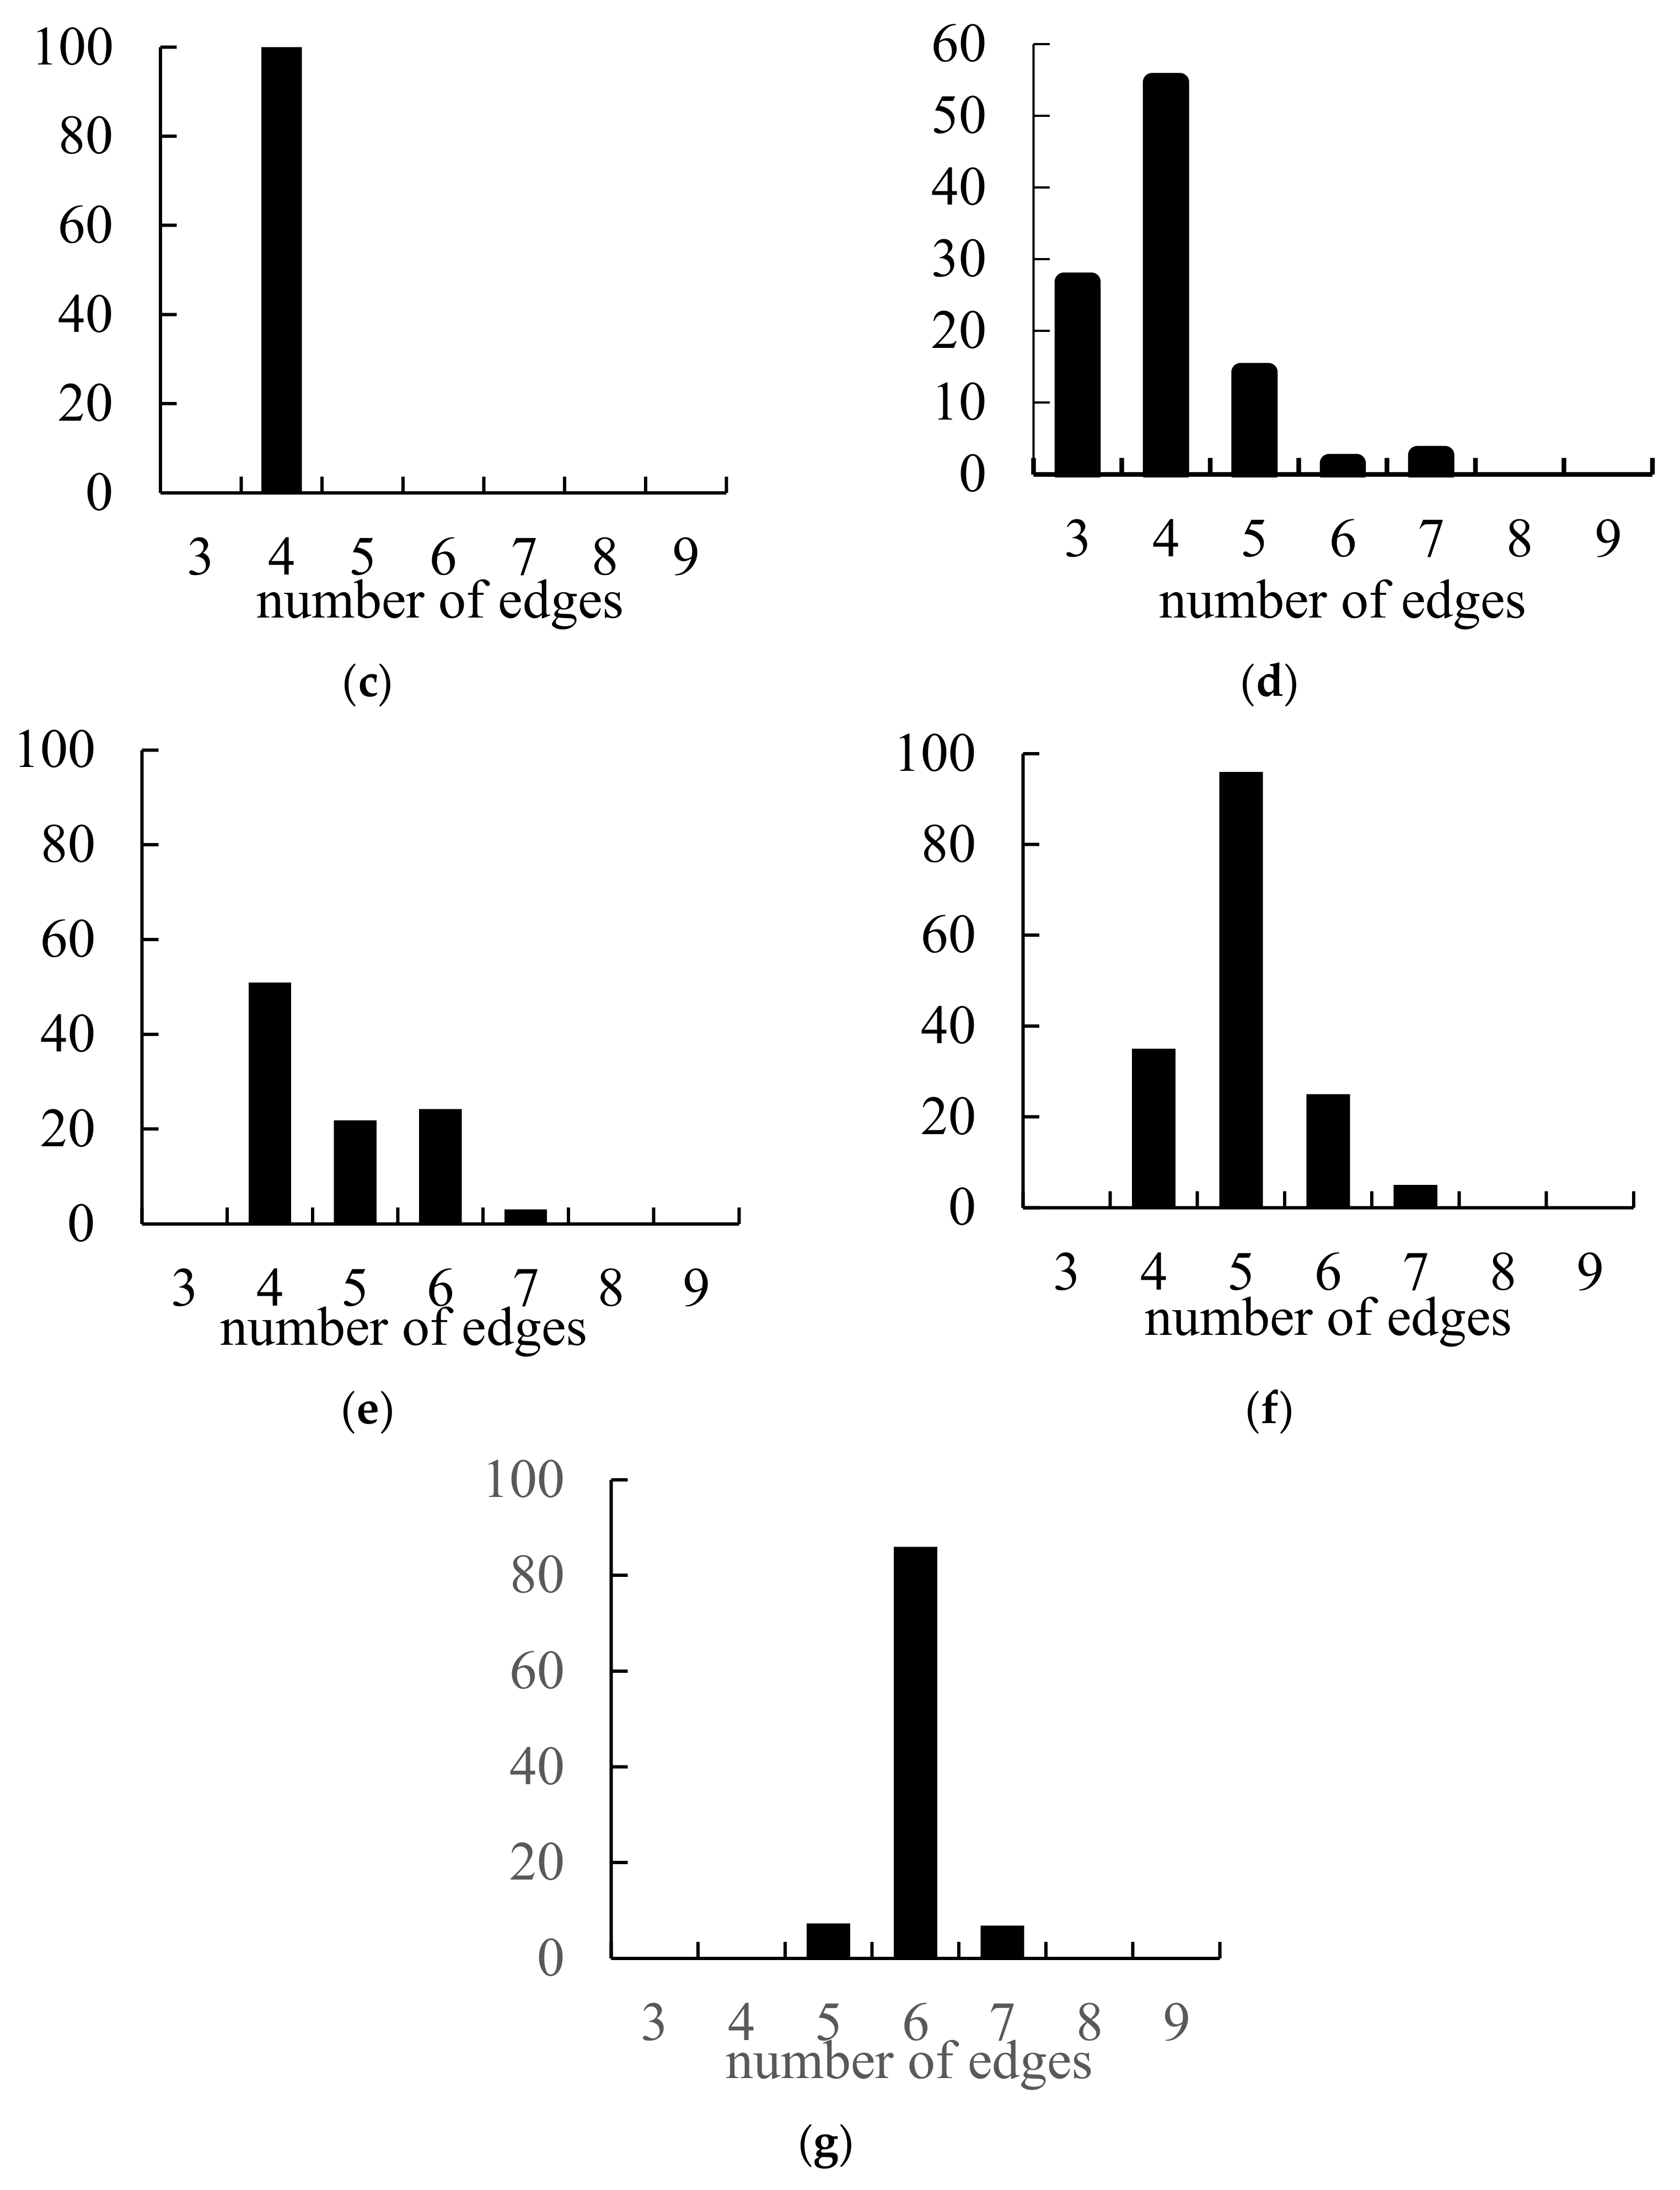
The Voronoi entropy is not necessarily an exact measure of symmetry of the given tiling on all spatial scales. It is possible that the Voronoi entropy of the entire pattern equals zero; however, it contains non-symmetrical elements.
What do we learn from the c-type diagrams? We conclude that the entire pattern may be highly symmetrical (it demonstrates the five-fold rotational symmetry in our case); however, the continuous measure of symmetry of the pattern may be high, due to the fact that it is built from irregular, non-symmetrical polygons. The generalization of the suggested analysis for the weighted Voronoi diagrams is foreseen [39,40].
The “opposite” to the c-type diagrams case is supplied by the “b”-type tessellations, where the vertices of the rhombs constituting the Penrose tiling are taken as seeds, as depicted in Figure 3b. This kind of Voronoi diagram (built from three kinds of polygons) is characterized by the relatively high value of the Voronoi entropy ( S v o r = 1.0847 ) , which is close to the maximal possible value of the Voronoi entropy inherent for the tessellation, built of three different kinds of polygons, namely S v o r m a x = 1.0986 . At the same time, the continuous measure of symmetry of this tessellation is low, namely, S ˜ G = 0.0367 ;   Λ G = 19.15 % . This result is intuitively well understood if we consider that three kinds of polygons, shown in Figure 3b, are symmetrical or close to being symmetrical.
The main conclusion that arises from the data displayed in Table 1 is formulated as follows: the continuous symmetry measure and the Voronoi entropy of the studied sets of points, generated by the Penrose tiling, do not necessarily correlate. This conclusion supports the results reported in Ref. [29], in which VE and CSM of levitating droplet clusters were established, and it was demonstrated that the maxima and minima of the VE and CSM are not always well correlated. Furthermore, in some cases, the maxima of the CSM may correspond to the minima of the VE.
Obviously, for the ideal patterns, such as those shown in Figure 5, S v o r = 0 ; S ˜ G = 0 ;   Λ G = 0 . However, this trivial case does not enable a general conclusion; the contra-example supplied by the c-type Voronoi diagrams refutes the idea that VE and CSM are always correlated.

4. Conclusions

The notion of “ordering” is not exactly defined in physics and mathematics. Various quantitative measures were introduced in order to quantify “order” in physical systems in mathematical objects. One of the most popular (but not the only) of measures of ordering in 2D sets of points are the Voronoi entropy [4,5,6,7,8,9,10,11,12,13,39,40,41] and the recently introduced and developed continuous measure of symmetry, breaking the binary (YES/NO) approach to symmetry [19,20,21,22,23,24,25,26,27,28,29]. We posed the following question: are the Voronoi entropy and continuous measure of symmetry (which both quantify “ordering” in 2D sets of points) necessarily correlated? We restricted ourselves by the analysis of the Voronoi entropy and continuous measure of symmetry of the aperiodic Penrose tiling, demonstrating the five-fold rotational symmetry. A Penrose tiling, depicted in Figure 1, is an aperiodic tiling that has a five-fold symmetry. Translational symmetry is absent in Penrose tessellation; on the other hand, the Penrose tiling, presenting the mathematical tool, emerging from the analysis of quasicrystals, may have both the reflection symmetry and the five-fold rotational symmetry [31,32,33]. We calculated the Voronoi entropy and, in parallel, the continuous measure of symmetry for Voronoi diagrams emerging from the Penrose tiling. It should be emphasized that a given Penrose tiling gives rise to a number of Voronoi diagrams when the centers, vertices and the centers of the edges of the Penrose rhombs are taken as the seed points (or nuclei). The main conclusion, which arises from our research, is formulated as follows: the continuous symmetry measure and the Voronoi entropy of the studied sets of points, generated by the Penrose tiling, do not necessarily correlate. Voronoi diagrams emerging from the centers of the edges of the Penrose rhombs, considered seeds, refute the idea that the Voronoi entropy and the continuous measure of symmetry are always correlated. The Voronoi entropy of this kind of tiling equals exactly zero; on the other hand, the continuous measure of symmetry of this pattern is relatively high. We conclude that the Voronoi entropy is not necessarily an exact measure of symmetry of the given tiling on all of the scales. It is possible that the Voronoi entropy of the entire pattern equals zero; however, the tiling is built from the non-symmetrical elements. It also should be noted that Voronoi diagrams generate new types of Penrose tiling, as shown in Figure 3c, which are different from the classical Penrose tessellation, presented in Figure 1. Voronoi diagrams generated by the Penrose tiling keep the original group of symmetry of the tiling. In our future research, we plan to study the evolution of the Voronoi entropy and continuous measure of symmetry under deformation of patterns generated by the Penrose tiling. We also plan to introduce and calculate the informational measure of symmetry of the patterns emerging from the Penrose tiling.

Author Contributions

Conceptualization, E.B., I.L. and M.F.; methodology, E.B., M.F., I.L., N.S. and S.S; software, I.L., M.F. and N.S.; validation, E.B., M.F., I.L., N.S. and S.S.; formal analysis, E.B., M.F., I.L., N.S. and S.S.; investigation, I.L. and M.F., N.S. and S.S.; data curation, E.B., M.F., I.L., N.S. and S.S.; writing—original draft preparation, E.B. and M.F.; supervision, E.B. and S.S.; project administration, S.S. All authors have read and agreed to the published version of the manuscript.

Funding

E.B. and M.F. are thankful for funding to the Russian Science Foundation, grant number 19-19-00076.

Institutional Review Board Statement

Not Applicable.

Data Availability Statement

The data that support the findings of this study are available on request from the corresponding author.

Acknowledgments

The authors are thankful to Yelena Bormashenko for her kind help in preparing this paper. The authors are thankful to anonymous reviewers for their instructive reviewing of the manuscript.

Conflicts of Interest

The authors declare no conflict of interest.

References

  1. Lang, S. Algebra, 3rd ed.; Addison-Wesley: Reading, MA, USA, 1993. [Google Scholar]
  2. Radomsky, A.S.; Rachman, S. Symmetry, ordering and arranging compulsive behavior. Behav. Res. Ther. 2004, 42, 893–913. [Google Scholar] [CrossRef] [PubMed] [Green Version]
  3. Crutchfield, J.P. Between order and chaos. Nature Phys. 2012, 8, 17–24. [Google Scholar] [CrossRef]
  4. Voronoi, G. Nouvelles applications des paramètres continus à la théorie des formes quadratiques. Deuxième mémoire. Recherches sur les paralléloèdres primitifs. Reine Angew. Math. 1908, 134, 198–287. [Google Scholar] [CrossRef]
  5. Descartes, R. Principia Philosophiae; Ludovicus Elzevirius: Amsterdam, The Netherlands, 1644; ISBN 978-90-277-1754-2. [Google Scholar]
  6. Barthélemy, M. Spatial networks. Phys. Rep. 2011, 499, 1–101. [Google Scholar] [CrossRef] [Green Version]
  7. Weaire, D.; Rivier, N. Soap, cells and statistics—random patterns in two dimensions. Contemp. Phys. 1984, 25, 59–99. [Google Scholar] [CrossRef]
  8. Xu, K. Geometric formulas of Lewis’s law and Aboav-Weaire’s law in two dimensions based on ellipse packing. Philos Mag. Lett. 2019, 99, 317–325. [Google Scholar] [CrossRef]
  9. Wang, S.; Tian, Z.; Dong, K.; Xie, Q. Inconsistency of neighborhood based on Voronoi tessellation and Euclidean distance. J. Alloys Compd. 2021, 854, 156983. [Google Scholar] [CrossRef]
  10. Fedorets, A.; Frenkel, M.; Shulzinger, E.; Dombrovsky, L.; Bormashenko, E.; Nosonovsky, M. Self-assembled levitating clusters of water droplets: Pattern-formation and stability. Sci. Rep. 2017, 7, 1888. [Google Scholar] [CrossRef]
  11. Fedorets, A.A.; Frenkel, M.; Bormashenko, E.; Nosonovsky, M. Small Levitating Ordered Droplet Clusters: Stability, Symmetry, and Voronoi Entropy. J. Phys. Chem. Lett. 2017, 8, 5599–5602. [Google Scholar] [CrossRef]
  12. Frenkel, M.; Arya, P.; Bormachenko, E.; Santer, S. Quantification of ordering in active light driven colloids. J. Colloid Interface Sci. 2021, 586, 866–875. [Google Scholar] [CrossRef]
  13. Bormashenko, E.; Frenkel, M.; Vilk, A.; Legchenkova, I.; Fedorets, A.A.; Aktaev, N.E.; Dombrovsky, L.A.; Nosonovsky, M. Characterization of self-assembled 2D patterns with Voronoi Entropy. Entropy 2018, 20, 956. [Google Scholar] [CrossRef] [PubMed] [Green Version]
  14. Parker, J.; Sherman, E.; van de Raa, M.; van der Meer, D.; Samelson, L.E.; Losert, W. Automatic sorting of point pattern sets using Minkowski functionals. Phys. Rev. E 2013, 88, 022720. [Google Scholar] [CrossRef] [PubMed] [Green Version]
  15. Mantz, H.; Jacobs, K.; Mecke, K. Utilizing Minkowski functionals for image analysis: A marching square algorithm. J. Stat. Mech. Theor. Exp. 2008, 2008, P12015. [Google Scholar] [CrossRef]
  16. Bormashenko, E.; Malkin, A.; Musin, A. Mesoscopic patterning in evaporated polymer solutions: Poly (ethylene glycol) and room-temperature-vulcanized Polyorganosilanes/-siloxanes Promote formation of honeycomb structures. Macromol. Chem. Phys. 2008, 209, 567–576. [Google Scholar] [CrossRef]
  17. Bormashenko, E. Entropy, Information, and Symmetry: Ordered is Symmetrical. Entropy 2020, 22, 11. [Google Scholar] [CrossRef] [PubMed] [Green Version]
  18. Bormashenko, E. Entropy, Information, and Symmetry; Ordered Is Symmetrical, II: System of Spins in the Magnetic Field. Entropy 2020, 22, 235. [Google Scholar] [CrossRef] [Green Version]
  19. Zabrodsky, H.; Peleg, S.; Avnir, D. Continuous symmetry measures. J. Am. Chem. Soc. 1992, 114, 7843–7851. [Google Scholar] [CrossRef]
  20. Zabrodsky, H.; Peleg, S.; Avnir, D. Continuous symmetry measures. 2. Symmetry groups and the tetrahedron. J. Am. Chem. Soc. 1993, 115, 8278–8289. [Google Scholar] [CrossRef]
  21. Zabrodsky, H.; Avnir, D. Continuous Symmetry Measures. 4. Chirality. J. Am. Chem. Soc. 1995, 117, 462–473. [Google Scholar] [CrossRef]
  22. Pinsky, M.; Avnir, D. Continuous Symmetry Measures. 5. The Classical Polyhedra. Inorg. Chem. 1998, 37, 5575–5582. [Google Scholar] [CrossRef]
  23. Zabrodsky, H.; Peleg, S.; Avnir, D. Symmetry as a continuous feature. IEEE Trans. Pattern Anal. Mach. Intel. 1995, 17, 1154–1166. [Google Scholar] [CrossRef] [Green Version]
  24. Pinsky, M.; Dryzun, C.; Casanova, D.; Alemany, P.; Avnir, D. Analytical methods for calculating Continuous Symmetry Measures and the Chirality Measure. Comp. Chemistry 2008, 29, 2712–2721. [Google Scholar] [CrossRef]
  25. Sinai, H.E.; Avnir, D. Adsorption-induced Symmetry Distortions in W@Au12 Nanoclusters, Leading to Enhanced Hyperpolarizabilities. Israel J. Chem. 2016, 56, 1076–1081. [Google Scholar] [CrossRef]
  26. Ok, K.M.; Halasyamani, P.S.; Casanova, D.; Llunell, M.; Alemany, P.; Alvarez, S. Distortions in Octahedrally Coordinated d0 Transition Metal Oxides:  A Continuous Symmetry Measures Approach. Chem. Mater. 2006, 18, 3176–3183. [Google Scholar] [CrossRef]
  27. Bonjack, M.; Avnir, D. The near-symmetry of protein oligomers: NMR-derived structures. Sci. Rep. 2020, 10, 8367. [Google Scholar] [CrossRef]
  28. Grimme, S. Continuous symmetry measures for electronic wavefunctions. Chem. Phys. Lett. 1998, 297, 15–22. [Google Scholar] [CrossRef]
  29. Frenkel, M.; Fedorets, A.A.; Dombrovsky, L.A.; Nosonovsky, M.; Legchenkova, I.; Bormashenko, E. Continuous Symmetry Measure vs Voronoi Entropy of Droplet Clusters. J. Phys. Chem. C 2021, 125, 2431–2436. [Google Scholar] [CrossRef]
  30. Graham, J.H.; Raz, S.; Hel-Or, H.; Nevo, E. Fluctuating Asymmetry: Methods, Theory, and Applications. Symmetry 2010, 2, 466–540. [Google Scholar] [CrossRef] [Green Version]
  31. De Bruijn, N.G. Algebraic theory of Penrose’s non-periodic tilings of the plane. Indag. Math. 1981, 84, 39–52. [Google Scholar] [CrossRef] [Green Version]
  32. Shechtman, D.; Blech, I.; Gratias, D.; Cahn, J.W. Metallic phase with long-range orientational order and no translational symmetry. Phys. Rev. Lett. 1984, 53, 1951–1953. [Google Scholar] [CrossRef] [Green Version]
  33. Collins, L.C.; Witte, T.G.; Silverman, R.; Green, D.B.; Gomes, K.K. Imaging quasiperiodic electronic states in a synthetic Penrose tiling. Nat. Commun. 2017, 8, 15961. [Google Scholar] [CrossRef] [PubMed]
  34. Bursill, L.; Ju Lin, P. Penrose tiling observed in a quasi-crystal. Nature 1985, 316, 50–51. [Google Scholar] [CrossRef]
  35. Lanczos, C. The Variational Principles of Mechanics; Dover Publications Inc.: New York, NY, USA, 1986. [Google Scholar]
  36. Casanova, D.; Llunell, M.; Alemany, P.; Alvarez, S. The rich stereochemistry of eight-vertex polyhedra: A continuous shape measures study. Chem. Eur. J. 2005, 11, 1479–1494. [Google Scholar] [CrossRef] [PubMed]
  37. Zahrt, A.F.; Denmark, S.E. Evaluating continuous chirality measure as a 3D descriptor in chemoinformatics applied to asymmetric catalysis. Tetrahedron 2019, 75, 1841–1851. [Google Scholar] [CrossRef]
  38. Tuvi-Arad, I.; Alon, G. Improved algorithms for quantifying the near symmetry of proteins: Complete side chains analysis. J. Cheminform. 2019, 11, 39. [Google Scholar] [CrossRef] [Green Version]
  39. Aurenhammer, F.; Edelsbrunner, H. An optimal algorithm for constructing the weighted Voronoi diagram in the plane. Pattern Recognit. 1984, 17, 251–257. [Google Scholar] [CrossRef]
  40. Mu, L. Polygon characterization with the multiplicatively weighted Voronoi diagram. Prof. Geogr. 2004, 56, 223–239. [Google Scholar]
  41. Bormashenko, E.; Legchenkova, I.; Frenkel, M. Symmetry and Shannon Measure of Ordering. Entropy 2019, 21, 452. [Google Scholar] [CrossRef] [Green Version]
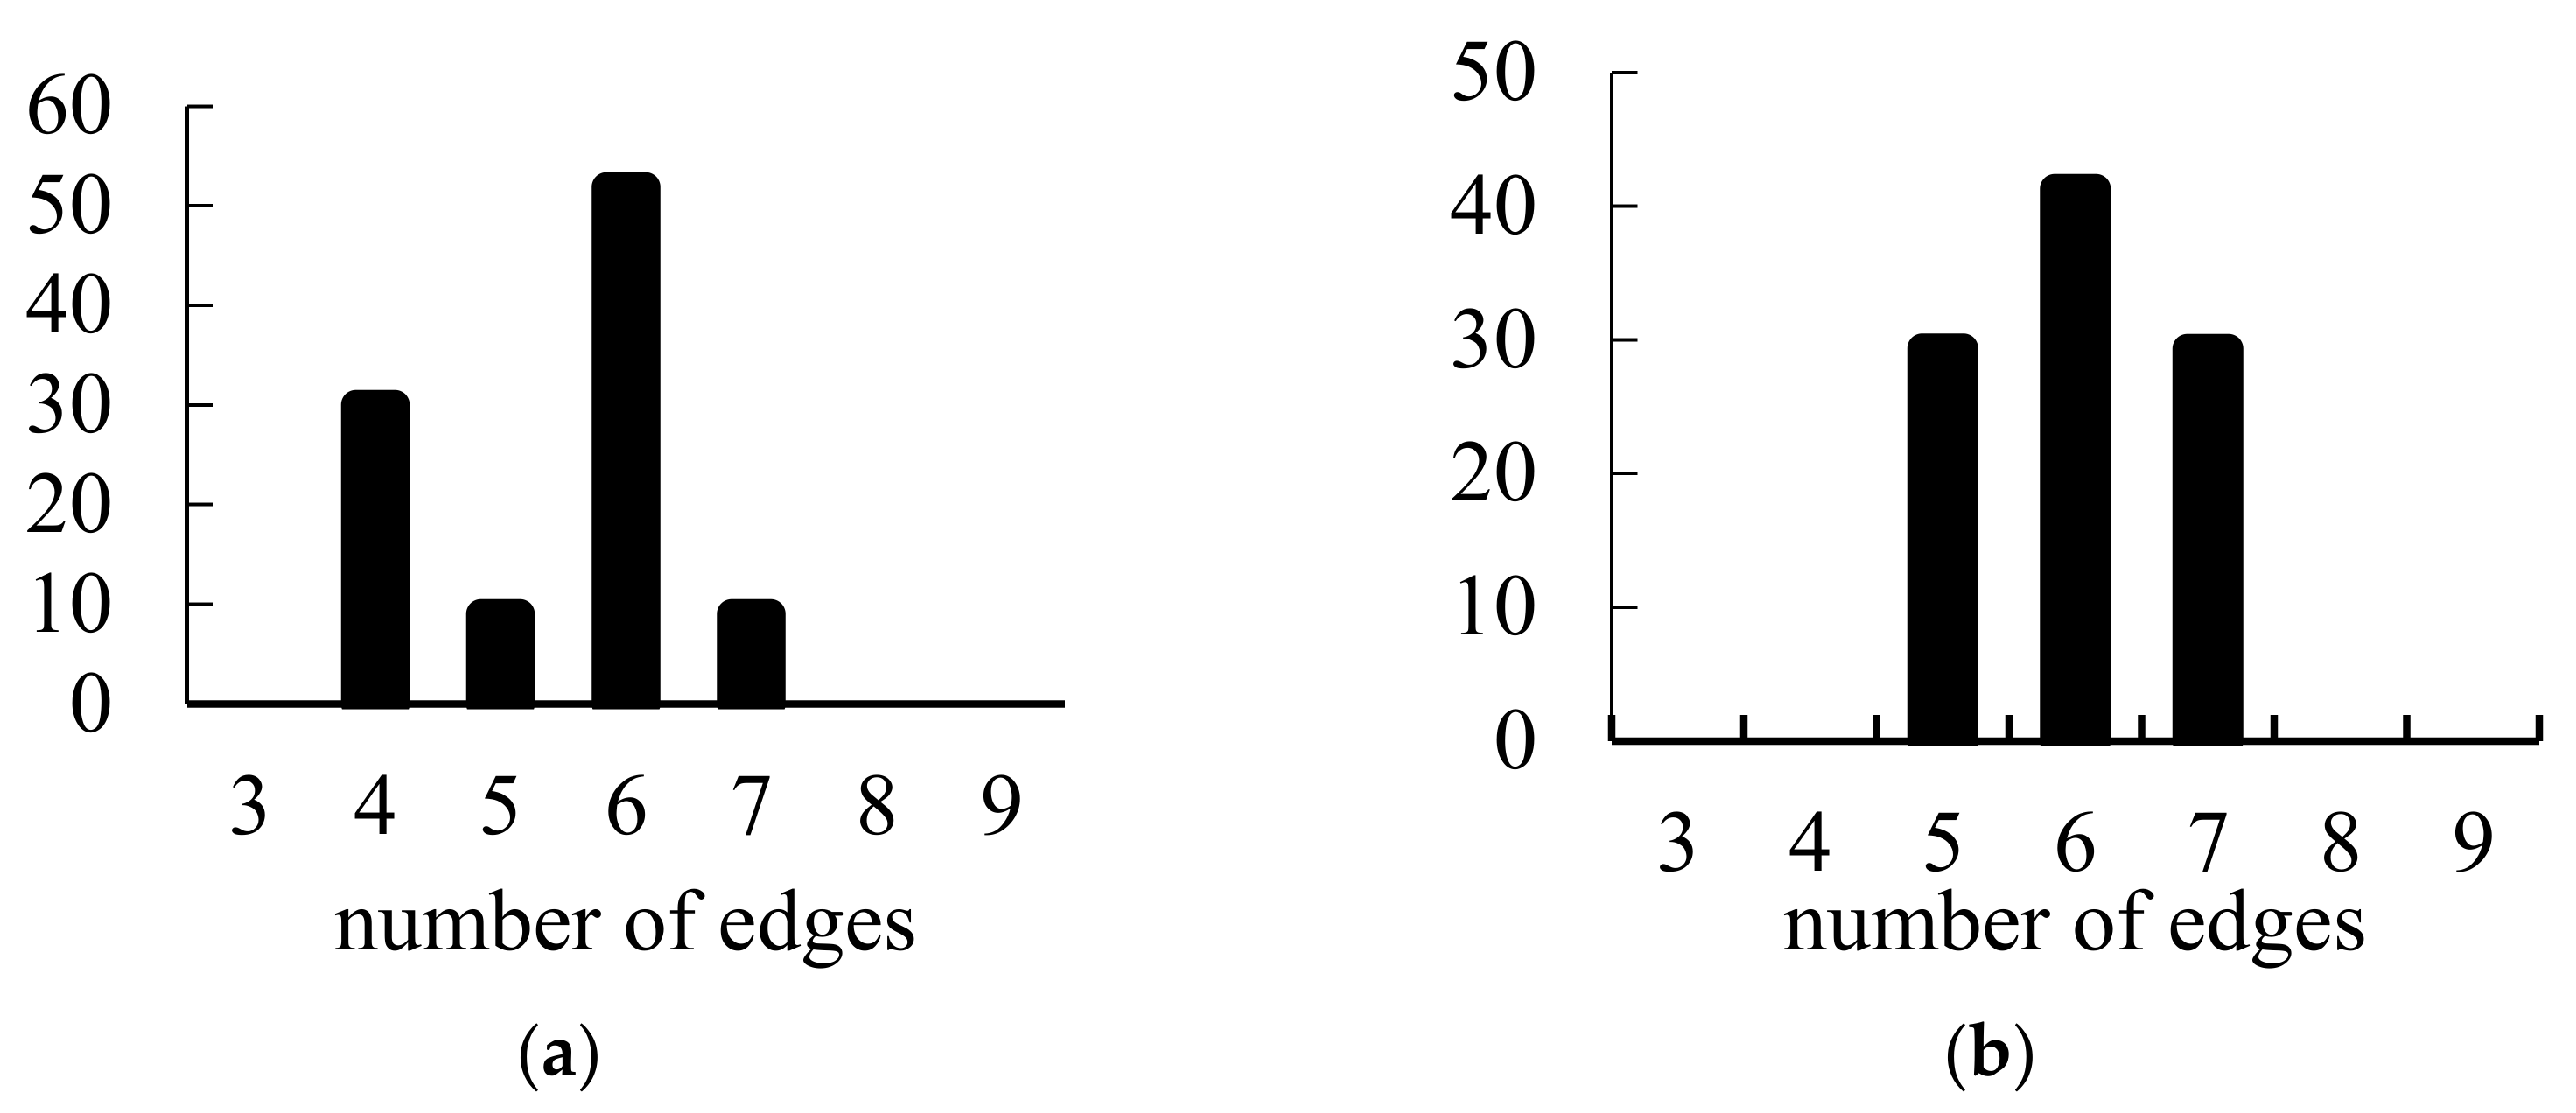
Figure 1. (a) Penrose tiling is depicted. The translation symmetry is absent in the pattern; however, the pattern demonstrates the five-fold rotational symmetry. (b) Fragment of the Penrose tiling is shown.
Symmetry 13 01659 g001
Figure 4. Distribution of polygons in different types (a, b, c, or combinations) of Voronoi diagram arising from the Penrose tiling (Figure 3), is depicted. Number of edges is put at the abscissa axis, percentage of polygons is put at the y-axis (a) a-type Voronoi tessellation; (b) b-type; (c) c-type; (d) ab-type (a and b-types combined); (e) ac-type; (f) bc-type; (g) abc-type (a, b, and c-types combined).
Symmetry 13 01659 g004aSymmetry 13 01659 g004b
Figure 5. Ideal Voronoi diagram (a) emerging from the hexagonal pattern of points (b).
Symmetry 13 01659 g005
Table 1. Voronoi entropy (VE) and continuous measure of symmetry (CSM) calculated for the Voronoi diagrams generated by the Penrose tiling (see Figure 3).
Diagram TypePolygons
Number, n p o l
Polygon Types NumberVoronoi Entropy,
S v o r
S ˜ G Λ G   %
a14041.13640.113833.74
b14131.08470.036719.15
c290100.109933.15
ab37551.1220.061924.87
ac20541.10260.093130.52
bc16141.03710.091230.2
abc22130.50260.051522.7
Publisher’s Note: MDPI stays neutral with regard to jurisdictional claims in published maps and institutional affiliations.

