1. Introduction
The Al–Mn so-called T-phase, also known as high-temperature “Al
3Mn”, is formed in a compositional region between ~25 and 29 at. % Mn and a temperature range of 895–1002 °C (see [
1] and references therein). The compositional region of the T-phase widely extends in numerous ternary Al–MnM alloy systems, where M is transition metal (see [
2] and references therein), which results in a significant decrease in its stability temperature. Furthermore, it was argued that the binary stoichiometry of the T-phase is Al
124Mn
32, which is outside of its homogeneity region [
2]. Reports on the atomic structure of the T-phase are puzzling. The history of the structure determination of the T-phase is a perfect example of a dispute about the accuracy of the estimation of the space group and corresponding atomic models. In 1938, the geometry of the T-phase’s unit cell was reported by Hoffmann as orthorhombic [
3]. In 1961, the centrosymmetric P
nam space group was chosen to describe its symmetry [
4], while in 1992, in a series of publications by Li et al. (see [
5] and references therein), the non-centrosymmetric P
na2
1 was argued. In 1993, its atomic model was proposed again in the framework of the P
nam space group [
6], while in 1994, Shi et al. [
7] insisted on P
na2
1. In 1995, Pavlyuk et al. [
8] succeeded in refining T phase’s structure in the framework of the P
nam space group but failed when using P
na2
1, which, according to these authors, would not give significantly better results. The binary P
nam prototype was chosen as a start for the structure refinement of the ternary T-phases [
9,
10,
11,
12,
13]. Despite the common starting model, their final atomic models varied. The major discrepancies were found in the occupancies and positions of transition metals.
Recently, the extension of the T-phase region in the Al–Mn–Pt alloy system up to ~Al
78Mn
17.5Pt
4.5 and its stability at ternary compositions down to at least 800 °C were reported in [
2]. A further study confirmed its stability also at 700 °C (to be published). The following lattice parameters were determined for the above-mentioned composition:
a = 14.720(4) Å,
b = 12.628(2) Å,
c = 12.545(3) Å [
2].
By using electron diffraction methods, a partial atomic model of the Al
78Mn
17.5Pt
4.5 T-phase was proposed in the framework of the non-centrosymmetric P
na2
1 space group [
2]. The current research was undertaken with the purpose of relating the above-mentioned inconsistency in the space group to differences in the composition of the ternary T-phase. It should be mentioned that ternary extensions of the T-phase, discussed in [
2], are much wider than the above-mentioned binary T-phase region. We performed a study of the symmetry of the Al–Mn–Pt T-phase varying the annealing temperature (700 vs. 800 °C) as well as its composition: Al
78Mn
17.5Pt
4.5 vs. Al
71.3Mn
25.1Pt
3.6. It was found that, regardless of the annealing temperature, the Al
78Mn
17.5Pt
4.5 T-phase is non-centrosymmetric, while the unit cell of the Al
71.3Mn
25.1Pt
3.6 T-phase can be described by the centrosymmetric P
nam space group. Furthermore, a direct structural relationship between the two options (centrosymmetric vs. non-centrosymmetric) is proposed.
2. Materials and Methods
Two Al–Mn–Pt compositions (see
Table 1) were selected from the opposite Al limits of the compositional region of the T-phase. The alloys were produced by levitation induction melting in a water-cooled copper crucible under a pure Ar atmosphere. The purity of Al was 99.999%, Mn 99.99%, and Pt 99.9%. For homogeneity, the samples were annealed under a vacuum of 9 × 10
−7 mBar.
The alloys were ground into powder using an agate mortar and pestle, dispersed in isopropanol, and stirred in the ultrasonic bath. Each suspension was drop cast on a carbon-coated Cu grid. The samples were studied using the JEOL JEM-2100 Transmission Electron Microscope (TEM) operating at 200 kV. A convergence angle of about 2 × 10⁻² rad was used to acquire Convergent Beam Electron Diffraction (CBED) patterns. A condenser aperture of 20 μm in diameter was applied to eliminate the overlapping of the CBED disks.
The P
nam and P
na2
1 space groups, discussed here, exhibit the same extinction conditions: k + l = 2n for the {0kl} type reflections; h = 2n for the {h0l} and {h00} type reflections; k = 2n and l = 2n for the {0k0} and {00l} type reflections [
14]. These space groups could not be distinguished by powder X-ray diffraction and conventional selected area electron diffraction (SAED). On the other hand, the CBED method has the power to perform this, differentiating between not only the extinction conditions but also the point groups. It is based on an evaluation of the highly sensitive to symmetry Zero Order Laue Zone (ZOLZ) and the whole patterns (WP), containing the Higher-Order Laue Zones (HOLZ) in addition to ZOLZ. These patterns can be 3D or 2D, depending on the information seen or not seen in the CBED disks. In some cases, even the 2D information found in the CBED patterns is sufficient for an estimation of the correct symmetry. The methodology, along with the definition of the types of patterns used, can be found in [
15].
The P
nam and P
na2
1 space groups belong to the mmm and
mm2 point groups, respectively, and as stated, exhibit different symmetries of the CBED patterns taken along the high symmetry axes [
15]. During the capturing of the whole patterns, due to the above-mentioned large unit cell parameters of the T-phase, it was impossible to avoid the overlapping of the CBED disks. Thus, microdiffraction patterns with almost parallel beams were taken in the nano-beam mode. For convenience,
Table 2 is reproduced from [
15], summarizing the symmetry of the CBED patterns expected at the high symmetry axes for the
mmm and
mm2 point groups.
3. Results and Discussion
Primarily, the effect of the structure relaxation on the symmetry of the unit cell was studied. It was previously reported [
2] that an Al
78Mn
17.5Pt
4.5 alloy, annealed at 800 °C, contained inside the T-phase’s matrix fine precipitation of a second phase, formed during cooling from the annealing temperature. This second phase was identified as isostructural to the so-called R-phase, reported to coexist with the T-phase in the Al–Mn–Pd alloy system, where Al
78.6Mn
15.6Pd
5.7 R-phase was found to have the C
mcm space group and following lattice parameters
a = 7.76 Å,
b = 23.88 Å,
c = 12.43 Å [
9,
16]. The presence of this phase indicates that the precipitates-free regions of the T-phase, which were used for the structure determination in [
2], could be supersaturated. Thus, the structure in these regions could have a different space group than that ascribed to the binary T-phase due to the corresponding internal strain. Therefore, the same alloy was additionally annealed at 700 °C to complete the precipitation of the R-phase, which would result in a relaxation of the T-phase’s matrix. By following this annealing, the resultant material contained equiaxed grains of both phases, exceeding 100 nm in diameter, which is sufficient for electron diffraction experiments.
The unit cell parameters of the T- and R-phases are closely related [
5,
9,
12] and, hence, many interplanar distances (d
hkl) overlap. Therefore, at many orientations, electron diffraction patterns could be indexed in terms of both phases. The most effective way to distinguish between them is either by comparing their strong reflections distribution at the principal axes [
16] or by the presence of the reflections with the interplanar distance of ~9.5 Å ({110} of the T-phase), which do not appear in the R-phase interplanar spacing list. Therefore, the CBED analysis was performed using the
[
] zone axis patterns of the T-phase. According to
Table 2, the difference between the discussed point groups (
mmm vs.
mm2) along the [
] orientation can be observed using the 2D WP patterns. This means that only intensity distribution of the CBED disks is considered while assessing the symmetry, i.e., without taking features as excess and deficiency lines, the ZOLZ fringes, etc., into account. This information is available on ZOLZ CBED patterns displaying only ZOLZ disks. The mmm point group will impose the 2
mm symmetry on the ZOLZ CBED pattern, while the
m symmetry of this pattern will indicate that the
mm2 point group is the correct one.
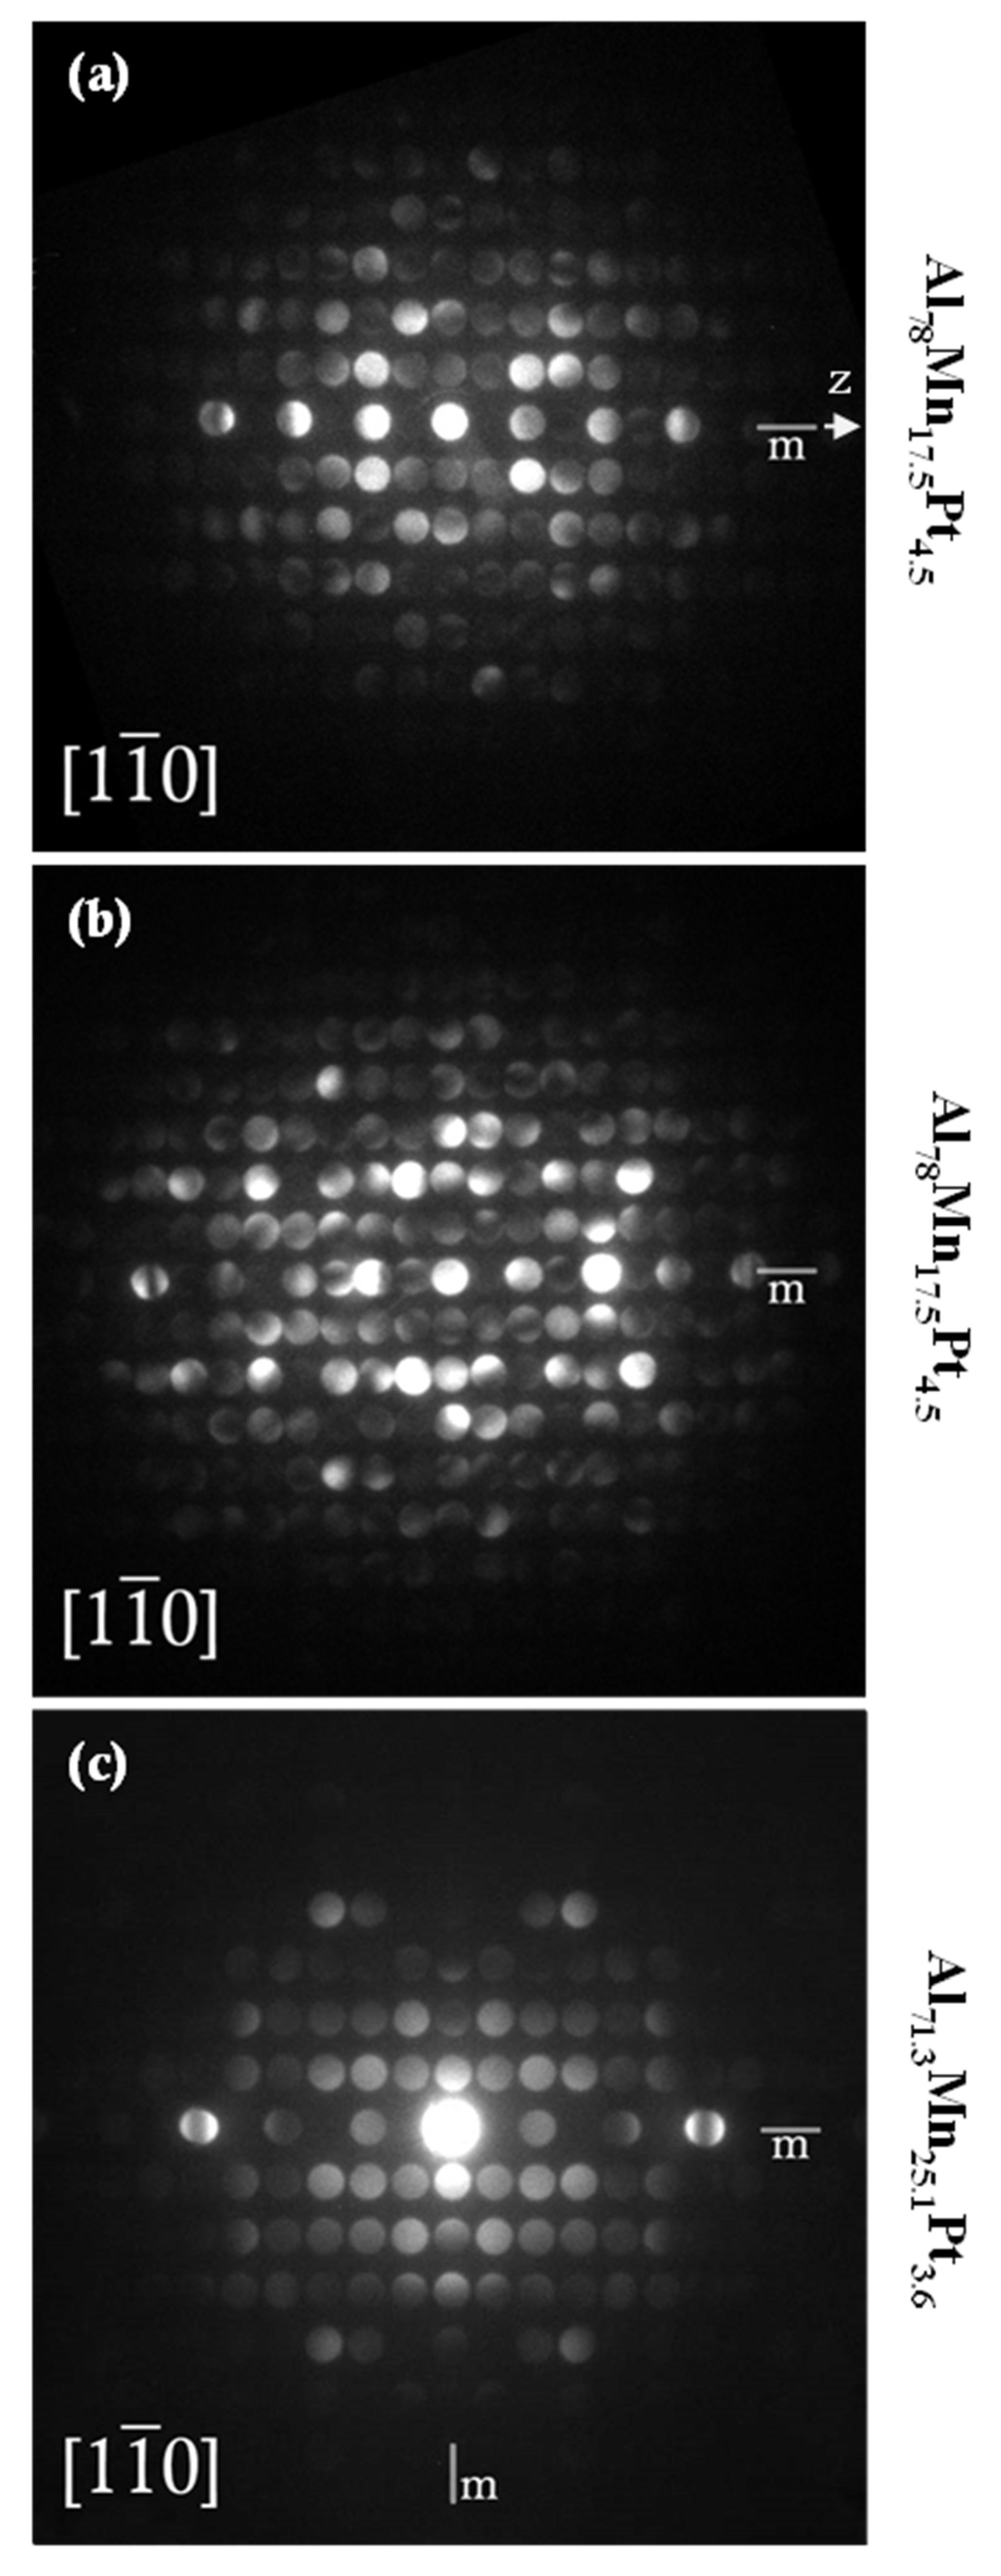
The 2D ZOLZ patterns of the Al
78Mn
17.5Pt
4.5 T-phase annealed at 700 and 800 °C are shown in
Figure 1a,b, respectively. Regardless of the annealing temperature, i.e., in either supersaturated or relaxed state, the symmetry of the T-phase remained the same. In both cases, symmetry was evaluated as
m, indicating the
mm2 point group, and subsequently the P
na2
1 space group, as reported in [
2].
The change in the symmetry as a function of composition can be seen clearly in
Figure 1c. For the Al
71.3Mn
25.1Pt
3.6 composition (i.e., with a visibly lower Al/Mn ratio), the symmetry of the ZOLZ pattern is 2
mm, indicating the
mmm point group and, subsequently, the P
nam space group, which is in line with reported for the binary T-“Al
3Mn” phase [
6].
The structure of the T-phase with the P
nam space group can be described as a stacking of flat and puckered layers [
5]. If these flat layers are not strictly flat, their mirror symmetry is destroyed, resulting in the P
na2
1 space group, and a displacement of even ±0.005 from z = 1/4 is sufficient for this. Here, (x, y, 1/4) is the 4
c special Wyckoff position in
a-
cb setting of the P
nma space group, i.e., P
nam, while in the P
na2
1 space group, this position is general, of the (x, y, z) type. In a wide compositional region, the replacement between several larger Al and smaller Mn atoms could easily result in such displacements, which would be more reliably recognized at compositions with an extremal Al/Mn ratio. Obviously, this is also the question of the experimental resolution.
On the other hand, due to the change in the space group, some splitting of the corresponding general 8
d Wyckoff positions would be inevitable since, in the P
na2
1 space group, only the 4a positions exist. Since the maximal translationengleiche subgroup of P
nam is P
na2
1 [
17], the transition from one to another will cause the described above splitting of each general 8
d Wyckoff position into two general 4
a positions: one with the same coordinates, turning to be of the (x, y, z) type, and the other (0.5 − x, 0.5 + y, 1 − z)). During this transition, each special 4
c position (of the (x, y, 1/4) type in the P
nam space group) turns into a general position (x, y, z) of the 4
a type in the P
na2
1 space group [
14,
17].
Considering the stoichiometry of the T-phase as binary Al
124Mn
32, this is plausible to place the 8 Pt atoms in Al
78Mn
17.5Pt
4.5 at specific Mn cites (see [
2]), while by decreasing Al concentration, some Al sites would be (partially) occupied by Mn, as it is in the case of the current structural models of the T-phase [
6,
8]. Our results are in favor of a suggestion that the increase in symmetry is rather caused by the replacement of Al by Mn, while the Mn/Pt substitution seems to have no influence on the symmetry.


