Article

Indirect Approach to Identify Girder Bridge Element Stiffness Based on Blind Source Separation

1
School of Civil Engineering, Chongqing University, Chongqing 400044, China
2
MCC Saidi Engineering Technology Co., Ltd., Chongqing 400013, China
3
Power China Chongqing Engineering Co., Ltd., Chongqing 400060, China
4
School of Architecture and Civil Engineering, Xiamen University, Xiamen 361005, China
*
Authors to whom correspondence should be addressed.
Symmetry 2022, 14(10), 1963; https://doi.org/10.3390/sym14101963
Submission received: 3 August 2022 / Revised: 16 August 2022 / Accepted: 16 September 2022 / Published: 20 September 2022
(This article belongs to the Special Issue Symmetry in Safety and Disaster Prevention Engineering)

Abstract

:
The indirect method of using a passing vehicle to identify modal properties of a girder bridge has become attractive recently. Compared to the direct method, which requires a lot of sensors installed directly on the bridge itself, the indirect method only requires a single sensor installed on the vehicle to indirectly measure the response of the bridge. However, it is difficult to eliminate the adverse effect of road surface roughness. An indirect approach based on blind source separation is proposed for the first time in this study to identify the bridge element stiffness where two movable vehicles are used. Two identical vehicles stay at rest at the designated measurement points and their vertical accelerations are collected. After one measurement, the two vehicles move to other designated measurement points and the accelerations are collected again. The same procedure is repeated until the two vehicles have moved over all the designated measurement points. Then the blind source separation technique is employed to extract the fundamental mode shape of the bridge and the improved direct stiffness method is adopted to estimate the bridge element stiffness based on the collected data, which are used to monitor the health of the bridge structure and to maintain structure safety and natural symmetry. The proposed method only requires the output response of the vehicle due to the involvement of the blind separation technique. In addition, the proposed method can overcome the adverse effect of road surface roughness because the vehicles only move between two measurements and they stay at rest during one measurement. Numerical simulation was conducted to validate the proposed method, and the effect of various factors such as bridge damping ratio and measurement noise was investigated. Field measurement on Min-Xie bridge in Chongqing city was also carried out to further investigate the feasibility of the proposed method and showed that it can perform well in extracting the fundamental mode shape and evaluating bridge element stiffness.

1. Introduction

Nowadays, China has a large number of urban highway bridges, but the focus on development scale and lack of symmetrical thinking has led to an increase in the probability of structural disasters. Therefore, it is necessary to monitor the health of bridge structures for the purposes of disaster prevention and mitigation and structural symmetry [1,2,3,4].
Modal shape-based structural health monitoring (SHM) methods for bridges are commonly used [5]. However, the traditional direct method to identify a bridge mode shape usually requires many sensors installed on the bridge to measure the dynamic response of the bridge directly, which is costly and inconvenient in practical application [6]. The indirect approach of identifying bridge dynamic properties by a passing vehicle has attracted much attention in recent years since it only requires a single sensor installed on the vehicle which indirectly measures the dynamic response of the bridge.
At present, the research on identification of bridge dynamic properties using a passing vehicle mainly focuses on identification of frequency, mode shape, and damping [7]. Yang et al. [8] first proposed the indirect approach to extract the fundamental frequency of a bridge by using the vertical acceleration of a passing vehicle. They also [9] noted that road surface roughness can adversely affect frequency identification, and proposed using two identical vehicles to reduce the adverse effect. Inspired by the above ideas, Nagayama et al. [10] used the vertical acceleration of the front and rear wheels of a passenger vehicle to evaluate the fundamental frequency of bridges, and the field measurement showed that the influence of road surface roughness could be reduced. Yang et al. [11] analyzed the dynamic response of the vehicle in the stationary state, and found more bridge frequencies can be obtained by a stationary vehicle than by a passing vehicle. Gonzalez et al. [12] proposed a method to identify the bridge damping ratio by using a simplified semi-vehicle model, and validated it by numerical simulation. Similarly, Yang et al. [13] also investigated the feasibility of the Hilbert transform to obtain the damping ratio of the bridge by using a simplified numerical model. Tan et al. [14] extracted bridge damping using a single sensor-mounted inspection vehicle, where the vibration pattern of the bridge should be known in advance. To identify the mode shapes of the bridge, Zhang et al. [15] applied the short-time Fourier transform (STFT) on the acceleration of a passing vehicle equipped with an exciter to extract the bridge mode shapes. Yang et al. [16] employed bandpass filtering to obtain the bridge response from the vehicle acceleration, and used Hilbert transform to extract the instantaneous amplitude of the response and thus construct the bridge mode shape. Malekjafarian et al. [17] found that the amplitude of the signal contains information on the operational deflection shape that can be used to estimate the bridge mode shapes. Xu et al. [18] used the sparse component analysis method to analyze the non-stationary signals caused by heavy truck loads and to capture the vibration pattern and vibration frequency variation of the bridge. Devriendt et al. [19,20] used transmissibility to identify modal parameters, and proved that the transmissibility of response at the system poles is equal to the ratio of the modal vibrations at the two measurement points and independent to the nature of excitation and location of measurement points.
However, bridge damage identification is the ultimate purpose of bridge inspection and many researchers have used various methods to identify damage in bridge structures [21]. Zhang et al. used wavelet transform denoising and reconstruction technology and a cross-correlation function, to identify local damage in bridge structures [22]. Mei et al. [23] proposed a damage identification method based on Mel-frequency cepstral coefficients and principal component analysis of a large amount of collected data. Yang et al. [24] proposed a method to extract bridge frequencies and mode shapes and evaluate the bridge element stiffness, where two identical single-axis test trailers were used and the effect of vehicle speed, ambient noise, and road surface roughness were discussed. Zhang et al. [25] used instantaneous amplitude squared (IAS) to identify the location and severity of the damage and validated it with a simplified numerical model. Yang et al. [26] used 2D and 3D finite element (FE) models of bridge vehicle interaction (VBI) to propose a new STFT energy spectrum method for bridge damage identification. Pourzeynali [27] proposed a method based on the Newmark-β explicit method for simultaneous identification of moving loads and structural damage, where numerical simulations and experimental results verified that the method can effectively identify bridge damage. Yang et al. [28,29] proposed a new indirect measurement method using two stationary single-axis test vehicles to collect accelerations synchronously, which overcame the influence of bridge deck roughness and successfully identified the bridge damage. However, the accuracy of the bridge modal vibration pattern extracted by the transfer rate method under a certain noise level is still insufficient, which hinders the promotion and application of the new indirect measurement method.
Blind source separation refers to the analysis of the unobserved original signal from multiple observed mixed signals, and is an important component in blind signal processing [30,31]. The blind source separation technique can be used for structural modal analysis, which firstly decomposes the structural response into modal responses, then completes the conversion of the structural dynamic response from physical space to modal space, and finally determines the modal vibration pattern in the process of conversion. Qin et al. [32] presented a new sparse component analysis (SCA) method for operational modal analysis (OMA), which explores the sparse representations in the time frequency domain to perform output-only modal identification. Numerical simulation and experimental verification demonstrated the good performance of the proposed method. Martinez et al. [33] proposed a modal identification method based on principle components analysis (PCA) and blind source separation from a video with removed or corrupted frames, which can separate displacements in a wide frequency band into individual modal coordinates and extract the modal parameters from a randomly re-sampled video.
In this study, an optimized method to identify the girder bridge element stiffness is proposed based on the vehicle–bridge interaction (VBI) theory, where a new indirect approach [34] and blind source separation techniques [35] have been adopted. Both numerical simulation and field measurement have been conducted to validate the proposed method, and the effect of the bridge damping ratio and measurement noise on the proposed method has been investigated. The paper is organized as follows: Section 2 introduces the theory of the proposed method including the VBI system and blind source separation techniques; Section 3 shows the verification of the proposed method by numerical simulation and parametric study; Section 4 presents the field measurement; and Section 5 concludes the observations and findings.

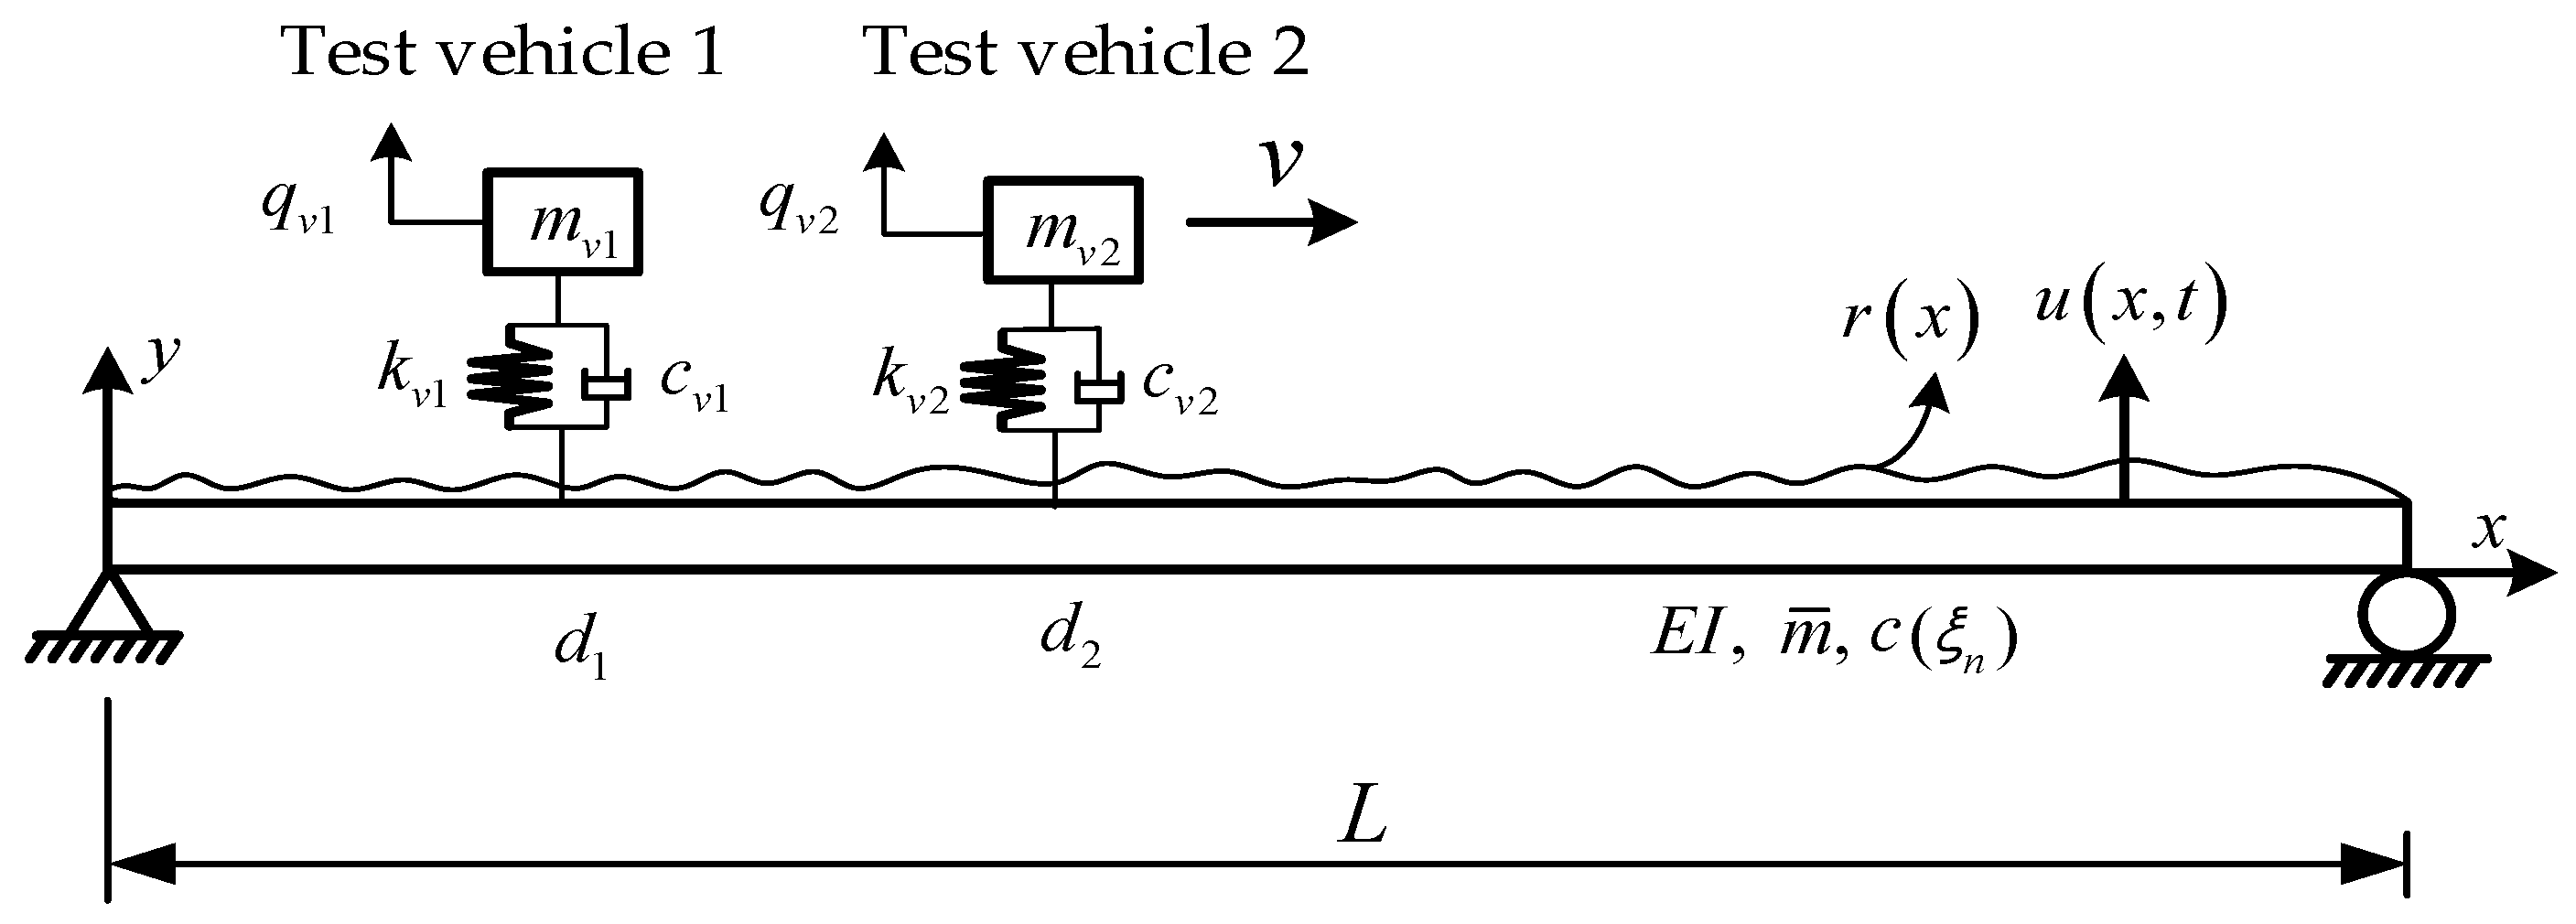
2. Theory of Vehicle–Bridge Interaction

Figure 1 shows a simplified model of two movable vehicles staying at rest on a simply-supported bridge. The two vehicles are modeled as two masses, m v 1 and m v 2 , supported by two springs with the stiffness of k v 1 and k v 2 and damping of c v 1 and c v 2 , respectively. The bridge is simplified as a Euler beam with bending stiffness of E I , length of L , mass per unit of m , damping of c , and road surface roughness of r x . In this study, the vehicles and the bridge deck are assumed to be in permanent contact. It is also assumed that the mass ratio between the vehicle and the bridge is negligible. Many researchers have modeled the axle coupling as a multi-degree-of-freedom system to make it more realistic [36,37], but it leads to a large number of formulae derivations. Although the model shown in Figure 1 is simplified, it can still reveal the basic physical phenomena of VBI very well [6,9].
The equations of motion of the bridge and vehicles can be written as:
m u ¨ b x , t + c u ˙ b x , t + E I u b x , t = f c t δ x v t
m v i q ¨ v i t + c v i q ˙ v i t u ˙ b x , t + k v i q v i t u b x , t = 0
where i = 1 , 2 denotes Vehicle 1 and Vehicle 2, ( ˙ ) is the first derivative of ( ) with respect to time t; ( ¨ ) is the second derivative of ( ) with respect to time t; ( )’’’’ is the fourth partial derivative of ( ) with respect to location x , q v i is the vertical displacement of the ith vehicle; u b is the vertical displacement of the bridge, f c is the external excitation, and δ is the Dirac delta function.
By using the modal superposition method, the bridge vertical displacement can be expressed as:
u b x , t = φ j x q j t
where φ j = sin j π x / L is the jth mode shape of the bridge, and q j is the corresponding modal coordinate.
Then Equation (2) can be re-written as:
u ˙ b x , t | x = d i + k v i c v i u b x , t | x = d i = m v i c v i q ¨ v i t + q ˙ v i t + k v i c v i q v i t i = 1 , 2
where q ˙ v i and q v i can be obtained by integrating q ¨ v i once and twice.
It is worth noting that the vertical acceleration collected in practice is usually polluted by noise, therefore, the multi-point averaging and smoothing technique, which is a common signal denoising process in civil engineering, is adopted to filter measurement noise.

3. Methodology of Blind Source Separation
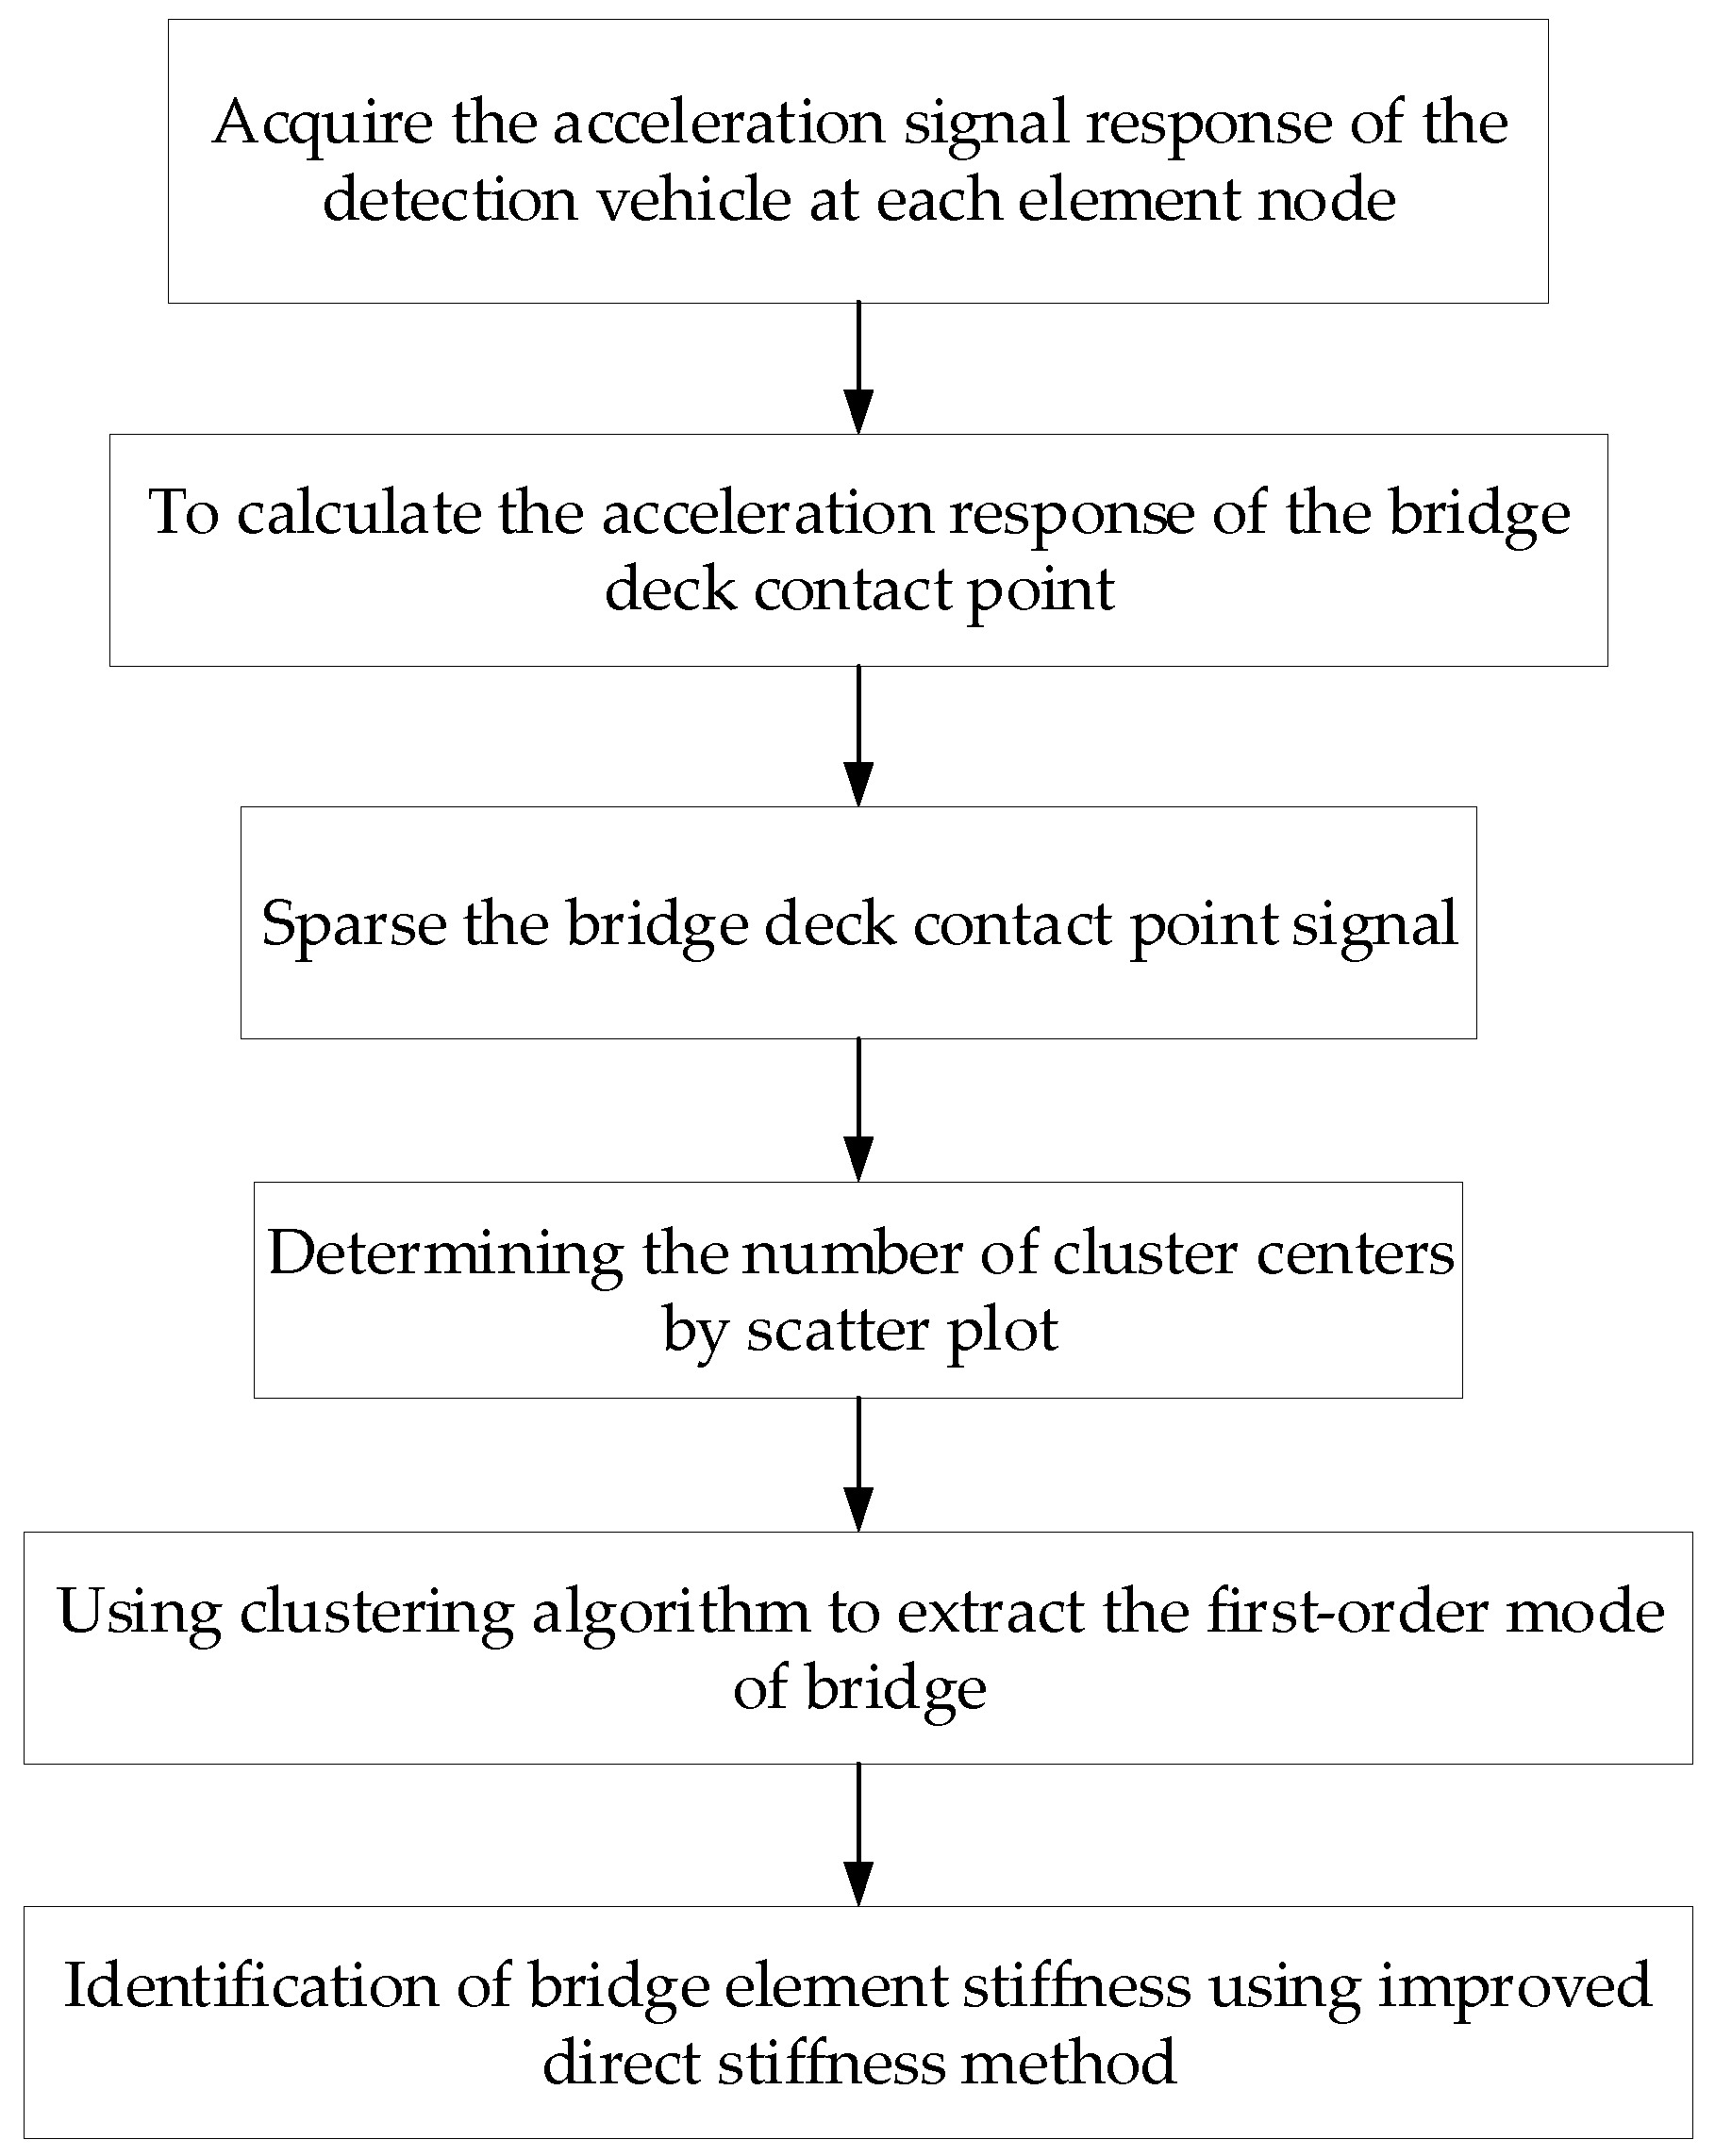
Sadhu et al. [38] have applied the blind source separation method to vibration analysis, showing that it is beneficial for bridge inspection by using the dynamic response of the VBI system because it requires less prior knowledge of the source signal as well as system characteristics. Therefore, the blind source separation technique is used to extract the vibration pattern of the contact point on the bridge in this study. Although the ultimate purpose is to evaluate the bridge element stiffness, the method to calculate bridge element stiffness by using the bridge fundamental mode shape was proposed previously; hence the main contribution of this study is to use blind source separation to obtain the fundamental mode shape of bridge.
The response vector of the contact points, U t , is defined as:
U t = [ u b x , t | x = d 1 u b x , t | x = d 2 ] T
where u b can be obtained by integrating Equation (4) as
u b x , t | x = d i = C e k v i c v i d t + e k v i c v i d t [ m v i c v i q ¨ v i t + q ˙ v i t + k v i c v i q v i t ] e k v i c v i d t d t             i = 1 , 2
By using the blind source separation method, the response vector of the contact points can be rewritten as:
U t = Q t ψ + n t
where ψ denotes the mode shape matrix, the ith column in the matrix ψ represents the ith mode shape of the bridge, n t is the noise, and Q t is the source signal which indicates the oscillation response:
Q t = [ q 1 t q 2 t   q n t ] T
Neglecting the effect of noise and applying STFT on both sides of Equation (7), it becomes:
U t , f = ψ Q t , f
where
U t , f = u b x , t , f x = d 1   u b x , t , f x = d 2 T
Q t , f = q 1 t , f   q 2 t , f q n t , f T  
are the vertical acceleration response vector at the contact point in the frequency domain and the short-time Fourier transform coefficient of the vibration response at frequency f and time t , and
u b x , t , f x = d i = φ i 1 q 1 t , f + φ i 2 q 2 t , f + + φ i n q n t , f i = 1 , 2
is the time-frequency coefficient of u ¨ b x , t x = d i .
Since U t , f is sparse, hence there exists only one certain order of mode oscillation response with non-zero or relatively large time-frequency coefficients at a certain time-frequency point t 1 , f 1 . At this point, Equation (12) can be approximated as
u b x , t , f x = d i = φ i 1 q 1 t 1 , f 1 i = 1 , 2
When the two sets of measurements are obtained, a scatter plot can be drawn, as shown in Figure 2. Then the points on the scatter plot can be mirrored in the upper half-unit circle by Equation (14),
U ˜ t k , f k = U t k , f k U t k , f k , U t k , f k 0 U t k , f k U t k , f k , U t k , f k < 0
where U t k , f k is the time-frequency coefficient of U t and U ˜ t k , f k is the time-frequency coefficient after mirroring to the unit circle. Figure 3 shows the mirrored scatter plot of Figure 2. Using the angular relationship from the mirrored data to the center of the unit circle, the number of clustering centers can be determined under condition without human influence.
After obtaining the normalized scatter plot, the angle of each data point to the center of the circle can be used for classification [39]. It is observed from Figure 3 that the semicircle is divided into several intervals, and each interval has a certain number of points. The number of points in the interval where the cluster center [40] is located is greater than the number of points in the interval without a cluster center. Therefore, a discrete probability curve can be obtained by calculating the ratio of the number of points in each interval. After smoothing the curve, the number of peaks of the probability curve can be considered as the number of clustering centers [41].
After determining the number of clustering centers, the clustering is performed by sparse data to estimate the confusion matrix, where the confusion matrix is equivalent to the mode shape matrix. However, when clustering is used to estimate the mixing matrix, disjoint source signals in the transform leads to poor evaluation performance, so a single source point is used to improve the evaluation accuracy. In practice, a point on the time-frequency plane of the mixed signal is considered as a single-source point if the difference between the absolute directions of the real and imaginary parts of the mixed-signal does not exceed a low threshold [42]. The single source point should satisfy the following equation:
Re U t , f T Im U t , f Re U t , f Im U t , f > cos Δ θ
where |∙| denotes the absolute value of the vector, ‖∙‖ denotes the 2-norm of the vector, and ∆θ is a pre-determined angle. The use of single-source points can effectively improve the accuracy of mode shape identification.
After obtaining the bridge vibration pattern, the symmetric extended vibration pattern is used to calculate the mode shape curvature of the side units [24], and the improved direct stiffness method [43] can be used to calculate the stiffness of each element of the bridge quickly. The stiffness of each element can be calculated as:
E I i = M i ϕ i
where E I i is the bending stiffness of element i , M i is the virtual bending moment acting on element i , and ϕ i is the curvature of the vibration pattern at element i .
The procedure of the bridge stiffness identification method based on the blind source separation technique is summarized as follows (Figure 4):
(1)
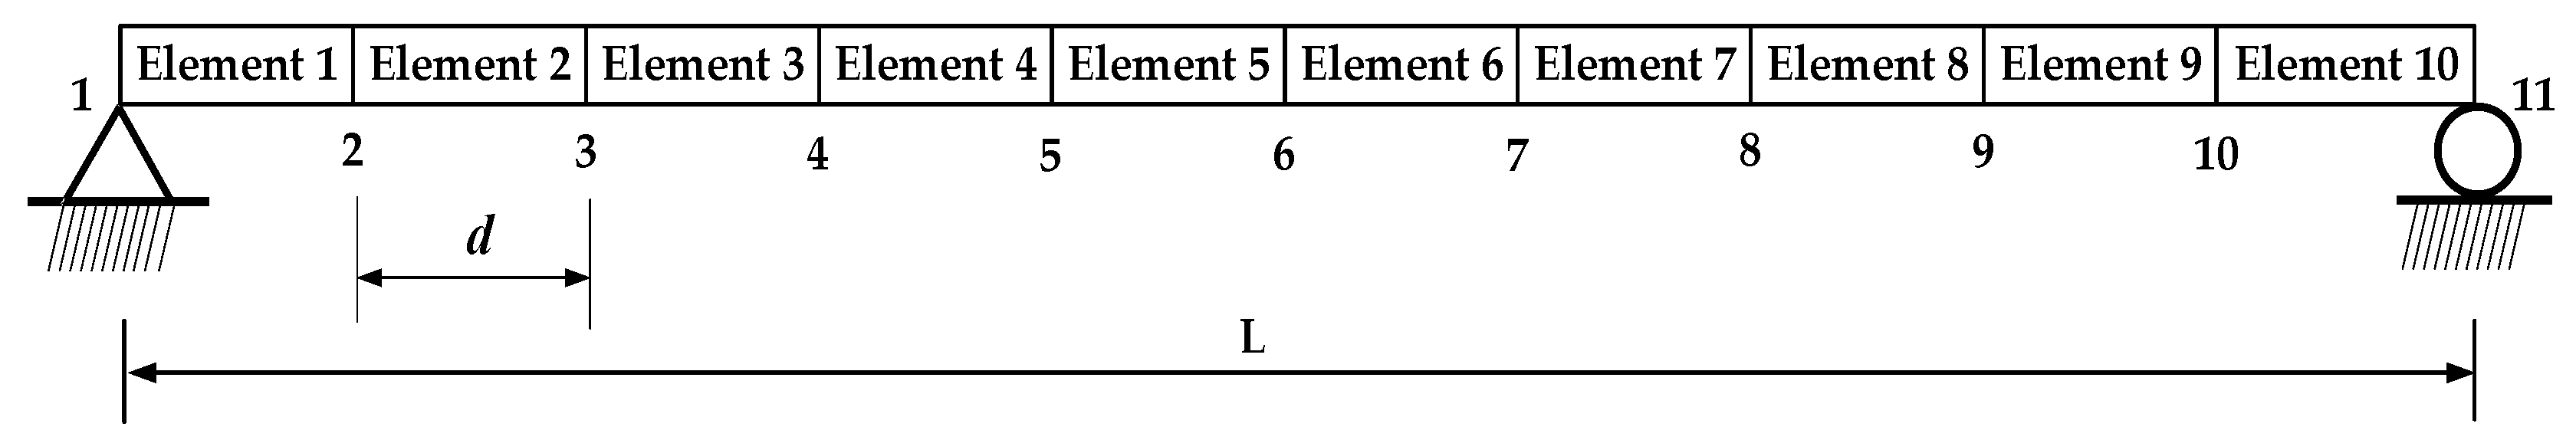
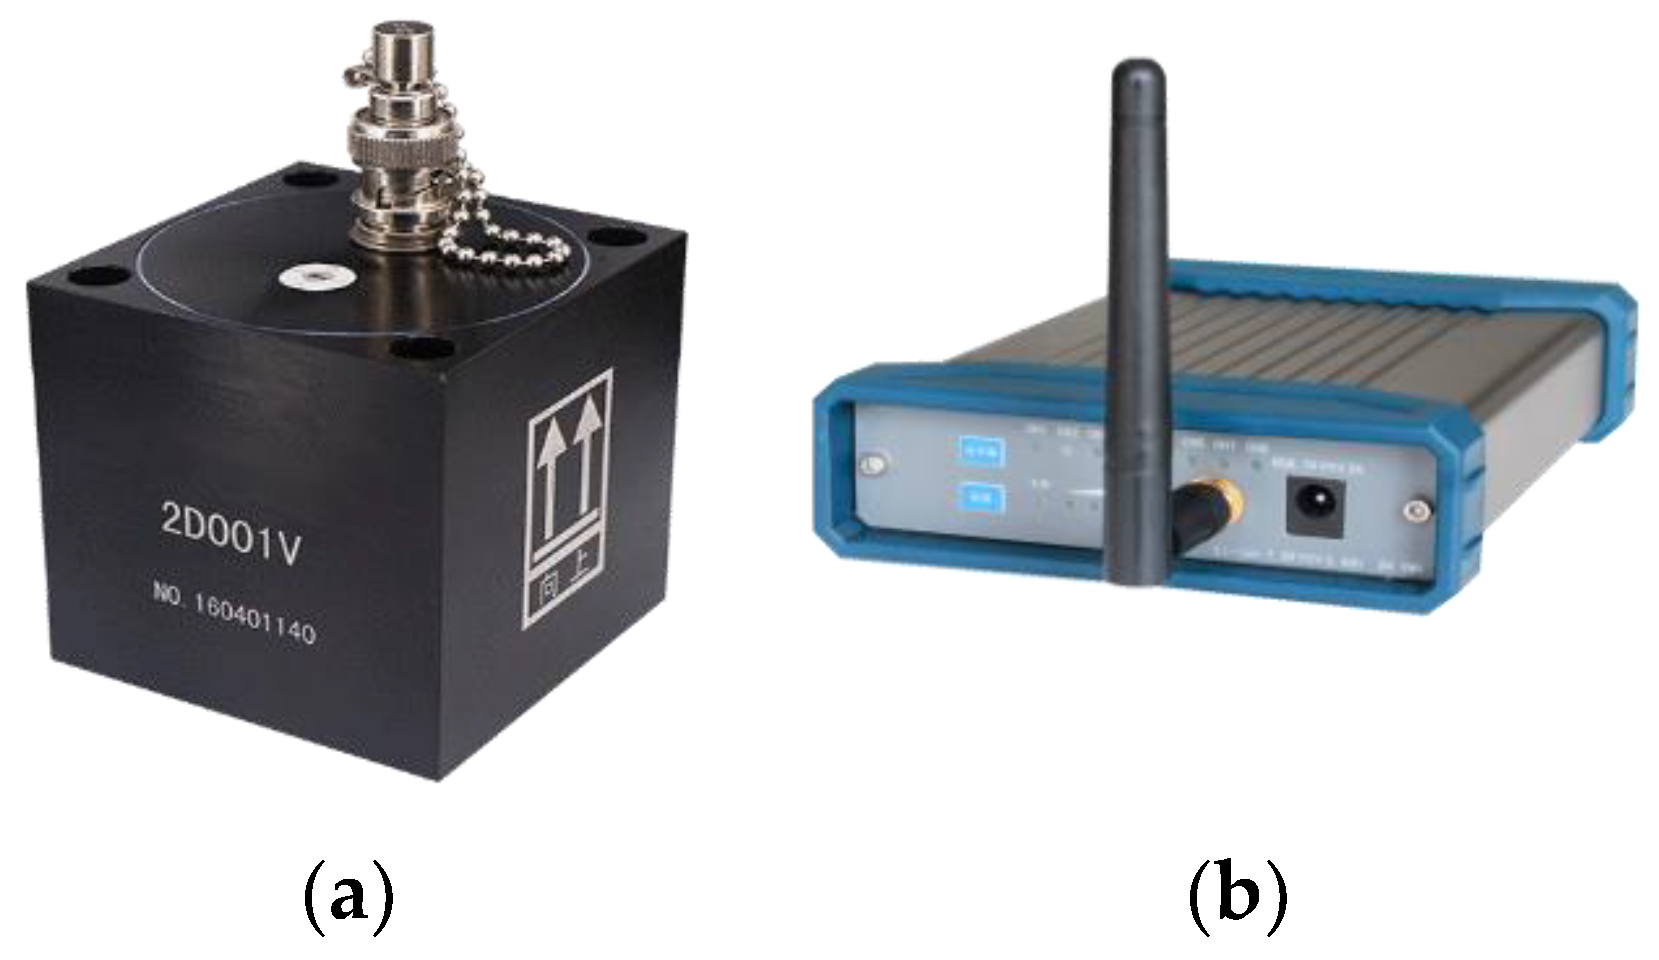
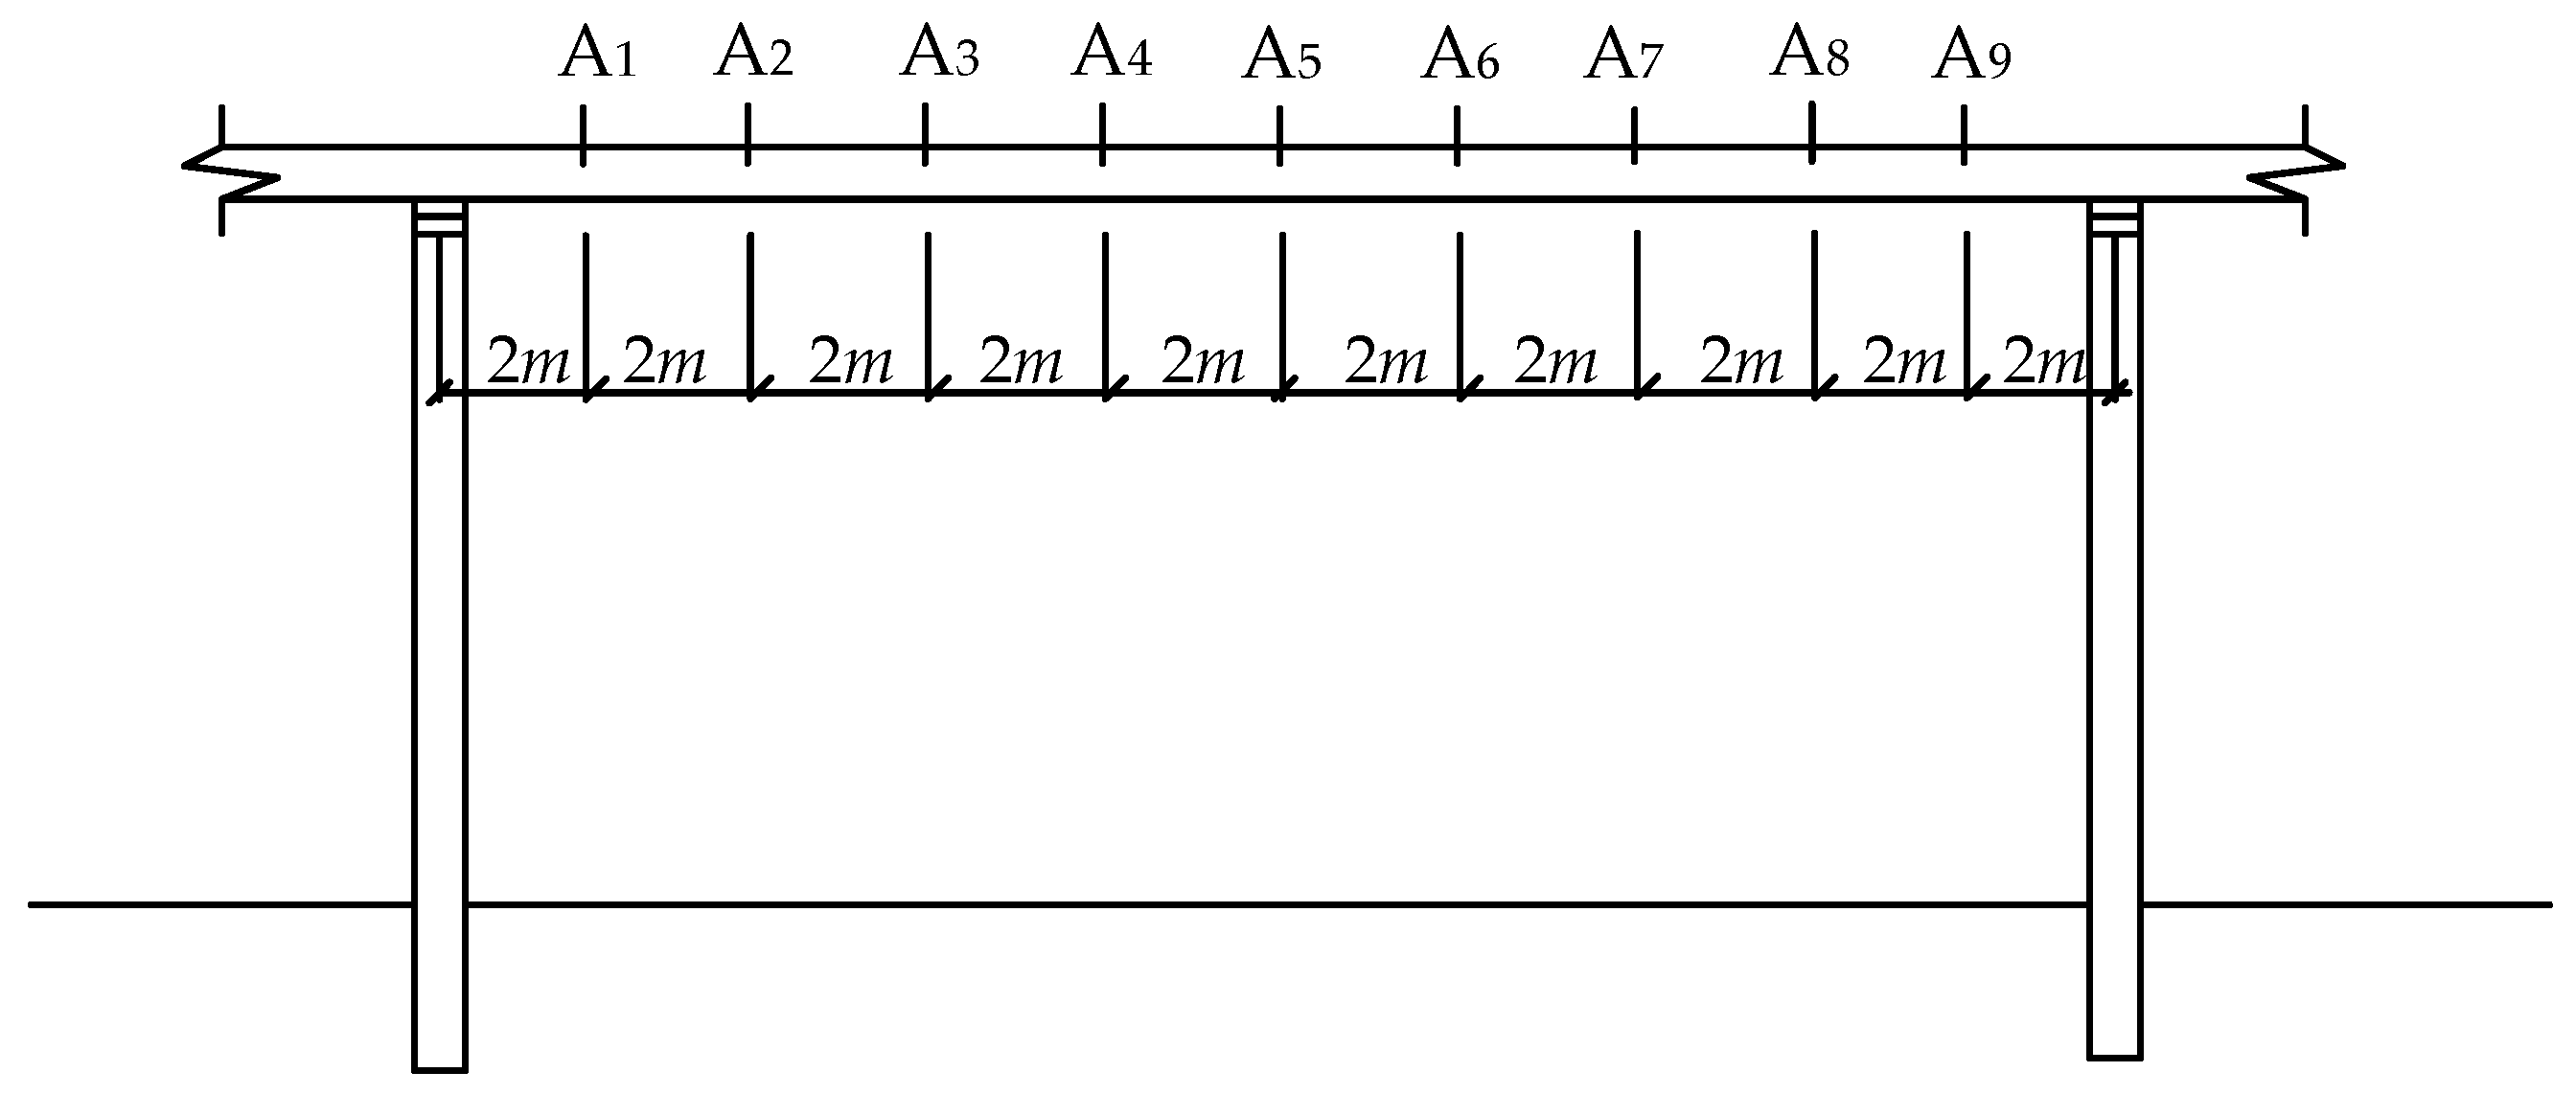
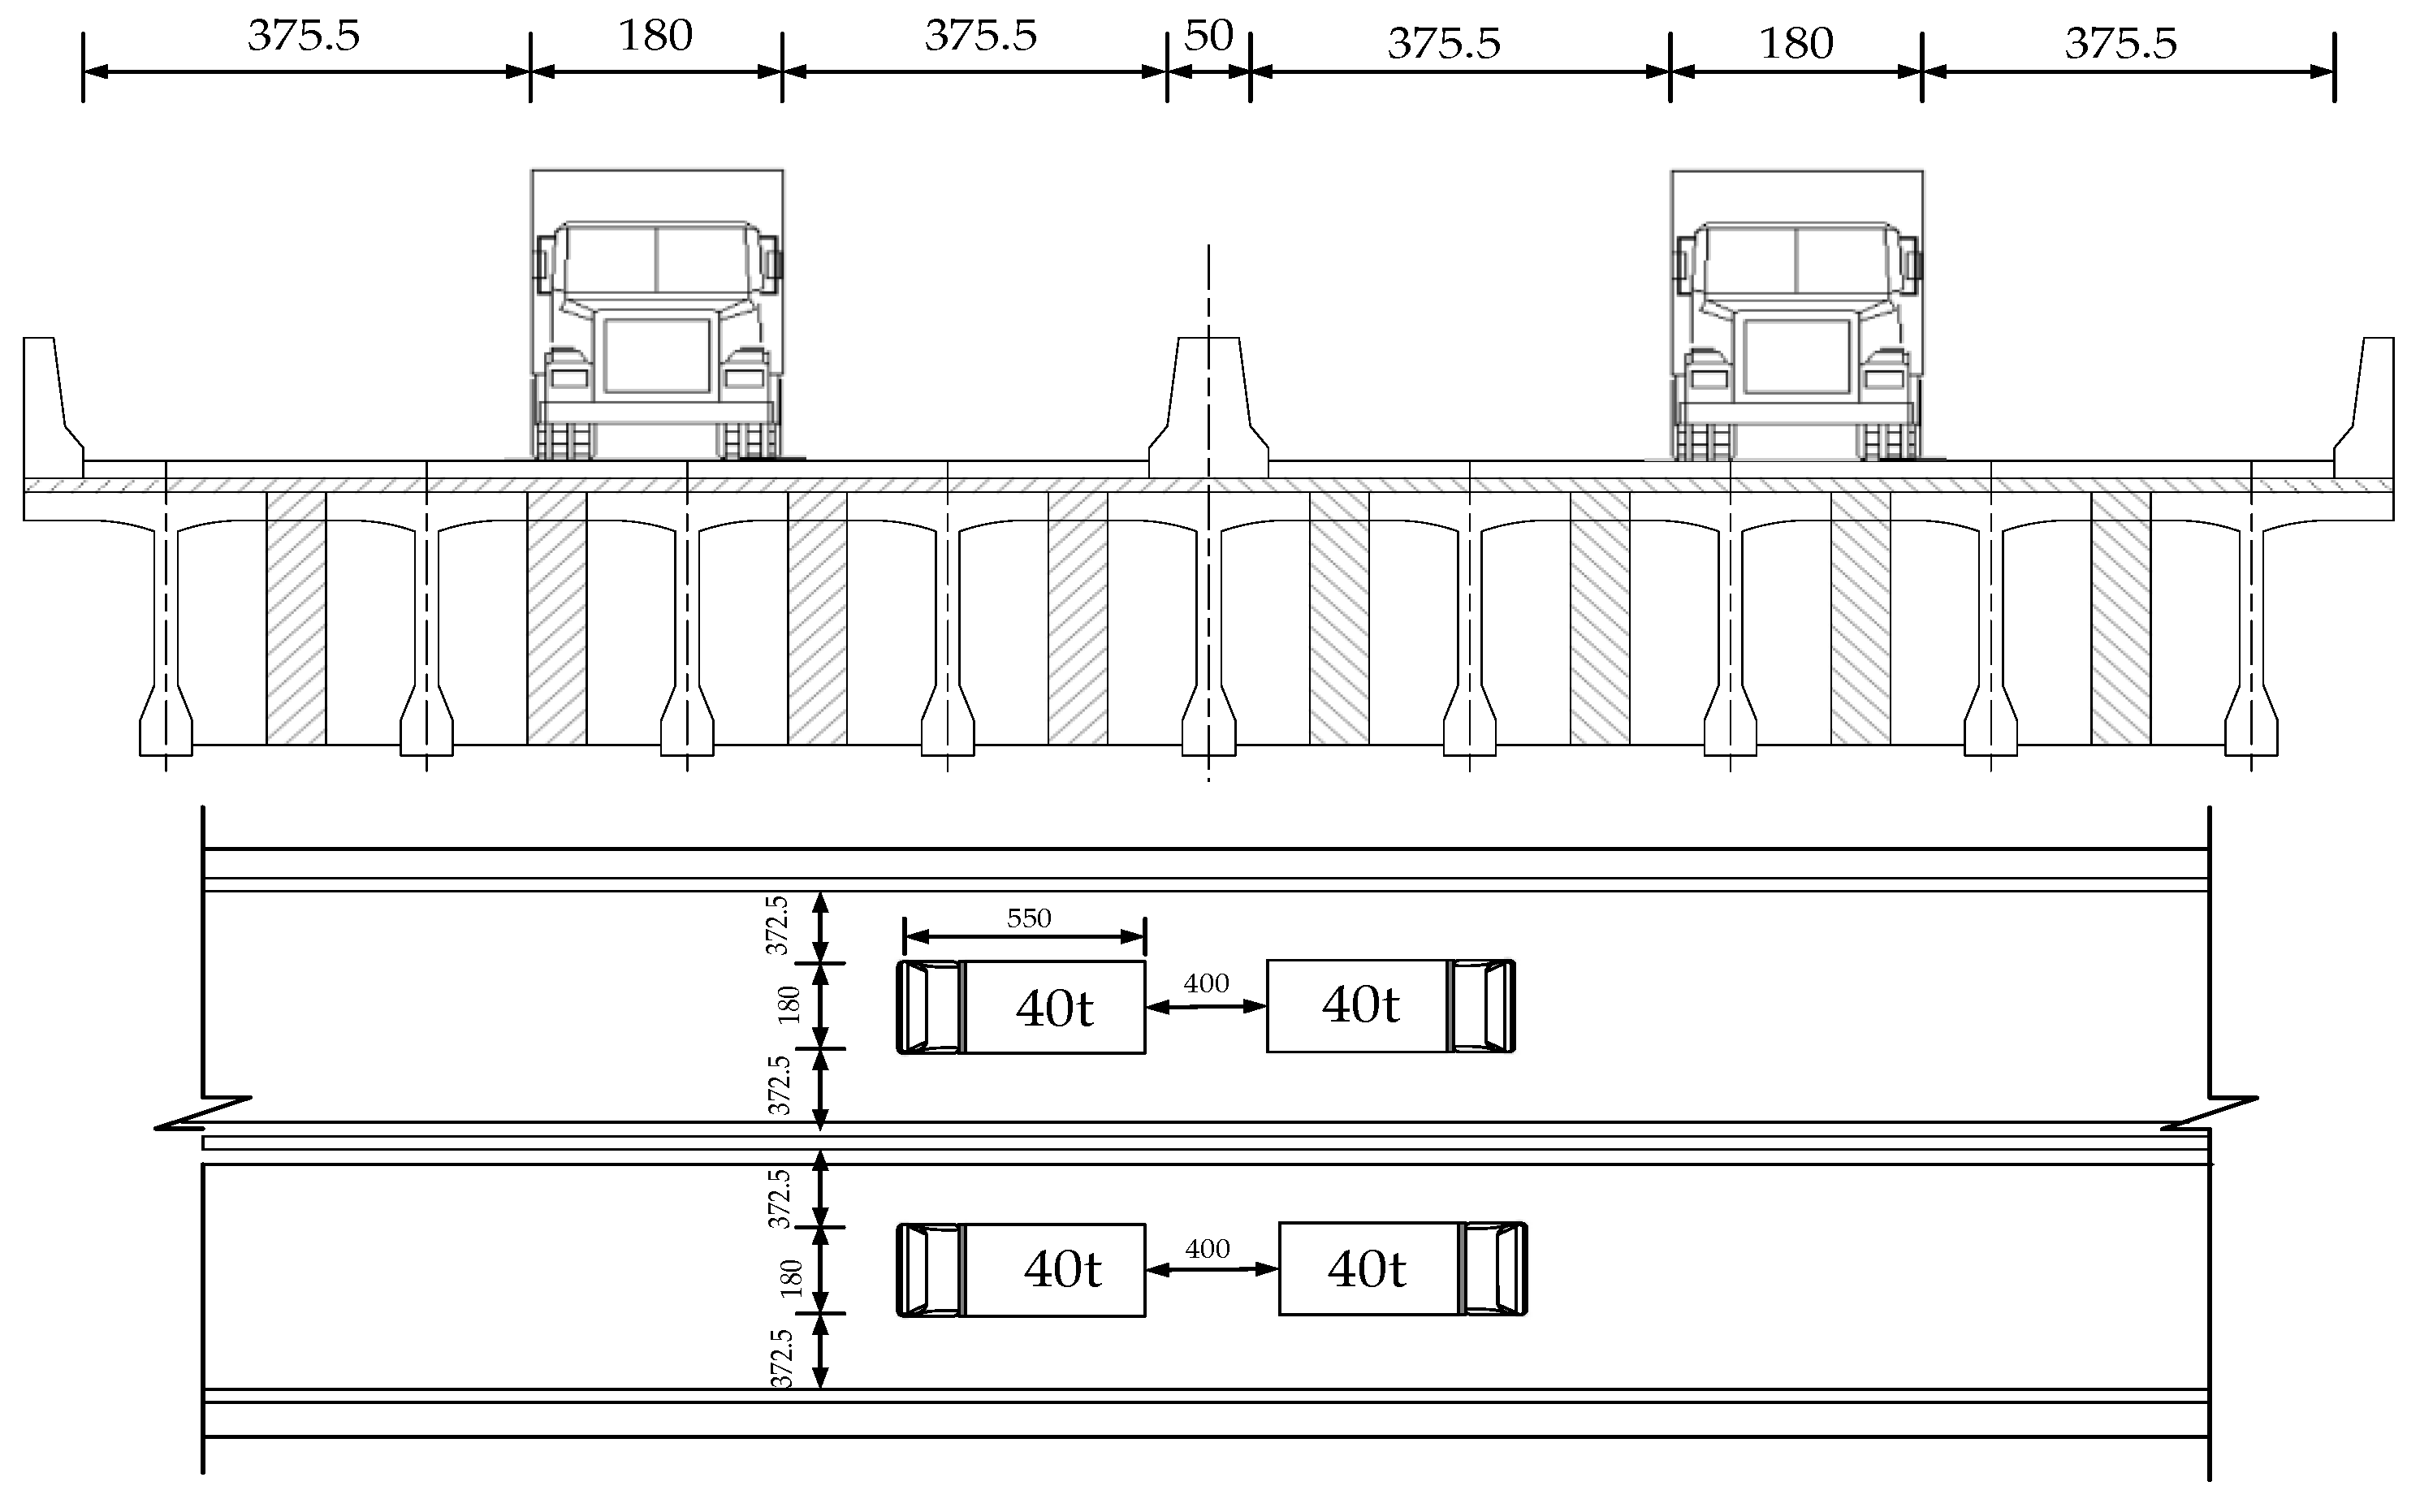
The bridge is uniformly divided into several elements, as shown in Figure 4, and two test vehicles move to the testing locations. The accelerations of the vehicles are collected and then the vehicles move to other locations. The raw signals are denoised by using the multi-point averaging and smoothing processing method.
(2)
Calculating the displacement of the bridge contact point from the collected acceleration of the movable vehicle.
(3)
Applying STFT to the displacement of the bridge contact point.
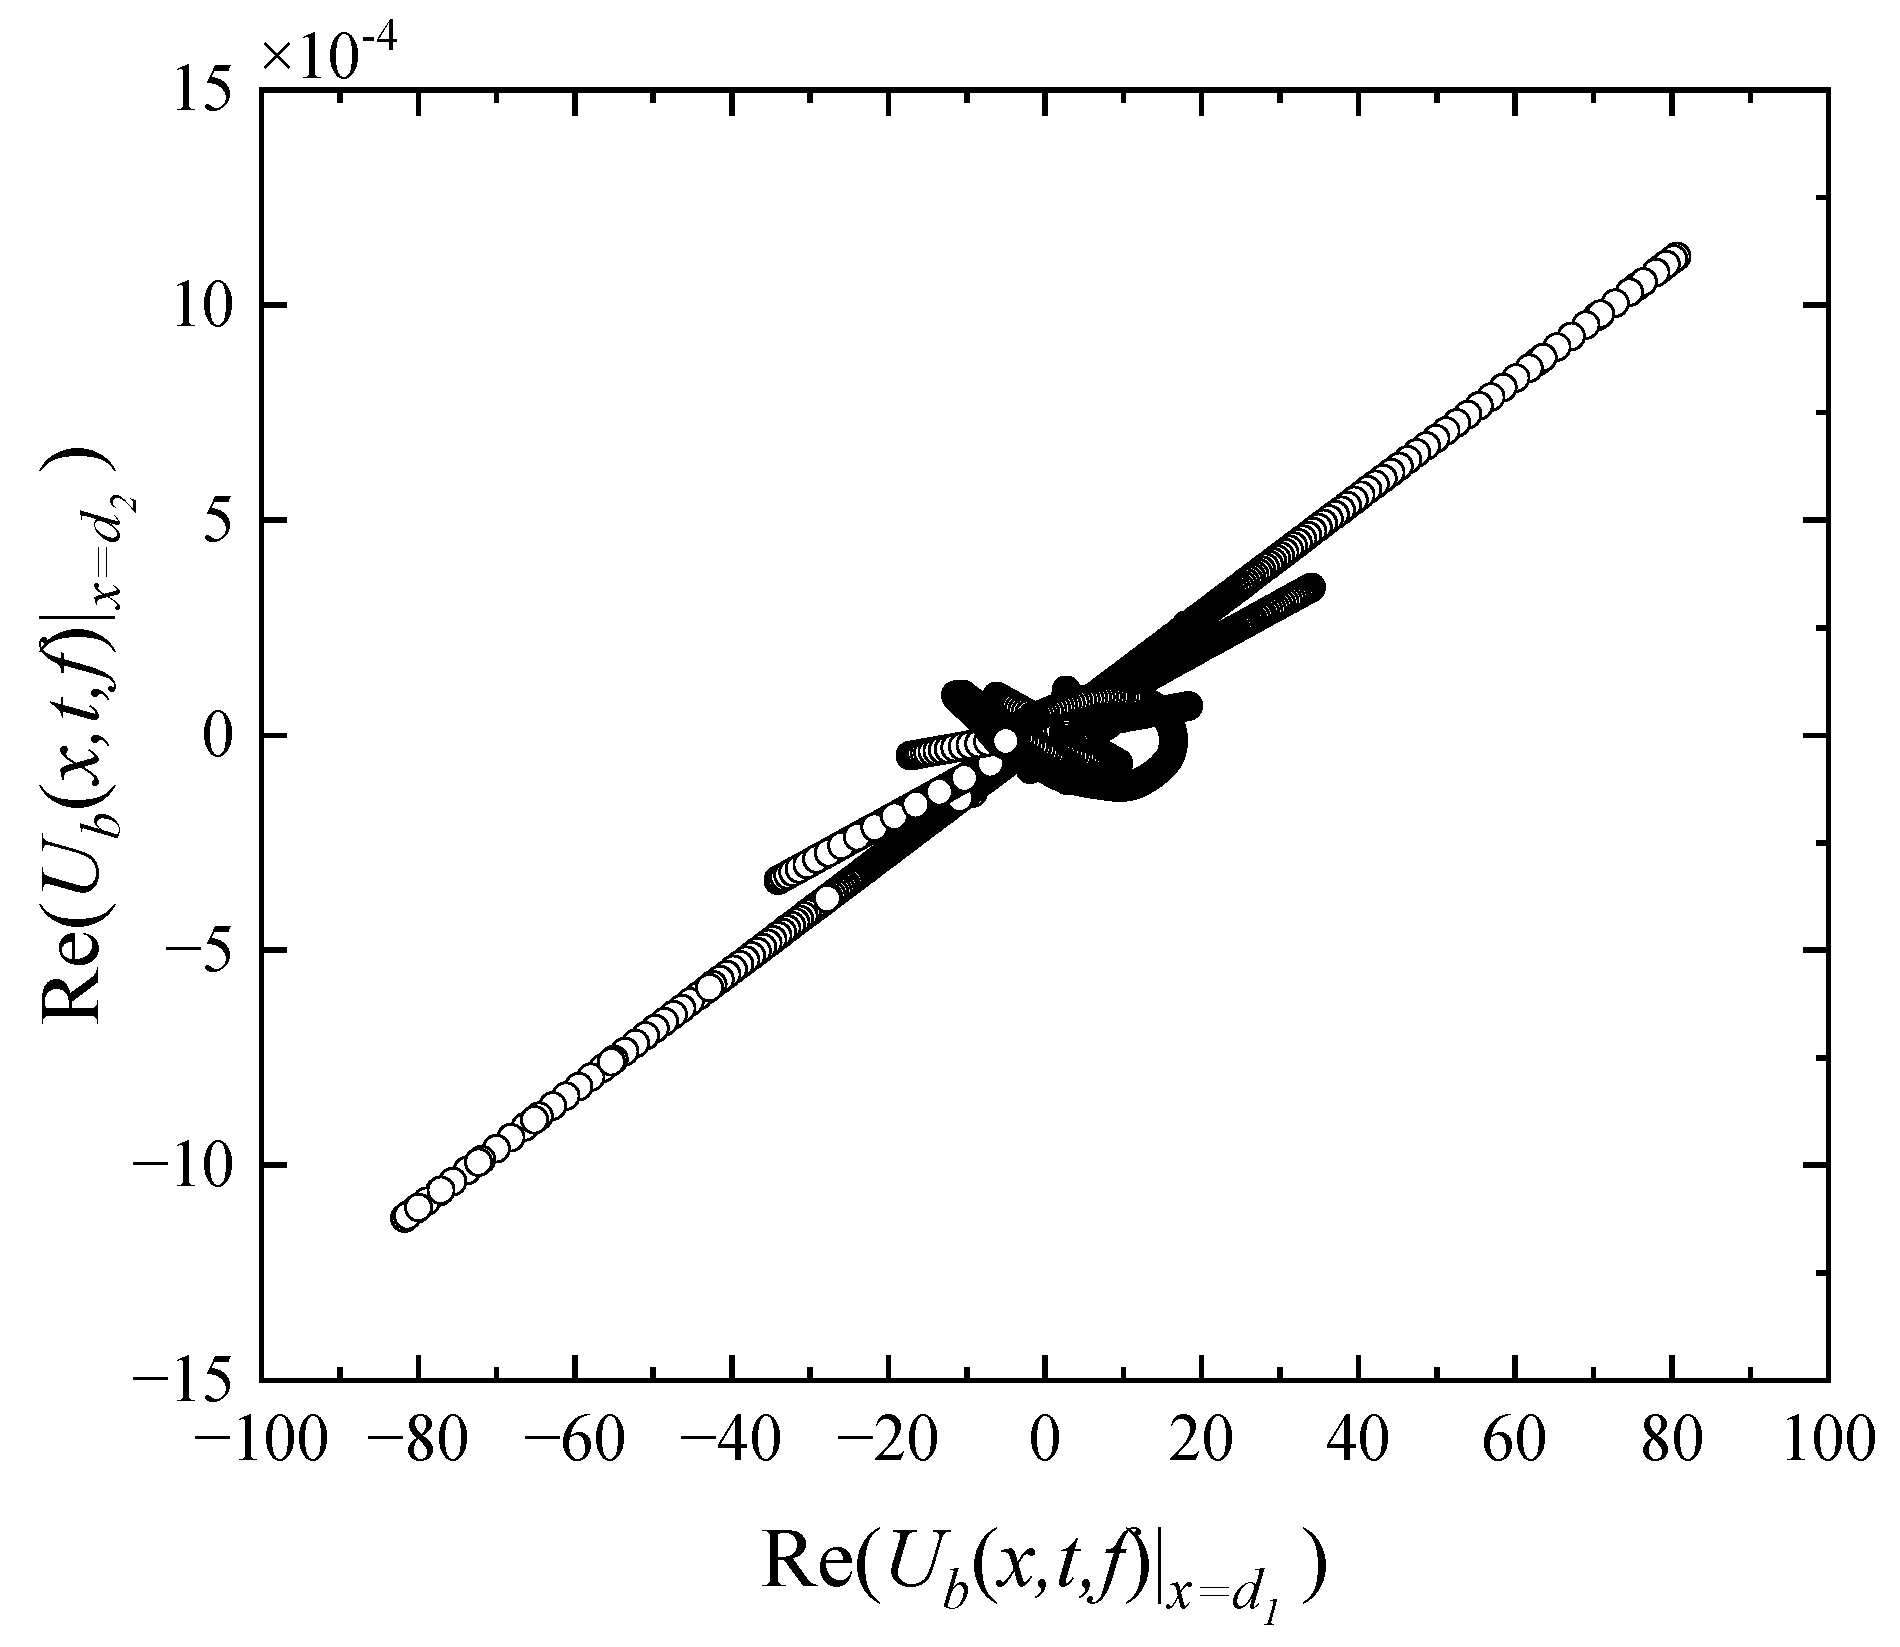
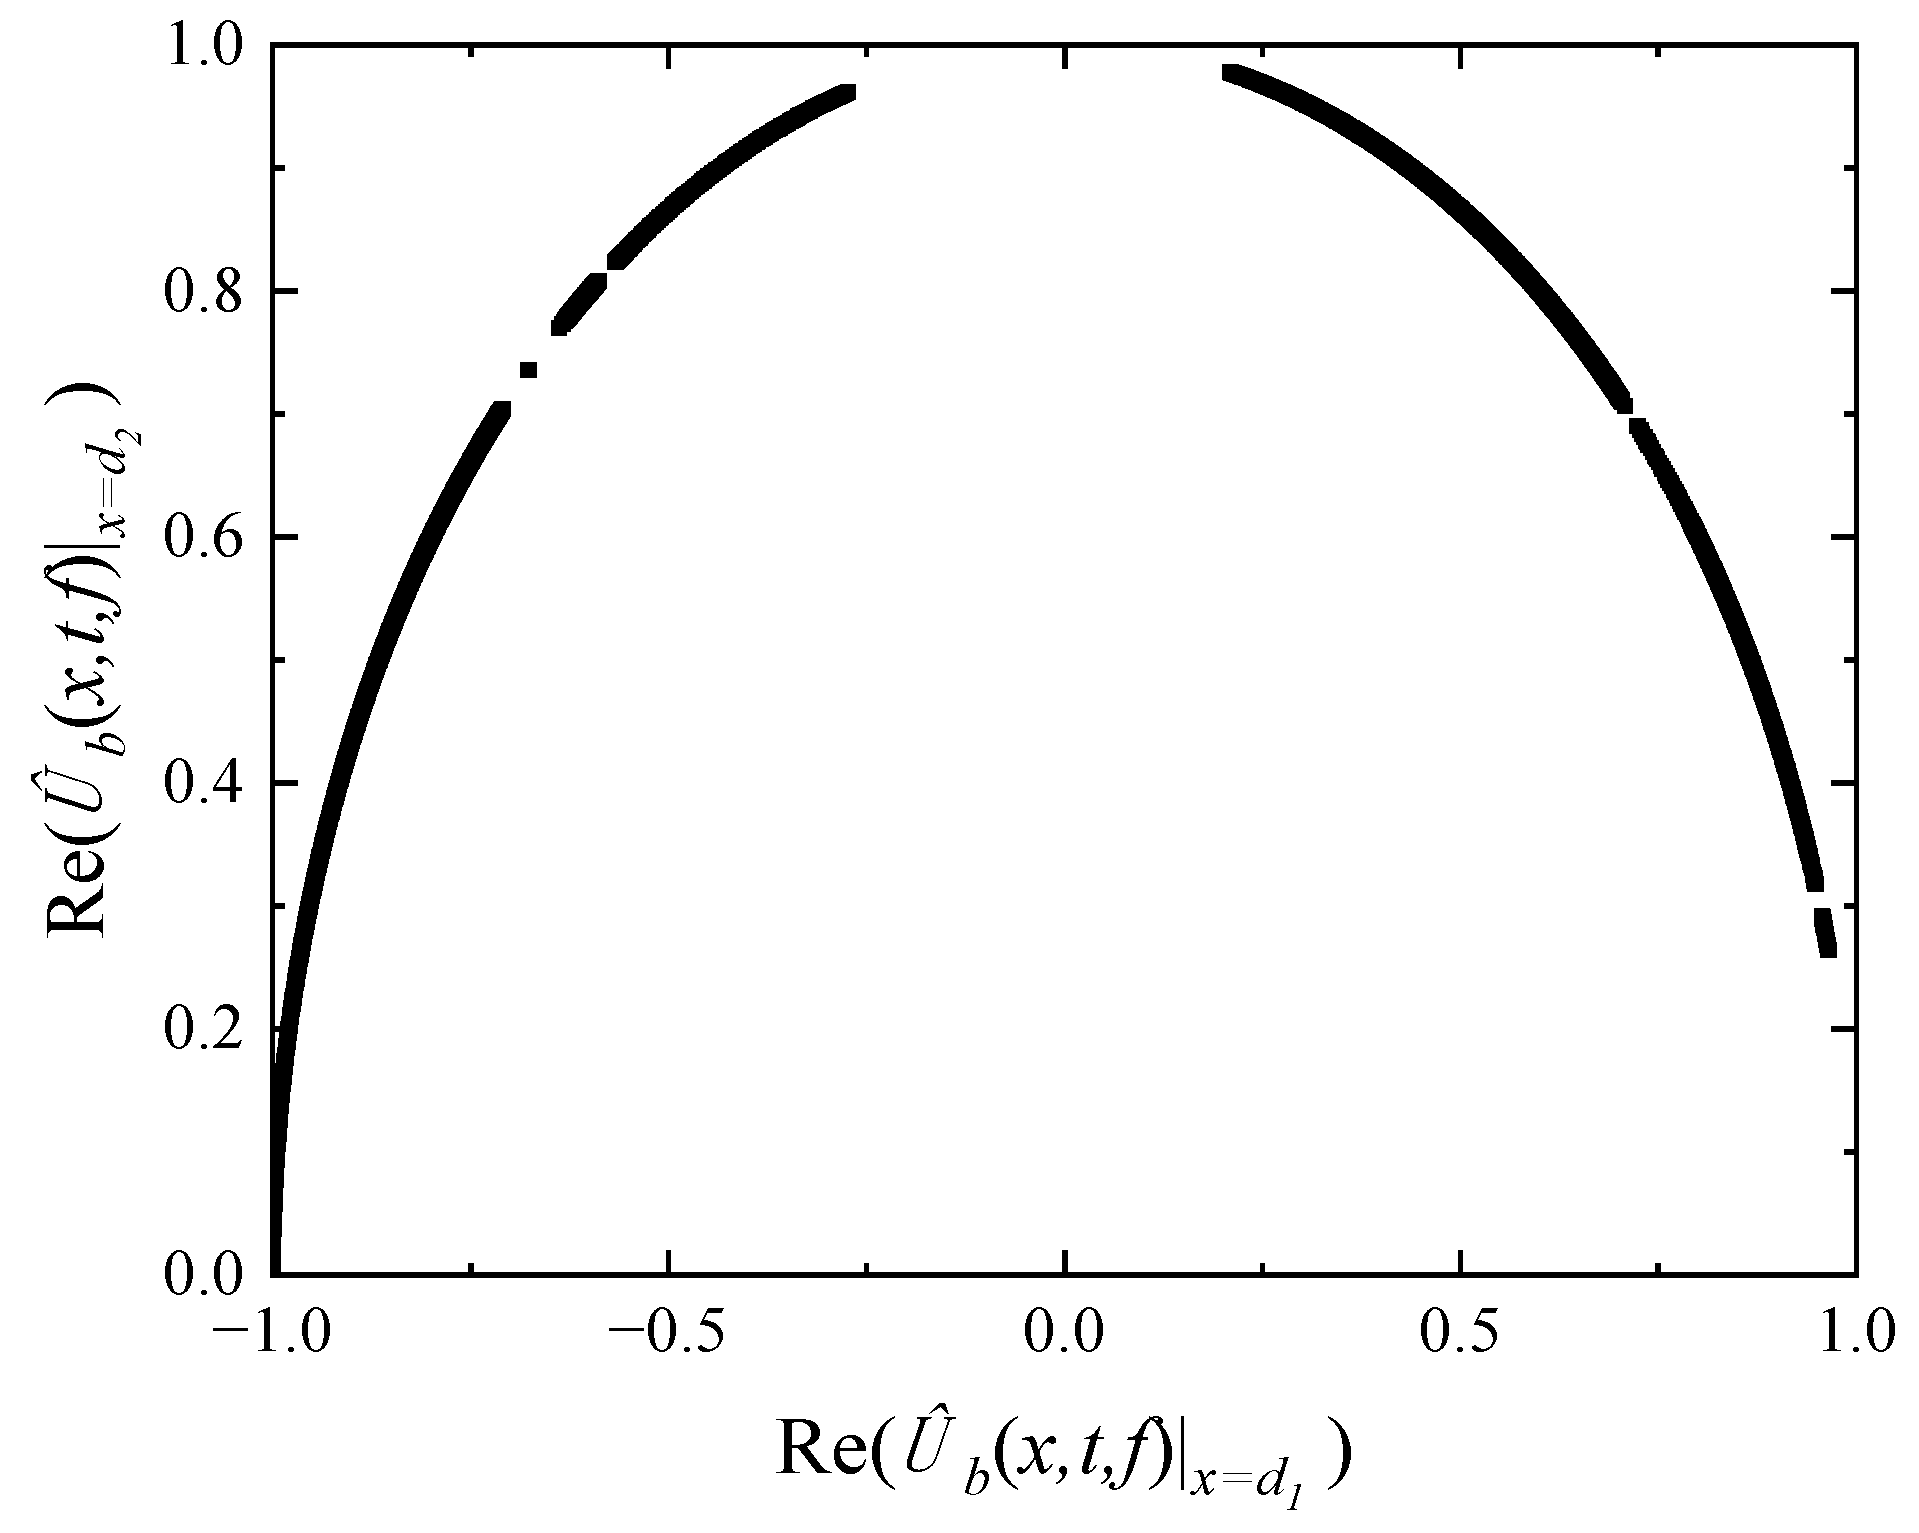
(4)
Plotting the two sets of measurements as a scatter plot and mirroring them to the upper half-unit circle to determine the number of clustering centers.
(5)
Extracting single source points from the sparse data and performing cluster analysis to obtain the fundamental mode shape of the bridge.
(6)
Employing the improved direct stiffness method to calculate the element stiffness of the bridge.

4. Numerical Simulation

In this study, an independent FE model is generated in ABAQUS to validate the proposed method. The identification results of different methods are compared, and then the effect of test vehicle performance, bridge damping ratio, measurement noise and external excitation variations is investigated. It should be noted that besides ABAQUS, ANSYS, LS-DYNA, and DIANA can also be used and the results show little difference.

4.1. FE Model

A simply supported girder bridge is discretized into 10 elements, as shown in Figure 5. The properties of the bridge are listed as follows: length L = 20 m, density ρ = 2400 kg/m3, Young’s modulus E = 34.5 GPa, moment of inertia I = 2.99 m4, cross-sectional area A = 8.45 m2 and damping ratio ξ = 0.4%. The length of the bridge element d = 2 m. The properties of the two test vehicles are assumed to be identical in this study, with mass mv1 = mv2 = 1470 kg, stiffness kv1 = kv2 = 524.076 kN/m, and damping cv1 = cv2 = 1000 Ns/m. The time step of analysis is 0.01 s. Thus, the bridge’s fundamental frequency is 8.86 Hz and the frequency of the two test vehicles is 3.00 Hz. Random traffic flow is simulated approximately by changing the number, entry time, mass, and speed of random passing vehicles; the parameters of the passing vehicles are shown in Table 1.
The two test vehicles stop at Node 2 and Node 3 first, and the accelerations of the two vehicles are collected for 30 s. Then they move to Node 3 and Node 4, and the accelerations are collected as well. After the two vehicles pass over the whole span, the fundamental mode shape and element stiffness can be obtained by following the procedures shown in Figure 4.

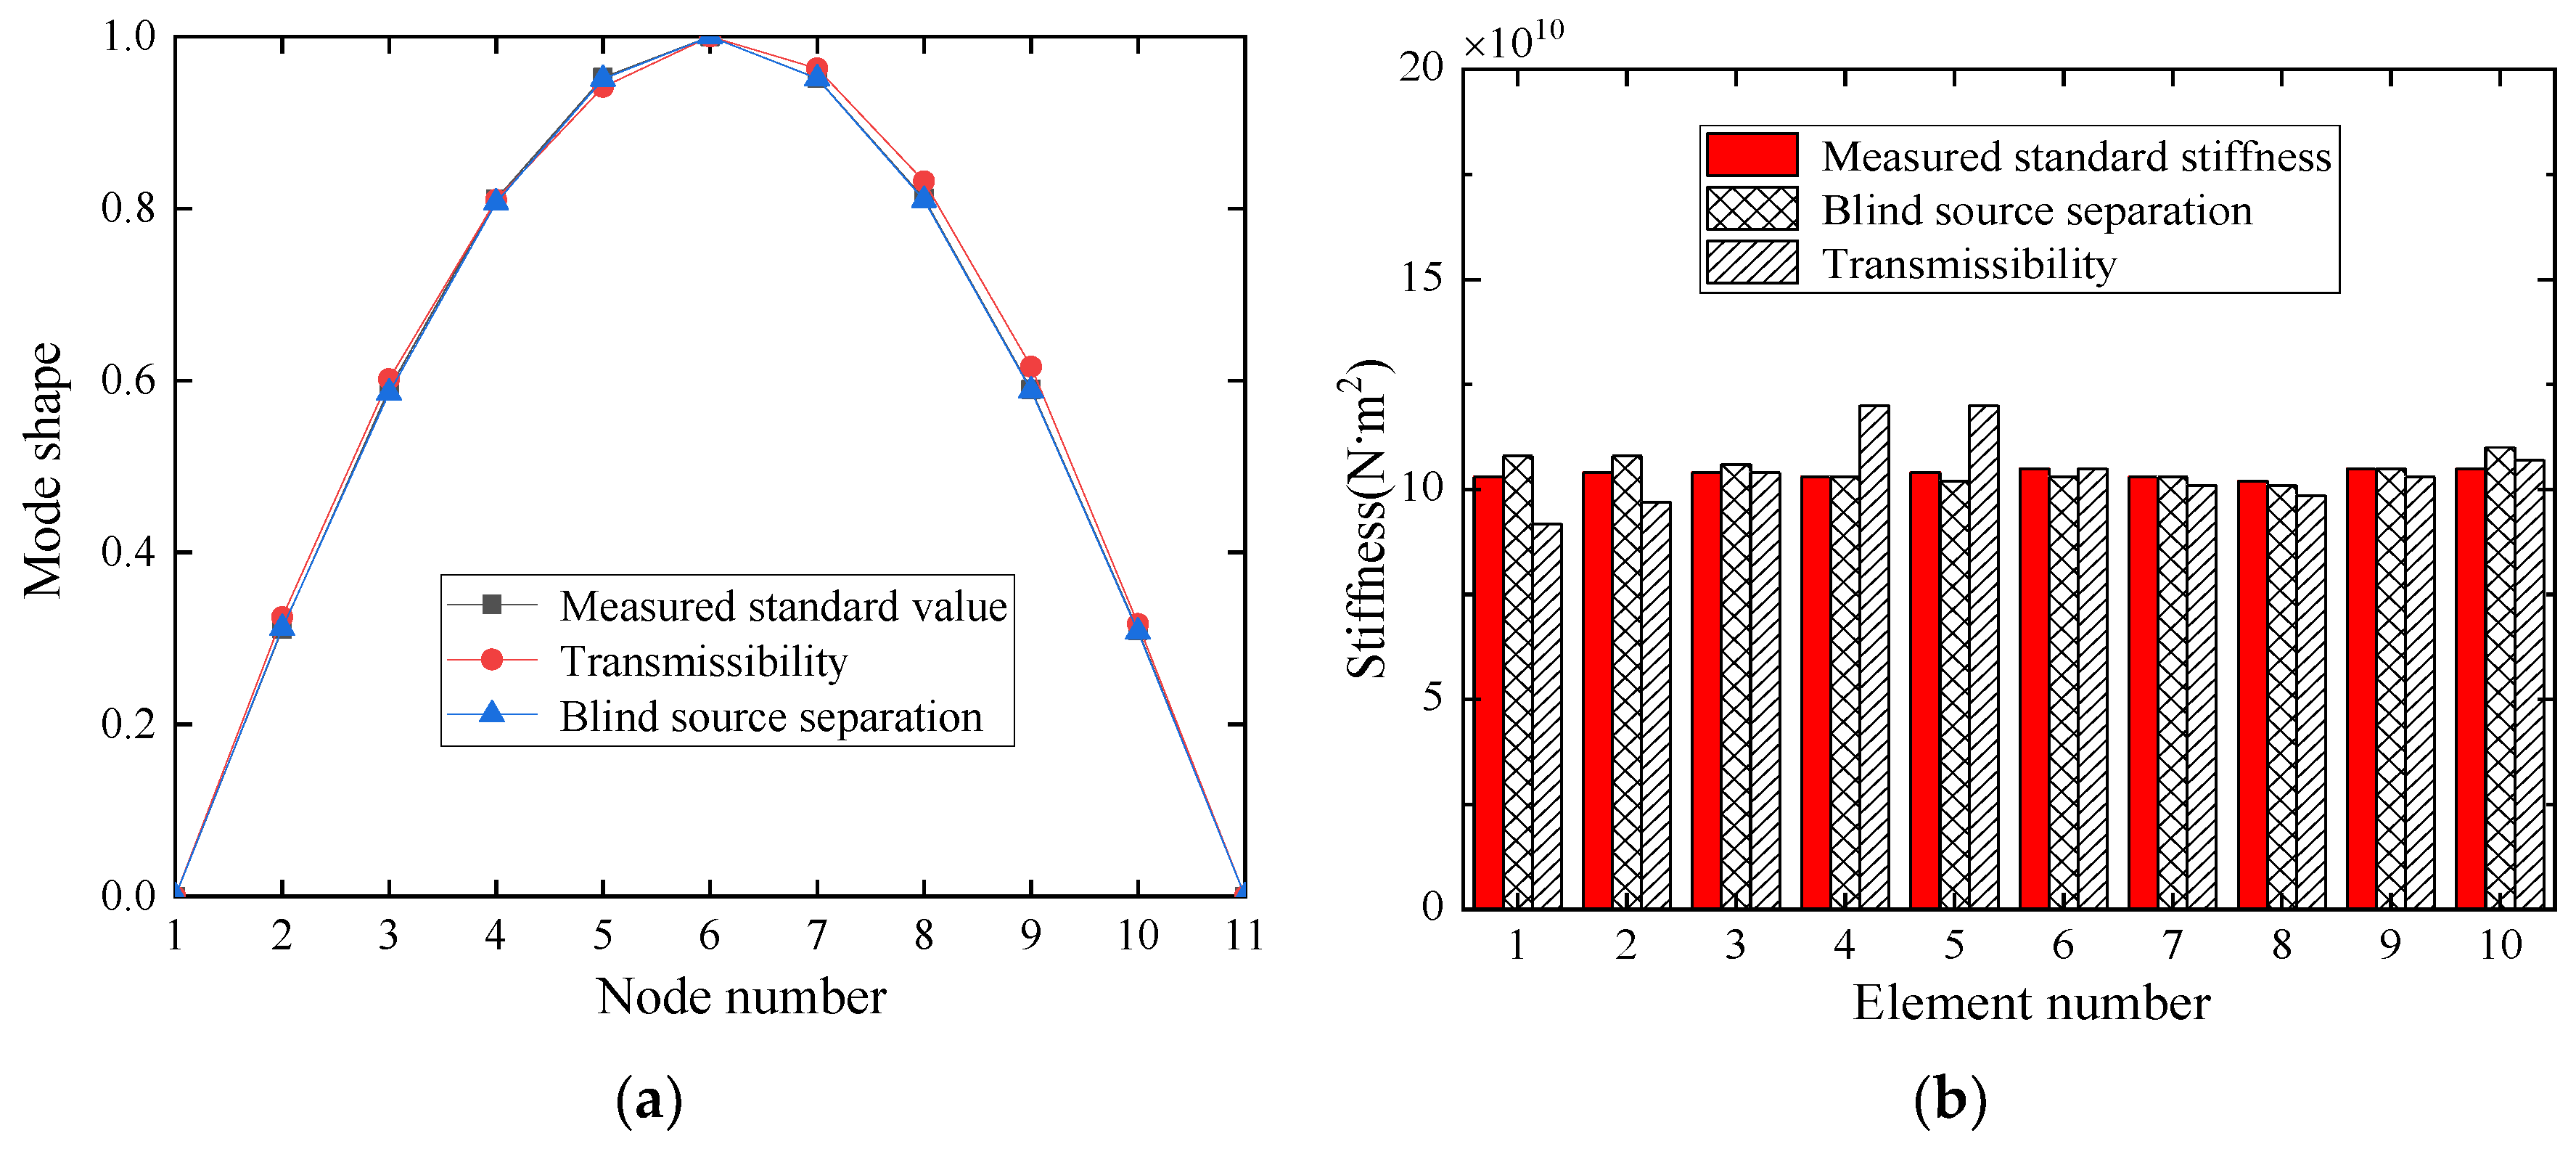
4.2. Comparison of Different Identification Methods

Scenario 1 is selected for comparison of the proposed method and the transmissibility method. The accelerations of the two vehicles at Node 2 and Node 3 are shown in Figure 6, and the accelerations of the corresponding contact points are shown in Figure 7. The bridge fundamental mode shape and the corresponding element stiffness obtained by the blind source separation method and transmissibility method are shown in Figure 8a,b, respectively. It is found that the bridge fundamental mode shapes identified by the proposed method and the transmissibility method are almost the same, However, the relative error of the element stiffness identified by the proposed method is only 2.8%, while the relative error by the transmissibility method can be up to 8%. This proves that the proposed method performs better than the transmissibility method. In fact, it can be seen from Equation (16) that the element stiffness EI is directly related to the curvature of the vibration pattern ϕ i ; however, ϕ i is very sensitive to the modal vibration pattern, so the improved direct stiffness method is suitable for a high precision modal vibration pattern.
A parametric study was also conducted to investigate the effect of different factors on the proposed method. The above case was considered as the base case and eight more representative cases were selected. Table 2 shows the detailed parameters used for each case.

4.3. Effect of Vehicle Property

In the VBI system, the vehicle properties are an important factor influencing bridge element stiffness identification. Therefore, three cases (Case 1 to Case 3) were used to investigate the effect of vehicle properties on the identification of bridge element stiffness: in Case 1, the mass of the test vehicle changed to 1000 kg; in Case 2 the damping of the test vehicle changed to 400 Ns/m; in Case 3, the mass and damping of the test vehicle changed to 1000 kg and 400 Ns/m, respectively. Figure 9 shows the fundamental mode shape and element stiffness of the bridge identified by the proposed method. From Figure 9, it can be observed that the identified bridge fundamental mode shape has an error less than 0.5% for all three cases, and the identified bridge element stiffness has an error less than 3% for all three cases. Hence, the effect of the test property on the bridge’s fundamental mode shape and element stiffness identification is not significant because the method used in this study is to calculate the contact point displacement from the vehicle’s dynamic response.

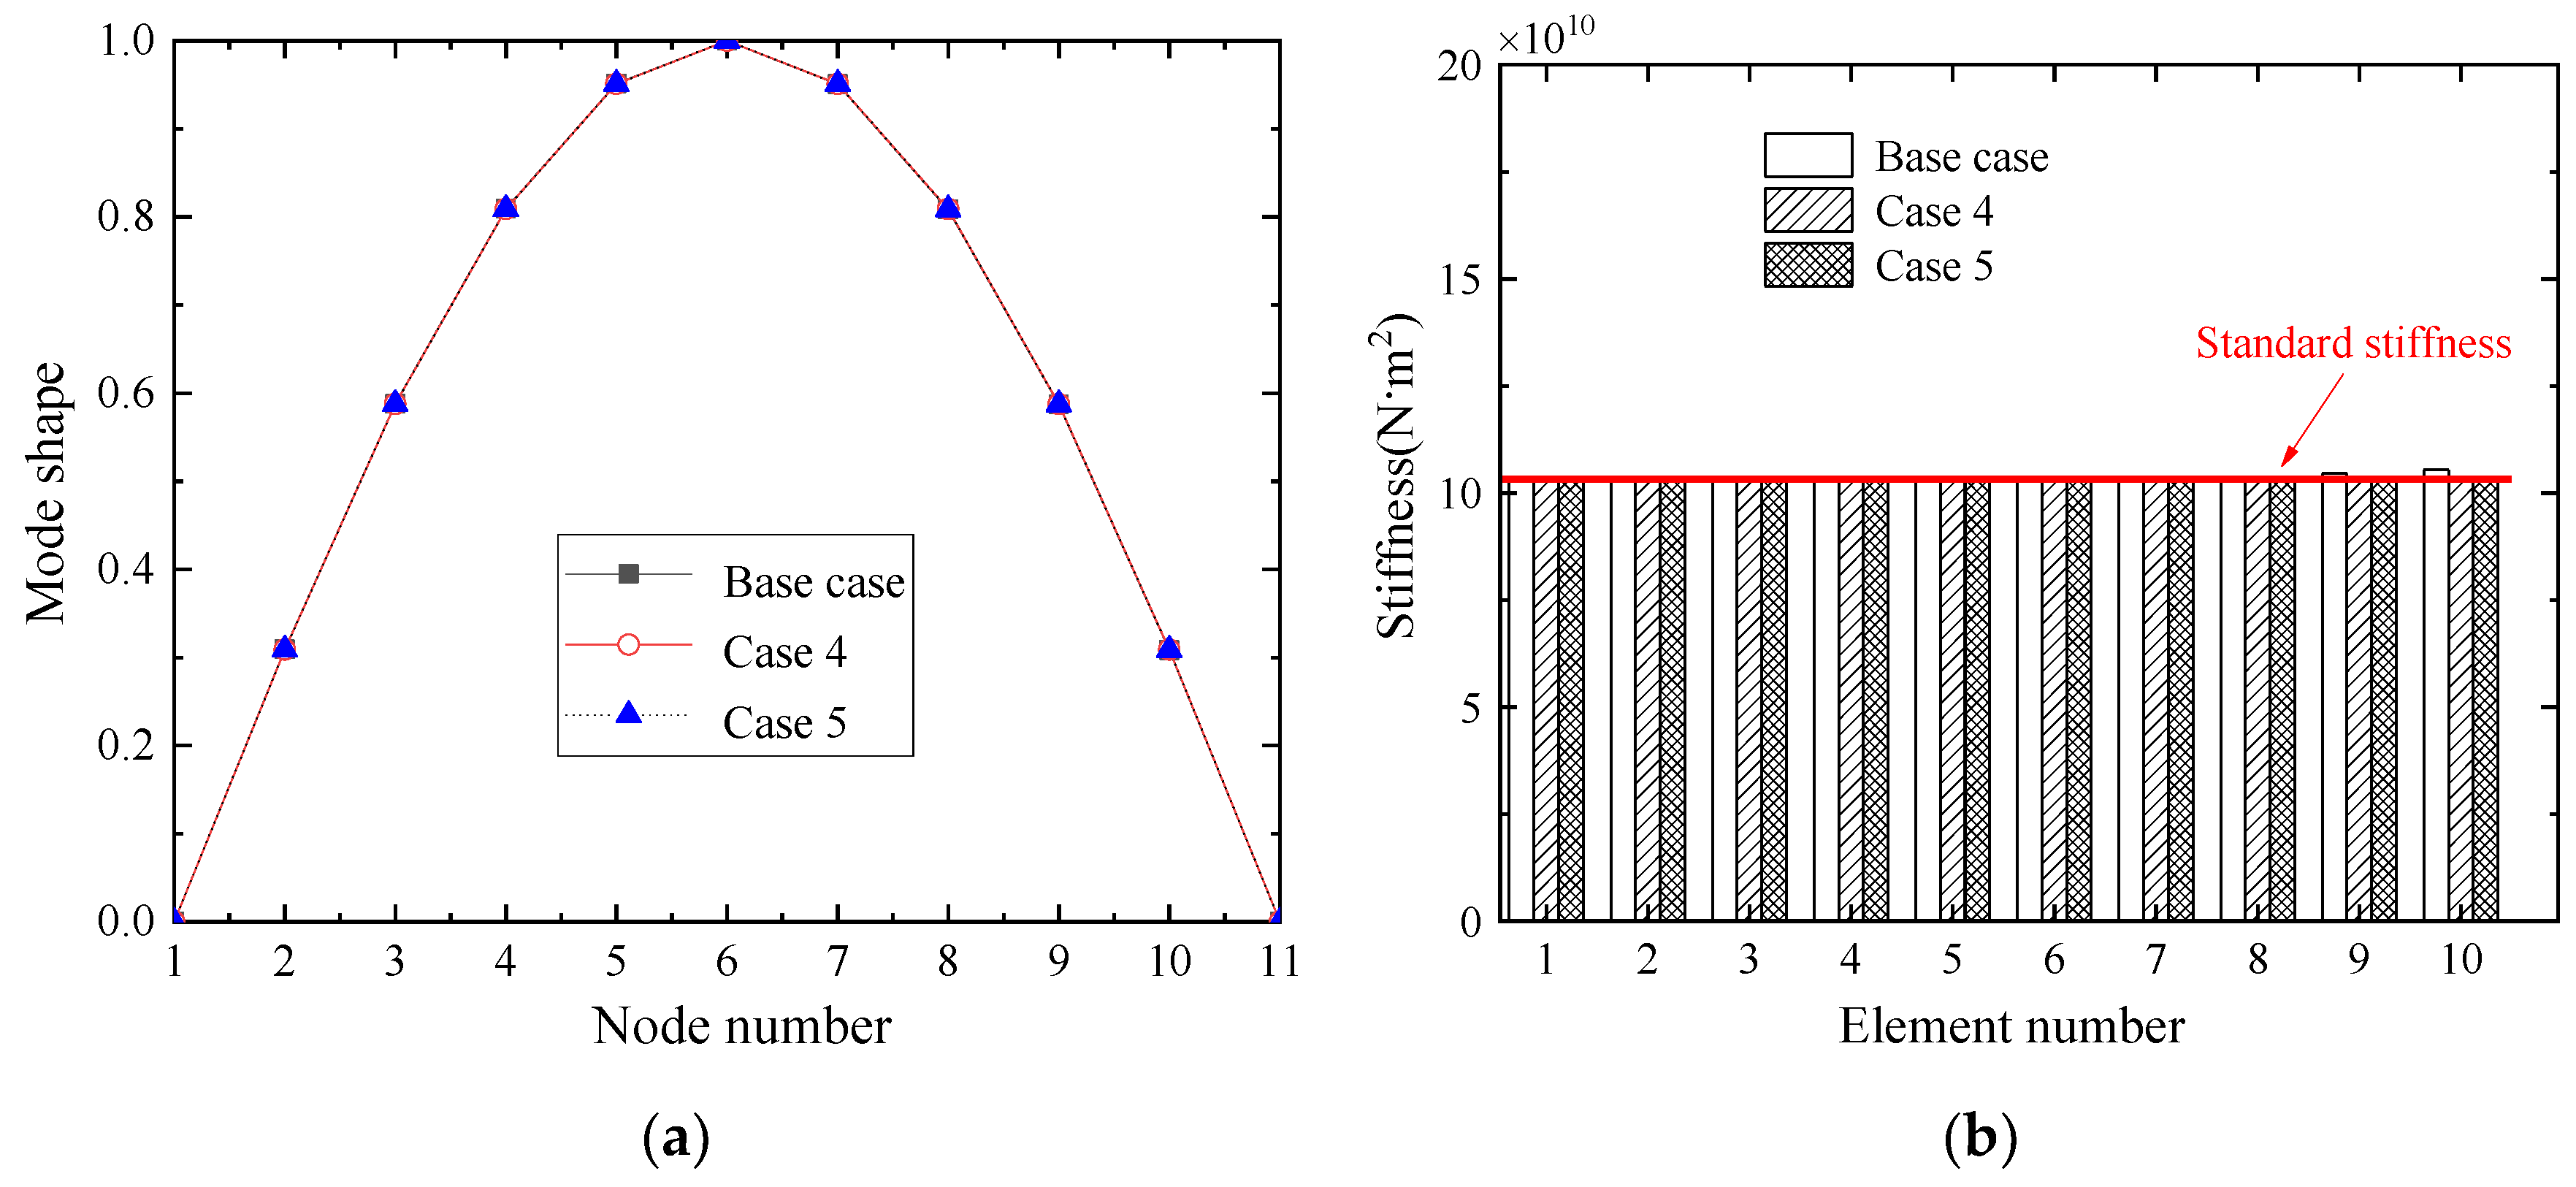
4.4. Effect of Bridge Damping

Two bridge damping ratios are adopted in Cases 4 and 5, namely, 0.000 and 0.010. The extracted fundamental mode shape and identified element stiffness are shown in Figure 10. It is observed that the error of the bridge fundamental mode shape does not exceed 1% for both cases, and the error of identified stiffness for each bridge element does not exceed 3% for both cases. Therefore, the proposed method is applicable for a large range of bridge damping.

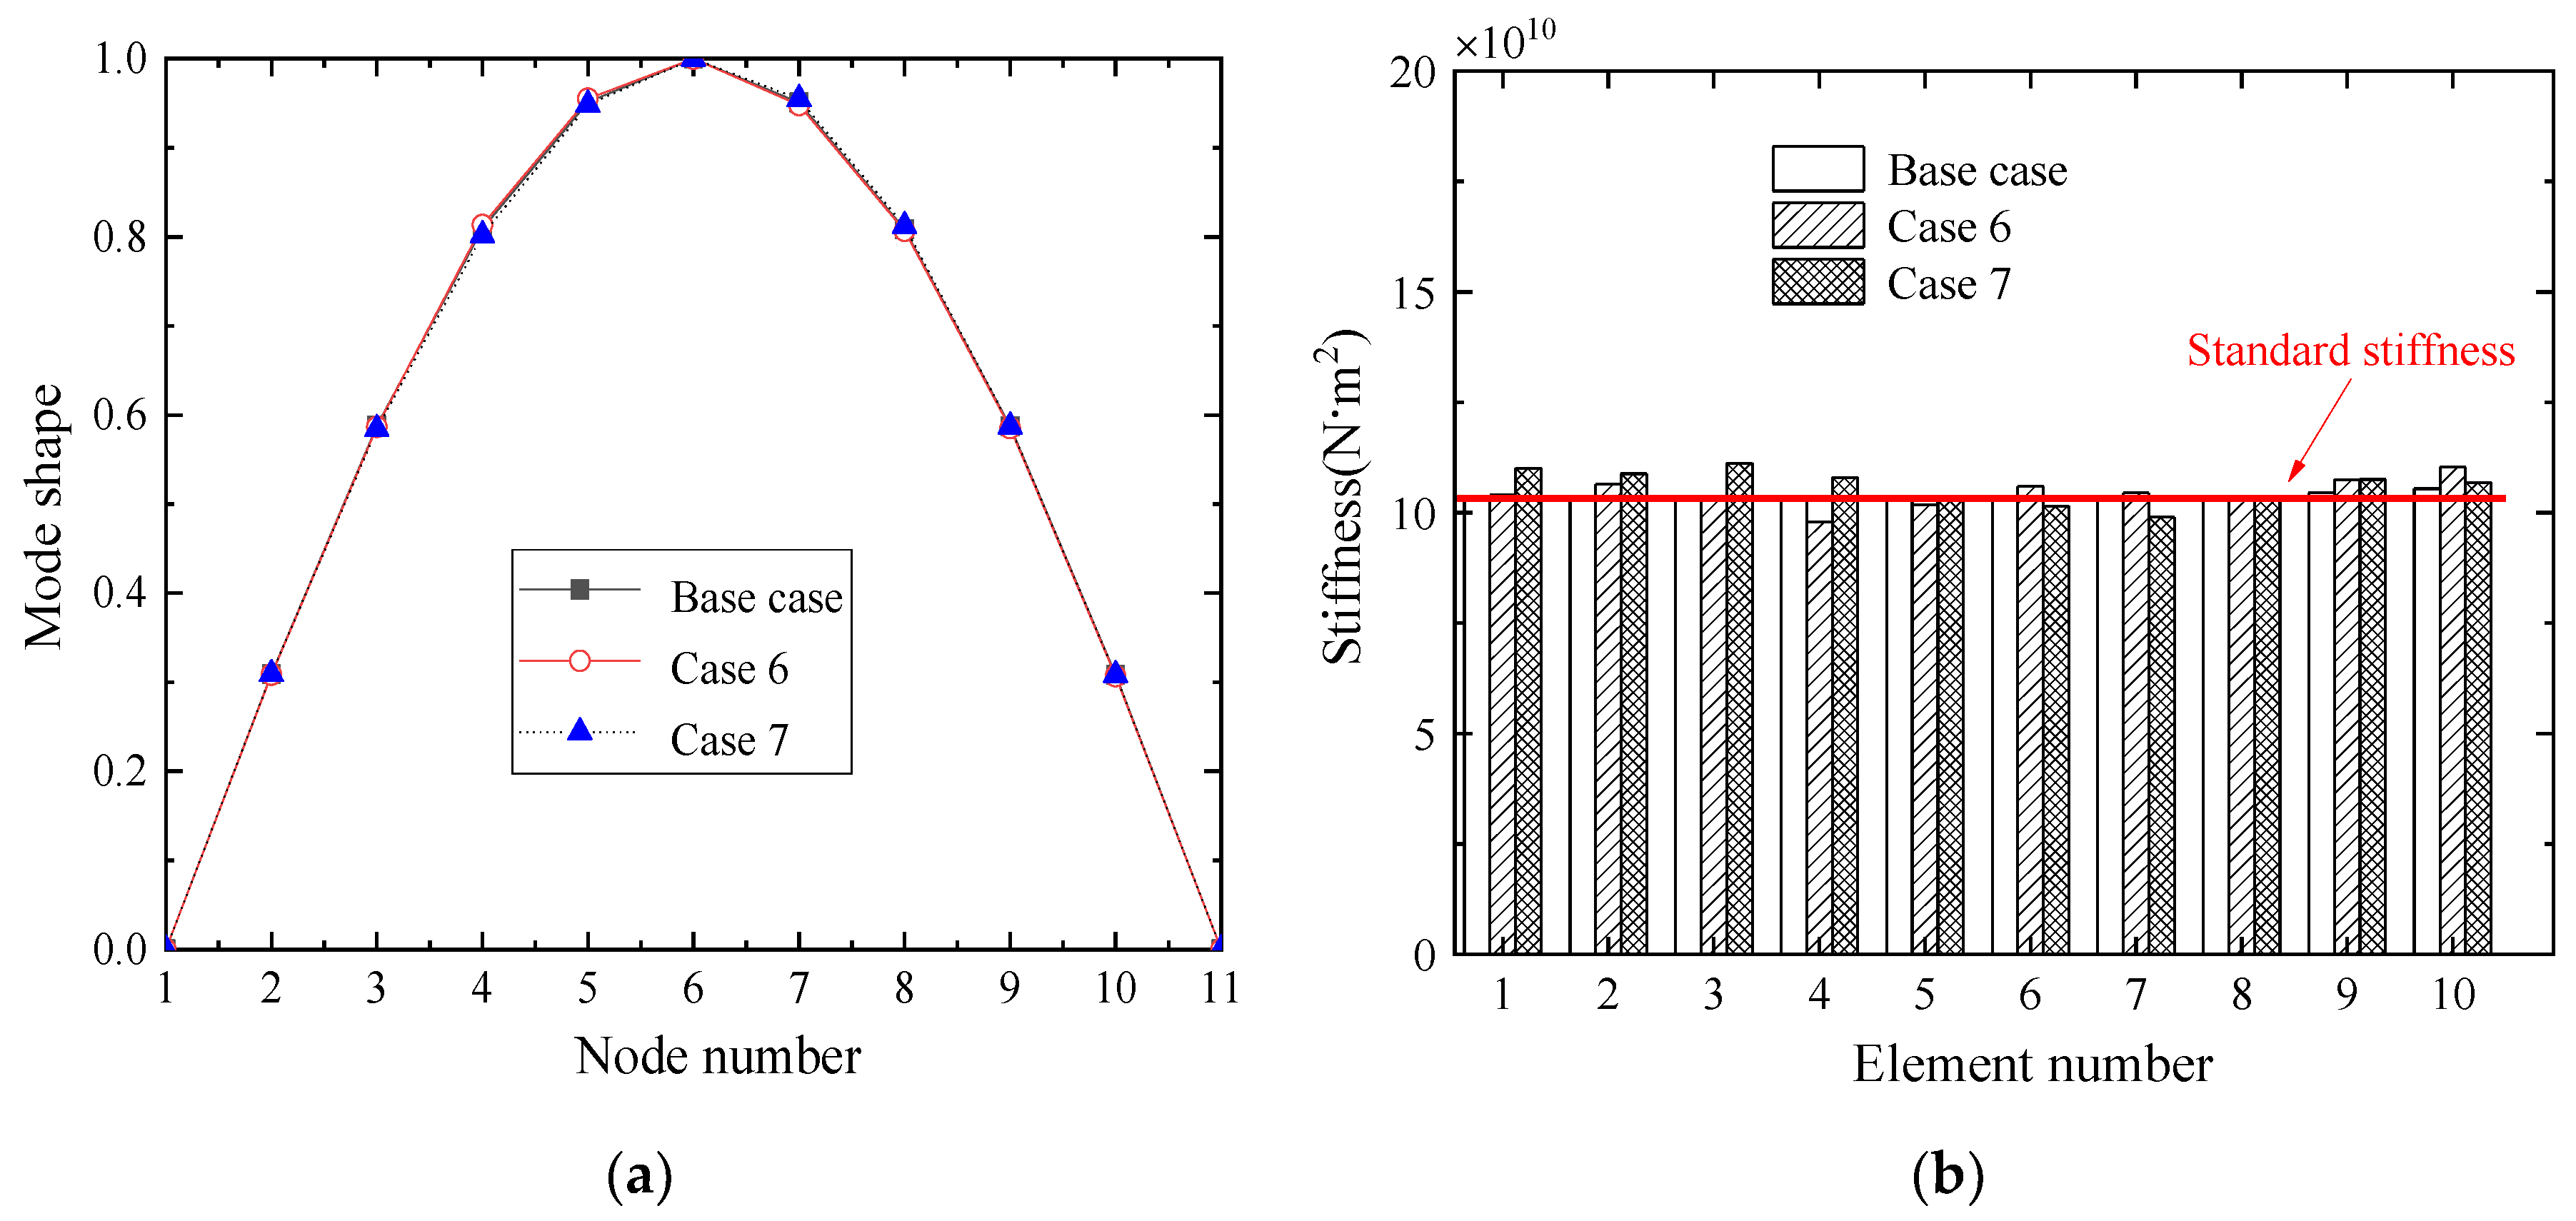
4.5. Effect of Measurement Noise

Noise in field measurement cannot be avoided and therefore white noise is added to the original acceleration to simulate measurement noise herein. The signal-to-noise ratio (SNR) is defined as:
S N R = 10 log 1 N i = 1 N y i 2 1 N i = 1 N δ i 2
where y i is the acceleration at the ith sampling time step, N is the total number of data, and δ i is the noise at the ith sampling time step. From the above equation, the SNR decreases as the noise increases. The extracted bridge fundamental mode shape and identified element stiffness in Cases 6 and 7 are presented in Figure 11. The proposed method can accurately extract the bridge fundamental mode shape when the SNR is 40 dB or 30 dB. The error of the extracted fundamental mode shape is less than 0.8% and 0.9% for Case 6 and Case 7, while the error of identified element stiffness can be up to 7% and 8% for Case 6 and Case 7, respectively. Hence, the proposed method has good resistance to noise.

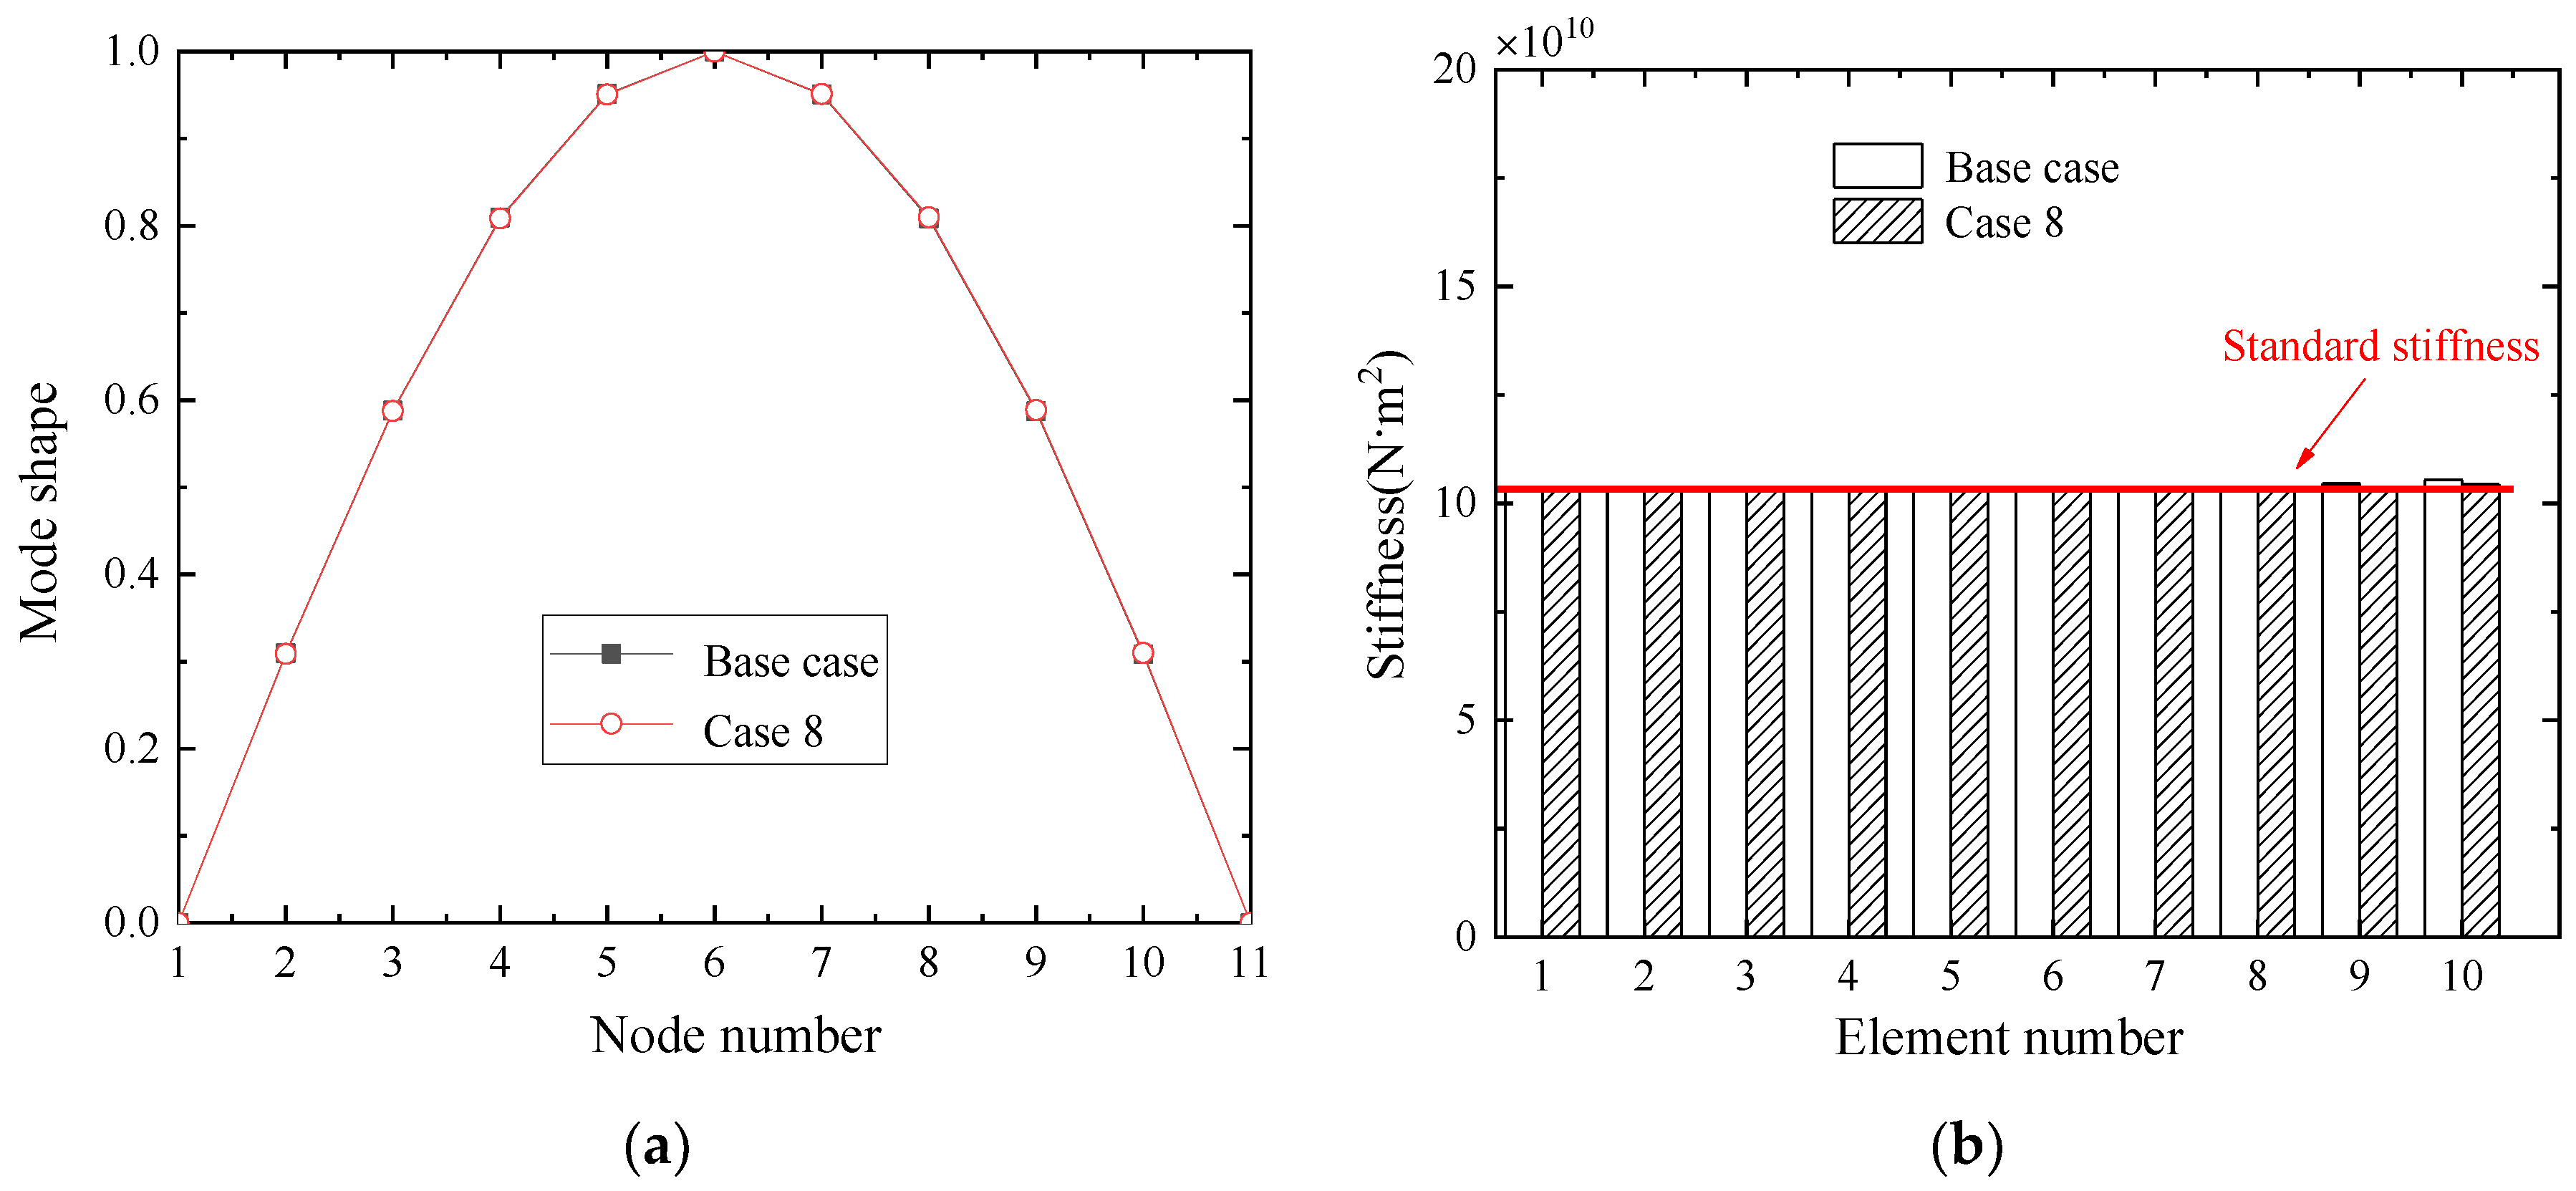
4.6. Effect of External Excitation Variations

Traffic flow, which may bring adverse effects to the indirect approach [44], was adopted as the excitation source of the proposed method. The effect of random vehicle excitation was investigated herein since traffic is not blocked in practice. The passing vehicles are also simulated as single-degree-of-freedom mass-spring systems to approximate random traffic excitation, and they run on the bridge continuously until all measurement points are collected by the test vehicle. Scenario 2 in Table 1 is adopted to compare with Scenario 1. The identified results for different traffic flow are shown in Figure 12. For both cases, the error of the extracted fundamental mode shape is less than 0.3% and the error of identified bridge element stiffness is up to 1%. It is also observed that with the mass increase of passing vehicles, the identification results are more accurate, indicating that higher external excitation is more beneficial for the proposed method.

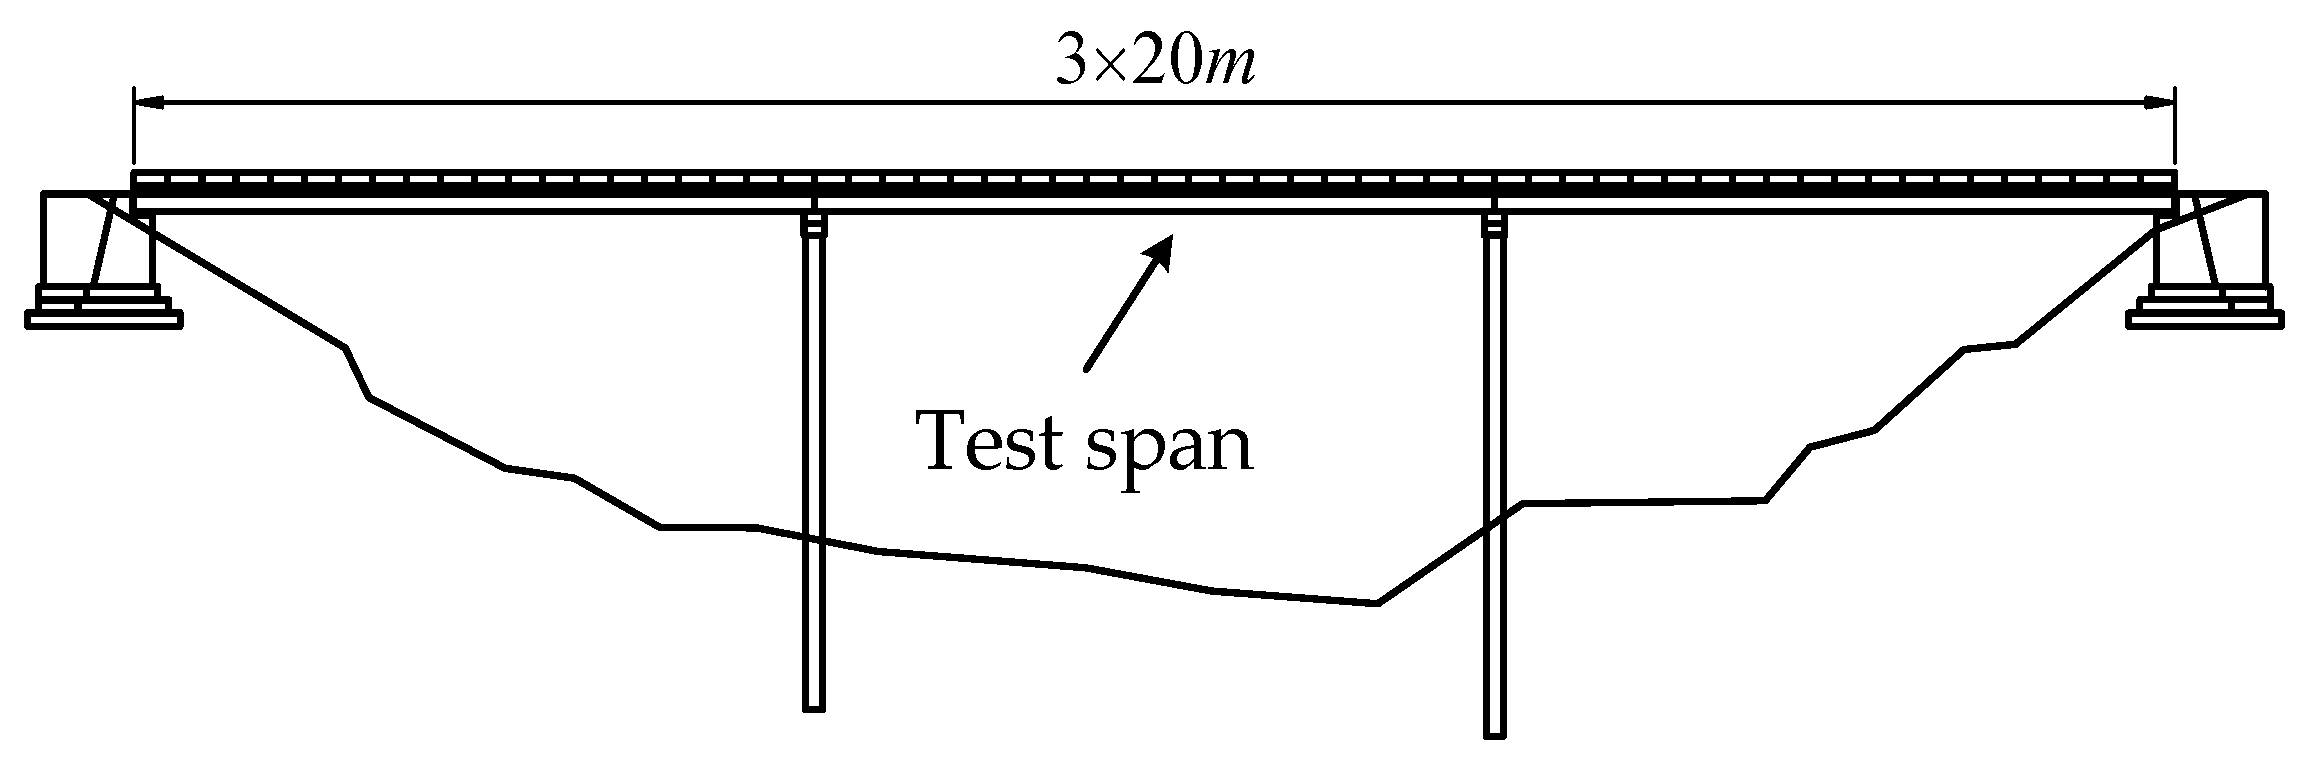
5. Field Measurement

The Min-Xie Bridge, located in Fu ling District, Chongqing, is a three-span T-girder highway bridge, as shown in Figure 13. The second span was selected as the test span, as shown in Figure 14 and it has nine concrete T-girders as shown in Figure 15. The cross-sectional moment of inertia is 2.99 m4, the elastic modulus is 34.5 GPa, and the damping ratio is 0.4%.
The acceleration was measured by an accelerometer and transmitted to the computer by a wireless data transmission module, both produced by Jiangsu Donghua Calibration and Testing Co., Ltd., Taizhou, China. (Figure 16).
An ambient vibration test was carried out first in which the acceleration of the bridge at the midspan of the second span was recorded at 100 Hz for 60 s. An ambient vibration test for the test vehicle was also conducted, in which the acceleration was recorded at 100 Hz for 30 s (Figure 17) and the fundamental frequency of 3.0 Hz was obtained.
During the field measurement traffic was not blocked, so there was random traffic flow on other lanes. Nine uniformly distributed locations of the bridge test span were selected for marking (A1–A9 in Figure 18), with a distance of 2 m between two adjacent locations. The two test vehicles were first stopped at A1 and A2 to collect the vertical acceleration for 30 s. Then the two test vehicles moved to A2 and A3 and so on for measurements.
In order to highlight the comparison, the direct measurement method of placing the sensor directly on the bridge deck at rest to collect the acceleration signal was also used in the field measurement. In fact, the direct method in which the sensor is installed on the bridge directly to collect the vibration data of the bridge is usually used for modal analysis in practice. Therefore, the bridge element stiffness obtained by the direct method was used for comparison. The vertical accelerations of the test vehicle at positions A1 and A2 are shown in Figure 19, and the corresponding vertical acceleration spectra of the test vehicle are shown in Figure 20. There are two peaks in the spectrum corresponding to the fundamental frequency of the bridge at 8.86 Hz and the frequency of the vehicle at 3 Hz, respectively. Figure 21 shows the fundamental mode shape of the bridge identified by different methods and the corresponding element stiffnesses.
Figure 21 presents the identified fundamental mode shape and bridge element stiffness of the second span. The identified fundamental mode shapes by different methods match the baseline obtained from the direct measurement well. The error of the bridge element stiffness of the proposed method is less than that of the transmissibility method, indicating the proposed method has better performance.
Finally, the FE models of the bridge were built by using the identified bridge element stiffness from different methods, blind source separation method, transmissibility method, and direct measurement by accelerometer method. Four identical heavy vehicles, with a total mass of 160 t were placed on the middle span in Figure 22. The vertical displacement at the midpoint was calculated and compared with that measured in the field static test, as shown in Table 3. The comparison revealed that the blind source separation technique can calculate the vertical displacement more accurately (error of 4%) than the transmissibility method (error of 7%), further verifying the feasibility of the proposed method.

6. Conclusions

An indirect approach to extract a girder bridge fundamental mode shape and identify bridge element stiffness using two movable test vehicles was proposed and validated by numerical simulation and field measurement. The following conclusions may be drawn:
(1)
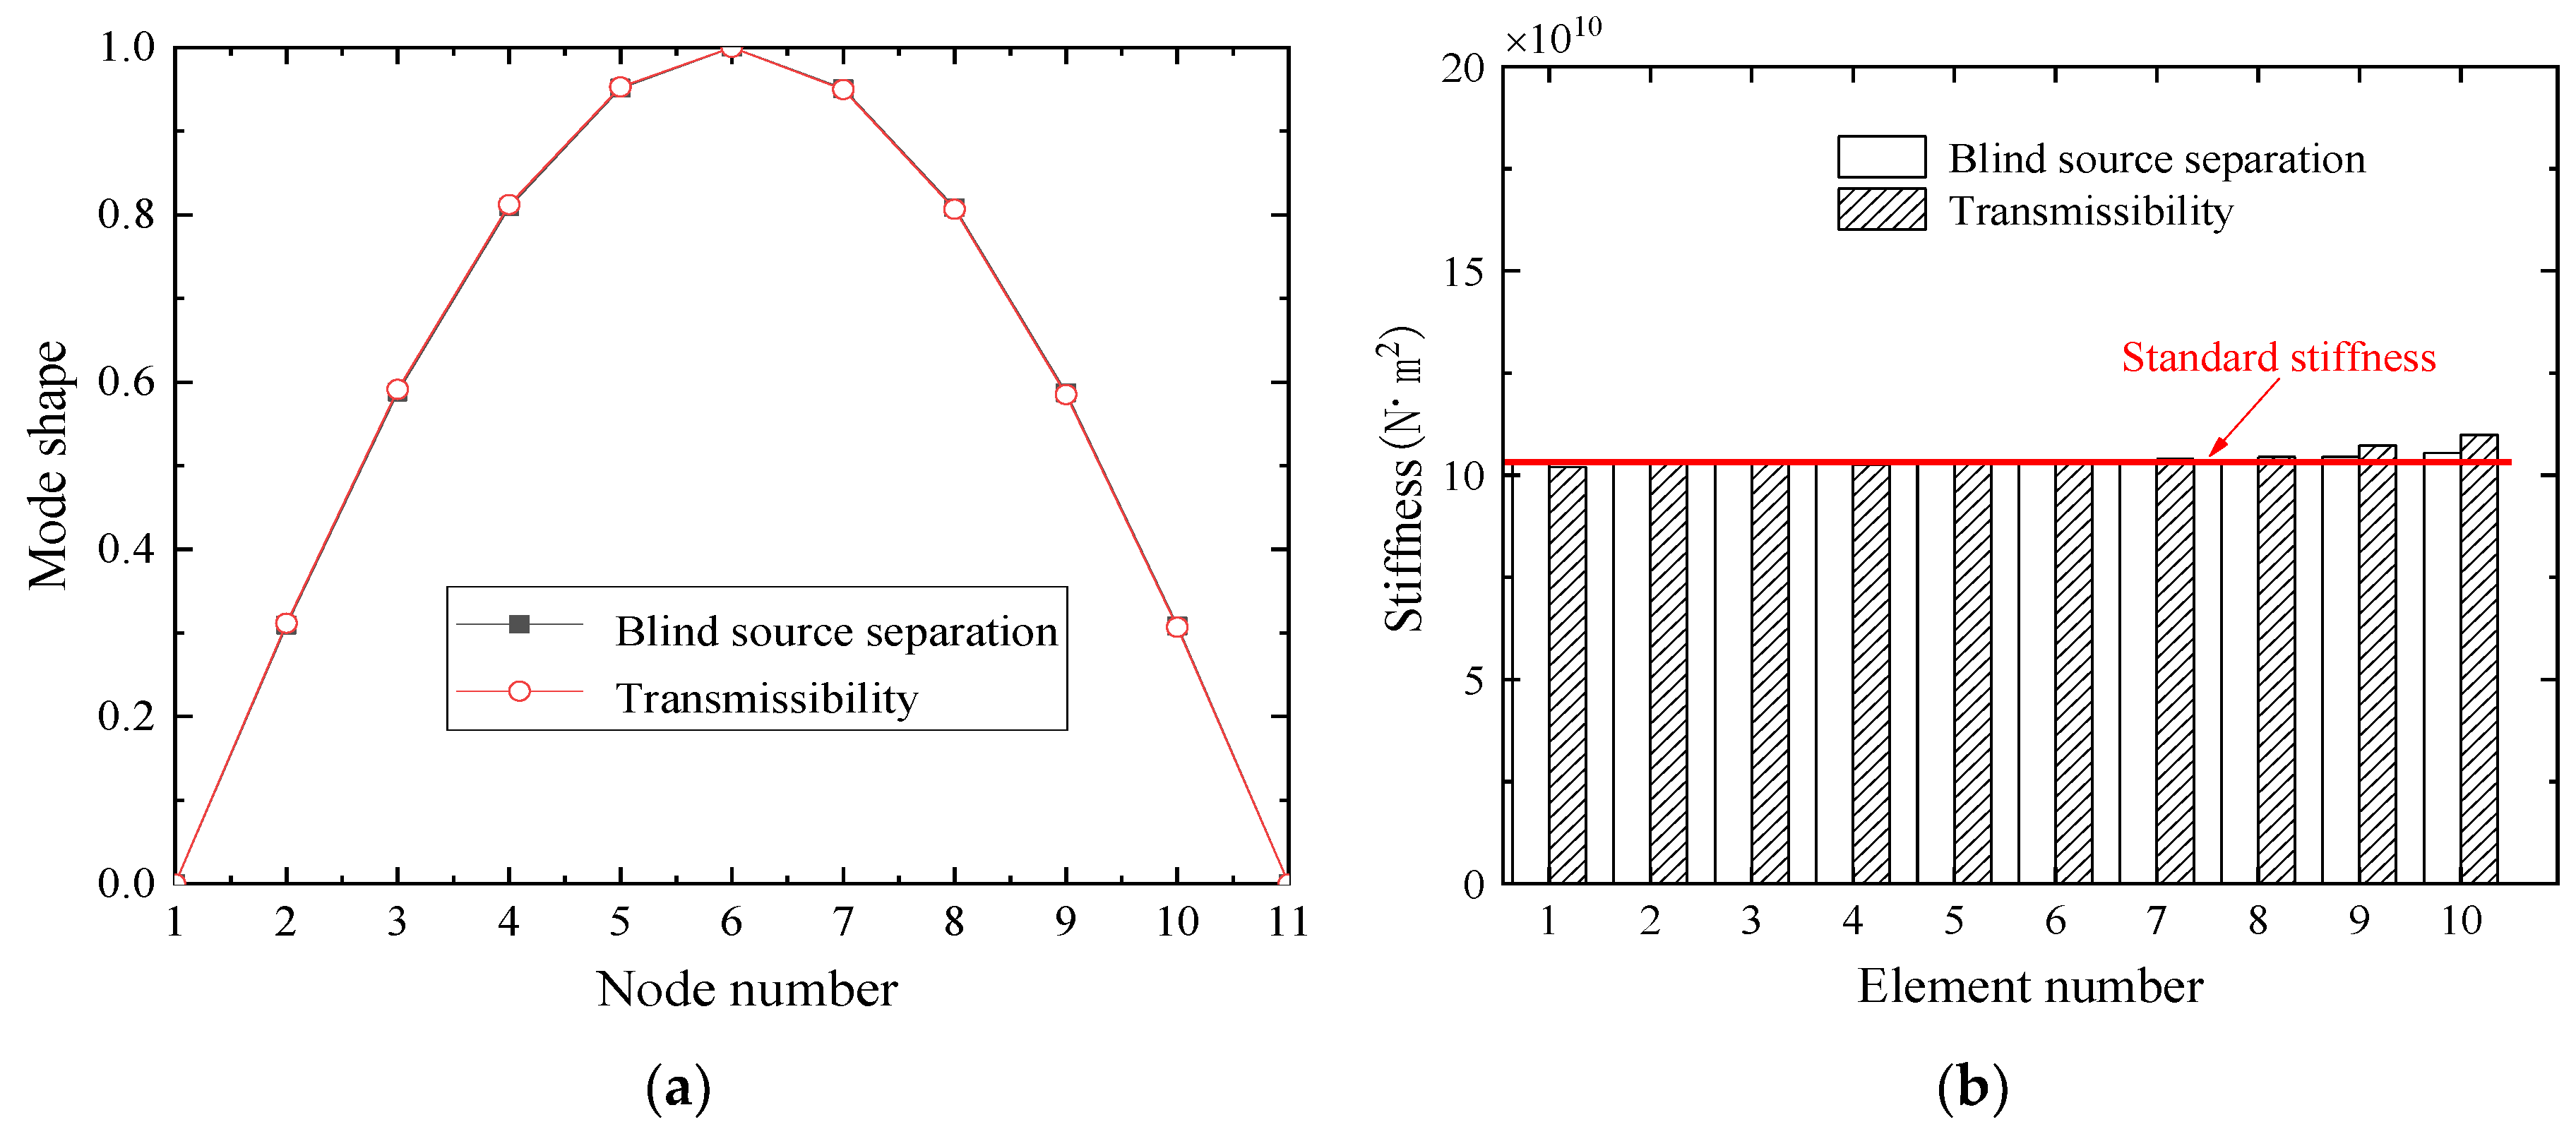
Through the investigation of a numerical simulation, the proposed method performs better than the transmissibility method.
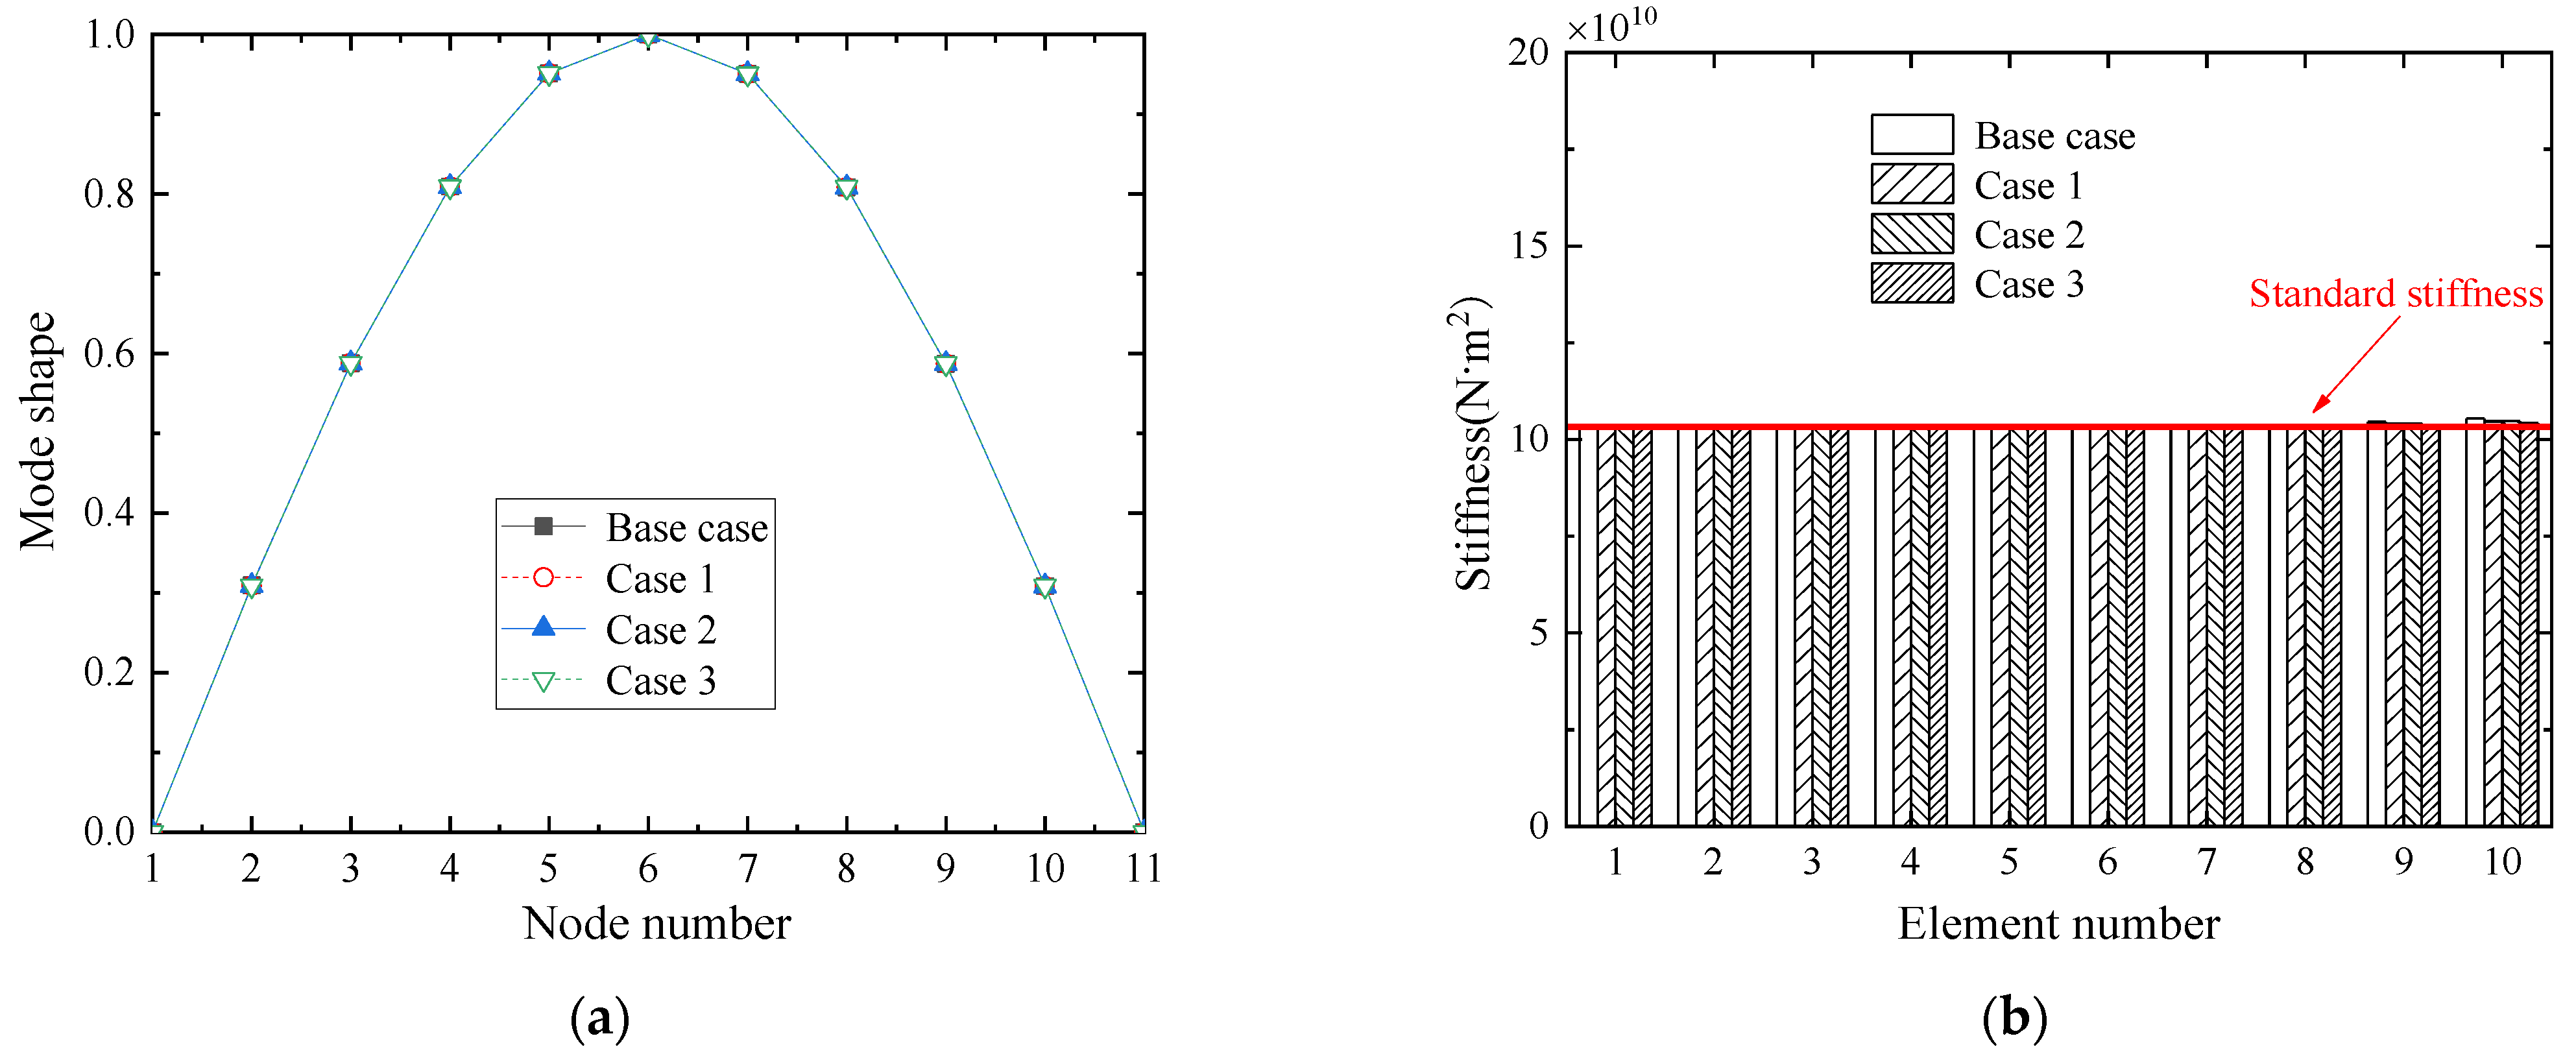
(2)
The proposed method has lower requirements for a test vehicle. It is applicable to a large range of bridge damping ratios and it can perform well when measurement noise exists.
(3)
In regard to field measurement, the proposed method can eliminate the adverse effect of road surface roughness and it can accurately extract the fundamental mode shape and further identify the bridge element stiffness without blocking traffic. Therefore, the proposed method will be expected to perform well in bridge structural health monitoring techniques and can be well applied to symmetrical bridge structures to avoid disasters.
(4)
Due to the blind source separation technique, the proposed method does not require extraction of bridge frequency by bandpass filtering and pre-defined parameters, which is more convenient in practice.
(5)
The indirect approach of obtaining bridge information by test vehicle was used to test bridge structure for the field measurement. Obviously, it has the advantages of low-cost and fast implementation compared with the conventional direct approach.
In this paper, the blind source separation technique was applied to the identification of coupled modal parameters of axles for the first time, and the reconstructed mode shape and element stiffness were in good agreement with the theoretical results. In real bridge structures, the fundamental mode shape of the bridge is easier to obtain, so this paper uses the blind source separation technique to obtain only the fundamental mode shape of the bridge structure. In future work, the acquisition of other mode shapes will be further investigated and the accuracy of the identified element stiffness will be explored.

Author Contributions

Conceptualization, Y.Y.; methodology, H.L.; draft writing, Y.Z.; data curation, S.X.; investigation, R.W.; final writing, X.T. All authors have read and agreed to the published version of the manuscript.

Funding

This study was supported by the following agencies: The National Key Research and Development Program of China (Grant No. 2020YFF0217800), Science and technology plan project of Chongqing Science and Technology Bureau (Grant No. cstc2020jscx-msxm0907), Graduate Research and Innovation Foundation of Chongqing, China (Grant No. CYS22049, CYS22053), Science and Technology Project of China Power Construction Co., Ltd. (Grant No. KJ-2020-117), Chongqing High-tech Zone Science and Technology Innovation Bureau Project: Research on key technologies of prefabricated, intelligent construction and intelligent operation and maintenance under EPC mode.

Data Availability Statement

Some data presented in this study are available on request from the corresponding author.

Acknowledgments

We appreciate the following agencies for their support in this study: The National Key Research and Development Program of China (Grant No. 2020YFF0217800), Science and technology plan project of Chongqing Science and Technology Bureau (Grant No. cstc2020jscx-msxm0907), Science and Technology Project of China Power Construction Co., Ltd. (Grant No. KJ-2020-117), Chongqing High-tech Zone Science and Technology Innovation Bureau Project: Research on key technologies of prefabricated, intelligent construction and intelligent operation and maintenance under EPC mode.

Conflicts of Interest

The authors declare no conflict of interest.

References

  1. Ji, X.; Yang, Z.; Huang, X.; Tan, L. Problems in bridge health monitoring and application of intelligent monitoring technology. IOP Conf. Ser. Earth Environ. Sci. 2019, 267, 052015. [Google Scholar] [CrossRef]
  2. Gomez, H.C.; Fanning, P.J.; Feng, M.Q. Testing and long-term monitoring of a curved concrete box girder bridge. Eng. Struct. 2011, 33, 2861–2869. [Google Scholar] [CrossRef]
  3. Yang, Y.; Ling, Y.; Tan, X.K.; Wang, S.; Wang, R.Q. Damage identification of frame structure based on approximate Metropolis–Hastings algorithm and probability density evolution method. Int. J. Struct. Stab. Dyn. 2022, 22, 2240014. [Google Scholar] [CrossRef]
  4. Crespi, P.; Zucca, M.; Valente, M.; Longarini, N. Influence of corrosion effects on the seismic capacity of existing RC bridges. Eng. Fail. Anal. 2022, 140, 106546. [Google Scholar] [CrossRef]
  5. Yang, Y.; Zhang, Y.; Tan, X. Review on vibration-based structural health monitoring techniques and technical codes. Symmetry 2021, 13, 1998. [Google Scholar] [CrossRef]
  6. Yang, Y.B.; Yang, J.P. State-of-the-art review on modal identification and damage detection of bridges by moving test vehicles. Int. J. Struct. Stab. Dyn. 2018, 18, 1850025. [Google Scholar] [CrossRef]
  7. Gong, F.; Han, F.; Wang, Y.; Xia, Y. Bridge damping extraction method from vehicle-bridge interaction system using double-beam model. Appl. Sci. 2021, 11, 10304. [Google Scholar] [CrossRef]
  8. Yang, Y.-B.; Lin, C.; Yau, J. Extracting bridge frequencies from the dynamic response of a passing vehicle. J. Sound Vib. 2004, 272, 471–493. [Google Scholar] [CrossRef]
  9. Yang, Y.B.; Li, Y.C.; Chang, K.C. Using two connected vehicles to measure the frequencies of bridges with rough surface: A theoretical study. Acta Mech. 2012, 223, 1851–1861. [Google Scholar] [CrossRef]
  10. Nagayama, T.; Reksowardojo, A.; Su, D.; Mizutani, T. Bridge natural frequency estimation by extracting the common vibration component from the responses of two vehicles. Eng. Struct. 2017, 150, 821–829. [Google Scholar] [CrossRef]
  11. Yang, Y.B.; Xu, H.; Zhang, B.; Xiong, F.; Wang, Z.L. Measuring bridge frequencies by a test vehicle in non-moving and moving states. Eng. Struct. 2020, 203, 109859. [Google Scholar] [CrossRef]
  12. González, A.; Obrien, E.; McGetrick, P. Identification of damping in a bridge using a moving instrumented vehicle. J. Sound Vib. 2012, 331, 4115–4131. [Google Scholar] [CrossRef]
  13. Yang, Y.B.; Zhang, B.; Chen, Y.; Qian, Y.; Wu, Y. Bridge damping identification by vehicle scanning method. Eng. Struct. 2019, 183, 637–645. [Google Scholar] [CrossRef]
  14. Tan, C.; Uddin, N.; Obrien, E.J.; McGetrick, P.J.; Kim, C.-W. Extraction of bridge modal parameters using passing vehicle response. J. Bridg. Eng. 2019, 24, 1477. [Google Scholar] [CrossRef]
  15. Zhang, Y.; Wang, L.; Xiang, Z. Damage detection by mode shape squares extracted from a passing vehicle. J. Sound Vib. 2012, 331, 291–307. [Google Scholar] [CrossRef]
  16. Yang, Y.; Li, Y.; Chang, K. Constructing the mode shapes of a bridge from a passing vehicle: A theoretical study. Smart Struct. Syst. 2014, 13, 797–819. [Google Scholar] [CrossRef]
  17. Malekjafrian, A.; Obrien, E.J. On the use of a passing vehicle for the estimation of bridge mode shapes. J. Sound Vib. 2017, 397, 77–91. [Google Scholar] [CrossRef]
  18. Xu, Y.; Brownjohn, J.M.; Hester, D. Enhanced sparse component analysis for operational modal identification of real-life bridge structures. Mech. Syst. Signal Process. 2018, 116, 585–605. [Google Scholar] [CrossRef]
  19. Devriendt, C.; Guillaume, P. The use of transmissibility measurements in output-only modal analysis. Mech. Syst. Signal Process. 2007, 21, 2689–2696. [Google Scholar] [CrossRef]
  20. Devriendt, C.; Guillaume, P. Identification of modal parameters from transmissibility measurements. J. Sound Vib. 2008, 314, 343–356. [Google Scholar] [CrossRef]
  21. Yang, Y.B.; Wang, Z.; Shi, K.; Xu, H. Research progress on bridge indirect measurement and monitoring from moving vehicle response. China J. Highw. Transp. 2021, 34, 1–12. [Google Scholar]
  22. Zhang, H.; Zhong, Z.X.; Duan, J.M.; Yang, J.K.; Zheng, Z.C.; Liu, G.G. Damage identification method for medium- and small-span bridges based on macro-strain data under vehicle-bridge coupling. Materials 2022, 15, 1097. [Google Scholar] [CrossRef] [PubMed]
  23. Mei, Q.; Gül, M.; Boay, M. Indirect health monitoring of bridges using mel-frequency cepstral coefficients and principal component analysis. Mech. Syst. Signal Process. 2018, 119, 523–546. [Google Scholar] [CrossRef]
  24. Yang, Y.; Lu, H.; Tan, X.; Chai, H.K.; Wang, R.; Zhang, Y. Fundamental mode shape estimation and element stiffness evaluation of girder bridges by using passing tractor-trailers. Mech. Syst. Signal Process. 2021, 169, 108746. [Google Scholar] [CrossRef]
  25. Zhang, B.; Qian, Y.; Wu, Y.; Yang, Y.B. An effective means for damage detection of bridges using the con-tact-point response of a moving test vehicle. J. Sound Vib. 2018, 419, 158–172. [Google Scholar] [CrossRef]
  26. Yang, M.; Liu, C. Possibility of bridge inspection through drive-by vehicles. Appl. Sci. 2020, 11, 69. [Google Scholar] [CrossRef]
  27. Pourzeynali, S.; Zhu, X.Q.; Ghari Zadeh, A.; Rashidi, M.; Samali, B. Simultaneous identification of bridge structural damage and moving loads using the explicit form of newmark-β method: Numerical and experimental studies. Remote Sens. 2021, 14, 119. [Google Scholar] [CrossRef]
  28. Yang, Y.B.; Zhang, B.; Qian, Y.; Wu, Y. Contact-point response for modal identification of bridges by a moving test vehicle. Int. J. Struct. Stab. Dyn. 2017, 18, 1850073. [Google Scholar] [CrossRef]
  29. Yang, Y.; Lu, H.; Tan, X.; Wang, R.; Zhang, Y. Mode shape identification and damage detection of bridge by movable sensory system. IEEE Trans. Intell. Transp. Syst. 2022, in press. [Google Scholar]
  30. Yang, D.; Yi, C.; Xu, Z.; Zhang, Y.; Ge, M.; Liu, C. Improved tensor-based singular spectrum analysis based on single channel blind source separation algorithm and its application to fault diagnosis. Appl. Sci. 2017, 7, 418. [Google Scholar] [CrossRef]
  31. Abazarsa, F.; Nateghi, F.; Ghahari, S.F.; Taciroglu, E. Extended blind modal identification technique for nonstationary excitations and its verification and validation. J. Eng. Mech. 2015, 142, 04015078. [Google Scholar] [CrossRef]
  32. Qin, S.; Guo, J.; Zhu, C. Sparse component analysis using time-frequency representations for operational modal analysis. Sensors 2015, 15, 6497–6519. [Google Scholar] [CrossRef] [PubMed] [Green Version]
  33. Martinez, B.; Green, A.; Silva, M.F.; Mascareñas, D.; Yang, Y. Sparse and random sampling techniques for high-resolution, full-field, bss-based structural dynamics identification from video. Sensors 2020, 20, 3526. [Google Scholar] [CrossRef]
  34. Yang, Y.; Liang, J.; Yuan, A.; Lu, H.; Luo, K.; Shen, X.; Wan, Q. Bridge element bending stiffness damage identification based on new indirect measurement method. China J. Highw. Transp. 2021, 34, 188–198. [Google Scholar]
  35. Yang, Y.C.; Nagarajaiah, S. Blind identification of damage in time-varying systems using independent component analysis with wavelet transform. Mech. Syst. Signal Process. 2014, 47, 3–20. [Google Scholar] [CrossRef]
  36. Kong, X.; Cai, C.S.; Deng, L. Using dynamic responses of moving vehicles to extract bridge modal proper-ties of a field bridge. J. Bridge Eng. 2017, 22, 04017018. [Google Scholar] [CrossRef]
  37. Obrien, E.J.; Martinez, D.; Malekjafarian, A.; Sevillano, E.; Otero, D.M. Damage detection using curvatures obtained from vehicle measurements. J. Civ. Struct. Health Monit. 2017, 7, 333–341. [Google Scholar] [CrossRef]
  38. Sadhu, A.; Narasimhan, S.; Antoni, J. A review of output-only structural mode identification literature employing blind source separation methods. Mech. Syst. Signal Process. 2017, 94, 415–431. [Google Scholar] [CrossRef]
  39. Zhao, H.-W.; Ding, Y.; Li, A.; Ren, Z.; Yang, K. Live-load strain evaluation of the prestressed concrete box-girder bridge using deep learning and clustering. Struct. Health Monit. 2019, 19, 1051–1063. [Google Scholar] [CrossRef]
  40. Zhao, H.W.; Ding, Y.L.; Li, A.Q. Representation of in-service performance for cable-stayed railway-highway combined bridges based on train-induced response’s sensing data and knowledge. Sensors 2022, 22, 3247. [Google Scholar] [CrossRef]
  41. Yi, T.-H.; Yao, X.-J.; Qu, C.-X.; Li, H.-N. Clustering number determination for sparse component analysis during output-only modal identification. J. Eng. Mech. 2019, 145, 1557. [Google Scholar] [CrossRef]
  42. Amini, F.; Hedayati, Y. Underdetermined blind modal identification of structures by earthquake and ambient vibration measurements via sparse component analysis. J. Sound Vib. 2016, 366, 117–132. [Google Scholar] [CrossRef]
  43. Yang, Y.; Mosalam, K.M.; Liu, G.; Wang, X. Damage detection using improved direct stiffness calculations—A case study. Int. J. Struct. Stab. Dyn. 2016, 16, 1640002. [Google Scholar] [CrossRef] [Green Version]
  44. Wl, A.; Js, B.; Lr, A.; Is, B.; Sa, C. Using drive-by health monitoring to detect bridge damage considering environmental and operational effects. J. Sound Vib. 2020, 468, 115088. [Google Scholar]
Figure 1. Simplified model of double vehicles system.
Symmetry 14 01963 g001
Figure 2. Illustration of scatter diagram.
Symmetry 14 01963 g002
Figure 3. Illustration of normalized scatter diagram.
Symmetry 14 01963 g003
Figure 4. Flow chart of bridge element stiffness identification based on blind source separation.
Symmetry 14 01963 g004
Figure 5. Discretization of the bridge into 10 beam elements.
Symmetry 14 01963 g005
Figure 6. Acceleration collected simultaneously by the test vehicle at (a) Node 2; (b) Node 3.
Symmetry 14 01963 g006
Figure 7. Acceleration of the contact point when the test vehicle at (a) Node 2; (b) Node 3.
Symmetry 14 01963 g007
Figure 8. Identification results by different methods: (a) fundamental mode shape; (b) bridge element stiffness.
Symmetry 14 01963 g008
Figure 9. Identification results for different test vehicle properties: (a) fundamental mode shape; (b) bridge element stiffness.
Symmetry 14 01963 g009
Figure 10. Identification results for different bridge damping ratios: (a) fundamental mode shape; (b) bridge element stiffness.
Symmetry 14 01963 g010
Figure 11. Identification results for different noises: (a) fundamental mode shape; (b) bridge element stiffness.
Symmetry 14 01963 g011
Figure 12. Identification results for different traffic flow: (a) fundamental mode shape; (b) bridge element stiffness.
Symmetry 14 01963 g012
Figure 13. Photo of Min-Xie Bridge (a) road surface; (b) girders and piers.
Symmetry 14 01963 g013
Figure 14. Schematic diagram of Min-Xie bridge.
Symmetry 14 01963 g014
Figure 15. Cross-section at midspan of the test span: (a) bridge cross-section; (b) T-girder cross-section (unit in mm).
Symmetry 14 01963 g015
Figure 16. Data acquisition equipment: (a) accelerometer; (b) wireless data transmission module.
Symmetry 14 01963 g016
Figure 17. Spectra of accelerations of the test vehicle.
Symmetry 14 01963 g017
Figure 18. The second span of the measurement point arrangement diagram.
Symmetry 14 01963 g018
Figure 19. The acceleration response of: (a) the test vehicle at A1; (b) the test vehicle at A2.
Symmetry 14 01963 g019
Figure 20. The corresponding acceleration spectra of: (a) the test vehicle at A1; (b) the test vehicle at A2.
Symmetry 14 01963 g020
Figure 21. Identification results of Min-Xie Bridge by different methods: (a) fundamental mode shape; (b) bridge element stiffness.
Symmetry 14 01963 g021
Figure 22. Schematic diagram of detection loading (unit in cm).
Symmetry 14 01963 g022
Table 1. Two groups of external excitation variation conditions.
ScenarioMoving Vehicle No.Time of Entry (s)Mass (Kg)Speed (m/s)
1No. 1324896
No. 22107410
No. 3036782
No. 4034221
2No. 1240692
No. 2448983
No. 3332123
No. 4417605
No. 5412031
Table 2. Parameters used in all cases.
Case No.Mass mv1,2
(kg)
Stiffness kv1,2
(kN/m)
Damping
cv1,2
(N·s/m)
Frequency fv1,2
(Hz)
Bridge Damping RatioNoise Level (SNR: dB)Excitation ScenarioRemarks
Base Case1470524.07610003.000.004Noise-Free1
11000524.07610003.640.004Noise-Free1Effect of vehicle properties
21470524.0764003.000.004Noise-Free1
31000524.0764003.640.004Noise-Free1
41470524.07610003.000.000Noise-Free1Effect of bridge damping ratio
51470524.07610003.000.010Noise-Free1
61470524.07610003.000.00440 dB1Effect of measurement noise
71470524.07610003.000.00430 dB1
81470524.07610003.000.004Noise-Free2Effect of traffic flow
Table 3. Comparison of vertical displacement of different methods.
MethodsBlind Source SeparationTransmissibilityDirect Measurement by AccelerometerDirect Measurement by Total Station
Vertical displacement
(mm)
2.152.092.182.24
Publisher’s Note: MDPI stays neutral with regard to jurisdictional claims in published maps and institutional affiliations.

