
How Facial Symmetry Influences the Learning Effectiveness of Computer Graphic Design in Makeup Design

Department of Applied Cosmetology, Lee-Ming Institute of Technology, New Taipei 24346, Taiwan
Symmetry 2022, 14(10), 1982; https://doi.org/10.3390/sym14101982
Submission received: 26 August 2022
/
Revised: 16 September 2022
/
Accepted: 17 September 2022
/
Published: 22 September 2022
Abstract
:This study explored the learning effectiveness of drawing makeup designs by computer graphic design and compared the learning differences between traditional hand-drawn and computer-assisted teaching in cosmetology students at universities. The statistical analysis methods of factor analysis, descriptive statistical analysis, and paired sample t-test are used to analyze the difference in students’ learning attitudes before and after the course. It also explored students’ learning effectiveness. The subjects were 55 students from a cosmetology department of a university in Taiwan. The results showed that using a computer tool to create makeup designs improved the overall student learning effectiveness and effectively promoted students’ interest in learning. Moreover, through focus group interviews, changes in the learning effectiveness that were brought about by the use of computer graphic design tools were obtained. Among them, the mirror function could best meet the needs of students for makeup symmetry and design drawing speed and improve their satisfaction with computer graphic makeup. The results of this study are improving the learning effectiveness, maintaining a positive attitude and increasing willingness to learn, and the systematization and digitization of makeup design, and the results could promote teachers to obtain more efficient teaching quality, improve students’ professional skills, and result in better learning results.
1. Introduction
The coronavirus (COVID-19) pandemic disturbed education worldwide, and higher education institutions were abruptly forced to switch to online teaching and electronic learning [1,2,3,4,5,6]. In general, the teaching of makeup design is demonstrated on paper by the instructor. Makeup design is a key basic course in the department of applied cosmetology and an item that needs to be prepared for Level B Beauty Technician Certificates in Taiwan [7]. It is also one of the important skills that is required in the future cosmetology workplace. However, questions remain about how the functional benefits of computer technology can be applied to the field of education to improve learning efficiency. The purpose of this study was to explore how to integrate computer-assisted instruction (CAI) makeup education into a modern scientific teaching model. Some experts have suggested the difference between [t computer drawing and traditional drawing is that individuals can draw without carrying paper, painting tools, and pigments [8]. This finding is consistent with that of Hsu et al. [9], who pointed out digitalization is free from the limitation of tools. When students draw by hand and want to change some contents, they need to redraw the whole design, which is time consuming. The mirror function can solve some of the problems that are faced by paper drawing. Using the mirror function, makeup design drawing is faster, more symmetrical, balanced, and beautiful. The colors are more diverse [10], color changing is faster and time-saving, and the works can be easily saved. The points that are mentioned above are all issued faced by using cartridge paper for makeup design drawing [9]. The teaching method of CAI could be the start of another wave of teaching reform. Therefore, the learning effectiveness of applied computer graphic design teaching methods to makeup teaching design was studied in this paper. Many functions of computer graphic design accelerate students’ drawing speed. In Taiwan, Level B and Level C Beauty Technician Certificates are necessary conditions for make-up artists. According to the source of Workforce Development Agency, Ministry of Labor, the C-level certificate test started since 1992 and the B-level certificate test started since 1996. It has been nearly 30 years that paper makeup training remained unchanged. It is now time that the education model must have an evolution and breakthrough, therefore, we wanted to study and construct a set of teaching models advancing with the time [9]. The content of these certification examinations includes hand-drawn paper drawings and live makeup. The initial learning goal of learners is to create makeup design drawings. Moreover, the learning and training of makeup start with symmetry because symmetrical makeup is also a primary requirement of the Beauty Technician Certificate [7,9].
Due to the rapid development of information technology, information education has received increasing attention. The combination of computer graphic design and teaching is a positive development trend in higher education. CAI is a teaching technique that combines computer technology with learning concepts. A study report showed the diversified teaching methods of computers could spread teaching materials through texts, sounds, images, animations, film, and other multimedia channels, providing a more interesting learning experience for learners and improving their learning motivation and concentration. Electronic or online learning was defined by Howlett et al. [11] as “the use of electronic technology and media to deliver, support, and enhance both learning and teaching and involves communication between learners and teachers utilizing online content.” Many studies have confirmed the CAI teaching method is indeed more effective than conventional teaching at improving students’ learning effectiveness [12,13,14,15]. Online learning can provide students with “easier and more effective access to a wider variety and greater quantity of information” [16]. Other scholars have suggested diversified communication using information technology can improve learning effectiveness [17,18,19,20]. Generation Z is the generation that was born between the late 1990s and the early 2010s. As the first generation that was born in the era of smartphones and social media, they participate in social networks through the connection of digital devices, and they can skillfully use mobile devices for virtual interactions and information reception [21]. According to Ajmain et al., who explored the impact of Industrial Revolution 4.0 on generations, the social communication skills of Generation Z are deeply influenced by modern technology, because Generation Z is proficient in information and communication technology [22]. Therefore, in the face of the rapid technological development of the film and television era, cultivating students’ creative thinking is an important educational direction in response to the rapidly changing world [23,24,25,26]. Applications of technological products and devices are becoming increasingly popular. Harrison and Rainer [27] pointed out that the use of computers in the workplace has become an inevitable trend; however, some people still refuse to use computers. Anxiety about the use of computers and a lack of ability may be the reasons for their refusal. At present, the design departments of universities and colleges in Taiwan regard computer graphic design as a necessary skill for designers [28]. Under the high competition of globalization, the ability of professionals must be improved to ensure Taiwan can maintain high competitiveness. In addition, because of the ability to quickly obtain information, generation Z has life attitudes, values, and interaction forms that are different from their parents, who belong to generation X or Y [29]. Many researchers have pointed out that the subjective norm is an important factor influencing the acceptance of technology. It directly affects the beliefs of individuals and their intention to use scientific and technological equipment [30,31,32]. People’s innovativeness related to information technology refers to the willingness of individuals to use information technology, which also refers to the stable emotions of individuals under specific circumstances. This innovativeness has a certain impact on individuals when it comes to information technology [33]. Generally speaking, people with innovativeness have higher self-confidence in their work efficiency and adaption to new environments [34].
According to Ku and Lohr [35], in terms of learning attitude, most students tend to have a positive attitude towards courses or teaching methods utilizing CAI. Users’ acceptance and use intention depend on the length of time they use a scientific and technological products, the convenience and usability of the product, and the knowledge accumulation and training time of the individuals related to scientific and technological products [36]. Teng [37] once invited experts to discuss the advantages and disadvantages of computer graphic design teaching methods in the form of group interviews and collected material on the students’ cognition before learning and their study notes after learning. Through quantitative analysis, he constructed a course with a V-shaped structure, using conventional design education as the main axis and computer graphic design as the auxiliary. The finding of Teng’s study shows the factors influencing the effect of computer graphic design learning are the learning of basic design courses, the learning attitude of the students, the time that is spent by students practicing on the computer, the learning of basic computer courses, and the teaching methods of teachers. In particular, students’ familiarity with drawing software and their design ability both affect their willingness to use computers. In terms of teaching content, primary computer graphic design teaching focuses on operational teaching, with software instructions and tool introductions as the main content [28].
Alessi and Trollip [38] pointed out the complete teaching procedures of CAI include the four steps of presenting information, guiding the student, practicing, and assessing student learning. Johnson studied and compared the expression methods of computer image art and traditional art and mentioned the artistic expression of computer images in aesthetic formalism can also present the expression of traditional art [39].
However, computer graphic design has not been used in the teaching of makeup design drawing; instead, learners rely on knowledge from professors and the experience they accumulate through practicing drawing on paper [9]. Thus, this study sought to employ such technology to improve upon conventional hand drawing practice techniques. The disadvantages of the existing methods are students adapt to the teacher’s traditional hand- drawing teaching model, the digital teaching model has not been developed, it cannot conform to the changes in industry trends. To define the mainstream research direction is to develop digital teaching model to solve the problems that are faced by makeup design, and the results achieved are as follows:
- Creative design: unlimited color creation, correction is quick, and easy to use.
- Repeated practice: there is no limitation on color change and correction and makeup design drawing works can be easily kept and stored.
- Teaching flipping: change the traditional hand-drawing teaching method for students to accommodate teachers, distance teaching, online communication, and revision design.
Therefore, this study explored the application of computer graphic design to makeup design, changed the subjective scoring standard of the previous system, and gave scores in an objective and open manner through the use of rubrics. A two-stage experiment was designed that combined quantitative and qualitative methods. The first stage was to carry out a single-group pre- and post-test experimental study of computer graphic design teaching on the subjects. The pre- and post-test were carried out before and after the course teaching. There was no computer graphic teaching content in the pre-test. However, after learning about graphic software, related questions were added in the post-test. The differences between the pre- and post-test were summarized through a Likert scale questionnaire and Statistical Package for Social Sciences (SPSS) statistical analysis, and focus group interviews were conducted. The second stage was a self-assessment questionnaire on learning effectiveness and the comparison of hand-drawn works with computer drawing achievements. Through the rubric assessment method, the students’ learning effectiveness related to drawing makeup designs by computer graphic design was analyzed and clarified. The rubrics were composed of three elements: evaluation criteria, scoring strategies, and quality definitions, which helped the students understand the learning objectives in advance. This stage of the experiment aimed to help teachers improve teaching quality and efficiency and allow students to obtain better learning effectiveness. The purposes of this study were as follows: (1) to explore the differences in learning attitudes between hand drawing and computer graphic design; (2) to analyze the learning results of computer graphic design; and (3) to compare the expressive abilities of students between hand drawing and computer graphic design based on their drawing achievements. The results of this study are improving learning effectiveness, maintaining a positive attitude and increasing willingness to learn, and the systematization and digitization of makeup design and the results could promote teachers to obtain more efficient teaching quality, improve students’ professional skills, and result in better learning results [9,10,28,35,37,38]. The results of this study also increase creative development and re-establish the channels and methods of interdisciplinary teaching in makeup courses.
2. Materials and Methods
This study was divided into two stages based on quantitative and qualitative study methods. The first stage was the single-group pre- and post-test experimental design of the pre-and post-experimental learning attitude questionnaire. The study content was the experimental research on the subjects’ drawing teaching. The pre- and post-test were carried out before and after the course. The pre-test time was before teaching the drawing software. The drawing software teaching course was held for two hours per week. After 15 weeks of teaching, a post-test questionnaire was conducted to measure the responses of the participants [40].
The second stage was a self-assessment questionnaire on the learning effectiveness and the drawing work evaluation rubric. Focus group interviews were conducted during this stage. According to Montgomery [41], most students do not understand the determinants of their homework performance. Therefore, a set of open, fair, and impartial scoring criteria is required to relieve learners’ doubts about their homework performance and enable them to understand the evaluation results. Qualitative assessments are the biggest difference between the use of rubrics and other educational assessment methods, as they can not only help teachers understand students’ learning achievements but also help students understand their own learning achievements. Rubrics can also help students improve their learning achievements [42,43,44,45]. Popham mentioned rubrics must have evaluation criteria, scoring strategies, and quality definitions. He also pointed out that excessively-long descriptions of the norm’s contents make rubrics difficult to read and use [46]. Some reports have indicated rubrics provide the use of teaching evaluation and support the evaluation of evidence and teaching and learning projects [47,48,49]. Researchers have emphasized the teaching value of rubrics and urged teachers to use them as a teaching guide rather than just a scoring tool [45,48].
Teachers often use rubrics to grade students’ work. When determining the quality of students’ work, the teachers’ factors should also be taken into account. Rubrics can also be described as a set of indicators or guide lists, and the feature description of their standard level reflect the importance of the judicial process and content [50,51,52]. Students’ homework quality can be graded according to various qualities, such as “excellent”, “good”, “basic”, and “to be improved” [53]. In this study, two full-time teachers scored the students’ works according to rubrics. Moreover, surveys in the form of focus group interviews were conducted to collect the qualitative data that were required for this study.
2.1. Participants
In this study, computer graphic design tools were employed in the professional makeup course of a cosmetology department in a university in Taiwan. The test criteria and standards were the makeup design drawings of the Level B Beauty Technician Certificates that were issued by the Republic of China (ROC) Ministry of Labor. The participants were senior students of a cosmetology department in a university. Moreover, the application results of the computer graphic tools that were used in the teaching of makeup design drawing were analyzed. There were 55 subjects in the first stage of the experiment. The subjects were between 21 and 23 years old, had already obtained the Level C Beauty Technician Certificates that were issued by the ROC Ministry of Labor, and had no experience in computer graphic design. Besides, they were students from the department of applied cosmetology of the university. In the second stage, the 55 subjects filled out a self-assessment questionnaire on learning effectiveness as well as drew works by hand and by computer, respectively. There were two experts who then scored these works according to the rubrics. The experts were professional teachers with Level B Beauty Technician Certificates issued by the ROC Ministry of Labor and more than five years of continuous experience in makeup teaching.
2.2. Instruments
To achieve the study purpose, this research integrated the teaching of computer graphic design into makeup design to carry out the experiment and collect the data. The quantitative data included a questionnaire on pre-learning and post-learning attitudes, a learning effectiveness questionnaire, and a drawing work evaluation rubric. The qualitative part was the focus interview outline.
2.2.1. Questionnaire on Pre-Learning and Post-Learning Attitude
The main purposes of this study were to analyze the changes in the students’ learning attitudes before and after the experiment of computer graphic design teaching, and to collect study data using a self-made learning attitude scale. According to the purpose of this study, the learning attitude scale was divided into three parts of learning willingness, use of tools, and problem-solving. A five-point Likert scale was adopted for scoring, ranging from 1 (strongly disagree) to 5 (strongly agree). A higher score indicated a higher satisfaction of the students and a stronger willingness to learn. Experts and scholars provided revision opinions on the learning attitude scale, and the reliability analysis was conducted after establishing the content validity. The questionnaire was divided into the pre-learning and post-learning parts. A Cronbach’s α value was used for testing the pre-learning part. The result showed the α value was 0.803, indicating good internal consistency of the overall scale. The Cronbach’s α value was also used for testing the post-learning part. The results showed the α value was 0.901, indicating the overall subjective questionnaire was reliable [54]. After the questionnaire was confirmed to be credible, the SPSS narrative statistical evaluation method was used to detect whether there were biased items that need to be deleted. In addition, the paired t-test was used to verify the pre-learning and post-learning parts and analyze whether the differences between them had statistical significance.
2.2.2. Learning Effectiveness Questionnaire
This study analyzed the learning effectiveness of makeup design drawing by computer graphic design. The drawing software that was used for teaching was the best computer makeup drawing tool tested by Hsu et al. [9]. The study results were used to build a stroke database of Painter drawing tools for application in makeup design drawing and develop teaching models to improve the teaching of makeup design drawing. Based on the optimal drawing tool determined for each face part, 15 weeks after the teaching of the computer graphic design course, a learning effectiveness questionnaire was conducted to further understand the learning effectiveness of the subjects. The questionnaire was mainly based on the Kirkpatrick effectiveness assessing theory [55,56]. At the same time, the evaluation scale of Chan [57] was modified into the required self-evaluation questionnaire for learning effectiveness, and a five-point Likert scale was used for scoring the questionnaire. A total of 55 valid questionnaires were obtained after testing and were analyzed by SPSS statistical analysis. First, the reliability analysis was conducted. A Cronbach’s α value was used to test the reliability of the questionnaires. The result showed the α value was 0.982, indicating the internal consistency of the overall questionnaire was high. The Kaiser–Meyer–Olkin (KMO) value and Bartlett’s spherical test were examined to test whether this group of questionnaires was suitable for factor analysis. If suitable, the next step would be to use principal component analysis to extract factors and select those with a characteristic value greater than 1, followed by using the varimax to carry out factor rotation. The rotation results could explain the degree of correlation between factors.
2.2.3. Drawing Work Evaluation Rubric
In this study, the main purpose of the drawing work evaluation rubric was to compare the performance of the students’ hand-drawn works with the computer graphic works after the students received the computer graphic teaching and let the students know how to use rubrics to achieve high scores and improve their academic performance [58,59,60,61]. A makeup design template and standards for evaluating makeup design from the Republic of China examination for the Level B (advanced level) Technician for Beauty Certificate [7], as shown in Figure 1a,b, and Figure 1c was the computer graphics makeup design after the students received the computer graphic teaching. The content of the rubrics came from the compilation and collation of the scoring criteria for the Level B Beauty Technician Certificates that were issued by the ROC Ministry of Labor [7]. After consulting with the experts, the content validity of the drawing work evaluation rubric was established, and the last revision was made for the appropriateness and relevance of the content of the evaluation, as shown in Table 1. The evaluation items were divided into the seven items of eyebrow, eyeliner, eye shadow, nose shadow, blush, lipstick, and full face, which were made into a five-grade rubric scale. The contents revealed that the makeup of each item had symmetry requirements, proving the importance of symmetry when doing makeup [62,63,64,65]. After completing the hand-drawn works and computer graphic works, two experts in the field of makeup were hired to score the works according to the five grades, and the final score was the average of the two experts. For example, if the first item (eyebrow) of a student’s work was given four points by the first expert and three points by the second expert, the student’s score for this item would be 3.5 points.
2.2.4. Focus Interview Outline
This study explored students’ views on the teaching of computer graphic design and the learning process of using computer graphic design tools after the teaching of computer graphic design, as well as to understand the inspiration and learning effectiveness of learning computer graphic design tools. This study recruited 25 students (with S01 representing the first student and S02 representing the second student, etc.) to conduct focus group interviews. The interview outline included the learning process, the feeling of using computer graphic design tools, learning attitude, and problem-solving. The interviews were conducted after establishing expert validity.
2.2.5. Data Analysis
According to the research questions, this study classified the categories of material into learning attitude and learning effectiveness. The quantitative data were analyzed by factor analysis, descriptive statistical analysis, and the paired sample t-test using SPSS 18.0 statistical software. The qualitative data were analyzed after being coded. The results were classified using a question-focused approach, and the analysis and interpretation of each topic category were also developed.
3. Results and Discussion
This study investigated changes in the learning attitude of senior students in a cosmetology department before and after the teaching experiment.
3.1. Analysis of Learning Attitude toward Computer Graphic Design
The study data were collected using the self-made learning attitude scale, and the single-group pre- and post-test experimental design was adopted. The questionnaires on pre-learning and post-learning attitudes were presented before and after the teaching, and 49 effective samples were obtained. The contents of the pre-learning and post-learning attitude questionnaires included the students’ use of tools, how the students solved problems, and the changes in the students’ attitudes before and after learning. After the descriptive statistics (Table 2 and Table 3) and paired sample t-test (Table 4), the analysis results were presented in the following sections.
3.1.1. Descriptive Statistics of Learning Attitude
The mean value of each item should tend to the middle value, and items with a high or low mean value have low discrimination or obvious deviations and should be deleted. As shown in Table 2, the mean = 2.18–4.78, SD > 0.7, and the absolute value of bias were all greater than 0.7. In Table 3, the mean = 2.49–5.01, SD > 0.7, and the absolute value of bias were all less than 0.7. Therefore, there were no items to be deleted. The mean of 3.48 in the pre-learning test (pre-learning test, PR) and the mean of 3.75 in the post-learning test (post-learning test, PO) indicated the score of the post-learning test was higher. The mean value/standard deviation (SD) of pre-learning attitude and post-learning attitude is shown in Figure 2a,b. In the post-learning test, PO7 (“Mirror tools are easy to use”), with a mean of 4.1, had the highest score in the questionnaire. In the focus group, the subjects mentioned the mirror tool made their drawing speed become twice as fast. The subjects could get a complete and balanced makeup design more quickly, which improved their confidence and interest in using computer graphic design. PO1 in the post-learning test (degree of interest), with a mean of 3.98, had the second highest score in the questionnaire. PO10 in the post-learning test (“The zoom function is easy to use”), with a mean of 3.98, also had the second highest score in the questionnaire. PR13 in the pre-learning test (“Be able to solve the problem by myself”), with a mean of 2.94, had the lowest score on the questionnaire, because the subjects had not learned computer graphic design before, had no confidence in themselves, and could not solve problems on their own. In the descriptive statistical analysis, three question items had the highest standard deviations. The first item was PR7 in the pre-learning test (“Mirror tools are easy to use”), with SD = 1.031, which was the maximum value of SD in the questionnaire. Some subjects mentioned in the focus group interview they did not know the convenient and fast function item of the mirror tool before, so they gave this item a low score. The next item was PO2 in the post-learning test, with SD = 0.980, indicating the subjects were still not satisfied with their current work and that their ability needed to be enhanced. The last item was PO4 in the post-learning test, with SD = 0.969, indicating the subjects did not agree that computer graphic design could improve the ability to draw makeup by hand. There were three questions with the lowest SD: PO5 in the post-learning test (SD = 0.717), indicating the newly files were easy to add after learning; PO8 in the post-learning test (SD = 0.735), indicating the students expected they would be satisfied with their drawing works in the future before learning computer graphic design, whereas they found that they needed more practice after learning; and PR12 in the pre-learning test (SD = 0.742), indicating that before learning, the subjects anticipated they could ask the teacher for help when they encountered problems. A study integrating art teaching and the application of computer technology and multimedia showed that computer technology is suitable for current art creation and art education. The combination of computer science and technology with artistic creation is one of the main ways for the future development of art education, as it can improve the learning experience of learners and provide them with a more interesting learning experience. At the same time, this combination can also effectively improve learning effectiveness. Therefore, it has become a modern teaching trend to initiate training in computer science and technology in school education and integrate technology into school teaching [66,67].
3.1.2. Paired Sample t-Test of Learning Attitude
According to the results of the questionnaire, the items with the most significant results (p < 0.05 significance) were the questions that were related to the students’ usage of tools, indicating they had the same cognition before and after learning. A p = 0.032 < 05 of the newly added files indicated the students found the new files to be easy to use; p = 0.000 < 0.01 of the transparency tools indicated the students found the transparency tools to be very easy to use; p = 0.003 < 0.01 of the mirror tools indicated the students found the mirror tools to be very easy to use; p = 0.000 < 0.01 of the layer tools indicated the students found the layer tools to be very easy to use; and p = 0.017 < 0.05 of the zoom function indicated the students found the zoom function to be easy to use. For the item of asking how students solve problems, the result was significant (p < 0.005). p = 0.002 of pair 13 indicated the students considered they could solve problems on their own. The statistical analysis results of the paired sample t-tests for learning attitude were as follows: (1) there were many significant results in the question items about the usage of tools, indicating the learning effectiveness was significantly improved; and (2) in terms of problem-solving, the students could solve problems by themselves after learning computer graphic design. Based on the above-mentioned points, it could be concluded that the students had a positive evaluation of computer graphic design learning. To explore the qualitative data of the students’ learning effectiveness of computer graphic designs and the learning process of using computer graphic design tools, this study conducted group interviews. A total of 25 students participated in the focus group interviews. The interview results showed the students felt the computer graphic tools were easy to learn, and they had a sense of achievement from using the tools. For example, 23 students agreed with the statement: “When I know that I will learn computer graphic design to draw makeup designs, I feel very excited and interested”. A total of 23 students specified they were satisfied with the computer graphic design effectiveness and had gained one more skill after learning”. A total of 20 students pointed out the mirror function was easy to use, could accelerate the drawing speed, and was fast and convenient. A total of 15 students stated the free color change was fast and easy, did not require carrying a lot of makeup tools, and had numerous colors on the palette. There were nine students that specified it allowed them to recover and restore previous actions when making mistakes. They also stated the correction, recovery, and deletion functions were fast, and that more attempts could be made. A total of eight students pointed out that in the past, they could only draw makeup by hand. They could create more designs and make changes using a computer. There were seven students that specified their favorite function was the symmetrical result of eyebrow drawing, which provided the most sense of achievement. The students also stated the disadvantage of computer graphic design was that the finished works were different from what the students had imagined. There were five students that argued they did not have enough practice time and forgot the functions of the tools. A total of three students thought it was still more convenient to draw by hand, and that some skills could only be drawn by hand. In terms of the learning attitude, most students tended to create drawings without discussing them with others. Self-efficacy in computers refers to an individual’s ability to judge different situations when using a computer [68,69,70]. People’s higher self-efficacy in computers may have a positive effect on the use of information technology and increase the frequency of using information technology [70]. The learning attitude scale before and after the two creative activities examined the change in students’ learning attitudes. This study found the students’ use of computer graphic design increased their creative motivation, self-confidence, painting ability, and work satisfaction. After appropriate teaching guidance, the students’ interest in computer graphic design was continuously improved. Uribe, Klein, and Sullivan [71] conducted a study in the form of paired and individual learning and found that students all hold a positive attitude. Levine [72] also found college students’ self-efficacy to be closely related to the selection of computer courses, the adoption of high-tech products, and their performance in software training. During the interviews, the students mentioned they liked to draw eyebrows using computer graphic design the most, and the results showed the function of this item had the best performance. As discussed above, the feelings of the learning process were also reflected in the results, and the related drawing ability was also positively affected. Moreover, because the presentation and details of the works required elaboration of the students, they continuously drew and modified through computer graphic design to enhance their works.
3.2. Analysis of the Learning Effectiveness of Computer Graphic Design
To understand the students’ learning effectiveness of computer graphic design and the comparison between the use of hand drawing and computer graphic design to create makeup design drawings, this study adopted a two-stage experiment that was based on the learning effectiveness questionnaire and the drawing work evaluation rubric. A total of 55 effective samples were obtained from each item in the questionnaire and drawing work evaluation rubric, after which the SPSS data were analyzed.
3.2.1. Learning Effectiveness Questionnaire
This study conducted a reliability analysis of the learning effectiveness questionnaire to measure the reliability and validity of the statistics. The Cronbach’s α value of the questionnaire was 0.982, the effective observation value was 55, and the questionnaire had 23 items (Table 5). The KMO value was 0.926 after the data were verified by the KMO test and Bartlett’s test. According to the KMO value > 0.8, the original variable was suitable for factor analysis. The Bartlett’s spherical verification value was 1680.298, the degree of freedom (df) was 253, and the significance level was 0.000, indicating the data were suitable for verification using the factor analysis method. The unsuitable items were deleted by the factor analysis, and the main component analysis method employed the extraction method. The factor load after rotation was set to 0.45, and components with a factor load that was lower than 0.45 were deleted. According to the factors with a characteristic value that was greater than 1, three main factor component facets (Table 6) in a scree plot were selected and rotated with the maximum variation rotation axis method (V) to obtain the component matrix after rotation. The rotation axis converged to 11 iterations, and the cumulative explained variation was 81.78. The first component facet was learning effectiveness, the second component facet was skill enhancement, and the third component facet was practical application. Regarding learning effectiveness, the Cronbach’s α value of the questionnaire was 0.971, the characteristic value was 8.279, and the explained variation was 71.514. Regarding skill enhancement, the Cronbach’s α value of the questionnaire was 0.959, the characteristic value was 6.387, and the explained variation was 6.040. Regarding practical application, the Cronbach’s α value was 0.944, the characteristic value was 4.142, and the explained variation was 3.225.
3.2.2. Drawing Work Evaluation Rubric
The scoring results of the experts based on the rubrics for each face part were tested using descriptive statistics and the paired t-test to detect whether there were significant differences in the scores. Reliability analysis was performed to measure and evaluate the reliability statistics of the questionnaire. After the descriptive statistics (Table 7 and Table 8) and paired sample t-test (Table 9), the analysis results were as shown in the following sections.
- Descriptive statistics
First, a reliability analysis of the hand-drawn work evaluation rubric was carried out to evaluate the reliability statistics of the questionnaire. The Cronbach’s α value was 0.679, indicating the internal consistency of the overall scale was acceptable. The effective observation value was 55, and there were seven items in the questionnaire (Table 7). The mean of each item was expected to tend to the middle value; items with excessively high or low means would indicate low discrimination or obvious bias and need to be deleted. As shown in Table 7, the mean was 2.66 for the whole scale and all the mean values were between 1.48–3.84, SD > 0.7, except for lips = 0.604 < 0.7. The descriptive statistical results showed the mean and SD of the parts with the top three high scores in hand-drawn makeup design were: blush (mean = 2.78, SD = 0.832); nose contour (mean = 2.75, SD = 0.844); and full face (mean = 2.75, SD = 0.775). Next, the reliability analysis of works that were done by the computer graphic evaluation rubric was carried out to evaluate the reliability statistics of the questionnaire. The Cronbach’s α value of the questionnaire was 0.766, indicating the internal consistency of the overall scale was good. There were 55 valid observation values and seven items in the questionnaire. According to Table 8 (the descriptive statistics rating for computer graphic works rubric), the mean was 2.834 for the whole scale, indicating the computer graphic works received higher scores. Moreover, the average scores of the top three items are: eyebrows (mean = 3.18, SD = 0.905); lips (mean = 3.02, SD = 0.913); and eyeliner (mean = 2.93, SD = 0.959). According to the above results, it could be found that in terms of the dyeing effect of the makeup design drawing, the computer graphic design was poor, while in terms of symmetry, it had great advantages. Each mean was between 1.619 and 4.049, SD > 0.7 (nose contour = 0.679 < 0.7; blush = 0.655 < 0.7), and the absolute value of bias was less than 0.7 (blush = 1.409 > 0.7; full face makeup = 0.810 > 0.7). Therefore, blush showed an obvious bias in computer graphic design. Among the items, the mean for computer graphic drawing eyebrows was 3.18, which was the highest score in the questionnaire. The mean value/SD of hand drawing and computer drawing is shown in Figure 3. During the focus interviews, the subjects liked drawing eyebrows using computer graphic design the most. With the help of the mirror tool, their drawings could be completed quickly, their works were balanced and beautiful, and the students had a sense of achievement. Therefore, the results of computer graphic design learning were fully reflected in the results of the final works. Computer graphic drawing lips, with a mean of 3.02, had the second highest score in the questionnaire. Painter drawing eyeliner, with a mean of 2.93, had the third highest score in the questionnaire. The lowest score in the questionnaire was computer graphic drawing blush, with a mean of 2.40, and this item had an obvious bias. The experts pointed out that when drawing with a computer, heavy strokes affect the presentation of uniform naturalness. The students understood how to use hand drawing as a tool, and it had the advantage of controlling the force when dyeing. Therefore, hand drawing blush, with a mean of 2.78, was greater than computer graphic drawing blush, with a mean of 2.40, while hand drawing nose contour, with a mean of 2.75, was greater than computer drawing nose contour, with a mean of 2.73.
- 2.
- Paired sample t-test of hand drawing and computer drawing
First, reliability was tested by Cronbach’s α value. The value of Cronbach’s α was 0.810, indicating the internal consistency of the overall scale was good. The results of the paired sample t-test (Table 9) indicated the t-value for eyebrows was −3.521, p = 0.001 < 0.0.01. As the above result was very significant, the computer graphic design performance of eyebrows was better than that of hand drawing. The t-value for eyeshadow was −2.170, p = 0.034 < 0.0.05. The result was significant, indicating the computer graphic design performance for eyeshadow was better than that of hand drawing. The t-value for eyeliner was −2.018, p = 0.049 < 0.0.05. As the above result was very significant, the computer graphic design performance for eyeliner was better than that of hand drawing. The t-value for blush was 2.859, p = 0.006 < 0.0.05. As the result was significant, the computer graphic design performance for blush was better than that for hand drawing. The t-value for lips was −4.307, p = 0.000 < 0.0.01. As the result was very significant, the computer graphic design performance for lips was better than that for hand drawing. From the above results, it could be seen that except for nose contour, computer graphic design was superior to hand drawing in all parts of the makeup design process. According to the reviewers, the rubric criteria for nose contour focused on even, natural, and stereoscopic factors. The nose contour should be modified according to the face shape to exhibit local symmetry and help the nose stand out, and the scope is very small. However, when drawing by computer, heavy strokes affected the presentation of uniform naturalness. Attention only needed to be paid to symmetry when drawing by hand. Therefore, the score of this item was poor. In this study, the students generally believed computer graphic design was easy to use and enhanced their self-confidence.
4. Conclusions
This study explored the differences between the learning attitudes toward hand drawing and computer graphic design, analyzed the learning effectiveness of computer graphic design, and compared the various performances of the computer graphic design results. To explore the difference between the learning attitudes of hand drawing and computer graphic design: The students all had a positive attitude towards using computer graphic design. Among the available tools, the mirror tool, which can present a symmetry effect, was the students’ favorite tool. In addition, the rich palette tools and multi-style brushes also stimulated the students’ willingness to accept and use computer graphic design. According to the results of the two questionnaires and interviews, most of the students preferred to use computer graphic design. Finally, they achieved improvements in their self-confidence and gained enhanced drawing abilities. Therefore, this study inferred that computer graphic design is helpful to improve the satisfaction of drawing. To analyze the learning effectiveness of computer graphic design: Through the questionnaire that was used to evaluate the students’ attitude and ability to use computer graphic design, this study found tool usage to be the item with the most progress and the highest satisfaction. Most of the functions were easy to use after teaching, but some students stated they sometimes forgot to use the layer tools to add layers, and they did not want to use other tools with which they were not familiar. Moreover, the students tended to solve problems by themselves or by discussing them with their classmates after learning how to use the software. They would only seek the help of teachers when they encountered difficulties that they could not solve by themselves. Therefore, this study inferred that the students were willing to actively learn computer graphic design and cultivate their own ability to solve problems. Students should be given enough practice time to fully understand and be familiarized themselves with the usage of tools. The comparison of various performance results of computer graphic design: Hand drawing was known to the students, and the force control of strokes when dyeing was advantageous. The experts mentioned that when the students created makeup designs via a computer, they were unable to control the process well due to being unskilled, which affected the presentation of uniform naturalness. However, after learning computer graphic design, most of the students were satisfied with the results and commented they had acquired a new skill. Many students expressed the convenience of the mirror symmetry function, as it could speed up the completion of the drawings and achieved symmetrical makeup designs; hence, the work could be presented faster and result in a sense of achievement.
The subjects of this study were the senior students of a cosmetology department of a university in Taiwan. It is suggested that the scope of the study and the subjects be expanded in future research to explore the differences in the performance of students of different years in using computer graphic design. For the study of design, the number of creative samples can be increased in future studies to further study how to enhance students’ creative ability with computer-assisted makeup design, thereby expanding the depth and practicality of the study.
Further exploration and more specific future research directions in the future are: (1) First, transitioning to fully digital teaching is important, (2) further research into automatic face morphing transfer from 2D images to 3D models, (3) eventually form 3D models to augmented reality (AR), virtual reality (VR), mixed reality (MR) applications, and then into the world of the Metaverse.
Funding
This study was supported by the Ministry of Science and Technology, Taiwan, under grant No. MOST108-2635-E-234-002.
Institutional Review Board Statement
Not applicable.
Informed Consent Statement
Not applicable.
Data Availability Statement
Links to publicly archived datasets not available, data will be provided upon request.
Acknowledgments
The author would like to thank Chih-Fu Wu and Wei-Jen Cho for the support and suggestions that were received.
Conflicts of Interest
The author declares no conflict of interest.
References
- Bashitialshaaer, R.; Alhendawi, M.; Lassoued, Z. Obstacle comparisons to achieving distance learning and applying electronic exams during COVID-19 pandemic. Symmetry 2021, 13, 99. [Google Scholar] [CrossRef]
- World Health Organization. Corona Virus Disease (COVID-19): Question and Answer. 2020. Available online: https://www.who.int/ar/emergencies/diseases/novel-coronavirus-2019/advice-for-public/q-a-coronaviruses (accessed on 17 May 2020).
- Baticulon, R.E.; Sy, J.J.; Alberto, N.R.I.; Baron, M.B.C.; Mabulay, R.E.C.; Rizada, L.G.T.; Tia, C.J.S.; Clarion, C.A.; Reyes, J.C.B. Barriers to online learning in the time of COVID-19: A national survey of medical students in the Philippines. Med. Sci. Educ. 2021, 31, 615–626. [Google Scholar] [CrossRef] [PubMed]
- Shivangi, D. Online learning: A panacea in the time of COVID-19 crisis. J. Educ. Technol. Syst. 2020, 49, 5–22. [Google Scholar]
- Jahodova Berkova, A.; Nemec, R. Teaching theory of probability and statistics during the COVID-19 emergency. Symmetry 2020, 12, 1577. [Google Scholar] [CrossRef]
- Nemec, R.; Jahodova Berkova, A.; Hubalovsky, S. Identification elements symmetry in teaching informatics in czech secondary school during the COVID-19 outbreak from the perspective of students. Symmetry 2020, 12, 1768. [Google Scholar] [CrossRef]
- He, L.Y.; Zhuang, M.F. The Complete Guide to the Academic Subject of Level B Beauty Skills Verification; Chuan Hwa Book Co., Ltd.: New Taipei, Taiwan, 2018. [Google Scholar]
- Casciato, P. British Artist David Hockney Hails Ipad as New Art Tool. Available online: http://www.artdaily.org/index.asp?int_sec=2&int_new=38590 (accessed on 8 July 2011).
- Hsu, H.-H.; Wu, C.-F.; Cho, W.-J.; Wang, S.-B. Applying computer graphic design software in a computer-assisted instruction teaching modell of makeup design. Symmetry 2021, 13, 654. [Google Scholar] [CrossRef]
- Cho, J.; Ohya, J.; Park, S.I. Makeup interpolation based on color and shape parametrization. Symmetry 2019, 11, 1422. [Google Scholar] [CrossRef]
- Howlett, D.; Vincent, T.; Gainsborough, N.; Fairclough, J.; Taylor, N.; Cohen, J.; Vincent, R. Integration of a case-based online module into an undergraduate curriculum: What is involved and is it effective? e-Learning 2009, 6, 372–384. [Google Scholar] [CrossRef]
- Budoff, M.; Thormann, M.J.; Gras, A. Microcomputers in Special Education: An Introduction to Instructional Applications; Brookline Books: Cambridge, MA, USA, 1984. [Google Scholar]
- Ostler, E. Art and Technology Integration Project: Year 1 Status Report. P.1-77; University of Nebraska at Omaka: Omaka, NE, USA, 1996. Available online: https://eric.ed.gov/?id=ED398906 (accessed on 22 May 2022).
- Basturk, R. The effectiveness of computer-assisted instruction in teaching introductory statistics. J. Educ. Techno. Soc. 2005, 8, 170–178. [Google Scholar]
- Simarmata, J.; Limbong, T.; Napitupulu, E.; Sriadhi, S.; Tambunan, A.R.S.; Sinaga, E.K. Learning application of multimedia-based-computer network using computer assisted instruction method. Int. J. Eng. Technol. 2018, 7, 341–344. [Google Scholar] [CrossRef]
- Razavizadeh, S. Identify The Critical Success Factors (CSF) Universities E-Learning Centers in Iran and Evaluation of These Factors in Shahid Beheshti University; Shahid Beheshti University: Tehran, Iran, 2016. [Google Scholar]
- Alavi, M.; Wheeler, B.C.; Valacich, J.S. Using IT to reengineer business education: An exploratory investigation of collaborative tele-learning. MIS Q. 1995, 19, 293–313. [Google Scholar] [CrossRef]
- Rice, A.S.C. Topical spinal administration of a nitric oxide synthase inhibitor prevents the hyperreflexa associated with a rat modell of persistent visceral pain. Neurosci. Lett. 1995, 187, 111–114. [Google Scholar] [CrossRef]
- Schutte, J.G. Virtual Teaching in Higher Education: The New Intellectual Superhighway or Just Another Traffic Jam. Available online: http://www.csun.edu/sociology/virexp.htm (accessed on 25 May 2022).
- Alavi, M.; Leidner, D.E. Research commentary technology-mediated learning-A call for greater depth and breadth of research. Inf. Syst. Res. 2001, 12, 1–10. [Google Scholar] [CrossRef]
- Bassiouni, D.H.; Hackley, C. ‘Generation Z’ children’s adaptation to digital consumer culture: A critical literature review. J. Consum. Behav. 2014, 13, 113–133. [Google Scholar] [CrossRef]
- Ajmain, T. Impacts and effective communication on generation z in industrial revolution 4.0 Era. J. Eng. Teach. Appl. Ling. 2020, 1, 82–87. [Google Scholar]
- Craft, A. The limits to creativity in education: Dilemmas for the educator. Br. J. Educ. Stud. 2003, 51, 113–127. [Google Scholar] [CrossRef]
- Barron, F. Putting creativity to work. In The Nature of Creativity; Sternberg, R.J., Ed.; Cambridge University Press: Cambridge, MA, USA, 1988. [Google Scholar]
- Gruber, H.E. The evolving systems approach to creative work. In Creative People at Work: Twelve Cognitive Case Studies; Wallace, D.B., Gruber, H.E., Eds.; Oxford University Press: Oxford, MI, USA, 1989. [Google Scholar]
- Ripple, R.E. Ordinary creativity. Contemp. Educ. Psychol. 1989, 14, 189–202. [Google Scholar] [CrossRef]
- Harrison, A.W.; Rainer, R.K. The influence of individual differences on skill in end-user computing. J. Manag. Inf. Syst. 1992, 9, 93–111. [Google Scholar] [CrossRef]
- Liu, K.H.; Li, Y.C. Improving the computer graphics ability of college students with non-design background: Sharing and exploration of five experienced teachers. Elem. Edu. J. 2013, 60, 36–44. [Google Scholar] [CrossRef]
- Soysal, F.; Calli, B.A.; Coşkun, E. Intra and intergenerational digital divide through ICT literacy, information acquisition skills, and internet utilization purposes: An analysis of Gen Z. TEM J. 2019, 8, 264–274. [Google Scholar]
- Taylor, S.; Todd, P.A. Understanding information technology usage: A test of competing modells. Inf. Syst. Res. 1995, 6, 144–176. [Google Scholar] [CrossRef]
- Karahanna, E.; Straub, D.W. The psychological origins of perceived usefulness and ease-of-use. Inf. Manag. 1999, 35, 237–250. [Google Scholar] [CrossRef]
- Venkatesh, V.; Davis, F.D. A theoretical extension of the technology acceptance modell: Four longitudinal field studies. Manag. Sci. 2000, 46, 186–204. [Google Scholar] [CrossRef]
- Agarwal, R.; Prasad, J. A conceptual and operational definition of personal innovativeness in the domain of information technology. Inf. Syst. Res. 1998, 9, 204–215. [Google Scholar] [CrossRef]
- Kegerreis, R.J.; Engel, J.F.; Blackwell, R.D. Innovativeness and diffusiveness: A marketing view of the characteristics of early adopters. Res. Consum. Behav. 1970, 1970, 671–689. [Google Scholar]
- Ku, H.Y.; Lohr, L.L. A case study of Chinese students’ attitudes toward their first online learning experience. Educ. Technol. Res. Dev. 2003, 51, 95–102. [Google Scholar] [CrossRef]
- Ajzen, I. The theory of planned behavior. Organ. Behav. Hum. Decis. Process 1991, 50, 179–211. [Google Scholar] [CrossRef]
- Teng, C.L. A Study of Computer Graphics Education in Graphics Design Courses. J. Des. 2009, 2, 21–36. [Google Scholar]
- Alessi, S.M.; Trollip, S.R. Computer-Based Instruction: Methods and Development; Prentice-Hall, Inc.: Englewood Cliffs, NY, USA, 1985. [Google Scholar]
- Johnson, M. A comparative study of terms used in art education and computer graphics to describe the visual properties of images. Stu. Art. Edu. 1996, 37, 184–192. [Google Scholar] [CrossRef]
- Campbell, D.T.; Stanley, J.C. Experimental and Quasi-Experimental Designs for Research; Rand McNally: Chicago, IL, USA, 1963. [Google Scholar]
- Montgomery, K. Authentic Assessment: A Guide for Elementary Teachers; Longman: New York, NY, USA, 2001. [Google Scholar]
- Jonsson, A.; Svingby, G. The use of scoring rubrics: Reliability, validity and educational consequences. Educ. Res. Rev. 2007, 2, 130–144. [Google Scholar] [CrossRef]
- Sadler, D.R. Indeterminacy in the use of preset criteria for assessment and grading. Assess. Eval. High. Educ. 2009, 34, 159–179. [Google Scholar] [CrossRef]
- Andrade, H. Using rubrics to promote thinking and learning. Educ. Leadersh. 2000, 57, 13–18. [Google Scholar]
- Arter, J.; Chappuis, J. Creating and Recognizing Quality Rubrics; Pearson/Merrill Prentice Hall: Hoboken, NJ, USA, 2007. [Google Scholar]
- Popham, W.J. What’s wrong--and what’s right--with rubrics. Educ. Leadersh. 1997, 55, 72–75. [Google Scholar]
- Powell, T.A. Improving Assessment and Evaluation Methods in Film and Television Production Courses. Ph.D. Thesis, Capella University, Minneapolis, MN, USA, December 2001. [Google Scholar]
- Osana, H.P.; Seymour, J.R. Critical thinking in preservice teachers: A rubric for evaluating argumentation and statistical reasoning. Educ. Res. Eval. 2004, 10, 473–498. [Google Scholar] [CrossRef]
- Reitmeier, C.A.; Svendsen, L.K.; Vrchota, D.A. Improving oral communication skills of students in food science courses. J. Food Sci. Educ. 2004, 3, 15–20. [Google Scholar] [CrossRef]
- Parke, C.S. An approach that examines sources of misfit to improve performance assessment items and rubrics. Edu. Assess. 2001, 7, 201–225. [Google Scholar] [CrossRef]
- Arter, J.; McTighe, J. Socring Rubrics in the Classroom: Using Performance Criteria for Assessing and Improving Student Performance; Corwin Press: Thousand Oaks, CA, USA, 2001. [Google Scholar]
- Stiggins, R.J. Student-Involved Classroom Assessment, 3rd ed.; Prentice-Hall: Hoboken, NJ, USA, 2001. [Google Scholar]
- Wei, R.C.; Pecheone, R.L. Assessment for learning in preservice teacher education: Performance-based assessments. In Teacher Assessment and the Quest for Teacher Quality: A Handbook; Kennedy, M.M., Ed.; Jossey-Bass: San Francisco, CA, USA, 2010; pp. 69–132. [Google Scholar]
- Nunally, J.; Bernstein, I. Psychometric Theory; McGraw Hill: New York, NY, USA, 1994. [Google Scholar]
- Kirkpatrick, D. Evaluation, Training Programs: The Four Levels; Berrett-Koehler Publishers: San Francisco, CA, USA, 1994. [Google Scholar]
- Smidt, A.; Balandin, S.; Sigafoos, J.; Reed, V.A. The Kirkpatrick model: A useful tool for evaluating training outcomes. J. Intellect. Dev. Disabil. 2009, 34, 266–274. [Google Scholar] [CrossRef]
- Chan, H.S. Effects of the digital image in the cosmetology styling curriculum~attitude analysis of student. J. Hosp. Home Econ. 2006, 3, 587–610. [Google Scholar] [CrossRef]
- Andrade, H.; Du, Y. Student perspectives on rubric-referenced assessment. Pract. Assess. Res. Eval. 2005, 10, 1–11. [Google Scholar]
- Campbell, A. Application of ICT and rubrics to the assessment process where professional judgment is involved: The features of an e-marking tool. Assess. Eval. High Educ. 2005, 30, 529–537. [Google Scholar] [CrossRef]
- Tunon, J.; Brydges, B. A study on using rubrics and citation analysis to measure the quality of doctoral dissertation reference lists from traditional and nontraditional institutions. J. Lib. Admin. 2006, 45, 459–481. [Google Scholar]
- Reddy, M.Y. Effect of rubrics on enhancement of student learning. Educate 2007, 7, 3–17. [Google Scholar]
- Lee, A.J.; De La Mare, J.K.; Moore, H.R.; Umeh, P.C. Preference for facial symmetry depends on study design. Symmetry 2021, 13, 1637. [Google Scholar] [CrossRef]
- Little, A.C. Domain specificity in human symmetry preferences: Symmetry is most pleasant when looking at human faces. Symmetry 2014, 6, 222–233. [Google Scholar] [CrossRef]
- Treder, M.S. Behind the looking-glass: A review on human symmetry perception. Symmetry 2010, 2, 1510–1543. [Google Scholar] [CrossRef]
- Monteiro, L.C.P.; Nascimento, V.E.F.; Carvalho da Silva, A.; Miranda, A.C.; Souza, G.S.; Ripardo, R.C. The role of art expertise and symmetry on facial aesthetic preferences. Symmetry 2022, 14, 423. [Google Scholar] [CrossRef]
- Wu, C.F.; Chiang, M.C. Effectiveness of applying 2D static depictions and 3D animations to orthographic views learning in graphical course. Comput. Educ. 2013, 63, 28–42. [Google Scholar] [CrossRef]
- Roblyer, M. Measuring Their Impact of Computers in Instruction: A Non-Technical Review of Research for Educators; Association for Educational Data Systems: Washington, DC, USA, 1985. [Google Scholar]
- Compeau, D.R.; Higgins, C.A. Computer self-efficacy: Development of a measure and initial test. MIS Q. 1995, 19, 189–211. [Google Scholar] [CrossRef]
- Marakas, G.M.; Yi, M.Y.; Johnson, R.D. The multilevel and multifaceted character of computer self-efficacy: Toward clarification of the construct and an integrative framework for research. Inf. Syst. Res. 1998, 9, 126–163. [Google Scholar] [CrossRef]
- Venkatesh, V.; Davis, F.D. A modell of the antecedents of perceived ease of use: Development and test. Decis. Sci. 1996, 27, 451–481. [Google Scholar] [CrossRef]
- Uribe, D.; Klein, J.D.; Sullivan, H. The effect of computer-mediated collaborative learning on solving III-defined problems. Educ. Technol. Res. Dev. 2003, 51, 5–19. [Google Scholar] [CrossRef]
- Levine, T. Commitment to learning: Effects of computer experience, confidence and attitudes. J. Res. Educ. Sci. 1997, 16, 83–105. [Google Scholar] [CrossRef]
Figure 1.
Makeup design from the Republic of China examination for the Level B (advanced level) Technician for Beauty Certificate: (a) makeup design template and (b) completed hand-drawn makeup design. (c) completed computer graphics makeup design (computer graphic works after the students received the computer graphic teaching).

Figure 2.
The mean value/SD of pre-learning attitude (PR) and post-learning attitude (PO): (a) PR1, PO1: Degree of interest. PR2, PO2: Satisfaction with drawing works. PR3, PO3: Drawing tools are easy to use. PR4, PO4: Improve the drawing ability of makeup design drawings. PR5, PO5: Newly files are easy to add. PR6, PO6: Transparency tools are easy to use. PR7, PO7: Mirror tools are easy to use. (b) PR8,PO8: Layer tools are easy to use. PR9, PO9: Changing color is easy. PR10, PO10: The zoom function is easy to use. PR11, PO11: Discuss and solve problems with classmates. PR12, PO12: Ask the teacher for help and solve the problem. PR13, PO13: Be able to solve the problem by myself. PR4,PO14: Be able to use different functions.

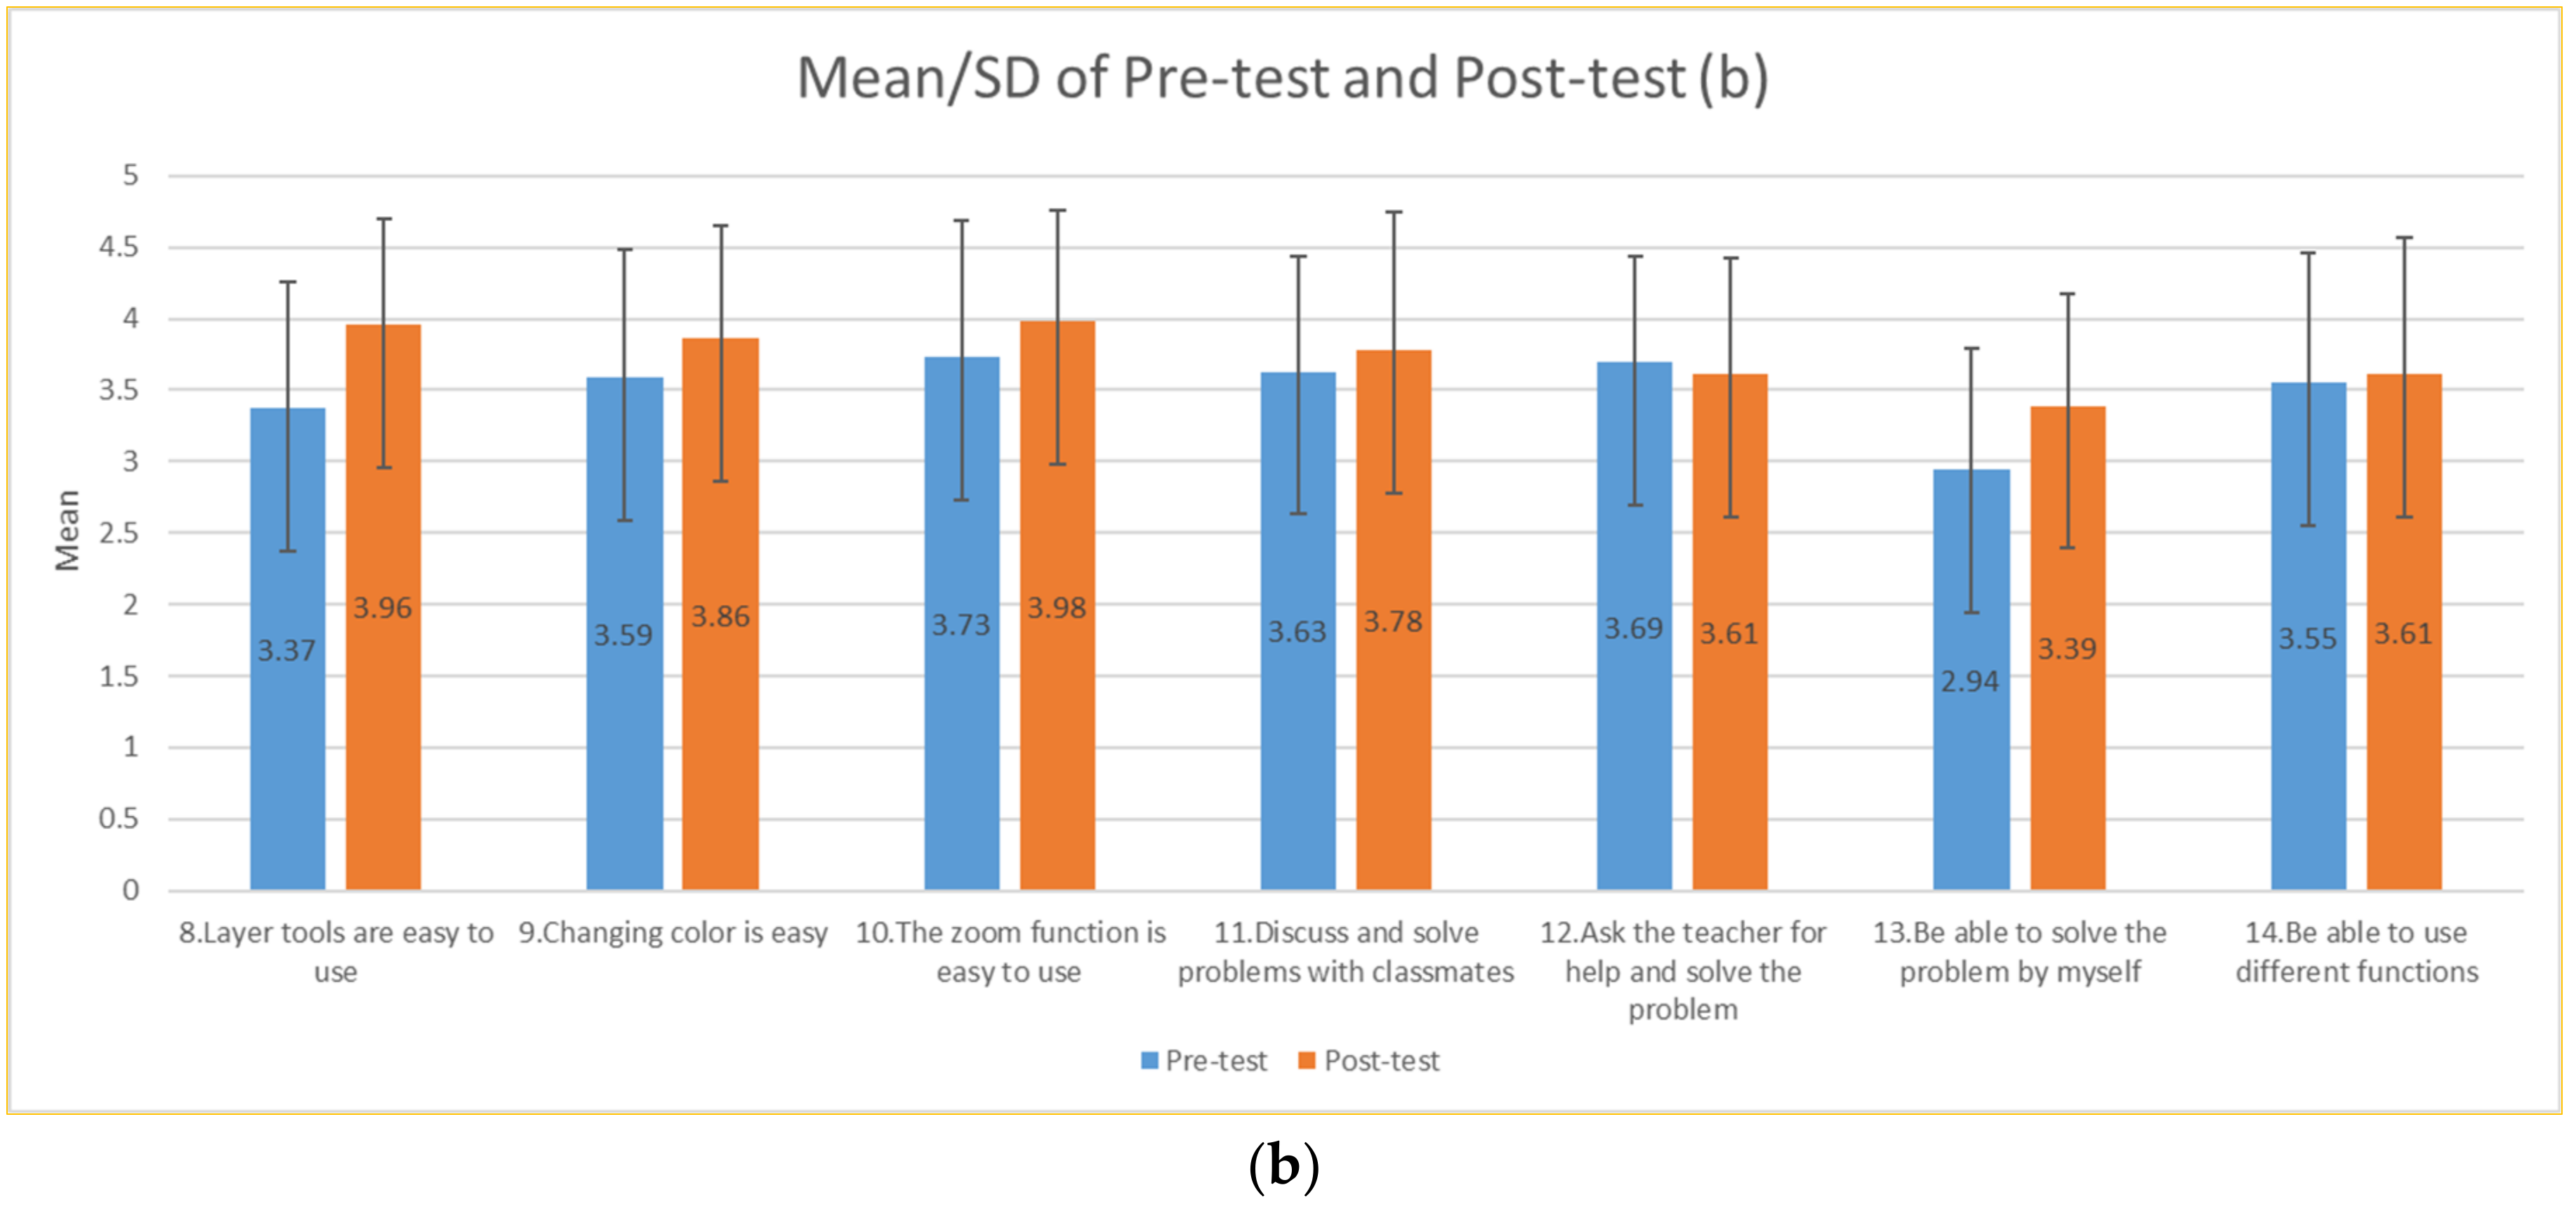
Figure 3.
The mean value/SD of hand drawing and computer drawing.


Table 1.
Rubrics Criteria for each face part. Standards for evaluating makeup design from the Republic of China examination for the Level B (advanced level) Beauty Technician Certificate.
Table 1.
Rubrics Criteria for each face part. Standards for evaluating makeup design from the Republic of China examination for the Level B (advanced level) Beauty Technician Certificate.
| Face Part | Excellent (5 Points) | Great (4 Points) | Good (3 Points) | To Be Improved (2 Points) | Bad (1 Point) |
|---|---|---|---|---|---|
| Eyebrows | Appropriate, even in color, natural, uniform finish, symmetrical | Majority meet Eyebrows Criteria | Slightly lower Eyebrows Criteria | Below Eyebrows Criteria | Nonstandard Eyebrows Criteria |
| Eyeshadow | Naturally gradual and clean color, uniform, transparent, exhibits symmetry, helps define the eye sockets | Majority meet Eyeshadow Criteria | Slightly lower Eyeshadow Criteria | Below Eyeshadow Criteria | Nonstandard Eyeshadow Criteria |
| Eyeliner | Appropriately modified, smooth, symmetrical | Majority meet Eyeliner Criteria | Slightly lower Eyeliner Criteria | Below Eyeliner Criteria | Nonstandard Eyeliner Criteria |
| Nose contour | Evenly colored, natural, stereoscopic, modifies the nose contour according to the face shape, exhibits local symmetry, and helps the nose stand out | Majority meet Nose contour Criteria | Slightly lower Nose contour Criteria | Below Nose contour Criteria | Nonstandard Nose contour Criteria |
| Blush | The position should be correct and symmetrical, natural, and evenly colored and the blush/non-blush boundary should not be apparent | Majority meet Blush Criteria | Slightly lower Blush Criteria | Below Blush Criteria | Nonstandard Blush Criteria |
| Lips | Modified according to the face shape, symmetrical, even in color, natural, layered, saturated, and rich color | Majority meet Lips Criteria | Slightly lower Lips Criteria | Below Lips Criteria | Nonstandard Lips Criteria |
| Full face makeup | Natural and evenly colored, smooth, and symmetrical | Majority meet The whole face Criteria | Slightly lower The whole face Criteria | Below The whole face Criteria | Nonstandard The whole face Criteria |
Table 2.
Descriptive statistics of pre-learning attitude.
| Pre-Test No. | Mean | Quantity | SD | Mean ± SD | Bias |
|---|---|---|---|---|---|
| PR1 | 3.78 | 49 | 0.872 | 0.125 | −0.518 |
| PR2 | 3.33 | 49 | 0.747 | 0.107 | 0.316 |
| PR3 | 3.10 | 49 | 0.941 | 0.134 | −0.210 |
| PR4 | 3.55 | 49 | 0.867 | 0.124 | 0.236 |
| PR5 | 3.59 | 49 | 0.814 | 0.116 | −0.309 |
| PR6 | 3.08 | 49 | 0.786 | 0.112 | 0.121 |
| PR7 | 3.76 | 49 | 1.031 | 0.147 | −0.193 |
| PR8 | 3.37 | 49 | 0.883 | 0.126 | 0.138 |
| PR9 | 3.59 | 49 | 0.888 | 0.127 | −0.010 |
| PR10 | 3.73 | 49 | 0.953 | 0.136 | −0.187 |
| PR11 | 3.63 | 49 | 0.809 | 0.116 | 0.042 |
| PR12 | 3.69 | 49 | 0.742 | 0.106 | −0.710 |
| PR13 | 2.94 | 49 | 0.852 | 0.122 | 0.331 |
| PR14 | 3.55 | 49 | 0.914 | 0.131 | −0.327 |
| Whole scale | 3.48 | 0.864 | |||
| R | (2.18, 4.78) | ||||
Note: R, The mean value of the whole scale plus or minus 1.5 SD; Pre-test, PR.
Table 3.
Descriptive statistics of post-learning attitude.
| Post-Test No. | Mean | Quantity | SD | Mean ± SD | Bias |
|---|---|---|---|---|---|
| PO1 | 3.98 | 49 | 0.777 | 0.111 | −0.520 |
| PO2 | 3.55 | 49 | 0.980 | 0.140 | −0.633 |
| PO3 | 3.47 | 49 | 0.938 | 0.134 | −0.619 |
| PO4 | 3.65 | 49 | 0.969 | 0.138 | −0.525 |
| PO5 | 3.84 | 49 | 0.717 | 0.102 | −0.100 |
| PO6 | 3.76 | 49 | 0.778 | 0.111 | −0.089 |
| PO7 | 4.10 | 49 | 0.770 | 0.110 | −0.464 |
| PO8 | 3.96 | 49 | 0.735 | 0.105 | −0.264 |
| PO9 | 3.86 | 49 | 0.791 | 0.113 | −0.264 |
| PO10 | 3.98 | 49 | 0.777 | 0.111 | −0.242 |
| PO11 | 3.78 | 49 | 0.963 | 0.138 | −0.546 |
| PO12 | 3.61 | 49 | 0.812 | 0.116 | −0.379 |
| PO13 | 3.39 | 49 | 0.786 | 0.112 | −0.283 |
| PO14 | 3.61 | 49 | 0.953 | 0.136 | −0.035 |
| Whole scale | 3.75 | 0.839 | |||
| R | (2.49, 5.01) | ||||
Note: R, The mean value of the whole scale plus or minus 1.5 SD; Post-test, PO.
Table 4.
Paired sample t-test of pre-learning and post-learning.
| Pair No. | Pre-Learning–Post-Learning | Paired Variable Difference | t | Sig. (Two-Tailed) | ||||
|---|---|---|---|---|---|---|---|---|
| Mean | SD | Mean ± SD | The Confidence Interval of 95% Difference | |||||
| Lower Bound | Upper Bound | |||||||
| 1 | Degree of interest | −0.204 | 0.912 | 0.130 | −0.466 | 0.058 | −1.566 | 0.124 |
| 2 | Satisfaction with drawing works | −0.224 | 0.941 | 0.134 | −0.495 | 0.046 | −1.669 | 0.102 |
| 3 | Drawing tools are easy to use | −0.367 | 1.286 | 0.184 | −0.737 | 0.002 | −1.999 | 0.051 |
| 4 | Improve the drawing ability of makeup design drawings | −0.102 | 0.848 | 0.121 | −0.346 | 0.141 | −0.843 | 0.404 |
| 5 | Newly files are easy to add | −0.245 | 0.778 | 0.111 | −0.468 | −0.021 | −2.203 | 0.032 * |
| 6 | Transparency tools are easy to use | −0.673 | 0.944 | 0.135 | −0.945 | −0.402 | −4.994 | 0.000 ** |
| 7 | Mirror tools are easy to use | −0.347 | 0.779 | 0.111 | −0.571 | −0.123 | −3.119 | 0.003 ** |
| 8 | Layer tools are easy to use | −0.592 | 0.934 | 0.133 | −0.860 | −0.324 | −4.438 | 0.000 ** |
| 9 | Changing color is easy | −0.265 | 1.016 | 0.145 | −0.557 | 0.027 | −1.828 | 0.074 |
| 10 | The zoom function is easy to use | −0.245 | 0.693 | 0.099 | −0.444 | −0.046 | −2.473 | 0.017 * |
| 11 | Discuss and solve problems with classmates | −0.143 | 0.707 | 0.101 | −0.346 | 0.060 | −1.414 | 0.164 |
| 12 | Ask the teacher for help and solve the problem | 0.082 | 0.886 | 0.127 | −0.173 | 0.336 | 0.645 | 0.522 |
| 13 | Be able to solve the problem by myself | −0.449 | 0.937 | 0.134 | −0.718 | −0.180 | −3.355 | 0.002 ** |
| 14 | Be able to use different functions | −0.061 | 0.801 | 0.114 | −0.291 | 0.169 | −0.535 | 0.595 |
Note: significance (two-tailed * p < 0.05; ** p < 0.01).
Table 5.
Reliability statistics.
| Cronbach’s α | Standardized Cronbach’s α | Items |
|---|---|---|
| 0.982 | 0.983 | 23 |
Table 6.
Factor analysis of learning effectiveness.
| Facet Name | Question Content | Factor Load | Cronbach’s α | Square Load after Rotation | |
|---|---|---|---|---|---|
| Characteristic Value | Explained Variation (%) | ||||
| Learningeffectiveness | 17. The applied knowledge learnt can be fully absorbed. | 0.844 | 0.971 | 8.279 | 72.514 |
| 16. The applied skills learnt can be fully absorbed. | 0.831 | ||||
| 10. Suitable for learning computer graphic design | 0.802 | ||||
| 22. Satisfied with the results of computer graphic design and makeup design | 0.783 | ||||
| 9. Interested in learning computer graphic design | 0.780 | ||||
| 11. Satisfied with the learning effectiveness of computer graphic design | 0.768 | ||||
| 20. Satisfied with the effectiveness of makeup simulated by computer graphic design | 0.661 | ||||
| 21. Satisfied with the application of the makeup tool database | 0.602 | ||||
| 12. Practical and technical performance can be improved | 0.589 | ||||
| 1. Professional knowledge of makeup can be improved | 0.491 | ||||
| Skill enhancement | 3. Professional potential can be developed. | 0.791 | 0.959 | 6.387 | 6.040 |
| 15. Learning effectiveness of the overall makeup design can be improved. | 0.774 | ||||
| 8. Meeting the needs of cross-field integrated learning | 0.742 | ||||
| 19. Combination of learning makeup skills | 0.721 | ||||
| 18. Combination of learning makeup knowledge | 0.701 | ||||
| 23. Satisfied with the effect of color transformation | 0.675 | ||||
| 7. The effect of the simulated makeup tool meets the learning needs | 0.657 | ||||
| 14. Enhance and enrich professional knowledge | 0.643 | ||||
| Practical application | 4. Application of skills to the practical performance of makeup design | 0.741 | 0.944 | 4.142 | 3.225 |
| 5. Application of skills to improve the professional performance of makeup design | 0.665 | ||||
| 2. Application of computer graphic design to improve the performance of makeup practice | 0.663 | ||||
| 6. Application of computer graphic design to show the creativity of makeup design | 0.633 | ||||
| 13. Application of computer graphic design to improve the performance of practical knowledge | 0.558 | ||||
| Total explained variation: 81.780% | |||||
| Overall reliability: 0.982 | |||||
Table 7.
Descriptive statistics rating for hand drawing works rubrics.
| Face Part (Hd) | Mean | Quantity | SD | Mean ± SD | Bias |
|---|---|---|---|---|---|
| Eyebrows (Hd) | 2.69 | 55 | 0.791 | 0.107 | 0.619 |
| Eyeshadow (Hd) | 2.60 | 55 | 0.830 | 0.112 | 1.283 |
| Eyeliner (Hd) | 2.67 | 55 | 0.862 | 0.112 | 1.240 |
| Nose contour (Hd) | 2.75 | 55 | 0.844 | 0.114 | 0.712 |
| Blush (Hd) | 2.78 | 55 | 0.832 | 0.112 | 1.036 |
| Lips (Hd) | 2.47 | 55 | 0.604 | 0.081 | 0.892 |
| Full face makeup (Hd) | 2.89 | 55 | 0.936 | 0.105 | 0.645 |
| Full scale (Hd) | 2.66 | 0.787 | |||
| R (Hd) | (1.48, 3.84) | ||||
Note: R, the mean of the whole scale plus or minus 1.5 standard deviations; Hd: hand drawing.
Table 8.
Descriptive statistics rating for computer drawing works rubric.
| Face Part (Cd) | Mean | Quantity | SD | Mean ± SD | Bias |
|---|---|---|---|---|---|
| Eyebrows (Cd) | 3.18 | 55 | 0.905 | 0.122 | 0.249 |
| Eyeshadow (Cd) | 2.87 | 55 | 0.771 | 0.104 | 0.225 |
| Eyeliner (Cd) | 2.93 | 55 | 0.959 | 0.129 | 0.280 |
| Nose contour (Cd) | 2.73 | 55 | 0.679 | 0.092 | 0.398 |
| Blush (Cd) | 2.40 | 55 | 0.655 | 0.088 | 1.409 |
| Lips (Cd) | 3.02 | 55 | 0.913 | 0.123 | 0.267 |
| Full face makeup (Cd) | 2.71 | 55 | 0.786 | 0.106 | 0.810 |
| Full scale (Cd) | 2.834 | 0.81 | |||
| R (Cd) | (1.619, 4.049) | ||||
Note: R, The mean of the whole scale is plus or minus 1.5 standard deviations; Cd, Computer drawing.
Table 9.
Paired sample t-test of hand drawing and computer drawing.
| Pair No. | Hd–Cd | Paired Variable Difference | t | Sig. (Two-Tailed) | ||||
|---|---|---|---|---|---|---|---|---|
| Mean | SD | Mean ± SD | The Confidence Interval of 95% Difference | |||||
| Lower Bound | Upper Bound | |||||||
| 1 | Eyebrows | −0.491 | 1.034 | 0.139 | −0.770 | −0.211 | −3.521 | 0.001 ** |
| 2 | Eyeshadow | −0.273 | 0.932 | 0.126 | −0.525 | −0.021 | −2.170 | 0.034 * |
| 3 | Eyeliner | −0.327 | 1.203 | 0.162 | −0.652 | −0.002 | −2.018 | 0.049 * |
| 4 | Nose contour | 0.018 | 0.972 | 0.131 | −0.244 | 0.281 | 0.139 | 0.890 |
| 5 | Blush | 0.382 | 0.991 | 0.134 | 0.114 | 0.650 | 2.859 | 0.006 ** |
| 6 | Lips | −0.545 | 0.939 | 0.127 | −0.799 | −0.292 | −4.307 | 0.000 ** |
| 7 | Full face makeup | 0.036 | 0.744 | 0.100 | −0.165 | 0.238 | 0.362 | 0.719 |
Note: significance (two-tailed *p < 0.05; **p < 0.01); Hd: Hand drawing; Cd: Computer drawing.
Publisher’s Note: MDPI stays neutral with regard to jurisdictional claims in published maps and institutional affiliations. |
© 2022 by the author. Licensee MDPI, Basel, Switzerland. This article is an open access article distributed under the terms and conditions of the Creative Commons Attribution (CC BY) license (https://creativecommons.org/licenses/by/4.0/).
Share and Cite
MDPI and ACS Style
Hsu, H.-H. How Facial Symmetry Influences the Learning Effectiveness of Computer Graphic Design in Makeup Design. Symmetry 2022, 14, 1982. https://doi.org/10.3390/sym14101982
AMA Style
Hsu H-H. How Facial Symmetry Influences the Learning Effectiveness of Computer Graphic Design in Makeup Design. Symmetry. 2022; 14(10):1982. https://doi.org/10.3390/sym14101982
Chicago/Turabian StyleHsu, Hsiu-Hui. 2022. "How Facial Symmetry Influences the Learning Effectiveness of Computer Graphic Design in Makeup Design" Symmetry 14, no. 10: 1982. https://doi.org/10.3390/sym14101982
Note that from the first issue of 2016, this journal uses article numbers instead of page numbers. See further details here.