Article

K-Means Clustering Algorithm Based on Memristive Chaotic System and Sparrow Search Algorithm

1
International College, Hunan University of Arts and Sciences, Changde 415000, China
2
MOE Key Lab for Intelligent Networks and Network Security, School of Automation Science and Engineering, Faculty of Electronic and Information Engineering, Xi’an Jiaotong University, Xi’an 710049, China
3
School of Computing, University of the Fraser Valley, Abbotsford, BC V2S 7M7, Canada
*
Author to whom correspondence should be addressed.
Symmetry 2022, 14(10), 2029; https://doi.org/10.3390/sym14102029
Submission received: 2 September 2022 / Revised: 24 September 2022 / Accepted: 25 September 2022 / Published: 28 September 2022
(This article belongs to the Special Issue Discrete and Continuous Memristive Nonlinear Systems and Symmetry)

Abstract

:
With the advent of the big data era, it is vital to explore the information involved in this type of data. With the continuous development of higher education, the K-means clustering algorithm is widely used to analyze students’ academic data. However, a significant drawback of this method is that it is seriously affected by initial centroids of clustering and easily falls into local optima. Motivated by the fact that the chaos and swarm intelligence algorithm are frequently combined, we propose an approach for data clustering by Memristive Chaotic Sparrow Search Algorithm (MCSSA) in this paper. First, we introduce a memristive chaotic system, which has a property of conditional symmetry. We use the sequences generated by the memristive chaotic system to initialize the location of the sparrows. Then, MCSSA is applied before K-means for finding the optimal locations in the search space. Those locations are used as initial cluster centroids for the K-means algorithm to find final data clusters. Finally, the improved clustering algorithm is applied to the analysis of college students’ academic data, demonstrating the value and viability of the approach suggested in this paper. Through empirical research, it is also confirmed that this method can be promoted and applied.

1. Introduction

Big data is an essential economic asset. Compared with the data in the traditional database management system, big data contains rich resources. Intelligent data analysis and mining will result in significant economic benefits. In the face of a large number of complex data, Hal Varian [1], the chief economist of Google, pointed out: “data has become ubiquitous, and the real value created by data lies in whether we can provide value-added services such as data analysis”. The primary value of big data is data analysis. Its goal is to discover the hidden deals in data to assist in developing strategy [2].
Big data has received more attention recently in the higher education ecosystem. The education system is an integral part of the big data family and has attracted increasing attention due to its vast potential value [3,4,5,6,7,8,9]. People can analyze a large amount of data generated in the education process to mine valuable information and provide personalized education services. Extensive data analysis based on machine learning and deep learning has gradually been integrated into education, with Learning Analytics (LA) being one such type. LA is activities that collect and analyze students’ data after examinations [10,11,12]. Significant educational decisions require big data analytics to provide a comprehensive and reliable source of information. The quality of data and their rational use directly affect the quality of education [13,14].
In addition to the most traditional mean analysis method, there are other analysis methods for students’ performance. They are regression analysis [15], decision tree analysis [16], neural network analysis [17,18], cluster analysis, etc. Among them, the clustering analysis is widely used. Clustering algorithms are classified into several types; K-means and FCM, as well as their variants, are cluster-centric algorithms. These algorithms primarily use distance as a measure for similarity and dissimilarity when calculating the centers of groupings of data points [19]. Density based algorithms such as DBSCAN attempt to assign nearby data points with a certain concentration to a single cluster. This type of algorithm is based on predetermined neighborhood and density thresholds [20]. Spectral clustering is a clustering method that is used to partition the graph matrix [21]. To obtain the best clustering outcomes, it creates an undirected, weighted network based on the data items, taking into account the eigenvalues and eigenvectors that are connected to the graph.
The K-means clustering algorithm is one of the standard techniques in computer learning. This algorithm categorizes samples based on their similarity degree [22]. K-means has the advantages of simple structure, fast convergence, and strong local search ability. It has been widely used in many fields, such as statistics, customer classification, and image segmentation [23,24,25]. However, the traditional K-means algorithm has the problem of sensitivity to the initial centroids of clustering. If the initial centroids of clustering are randomly selected, the clustering results may fall into the local optimum or even have no solution [25]. Therefore, selecting a good set of initial clustering centers to obtain high clustering accuracy has important practical significance. Currently, many researchers have proposed a variety of K-means clustering algorithm optimization methods to overcome that shortcoming, such as k-means++ [26] and k-medoids [27]. The core idea of K-means++ clustering is to select the data as far away as possible from the initial cluster center, which can better solve the problem of the clustering results being too dependent on the selection of the initial centroids of clustering.
K-medoids clustering selects the clustering centroids by the median of data samples, weakening the influence of outliers on the clustering results to a certain extent. It can solve the problem of the traditional K-means algorithm easily falling into local optimum. However, the algorithm has too much time overhead and is unsuitable for large-scale data clustering.
In recent years, many swarm intelligence (SI) optimization algorithms have tried to solve the problem of the K-means algorithm’s heavy dependence on the initial center points [28]. This kind of algorithm has been widely used in clustering because of its robust global search ability. S. Paul et al. [29] proposed a K-means algorithm based on improved particle swarm optimization (MPSO) to solve the problem. Kaur A et al. [30] proposed an improved K-means algorithm for data clustering based on the hybridization of chaos and flower pollination algorithms over K-means. Nonlinear systems have the underlying characteristic of chaos, which has particular characteristics including regularity, ergodicity, and randomness. [31,32]. As an efficient way to avoid being stuck at local minima, chaos and SI are frequently combined, opening up a new area for study and application [32]. The most current studies use chaotic sequences to replace random sequences in the algorithm to obtain better clustering results [33,34]. Those algorithms have made different contributions to prevent K-means from falling into local minima. However, there is still room for improvement.
At present, there are many popular intelligence algorithms. A sparrow search algorithm (SSA) was among them and was proposed by Xue and Shen [35]. SSA outperforms other SI optimization algorithms in terms of search accuracy, convergence speed, stability, and robustness. However, like other swarm intelligence algorithms, SSA is prone to local optima.
Given the advantages of the K-means clustering algorithm and swarm intelligence optimization algorithm, this paper proposes a modified sparrow search optimization algorithm based on the memristive chaotic system to perform a K-means analysis on data. The main contributions of this paper are summarized as follows:
(1)
Chaotic mapping is used to establish the population of SSA to disperse the initial sparrows as evenly as feasible. Chaos sequences are produced by a memristive chaotic system, which has properties of conditional symmetry. Introducing such sequences aims to increase the variety of the sparrow population.
(2)
The improved SSA is used to optimize the location of the clustering centroids in the K-means algorithm. It has the potential to reduce the impact of random initial clustering centroids and the possibility of falling into an optimal local solution. Comparative experiments show that the proposed method can further improve the performance of K-means.
(3)
The improved K-means clustering algorithm is applied to analyze Chinese college students’ performance, which verifies the effectiveness and practicability of the method proposed in this paper.

2. Methods

A complete flowchart diagram for the proposed system is presented in Figure 1. As illustrated in Figure 1, we need several steps to complete data classification. Data preprocessing is discussed in Section 3. This section focuses on how to use chaos sequences to improve the SSA algorithm and how to apply it in K-means.

2.1. Sparrow Search Algorithm

2.1.1. Principle of a Sparrow Search Algorithm

The sparrow search algorithm (SSA) was inspired by sparrows’ foraging and anti-predation behavior. In the sparrow search algorithm, the sparrow population can be divided into discoverers, participants, and scouts according to a certain proportion. When a sparrow is a discoverer, it must take responsibility for finding food for the whole population. A participant forages the areas and directions of a discoverer. The identity of the discoverers and participants of sparrows constantly change. When a participant finds a better food source, the sparrow’s energy reserve increases and it becomes a discoverer. However, the proportion of discoverers and participants does not change, and always remains the same as the proportion defined in the algorithm. When a sparrow changes from a participant to a discoverer, a discoverer changes to a participant. The most suitable initial value can be found in the process of sparrow foraging.

2.1.2. Steps of the Sparrow Algorithm

(1) Initialize the sparrow population and determine the number of iterations and the proportion of discoverers and participants. The sparrow population constructed in this paper is
X = [ x 1 1 x 1 2 x 1 j x 2 1 x 2 2 x 2 j x n 1 x n 2 x n j ]
where n is the population number of sparrows and j is the data dimension to be optimized.
(2) Calculate the fitness value of the population and sort it. The fitness function of SSA is
F X = [ f [ x 1 1 x 1 2 x 1 j ] f [ x 2 1 x 2 2 x 2 j ] f [ x n 1 x n 2 x n j ] ] ,
where F X represents the fitness function and f represents the fitness value of each sparrow.
(3) Update the location of the discoverer according to formula (3)
x i j t + 1 = { x i j t · exp ( i α · T max ) , R 2 < S T x i j t + Q L , R 2 S T
where t represents the current iteration, xij represents the position of the ith sparrow in the j dimension, Tmax represents the maximum number of iterations, α represents a uniform random number between (0, 1]), Q is a random number that obeys the standard normal distribution, and L represents a matrix in which the elements are all 1. R2 illustrates the warning value, ST represents the safe value. In SSA, the discoverer with a better fitness value obtains food first, providing the direction of foraging for the participants. When the fitness value of the participant is greater than that of the discoverer, it becomes a new discoverer.
(4) Update the participant’s location according to formula (4).
X i , j t + 1 = { Q · exp ( x w o r s t t x i j t i 2 ) i f   i > N / 2 X P t + 1 + | X i , j t X P t + 1 | A + · L o t h e r w i s e
where X p t + 1 represents the best location for the discoverer, X worst t represents the worst position, A stands for a 1 × m matrix where each element is randomly assigned 1 or −1, and A + = A T ( A A T ) 1 . In SSA, as the site of the discoverer changes, the participant’s location also changes. The participant needs to find a nearby food source with a high capacity to forage.
(5) Update the location of the scouts according to Formula (5).
X i , j t + 1 = { X b e s t t + β · | X i , j t X b e s t t | i f   f i > f g X i , j t + Z · ( | X i , j t X b e s t t | ( f i f w ) + ε ) i f   f i = f g
where β is the step control parameter. It is a standard random distribution number with a mean of 0 and a variance of 1. Z is a lucky number and −1 ≤ Z ≤ 1, fi is the fitness of sparrows. fg and fw are the optimal global fitness and the worst fitness of the sparrow population.
(6) Iterate and constantly calculate fitness values to update the positions.
(7) When the fitness value is infinitely close to a specific value and the number of iterations reaches the maximum, stop the cycle and output the result.

2.2. Memristive Chaotic Sparrow Search Algorithm

2.2.1. Introduction of a Memristive Chaotic System

We can use a circuit to realize a memristor chaotic circuit model. As shown in Figure 2, the circuit consists of a linear passive inductor, a linear passive capacitor, and a nonlinear active charge driven memristor. [36].
The dimensionless equation of the simplest memristor circuit displayed in Figure 2 can be described by (6)
{ x ˙ = a y y ˙ = b ( x + d ( z 2 1 ) y ) z ˙ = y c z + y z
where x ˙ = d x d t , y ˙ = d y d t , z ˙ = d z d t . The values a, b, c, and d are system parameters. System (6) exhibits hyperchaotic and symmetrical behavior when the system parameters are set to a = 1, b = 1/3, c = 0.6, d = 1.5. When the initial state values are set to x(0) = 0.1, y(0) = 0, z(0) = 0, we can solve the differential Equation (6) using the fourth-order Runge–Kutta method. Figure 3 depicts the phase diagrams of the hyperchaotic attractor with step length h = 0.1 and sampling times Sn = 20,000.

2.2.2. Initializing SSA Population with Memristive Chaotic Sequence

Initializing the population via a memristive chaotic sequence entails the following steps:
(1)
Three chaotic sequences (x, y, and z) are generated by Equation (6). The parameters are set according to Section 2.2.1.
(2)
One of the chaotic sequences is chosen from step one, such as y, and mapped to the problem’s solution space in step three.
(3)
The initial value of the sparrow population is taken from the constructed chaotic sequence S, which is given by
S = lb + (ublb) × y
where ub and lb represent the problem’s maximum and minimum values, respectively.
The flow chart of the sparrow search algorithm used in this paper is shown in Figure 4.

2.3. K-Means Clustering Algorithm

2.3.1. Cluster Analysis Technology

A clustering analysis categorizes data based on the similarity of various properties between data samples. Data samples under the same cluster have similar data attribute characteristics, and data samples under different clusters have dissimilar additional data attributes. Clustering analysis technology can effectively analyze the characteristics of data samples through clustering.

2.3.2. Principle of K-Means Algorithm

The K-means algorithm calculates the distance between different data points and each cluster center. Then, based on the distance between them, the data points are grouped into the cluster closest to each cluster center. The main idea of the K-means algorithm is to calculate the distance between different data points and each cluster center, and to categorize the data points into the cluster closest to each cluster center according to the distance between them. After all data points are grouped, the value of each cluster center must be recalculated. After continuous iteration, the clustering center is constantly updated. When the central point of clustering is no longer changed, or the number of iterations reaches the upper limit given in the algorithm, the clustering division is completed.

2.3.3. Flow of K-Means Algorithm

(1) Read data set D = { X 1 1 X 1 2 X 1 j X 2 1 X 2 2 X 2 j X n 1 X n 2 X n j } , there are n number of data in the data set, and each datum has j attribute dimensions. The number of clusters k is set artificially.
(2) Read cluster center centroids = { C 1 1 C 1 2 C 1 j C 2 1 C 2 2 C 2 j C k 1 C k 1 C k j } , where k must be greater than one and cannot be greater than the number of data.
(3) To partition n number of data into k clusters, calculate the mean value between each data point and the cluster centroid. The attributes of each datum determine which class the data will be assigned to.
(4) Take the mean value to update the cluster center point and continue to iterate until the position does not change.
(5) Output the results of each cluster center.

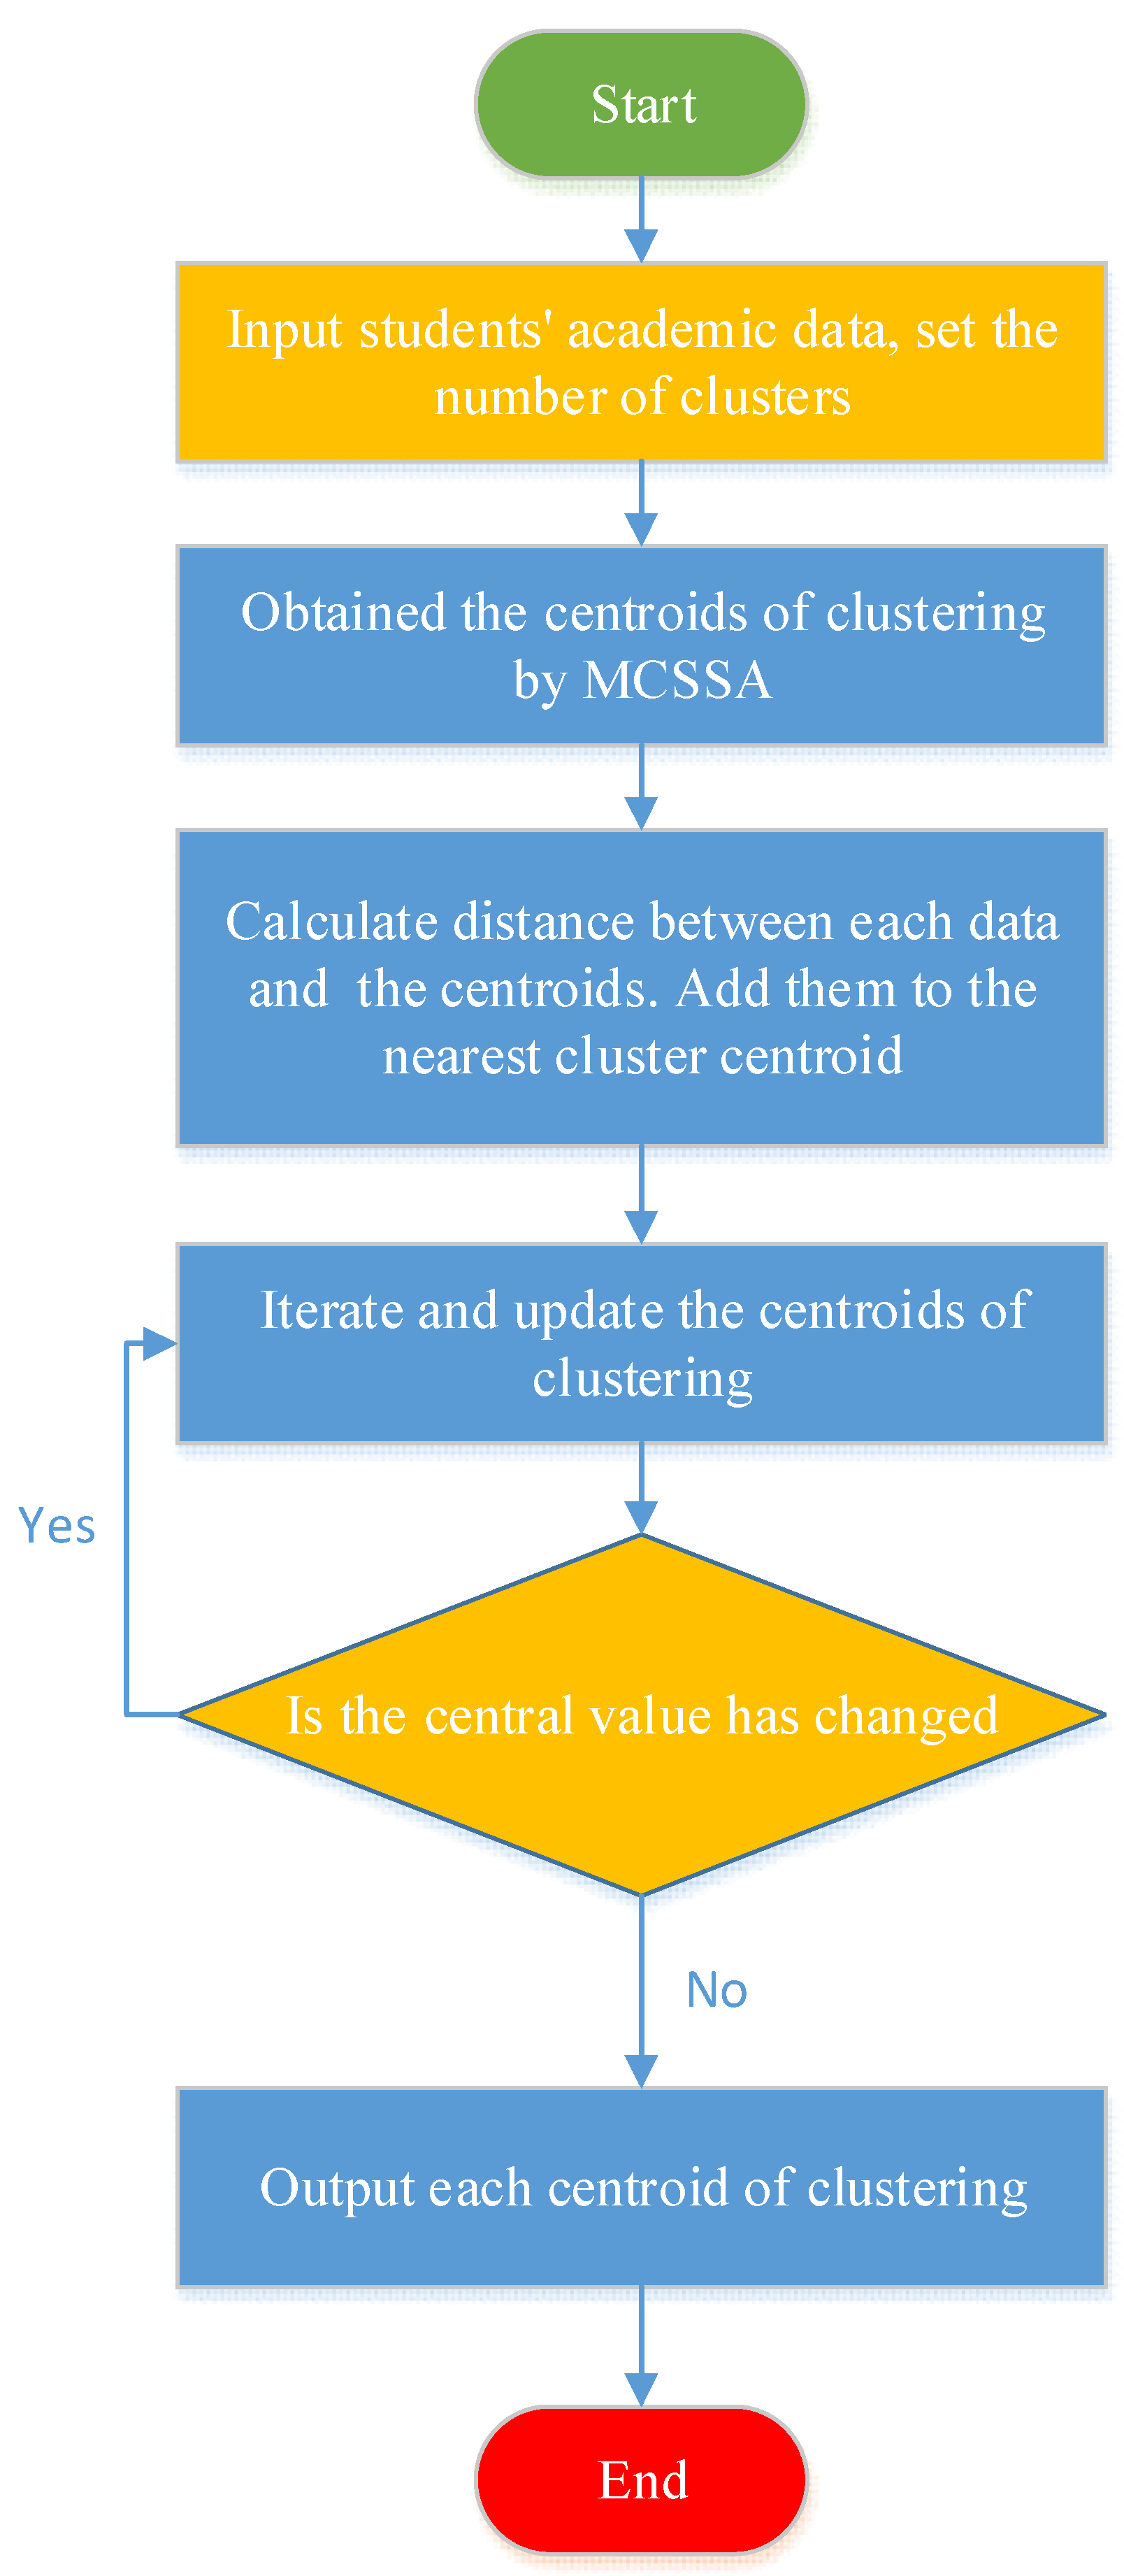
2.3.4. K-Means Clustering Algorithm Based on MCSSA

First, MCSSA is used to find the sparrow with a good location as the initial centroids of the K-means algorithm. Then, the K-means algorithm is used to search iteratively based on these initial centroids to obtain the best clustering results.
The flow chart of the K-means algorithm used in this paper is shown in Figure 5.

3. Experiments Results

To verify the effectiveness of the proposed algorithm, the experiment first compares the running results of the K-means algorithm, SSAK means algorithm, and MCSSAK means algorithm on the standard datasets, then on students’ academic data. The software platform of the experiment is Windows 10 and MATLAB 2022a. The hardware platform is a desktop PC with a CPU of 3.20 G Hz and a memory size of 16 GB.

3.1. Experiments on Standard Data Sets

In this experiment, we use three standard data sets. They are the iris, wine, and absenteeism_at_work datasets. These three datasets are from UCI. We already know that the iris dataset has three classes, 150 records, and four attributes. The wine dataset has three classes, 178 records and 13 attributes. The absenteeism_at_work dataset has 21 classes, 740 records, and 20 attributes. A performance comparison of different algorithms on three datasets is shown in Table 1. We use cluster integrity [30], the sum of the distance from the pattern to the center, to evaluate the performance.

3.2. Experiments on Students’ Academic Data

3.2.1. Source of Students’ Academic Data

The student’s academic data derive from the initial examination results of 35 courses taken by 106 students majoring in information management and information system in 2018–2021 at a university. The selected courses mainly include some representative elective and core course scores. The elective courses’ results can reflect students’ overall learning situation and learning ability. Moreover, the performance analysis results of the core course will be used as the primary dimension to analyze students’ potential. The learning ability of students’ core courses will be closely related to the direction of in-depth learning and the choice of employment direction.

3.2.2. Students’ Academic Data Preprocessing

Before mining and analyzing the meaning of students’ grades, we need to preprocess the grade data. There are some cases of missing grade data and some instances of grades that are too low, which easily enables the formation of isolated points in the original grade data, as well as different methods of course evaluation. The abnormal conditions of the above three kinds of data will affect the results of data analysis, and it is of great significance to preprocess students’ earliest grades.
(1) Data cleaning
Each score in the Excel table of the original score contains fields such as student number, name, course name, credit, etc., which are useless data in the data analysis process. It would be best if someone filtered these fields in Excel before importing the algorithm.
(2) Data filling
We found that some students’ grades are missing. Missing data may come from the student’s failure or a lack of examination in a certain subject. As none of the scores are lower than 30, missing scores in this section are treated as 40 points to avoid outliers in the data.
(3) Data integration
The student’s performance data include the scores in 35 different subjects. To analyze college students’ grades more accurately, we categorized these 35 courses into ten different groups according to their properties. These ten categories include development, information security, management, economics, Chinese, mathematics, English, ideological and political theory, foundation of entrepreneurship, and military theory. Courses with the same property are integrated into one category. For example, introduction to programming, advanced programming, and object-oriented programming, are three courses with the same properties. They can be integrated into the development category.
(4) Outliers and outliers handling
Scores below 40 in the data belong to outliers, which are far from the central data and will have a specific impact on the data analysis results. In this experiment, we treated the average and the original scores below 40 as 40.
After processing all the data, we stored them in a txt file format. The processed data can reduce the impact of data outliers on the results of a clustering algorithm. The part of the processed data is in Table 2. They are the average scores of several courses in the same category.

3.2.3. Selection of K Value

The K-means clustering algorithm highly depends on the K value. If the K value is too large, the data have too many clusters to analyze. If the K value is too small, the characteristic attribute of clustering is not apparent. As shown in Figure 6, according to the distribution of students’ scores, the number of courses and the number of students, the K value can be chosen between 2 and 8.
In the case of different cluster numbers, the fitness function values, that is, the clustering integrity, are obtained by the two different algorithms are in Table 2. In the experiment, the population is 50 and the number of iterations is 600.
The fitness value in Table 3 shows that when the value is between 2 and 5, the fitness value continues to decrease. When the value of K is greater than 5, the optimal value begins to move up and down. From the perspective of the characteristic attributes that need to achieve high grades, it is more appropriate for these data to take five as the value of K. Students’ grades can be analyzed from five perspectives: excellent, great, good, passed, and failed.
The goal of dividing students into five clusters is to analyze their performance data based on different clusters so that they can determine which aspect they should further study or employ based on the results of the cluster analysis.

3.2.4. Comparative Experimental Results

In the comparison experiment, the population is set to 50, the number of iterations is set to 600, the K value is set to 5, and the value range of the initial clustering value is [0, 100]. The iteration curve of SSA and MCSSA is shown in Figure 7.
Figure 7 shows that the MCSSA’s convergence speed is comparable to that of the traditional SSA, but the convergence accuracy is quite different. The MCSSA can converge to a smaller fitness function. According to the definition of the fitness function, the smaller the fitness function value, the smaller the sum of the distances from each point to its cluster center, which implies that better cluster centroids are found.

3.2.5. Analysis of the Overall Effect of Clustering

According to the above analysis, when the value of K is 5, after the data preprocessing analysis and algorithm calculation, we can obtain the data analysis results after storing the results in an Excel table. The student performance data are divided into five categories. The distribution of the centroids in the five clusters is shown in Figure 8. From Figure 8, we can find that the grades of the students are generally good. Excellent students are mainly distributed in cluster 3. The students with good grades are primarily distributed in cluster 5 and this section of students occupies a more significant proportion of the grade level. The students with good grades are mainly distributed in cluster 4. The underachieving students are distributed in clusters 1 and 2. According to Figure 8, the learning situation of this grade is normal. We can see that this grade’s score clustering centroids is unstable. We can infer that the nature of the professional courses students learn is different, and students’ learning ability also shows different directions.

3.2.6. Clustering Centroids Effect Analysis

From Figure 8, it can be concluded that the clustering results can divide students into several categories according to their scores, and students in the same cluster have similar characteristics. The students in cluster 4 have excellent scores. The clustering centroids are at the forefront, and the results are relatively balanced. Their learning ability benefits them in every way, and they can choose their future employment path based on their interests. The students in cluster 2 have good scores. In the future, they can select management or information security jobs according to their interests. The students in cluster 1, cluster 3, and cluster 5 belong to the students with poor scores, and their course scores fluctuate considerably. The students of cluster 1 have a higher cluster center value in the economic and banking courses, and they can choose banking and financial work as their employment direction. The peak scores of students in cluster 3 are in management courses, so they have great potential in management courses. The students of cluster 5 only have the cluster center value close to other clusters in the development courses. If they can learn deeply in the development courses, they can narrow the gap with others and experience core competitiveness when looking for jobs in the future. Cluster 5 has courses with a cluster center value of 40. Such students need to correct their learning attitude to avoid being unable to graduate as normal. The cluster center value of all clusters has a peak value. According to the peak value of the clustering centroid, we can infer the direction of the student’s learning potential and provide the path for further study and employment in the future.

4. Conclusions

This study concentrates on data clustering with MCSSA over K-means. We use some chaotic sequences produced by a memristive chaotic system to initialize the location of SSA. To solve the problem of the K-means clustering algorithm being seriously affected by the initial centroids of clustering, we combine the MCSSA with K-means. We present the experimental findings for two performance characteristics (cluster integrity and execution time).
For cluster integrity, the best algorithms are MCSSA and SSA, which perform equally well in terms of best value. However, MCSSA is the best algorithm of the four algorithms according to the average value. This experimental finding shows that MCSSA has the capacity to raise performance further. The performance of the K-means without any improvement is the worst, which indicates the importance of improving the algorithm. The most popular improved algorithm is PSOK-means. However, its performance will suffer from high-dimensional and numerous records.
For execution time, although the traditional K-means algorithm is the slowest, it is significantly faster than the other three algorithms. We can use it when the need for real-time processing is critical.
However, in practical applications, we do not know the specific value of K in advance. In this study, the proposed method is applied to analyze students’ academic data. The experiment shows that we need to constantly adjust the K value to find the best classification value.
The experimental results validate the proposed method’s efficacy and practicability. The MCSSA will be combined with other applications in future work, where its effectiveness and impact will be assessed further.

Author Contributions

Conceptualization, Q.X. and Y.W.; methodology, Q.X. and Y.W.; software, Q.X. and Y.W.; validation, Y.W., Z.Q. and Y.X.; formal analysis, Y.W.; investigation, Y.W.; resources, Y.W.; data curation, Y.W.; writing—original draft preparation, Y.W.; writing—review and editing, Q.X., Z.Q. and Y.X.; visualization, Y.W.; supervision, Q.X.; project administration, Q.X.; funding acquisition, Q.X. and Y.X. All authors have read and agreed to the published version of the manuscript.

Funding

This research was funded by the science and technology innovation Program of Hunan Province, grant number 2021RC1013, and the Natural Science Foundation of Hunan Province, grant number 2021JJ50137.

Data Availability Statement

The data presented in this study are available on request from the corresponding author.

Acknowledgments

The authors would like to thank the anonymous reviewers for their constructive comments and insightful suggestions. The authors would also like to thank Professor Jun Shen of the University of Wollongong in Australia for his revision suggestions.

Conflicts of Interest

The authors declare no conflict of interest.

References

  1. Rawat, S. Challenges and opportunities with big data. In Shifting Global Powers and International Law: Challenges and Opportunities; Routledge: New York, NY, USA, 2014. [Google Scholar]
  2. Ulbricht, L.; von Grafenstein, M. Big data: Big power shifts? Internet Policy Rev. 2016, 5, 1–8. [Google Scholar] [CrossRef]
  3. Johnston, L.; Jeffryes, J. Data Management Skills Needed by Structural Engineering Students: Case Study at the University of Minnesota. J. Prof. Issues Eng. Educ. Pract. 2013, 140, 05013002. [Google Scholar] [CrossRef]
  4. Foroughi, A.; Yan, G.; Shi, H.; Chong, D. A Web 3.0 ontology based on similarity: A step toward facilitating learning in the Big Data age. J. Manag. Anal. 2015, 2, 216–232. [Google Scholar] [CrossRef]
  5. Gupta, B.; Goul, M.; Dinter, B. Business Intelligence and Big Data in Higher Education: Status of a Multi-Year Model Curriculum Development Effort for Business School Undergraduates, MS Graduates, and MBAs. Commun. Assoc. Inf. Syst. 2015, 36, 449–476. [Google Scholar] [CrossRef]
  6. Singh, S.; Misra, R.; Srivastava, S. An empirical investigation of student’s motivation towards learning quantitative courses. Int. J. Manag. Educ. 2017, 15, 47–59. [Google Scholar] [CrossRef]
  7. Hoffman, S.; Podgurski, A. The use and misuse of biomedical data: Is bigger really better? Am. J. Law Med. 2013, 39, 497. [Google Scholar] [CrossRef]
  8. Duan, L.; Xiong, Y. Big data analytics and business analytics. J. Manag. Anal. 2015, 2, 1–21. [Google Scholar] [CrossRef]
  9. Amalina, F.; Hashem IA, T.; Azizul, Z.H.; Fong, A.T.; Firdaus, A.; Imran, M.; Anuar, N.B. Blending Big Data Analytics: Review on Challenges and a Recent Study. IEEE Access 2019, 8, 3629–3645. [Google Scholar] [CrossRef]
  10. Ang, L.M.; Ge, F.L.; Seng, K.P. Big Educational Data & Analytics: Survey, Architecture and Challenges. IEEE Access 2020, 8, 116392–116414. [Google Scholar]
  11. Edwards, R.; Fenwick, T. Digital analytics in professional work and learning, Studies in Continuing Education. Stud. Contin. Educ. 2016, 38, 213–227. [Google Scholar] [CrossRef]
  12. Waheed, H.; Hassan, S.U.; Aljohani, N.R.; Wasif, M. A bibliometric perspective of learning analytics research landscape. Behav. Inf. Technol. 2018, 37, 941–957. [Google Scholar] [CrossRef]
  13. Salihoun, M. State of Art of Data Mining and Learning Analytics Tools in Higher Education. Int. J. Emerg. Technol. Learn. (IJET) 2020, 15, 58. [Google Scholar] [CrossRef]
  14. Quadir, B.; Chen, N.S.; Isaias, P. Analyzing the educational goals, problems and techniques used in educational big data research from 2010 to 2018. Interact. Learn. Environ. 2020, 1–17. [Google Scholar] [CrossRef]
  15. Zhang, X. Evaluating the quality of internet-based education in colleges using the regression algorithm. Mob. Inf. Syst. 2021, 2021, 7055114. [Google Scholar] [CrossRef]
  16. Jiang, X. Online English teaching course score analysis based on decision tree mining algorithm. Complexity 2021, 2021, 5577167. [Google Scholar] [CrossRef]
  17. Yang, F.; Li, F.W.B. Study on student performance estimation, student progress analysis, and student potential prediction based on data mining. Comput. Educ. 2018, 123, 97–108. [Google Scholar] [CrossRef]
  18. Hu, C.; Ma, Y.; Chen, T. Application on Online Process Learning Evaluation Based on Optimal Discrete Hopfield Neural Network and Entropy Weight TOPSIS Method. Complexity 2021, 2021, 2857244. [Google Scholar] [CrossRef]
  19. Lei, D.; Zhu, Q.; Chen, J.; Lin, H.; Yang, P. Automatic k-means clustering algorithm for outlier detection. In Information Engineering and Applications; Springer: London, UK, 2012; pp. 363–372. [Google Scholar]
  20. Yu, H.; Chen, L.; Yao, J.; Wang, X. A three-way clustering method based on an improved DBSCAN algorithm. Phys. A Stat. Mech. Appl. 2019, 535, 122289. [Google Scholar] [CrossRef]
  21. Yogatama, D.; Tanaka-Ishii, K. Multilingual spectral clustering using document similarity propagation. In Proceedings of the 2009 Conference on Empirical Methods in Natural Language Processing, Singapore, 6–7 August 2009; pp. 871–879. [Google Scholar]
  22. Zhao, L.; Wang, Z.; Zuo, Y.; Hu, D. Comprehensive Evaluation Method of Ethnic Costume Color Based on K-Means Clustering Method. Symmetry 2021, 13, 1822. [Google Scholar] [CrossRef]
  23. Chen, G.; Liu, Y.; Ge, Z. K-means Bayes algorithm for imbalanced fault classification and big data application. J. Process Control 2019, 81, 54–64. [Google Scholar] [CrossRef]
  24. Fang, C.; Liu, H. Research and Application of Improved Clustering Algorithm in Retail Customer Classification. Symmetry 2021, 13, 1789. [Google Scholar] [CrossRef]
  25. Zhang, H.; Peng, Q. PSO and K-means-based semantic segmentation toward agricultural products. Future Gener. Comput. Syst. 2022, 126, 82–87. [Google Scholar] [CrossRef]
  26. Agarwal, M.; Jaiswal, R.; Pal, A. k-means++ under Approximation Stability. Theor. Comput. Sci. 2015, 588, 37–51. [Google Scholar] [CrossRef]
  27. Park, H.S.; Jun, C.H. A simple and fast algorithm for K-medoids clustering. Expert Syst. Appl. 2009, 36, 3336–3341. [Google Scholar] [CrossRef]
  28. Kuo, R.J.; Mei, C.H.; Zulvia, F.E.; Tsai, C.Y. An application of a metaheuristic algorithm-based clustering ensemble method to APP customer segmentation. Neurocomputing 2016, 205, 116–129. [Google Scholar] [CrossRef]
  29. Paul, S.; De, S.; Dey, S. A Novel Approach of Data Clustering Using An Improved Particle Swarm Optimization Based K–Means Clustering Algorithm. In Proceedings of the 2020 IEEE International Conference on Electronics, Computing and Communication Technologies (CONECCT), Bangalore, India, 2–4 July 2020; pp. 1–6. [Google Scholar] [CrossRef]
  30. Kaur, A.; Pal, S.K.; Singh, A.P. Hybridization of Chaos and Flower Pollination Algorithm over K-Means for data clustering. Appl. Soft Comput. 2020, 97, 105523. [Google Scholar] [CrossRef]
  31. Ouyang, A.; Pan, G.; Yue, G.; Du, J. Chaotic Cuckoo Search Algorithm for High-dimensional Functions. J. Comput. 2014, 9, 1282–1290. [Google Scholar] [CrossRef]
  32. Liu, H.; Abraham, A.; Clerc, M. Chaotic dynamic characteristics in swarm intelligence. Appl. Soft Comput. 2007, 7, 1019–1026. [Google Scholar] [CrossRef]
  33. Boushaki, S.I.; Kamel, N.; Bendjeghaba, O. A new quantum chaotic cuckoo search algorithm for data clustering. Expert Syst. Appl. 2018, 96, 358–372. [Google Scholar] [CrossRef]
  34. Chen, Z.; Liu, W. An efficient parameter adaptive support vector regression using K-means clustering and chaotic slime mould algorithm. IEEE Access 2020, 8, 156851–156862. [Google Scholar] [CrossRef]
  35. Xue, J.; Shen, B. A novel swarm intelligence optimization approach: Sparrow search algorithm. Syst. Sci. Control Eng. 2020, 8, 22–34. [Google Scholar] [CrossRef]
  36. Muthuswamy, B. Implementing memristor based chaotic circuits. Int. J. Bifurc. Chaos 2010, 20, 1335–1350. [Google Scholar] [CrossRef]
  37. Xiong, Q.; Shen, J.; Tong, B.; Xiong, Y. Parameter Identification for Memristive Chaotic System Using Modified Sparrow Search Algorithm. Front. Phys. 2022, 10, 533. [Google Scholar] [CrossRef]
Figure 1. A complete flowchart diagram for the proposed system.
Symmetry 14 02029 g001
Figure 2. The simplest memristor chaotic circuit [37].
Symmetry 14 02029 g002
Figure 3. Three-dimensional diagram of the memristive chaotic system (6).
Symmetry 14 02029 g003
Figure 4. Flow chart of the MCSSA.
Symmetry 14 02029 g004
Figure 5. Flow chart of the K-means algorithm.
Symmetry 14 02029 g005
Figure 6. Distribution chart of student scores after data preprocessing.
Symmetry 14 02029 g006
Figure 7. Performance comparison between MCSSA and SSA.
Symmetry 14 02029 g007
Figure 8. Distribution of cluster center value.
Symmetry 14 02029 g008
Table 1. Performance comparison of different algorithms on three datasets.
DatasetCluster IntegrityK-MeansPSOK-MeansSSAK-MeansMCSSAK-Means
Iris k = 3Best value97.5297.3397.3397.33
Worst value152.50123.85123.85123.85
Average value111.43108.35107.41102.15
Execution Time(s)0.00080.16410.23840.2435
Wine k = 3Best value16,55616,55616,55616,556
Worst value22,45618,43718,43718,437
Average value19,77417,06917,19617,069
Execution Time(s)0.00270.20970.49240.5126
Absenteeism_at_work k = 20Best value1.32 × 1077.32 × 1057.20 × 1057.18 × 105
Worst value1.50 × 1072.08 × 1061.44 × 1061.45 × 106
Average value1.35 × 1071.35 × 1061.02 × 1061.00 × 106
Execution Time(s)0.00274.2311.543111.7789
The smaller the cluster integrity, the better the clustering effect. From Table 1, we can see the traditional K-means have the fastest speed, but the average performance is the worst. The rate of MCSSAK-means is the slowest, since it uses memristive chaotic sequences. The average performance of MCSSAK-means is the best.
Table 2. Part of the processed data.
Class 1Class 2Class 3Class 4Class 5Class 6Class 7Class 8Class 9Class 10
189.4792.2595.5092.6786.0089.6789.5085.6790.0089.00
290.2990.0096.0091.3387.0090.0089.1788.6790.0085.00
388.1288.2595.5091.3390.0087.0092.6783.0090.0087.00
488.3585.0092.5085.6787.0088.3386.0086.3390.0085.00
10667.7649.2560.5073.0084.0058.6751.5066.3360.0085.00
Table 3. Fitness function value of different cluster numbers.
K Value2345678
MCSSA3897.562623.782191.67971.921570.903065.852094.65
SSA5452.075049.313260.42022294.432728.454304.642350.59
Publisher’s Note: MDPI stays neutral with regard to jurisdictional claims in published maps and institutional affiliations.

