
Modification of Brain Functional Connectivity in Adolescent Thoracic Idiopathic Scoliosis by Lower Extremities Position
Abstract
:1. Introduction
2. Materials and Methods
2.1. Subjects
2.2. MRI Acquisition
2.3. fMRI Data Processing
3. Results
4. Discussion
5. Conclusions
Author Contributions
Funding
Institutional Review Board Statement
Informed Consent Statement
Data Availability Statement
Conflicts of Interest
Appendix A

| Subject ID | Age (Years) | Menarche (Years) | Handedness | Apex | X-ray | Thoracic Kyphosis T5-T12 | Lumbar Lordosis T12-S1 | Prom cm | Orthosis |
|---|---|---|---|---|---|---|---|---|---|
| SC_01 | 17 | 15 | right | T8-9 | 59 | 23 | −48 | 3 | 0 |
| SC_02 | 18 | 15 | right | T9 | 59 | 12 | −55 | 2.1 | 0 |
| SC_03 | 14 | 0 | right | T9 | 49 | 19 | −79 | 1.2 | 0 |
| SC_04 | 12 | 0 | right | T9-10 | 48 | 24 | −67 | 2.2 | night |
| SC_05 | 16 | 12 | right | T9 | 39 | 10 | −52 | 2.1 | 0 |
| SC_06 | 18 | 11 | right | T8 | 40 | 10 | −57 | 1.9 | 0 |
| SC_07 | 15 | 12 | right | T7-8 | 47 | 18 | −63 | 1.7 | 0 |
| SC_08 | 16 | 15 | right | T9-10 | 68 | 32 | −59 | 2.5 | 0 |
| SC_09 | 14 | 13 | right | T9 | 56 | 30 | −74 | 3 | 0 |
| SC_10 | 11 | 0 | left | T8-9 | 46 | 28 | −65 | 2.5 | 21/24 h |
| SC_11 | 20 | male | right | T8-9 | 40 | 17 | −48 | 1.8 | 0 |
| SC_12 | 15 | male | right | T8 | 50 | 50 | −56 | 3.5 | 0 |
| SC_13 | 13 | 0 | right | T8-9 | 60 | −12 | −46 | 2.7 | Day |
| SC_14 | 13 | 13 | right | T7 | 48 | 1 | −49 | 2.5 | 0 |
| SC_15 | 17 | male | right | T10 | 51 | 45 | −67 | 3 | Night |
| SC_16 | 18 | male | right | T8-9 | 49 | 16 | −54 | 3 | 0 |
| SC_17 | 16 | 11 | right | T8 | 35 | 20 | −59 | 2 | Night |
| SC_18 | 12 | 12 | left | T9 | 45 | 19 | −47 | 1.5 | 22/24 h |
| Subject ID | Age | Menarche | Handedness |
|---|---|---|---|
| HC_01 | 18 | 13 | right |
| HC_02 | 18 | 12 | right |
| HC_03 | 18 | male | right |
| HC_04 | 18 | male | right |
| HC_05 | 20 | 12 | right |
| HC_06 | 20 | male | left |
| HC_07 | 20 | 11 | right |
| HC_08 | 20 | male | right |
| HC_09 | 19 | 12 | right |
| HC_10 | 19 | 12 | right |
| HC_11 | 12 | 0 | right |
| HC_12 | 19 | 15 | right |
| HC_13 | 19 | 13,5 | right |
| HC_14 | 19 | 11 | right |
| HC_15 | 19 | 14 | right |
| HC_16 | 20 | 13 | right |
| HC_17 | 20 | 13 | left |
| HC_18 | 13 | 14 | right |
| HC_19 | 19 | 10 | right |
| HC_20 | 20 | 12 | right |
| HC_21 | 19 | 12 | right |
| HC_22 | 12 | 11 | right |
References
- Lenke, L.G.; Betz, R.R.; Clements, D.; Merola, A.; Haher, T.; Lowe, T.; Newton, P.; Bridwell, K.H.; Blanke, K. Curve prevalence of a new classification of operative adolescent idiopathic scoliosis: Does classification correlate with treatment? Spine 2002, 27, 604–611. [Google Scholar] [CrossRef] [PubMed]
- Latalski, M.; Danielewicz-Bromberek, A.; Fatyga, M.; Latalska, M.; Kröber, M.; Zwolak, P. Current insights into the aetiology of adolescent idiopathic scoliosis. Arch. Orthop. Trauma Surg. 2017, 137, 1327–1333. [Google Scholar] [CrossRef] [PubMed] [Green Version]
- Wang, D.; Shi, L.; Chu, W.C.W.; Burwell, R.G.; Cheng, J.C.Y.; Ahuja, A.T. Abnormal cerebral cortical thinning pattern in adolescent girls with idiopathic scoliosis. Neuroimage 2012, 59, 935–942. [Google Scholar] [CrossRef] [PubMed]
- Domenech, J.; García-Martí, G.; Martí-Bonmatí, L.; Barrios, C.; Tormos, J.M.; Pascual-Leone, A. Abnormal activation of the motor cortical network in idiopathic scoliosis demonstrated by functional MRI. Eur. Spine J. 2011, 20, 1069–1078. [Google Scholar] [CrossRef] [PubMed] [Green Version]
- Xue, C.; Shi, L.; Hui, S.; Wang, D.; Lam, T.; Ip, C.-B.; Ng, B.; Cheng, J.; Chu, W. Altered white matter microstructure in the corpus callosum and its cerebral interhemispheric tracts in adolescent idiopathic scoliosis: Diffusion tensor imaging analysis. Am. J. Neuroradiol. 2018, 39, 1177–1184. [Google Scholar] [CrossRef] [PubMed] [Green Version]
- Chaloupka, R. Influence of Sensorymotor Cortical Area Damage on Spine Development: Spine Development after Pinealectomy and Sensorymotor Area Damage, 1st ed; LAP Lambert Academic Publishing: Saarbrücken, Germany, 2011. [Google Scholar]
- Vojta, V. Infant Movement Disorders Caused by Brain Damage, 1st ed; Grada-Avicenum: Prague, Czech Republic, 1993. [Google Scholar]
- Boček, V.; Krbec, M.; Vaško, P.; Brabec, K.; Pavlíková, M.; Štětkářová, I. Alteration of cortical but not spinal inhibitory circuits in idiopathic scoliosis. J. Spinal Cord Med. 2022, 45, 186–193. [Google Scholar] [CrossRef] [PubMed]
- Fortin, C.; Pialasse, J.P.; Knoth, I.S.; Lippé, S.; Duclos, C.; Simoneau, M. Cortical dynamics of sensorimotor information processing associated with balance control in adolescents with and without idiopathic scoliosis. Clin. Neurophysiol. 2019, 130, 1752–1761. [Google Scholar] [CrossRef] [PubMed]
- Wang, D.; Shi, L.; Liu, S.; Hui, S.; Wang, Y.; Cheng, J.; Chu, W.C.W. Altered topological organization of cortical network in adolescent girls with idiopathic scoliosis. PLoS ONE 2013, 8, e83767. [Google Scholar] [CrossRef] [PubMed] [Green Version]
- Joly, O.; Rousié, D.; Jissendi, P.; Rousié, M.; Frankó, E. A new approach to corpus callosum anomalies in idiopathic scoliosis using diffusion tensor magnetic resonance imaging. Eur. Spine J. 2014, 23, 2643–2649. [Google Scholar] [CrossRef] [PubMed]
- Hitier, M.; Hamon, M.; Denise, P.; Lacoudre, J.; Thenint, M.-A.; Mallet, J.-F.; Moreau, S.; Quarck, G. Lateral Semicircular Canal Asymmetry in Idiopathic Scoliosis: An Early Link between Biomechanical, Hormonal and Neurosensory Theories? PLoS ONE 2015, 10, e0131120. [Google Scholar] [CrossRef] [PubMed]
- Liu, T.; Chu, W.C.; Young, G.; Li, K.; Yeung, B.H.; Guo, L.; Man, C.W.; Lam, W.W.; Wong, S.T.; Cheng, J. MR analysis of regional brain volume in adolescent idiopathic scoliosis: Neurological manifestation of a systemic disease. J. Magn. Reson. Imaging 2008, 27, 732–736. [Google Scholar] [CrossRef] [PubMed] [Green Version]
- Shi, L.; Wang, D.; Hui, S.C.N.; Tong, M.C.F.; Cheng, J.C.Y.; Chu, W.C.W. Volumetric changes in cerebellar regions in adolescent idiopathic scoliosis compared with healthy controls. Spine J. 2013, 13, 1904–1911. [Google Scholar] [CrossRef] [PubMed]


| Seed Region | Cluster p (FWE) | Cluster Size (Voxels) | p Uncorr. | MNI Coordinates (x, y, z) [mm] | Cluster Localization | Effect (Change in SC Group with Respect to HC) |
|---|---|---|---|---|---|---|
| BA4 (Left) | <0.001 | 55 | <0.001 | 6, 14, 64 | Right Supp Motor Area | Decrease (HC > SC) |
| 0.001 | 53 | <0.001 | −6, −58, 43 | Left Parietal Lobe | Decrease (HC > SC) | |
| 0.025 | 29 | <0.001 | −42, −73, 25 | Left Temporal Lobe | Decrease (HC > SC) | |
| 0.010 | 34 | <0.001 | 6, −70, 40 | Right Precuneus | Decrease (HC > SC) | |
| BA4 (Right) | 0.001 | 51 | <0.001 | −6, −58, 43 | Left Parietal Lobe/Precuneus | Decrease (HC > SC) |
| 0.023 | 29 | <0.001 | 3, 20, 67 | Right Supplementary Motor Area/Superior Frontal Gyrus | Decrease (HC > SC) | |
| SMA (Left) | 0.001 | 54 | <0.001 | 30, −49, −2 | Right Cerebellum Anterior Lobe/Culmen | Increase (SC > HC) |
| SMA (Right) | <0.001 | 112 | <0.001 | 15, −43, −11 | Right Cerebellum Anterior Lobe/Culmen | Increase (SC > HC) |
| Pallidum (Left) | <0.001 | 63 | <0.001 | −36, −31, −14 | Left Rolandic Operculum/Heshl | Decrease (HC > SC) |
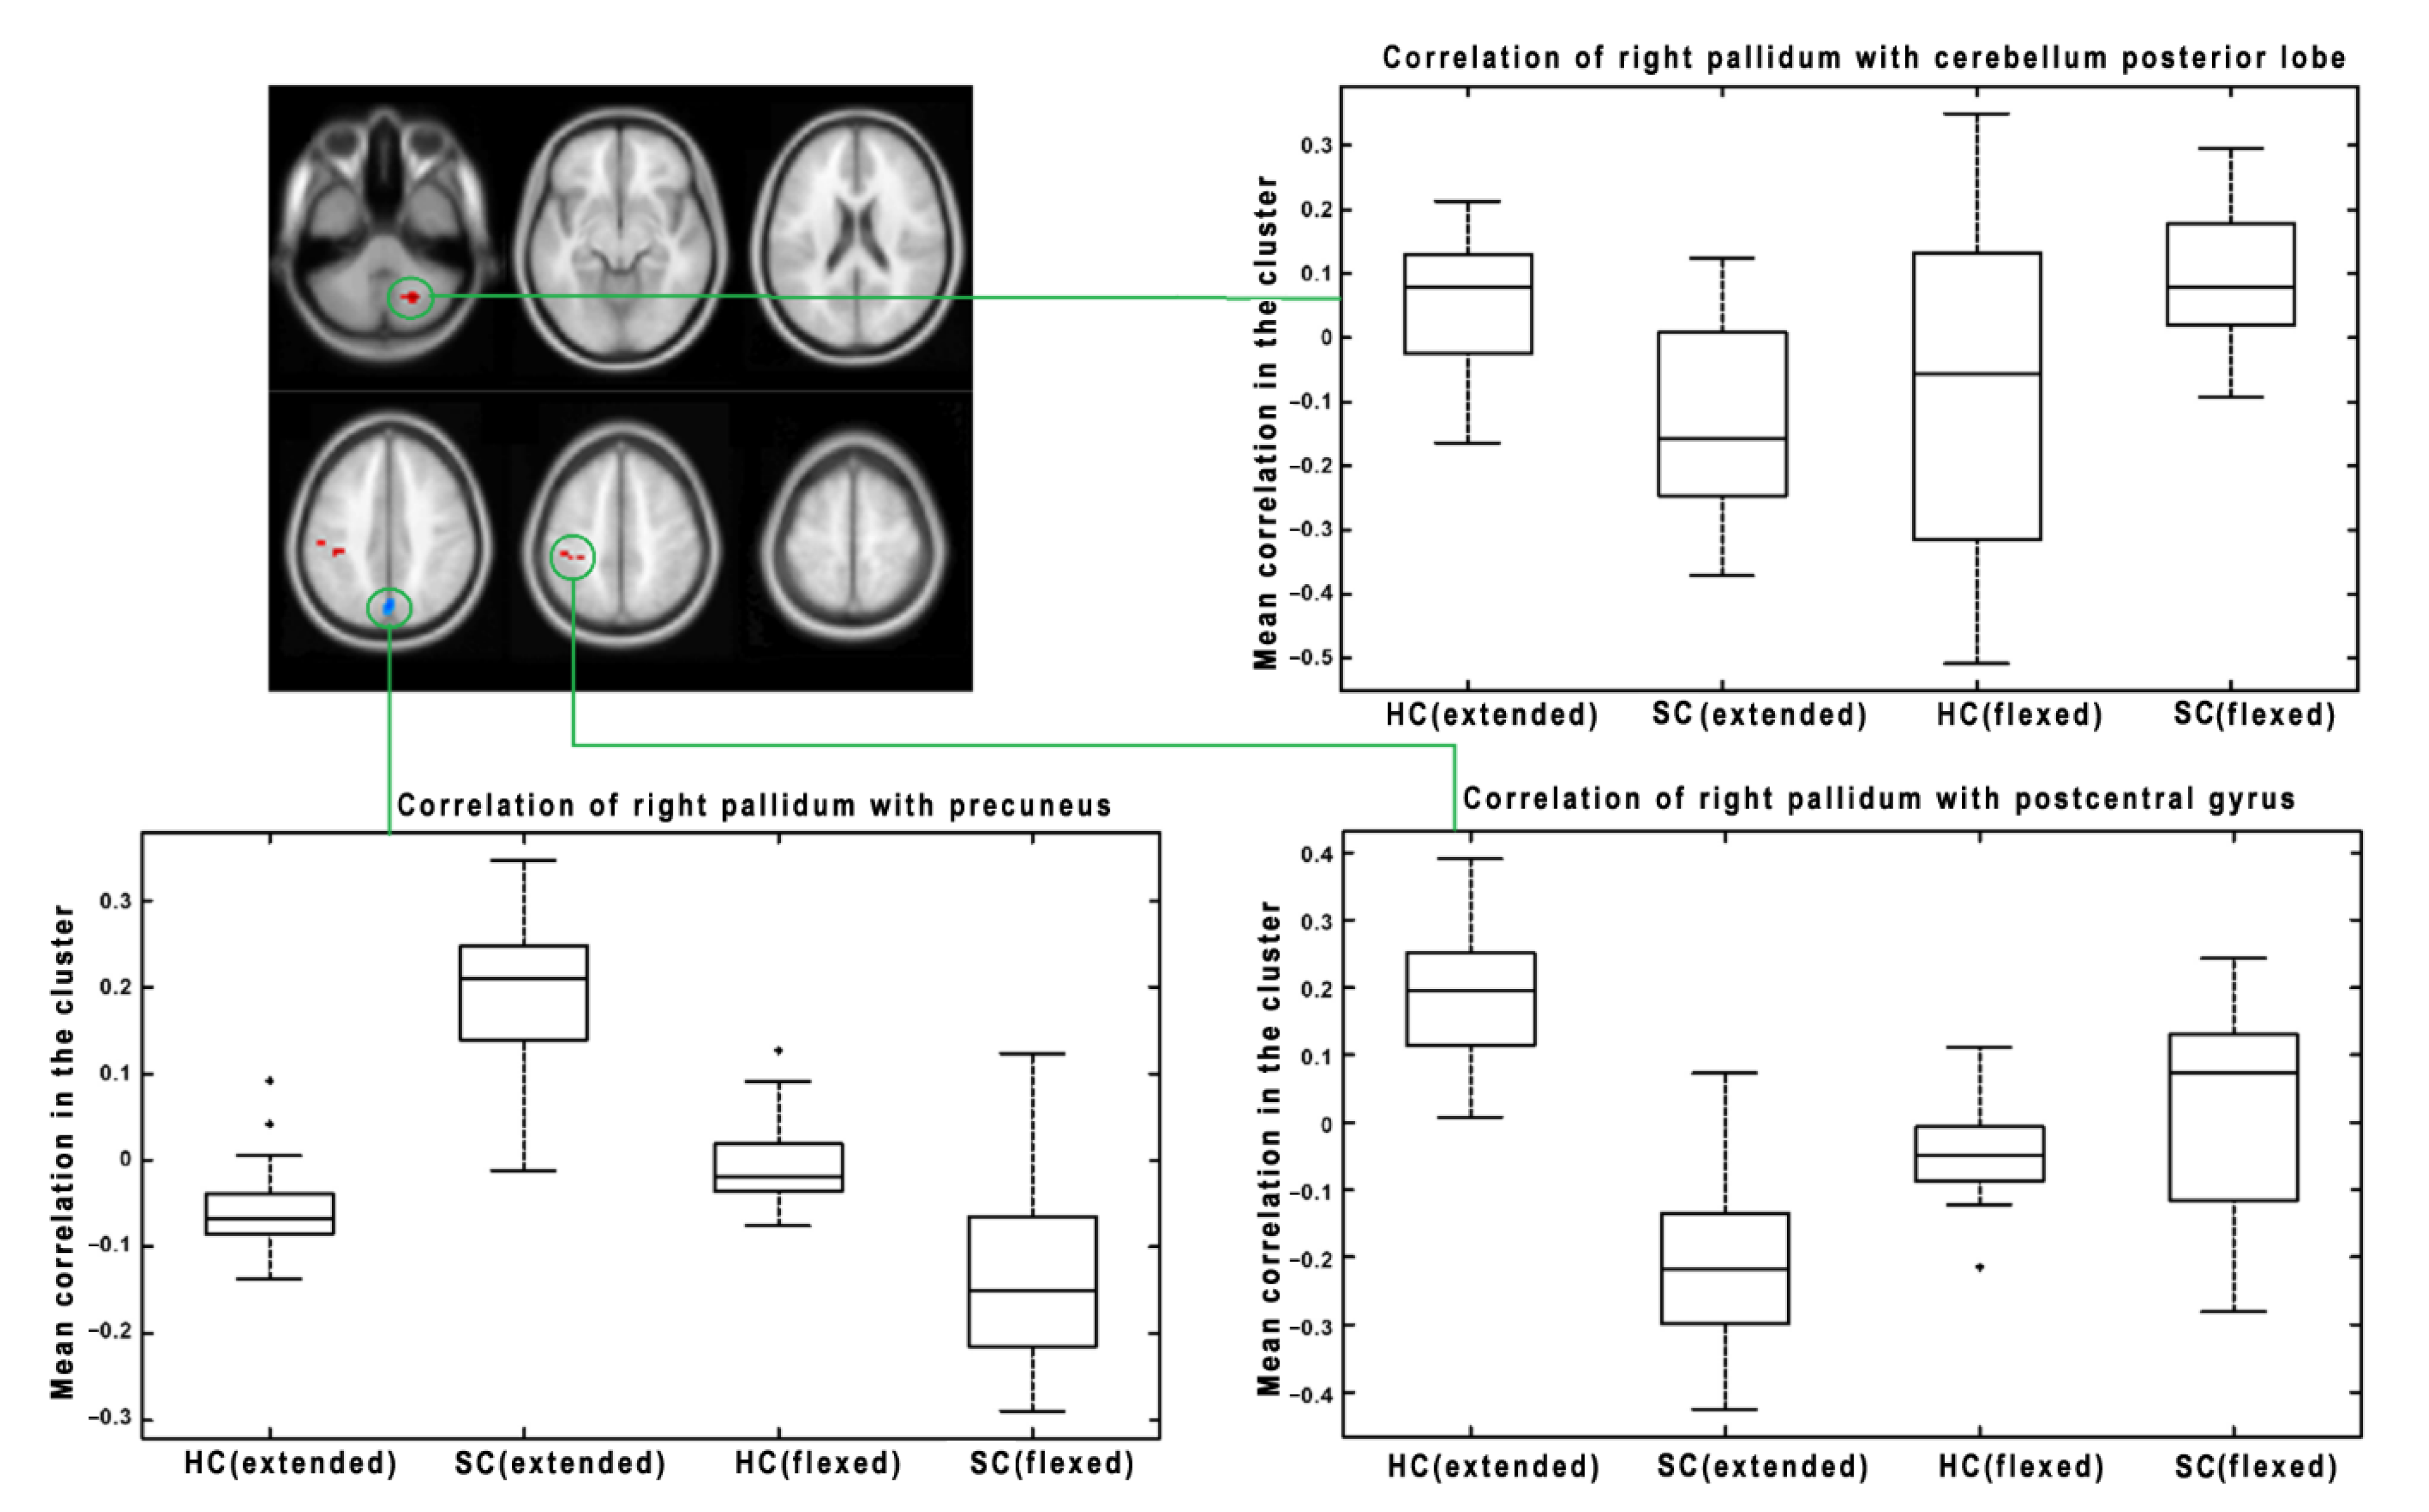
| 0.033 | 26 | 0.001 | 33, −55, −44 | Right Cerebellum Posterior Lobe | Decrease (HC > SC) | |
| <0.001 | 55 | <0.001 | −3, −70, 43 | Left Parietal Lobe/Left Precuneus | Increase (SC > HC) | |
| Pallidum (Right) | <0.001 | 525 | <0.001 | 3, −43, 37 | Right Precuneus/Parietal Lobe | Increase (SC > HC) |
| <0.001 | 148 | <0.001 | 57, −49, 37 | Right Parietal Lobe | Increase (SC > HC) | |
| <0.001 | 107 | <0.001 | −36, −67, 43 | Left Parietal Lobe | Increase (SC > HC) | |
| 0.029 | 29 | <0.001 | −21, 29, 49 | Left Frontal Lobe | Increase (SC > HC) | |
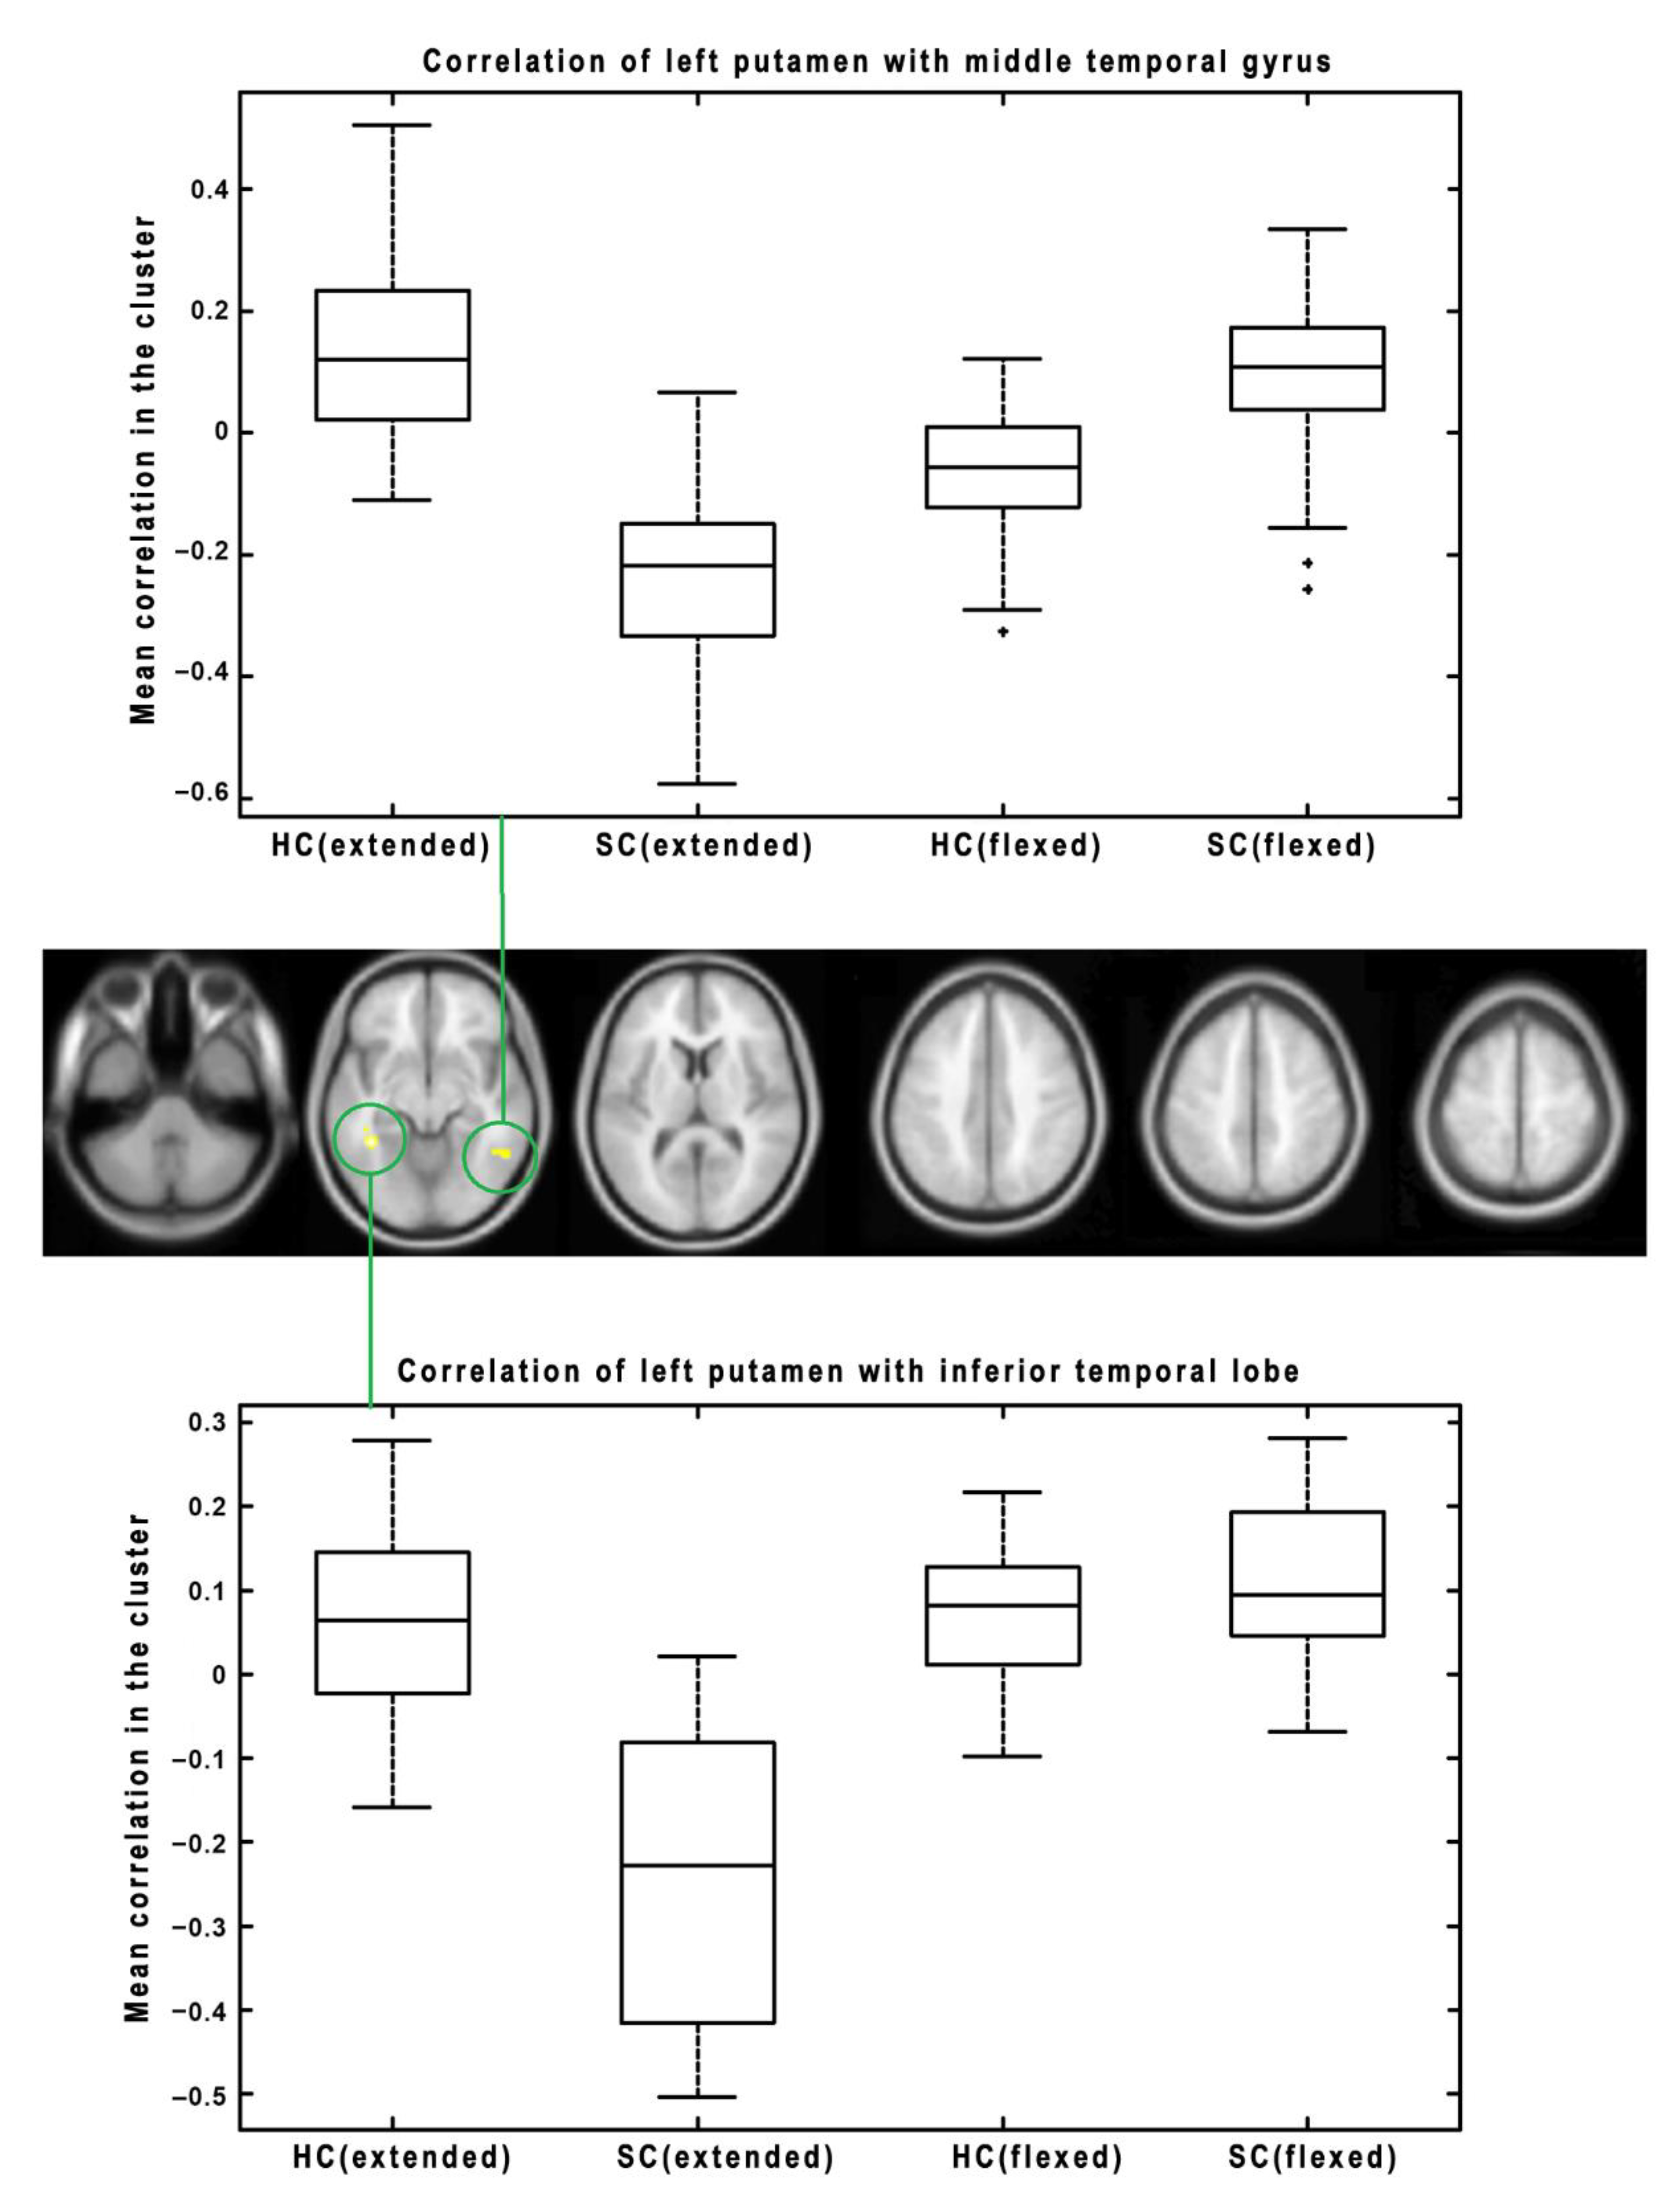
| Putamen (Left) | <0.001 | 145 | <0.001 | 33, 20, 4 | Right Insula | Decrease (HC > SC) |
| Putamen (Right) | <0.001 | 60 | <0.001 | 45, 8, 4 | Right Insula | Decrease (HC > SC) |
Publisher’s Note: MDPI stays neutral with regard to jurisdictional claims in published maps and institutional affiliations. |
© 2022 by the authors. Licensee MDPI, Basel, Switzerland. This article is an open access article distributed under the terms and conditions of the Creative Commons Attribution (CC BY) license (https://creativecommons.org/licenses/by/4.0/).
Share and Cite
Chaloupka, R.; Mikl, M.; Nováková, M.; Repko, M.; Rektor, I. Modification of Brain Functional Connectivity in Adolescent Thoracic Idiopathic Scoliosis by Lower Extremities Position. Symmetry 2022, 14, 2068. https://doi.org/10.3390/sym14102068
Chaloupka R, Mikl M, Nováková M, Repko M, Rektor I. Modification of Brain Functional Connectivity in Adolescent Thoracic Idiopathic Scoliosis by Lower Extremities Position. Symmetry. 2022; 14(10):2068. https://doi.org/10.3390/sym14102068
Chicago/Turabian StyleChaloupka, Richard, Michal Mikl, Marie Nováková, Martin Repko, and Ivan Rektor. 2022. "Modification of Brain Functional Connectivity in Adolescent Thoracic Idiopathic Scoliosis by Lower Extremities Position" Symmetry 14, no. 10: 2068. https://doi.org/10.3390/sym14102068