Article

Experimental Study on Dielectric Fluid Immersion Cooling for Thermal Management of Lithium-Ion Battery

Department of Mechanical Engineering, Dong-A University, 37 Nakdong-Daero 550, Saha-gu, Busan 49315, Korea
*
Author to whom correspondence should be addressed.
These authors contributed equally to this work.
Symmetry 2022, 14(10), 2126; https://doi.org/10.3390/sym14102126
Submission received: 14 September 2022 / Revised: 1 October 2022 / Accepted: 10 October 2022 / Published: 12 October 2022
(This article belongs to the Section Computer)

Abstract

:
The rapidly growing commercialization of electric vehicles demands higher capacity lithium-ion batteries with higher heat generation which degrades the lifespan and performance of batteries. The currently widely used indirect liquid cooling imposes disadvantages of the higher thermal resistance and coolant leakage which has diverted the attention to the direct liquid cooling for the thermal management of batteries. The present study conducts the experimental investigation on discharge and heat transfer characteristics of lithium-ion battery with direct liquid cooling for the thermal management. The 18,650 lithium-ion cylindrical battery pack is immersed symmetrically in dielectric fluid. The discharge voltage and capacity, maximum temperature, temperature difference, average temperature, heat absorbed, and heat transfer coefficient are investigated under various conditions of discharge rates, inlet temperatures, and volume flow rates of coolant. The operating voltage and discharge capacity are decreasing with increase in the volume flow rate and decrease in the inlet temperature for all discharge rates. At the higher discharge rate of 4C, the lowest battery maximum temperatures of 60.2 °C and 44.6 °C and the highest heat transfer coefficients of 2884.25 W/m2-K and 2290.19 W/m2-K are reported for the highest volume flow rate of 1000 mLPM and the lowest inlet temperature of 15 °C, respectively.

1. Introduction

The electric vehicles (EVs) have gained increasing interest as a substitute of the internal combustion engine-based vehicles owing to the shortage of fossil fuels and environmental pollution issues [1,2]. The lithium-ion batteries (LIBs) have the benefits of high efficiency, longer life, self-discharge rate, and high energy and power density which make them appropriate to use for the EV energy storage system [3,4].
At a low temperature, the internal resistance of LIBs increases because of high electrolyte viscosity which leads to the capacity and power deterioration of LIBs. At a high temperature, the capacity and life span of LIBs reduce. The overheating of LIBs results in cathode and anode breakdown, electrolyte oxidation, SEI membrane decomposition, and hence, it leads to the thermal runaway and explosion [5,6]. To extend the driving range of EVs, the batteries are developed with high energy density which increases the heat generation of battery and safety issues because of the thermal abuse during the fast charging [7]. This is the reason for the need for an effective heat dissipation technology for the batteries. For safe and efficient operation, the LIBs need to be provided with a battery thermal management system (BTMS) to maintain the optimum temperature and temperature uniformity in the ranges of 20–45 °C and 0–5 °C, respectively [8,9].
Various cooling methods have been researched to maintain the proper temperature of LIBs including air cooling, phase change material cooling, indirect cooling, and heat pipe-based cooling. However, the currently commercialized cooling methods for the BTMS are air cooing and indirect cooling [10]. The air cooling is better in the aspects of simple structure, low weight, inexpensiveness, and easy maintenance compared to liquid cooling, but the cooling performance is lower due to low thermal properties of air. Despite the heavy weight, expensiveness, and complex structure of liquid cooling systems using water/glycol as coolant, the cooling performance is superior compared to air cooling [11]. Owing to the electrical conductivity of water/glycol coolant, additional parts such as cooling plate and tube are required in case of indirect liquid cooling. The thermal resistance between LIBs and coolant is increasing due to the use of cooling plate and irregular contact between LIB surface and cooling plate. This is the reason that the indirect liquid cooling is not an effective cooling method for the ultrafast charging and the higher C-rate discharging [12,13]. At the high discharge or charging rate, LIBs generate significant heat during the electric-chemical reaction. To ensure the safety and performance of LIBs, an efficient cooling method should be adopted for the BTMS [14]. Direct liquid cooling using dielectric fluid which is electrically non-conductive can be alternative method for indirect liquid cooling. In direct liquid cooling, the direct contact between LIBs and coolant is possible by submerging LIBs into dielectric fluid [13]. Unlike indirect liquid cooling, the direct contact between LIBs and coolant can reduce the thermal resistance and hence the heat transfer from the LIBs to coolant can be increased. Furthermore, the direct liquid cooling system with fewer auxiliary components can be simple with less structural complexity than indirect liquid cooling system [12,13]. The direct liquid cooling can suppress cell to cell thermal runaway propagation and consequently improve the safety of LIBs system [15]. Owing to these advantages, numerous research studies have been conducted recently on the BTMS using direct liquid cooling.
Karimi et al. numerically investigated the cooling performance and pumping power of cooling system with air, water, and silicone oil as coolant using a flow network model. The conclusion was that water is the best coolant in the aspects of maximum temperature and pumping power [16]. Chen et al. compared air cooling, fin cooling, indirect cooling, direct cooling for a 35 Ah prismatic pouch battery cell. Water and mineral oil were considered as coolant for indirect cooling and direct cooling, respectively. In the case of indirect cooling, the pumping power was low at the same average temperature rise and the average temperature of battery cell was low at the same mass flow rate [17]. Patil et al. investigated the thermal characteristics and pumping power of hybrid cooling as the combination of tab force air cooling and body immersion cooling for 20 Ah LiFePo4 14P1S battery cell. At 3C discharge rate, the battery maximum temperatures are 49.9 °C, 31.7 °C, and 28 °C for different mineral oil flow rates of 0.5 LPM, 3 LPM, and 10 LPM, respectively [10]. Sundin et al. experimentally studied the single phase immersion cooling for a 68 Ah battery cell. The study concludes that the maximum temperature of immersion cooling is lower than 30 °C at 2C discharge rate while that of forced air cooling is over 35 °C at 1C discharge rate [18]. Zhou et al. experimentally studied the thermal runaway propagation of 60 Ah battery with energy density of 250 Wh/kg. The study points out that, in overcharge condition, the thermal runaway (TR) occurs at the aged battery and phase change liquid immersion can suppress the propagation of TR while without phase change liquid immersion, all batteries are entirely burned [19]. Dubey et al. numerically compared the cooling performance and pumping power of direct cooling and indirect cooling for NCA 21,700 cylindrical battery. The Novec 7500 fluid as direct cooling coolant and water/ethylene glycol fluid as indirect cooling coolant are used. In direct cooling, the maximum temperature of battery and pumping power are lower than indirect cooling; however, the temperature difference is higher than indirect cooling [20]. Li et al. experimentally evaluated the cooling performance of 18,650 LIB using SF33 fluid as direct coolant. Under the 4C discharge rate, the maximum temperature of battery can be steadily maintained in a range of 33–34 °C and even under 7C discharge rate, the battery maximum temperature is below 34.5 °C due to phase change heat transfer [21].
In the early stage, a few studies in the open literature showed that the performance of indirect cooling is better than the direct cooling using mineral oil and silicon oil as coolants [16,17]. However, in the last decade, the efforts have been made to develop dielectric fluid with enhanced thermal properties and lower ODP and GWP. Recently, the research studies conducted using developed dielectric fluids such as Solvay Garden from M&I Ltd., Manchester, UK and Novec fluid from 3M Ltd., Maplewood, MI, USA have shown improved and superior performance for the direct liquid cooling compared to indirect liquid cooling. This ensures the potential of direct liquid cooling for the better thermal management of batteries focusing on the performance and safety issues compared to commercially used indirect liquid cooling. However, the research on direct liquid cooling of battery has still been in a floating stage and the research investigations and results proposed in the literature review are not sufficient to assure the practical feasibility of direct liquid cooling for the BTMS. Furthermore, the open literature seeks an experimental study to evaluate the thermal and electrical performances of battery pack provided with direct liquid cooling. Hence, a concrete study of detailed experimental investigation on various performances of direct liquid cooling for battery is required. The novelty of the present work is to fulfill the research gaps in the open literature by conducting parametric experimental investigation on battery packs with direct liquid cooling using mineral oil focusing on thermal and electrical characteristics under variation of influential factors. In the present study, the discharge and heat transfer characteristics of 4S4P battery pack are experimentally investigated for direct liquid cooling with E5-TM410 fluid as a coolant. The discharge voltage, discharge capacity, maximum temperature, temperature difference, average temperature, absorbed heat, and heat transfer coefficient are evaluated for battery pack considering the proposed direct liquid cooling. The influence of various discharge rates, inlet temperatures, and volume flow rates are studied on discharge and heat transfer characteristics. Furthermore, the effect of electrical arrangement of battery in terms of parallel connection is studied on the performance characteristics.

2. Experiment Method

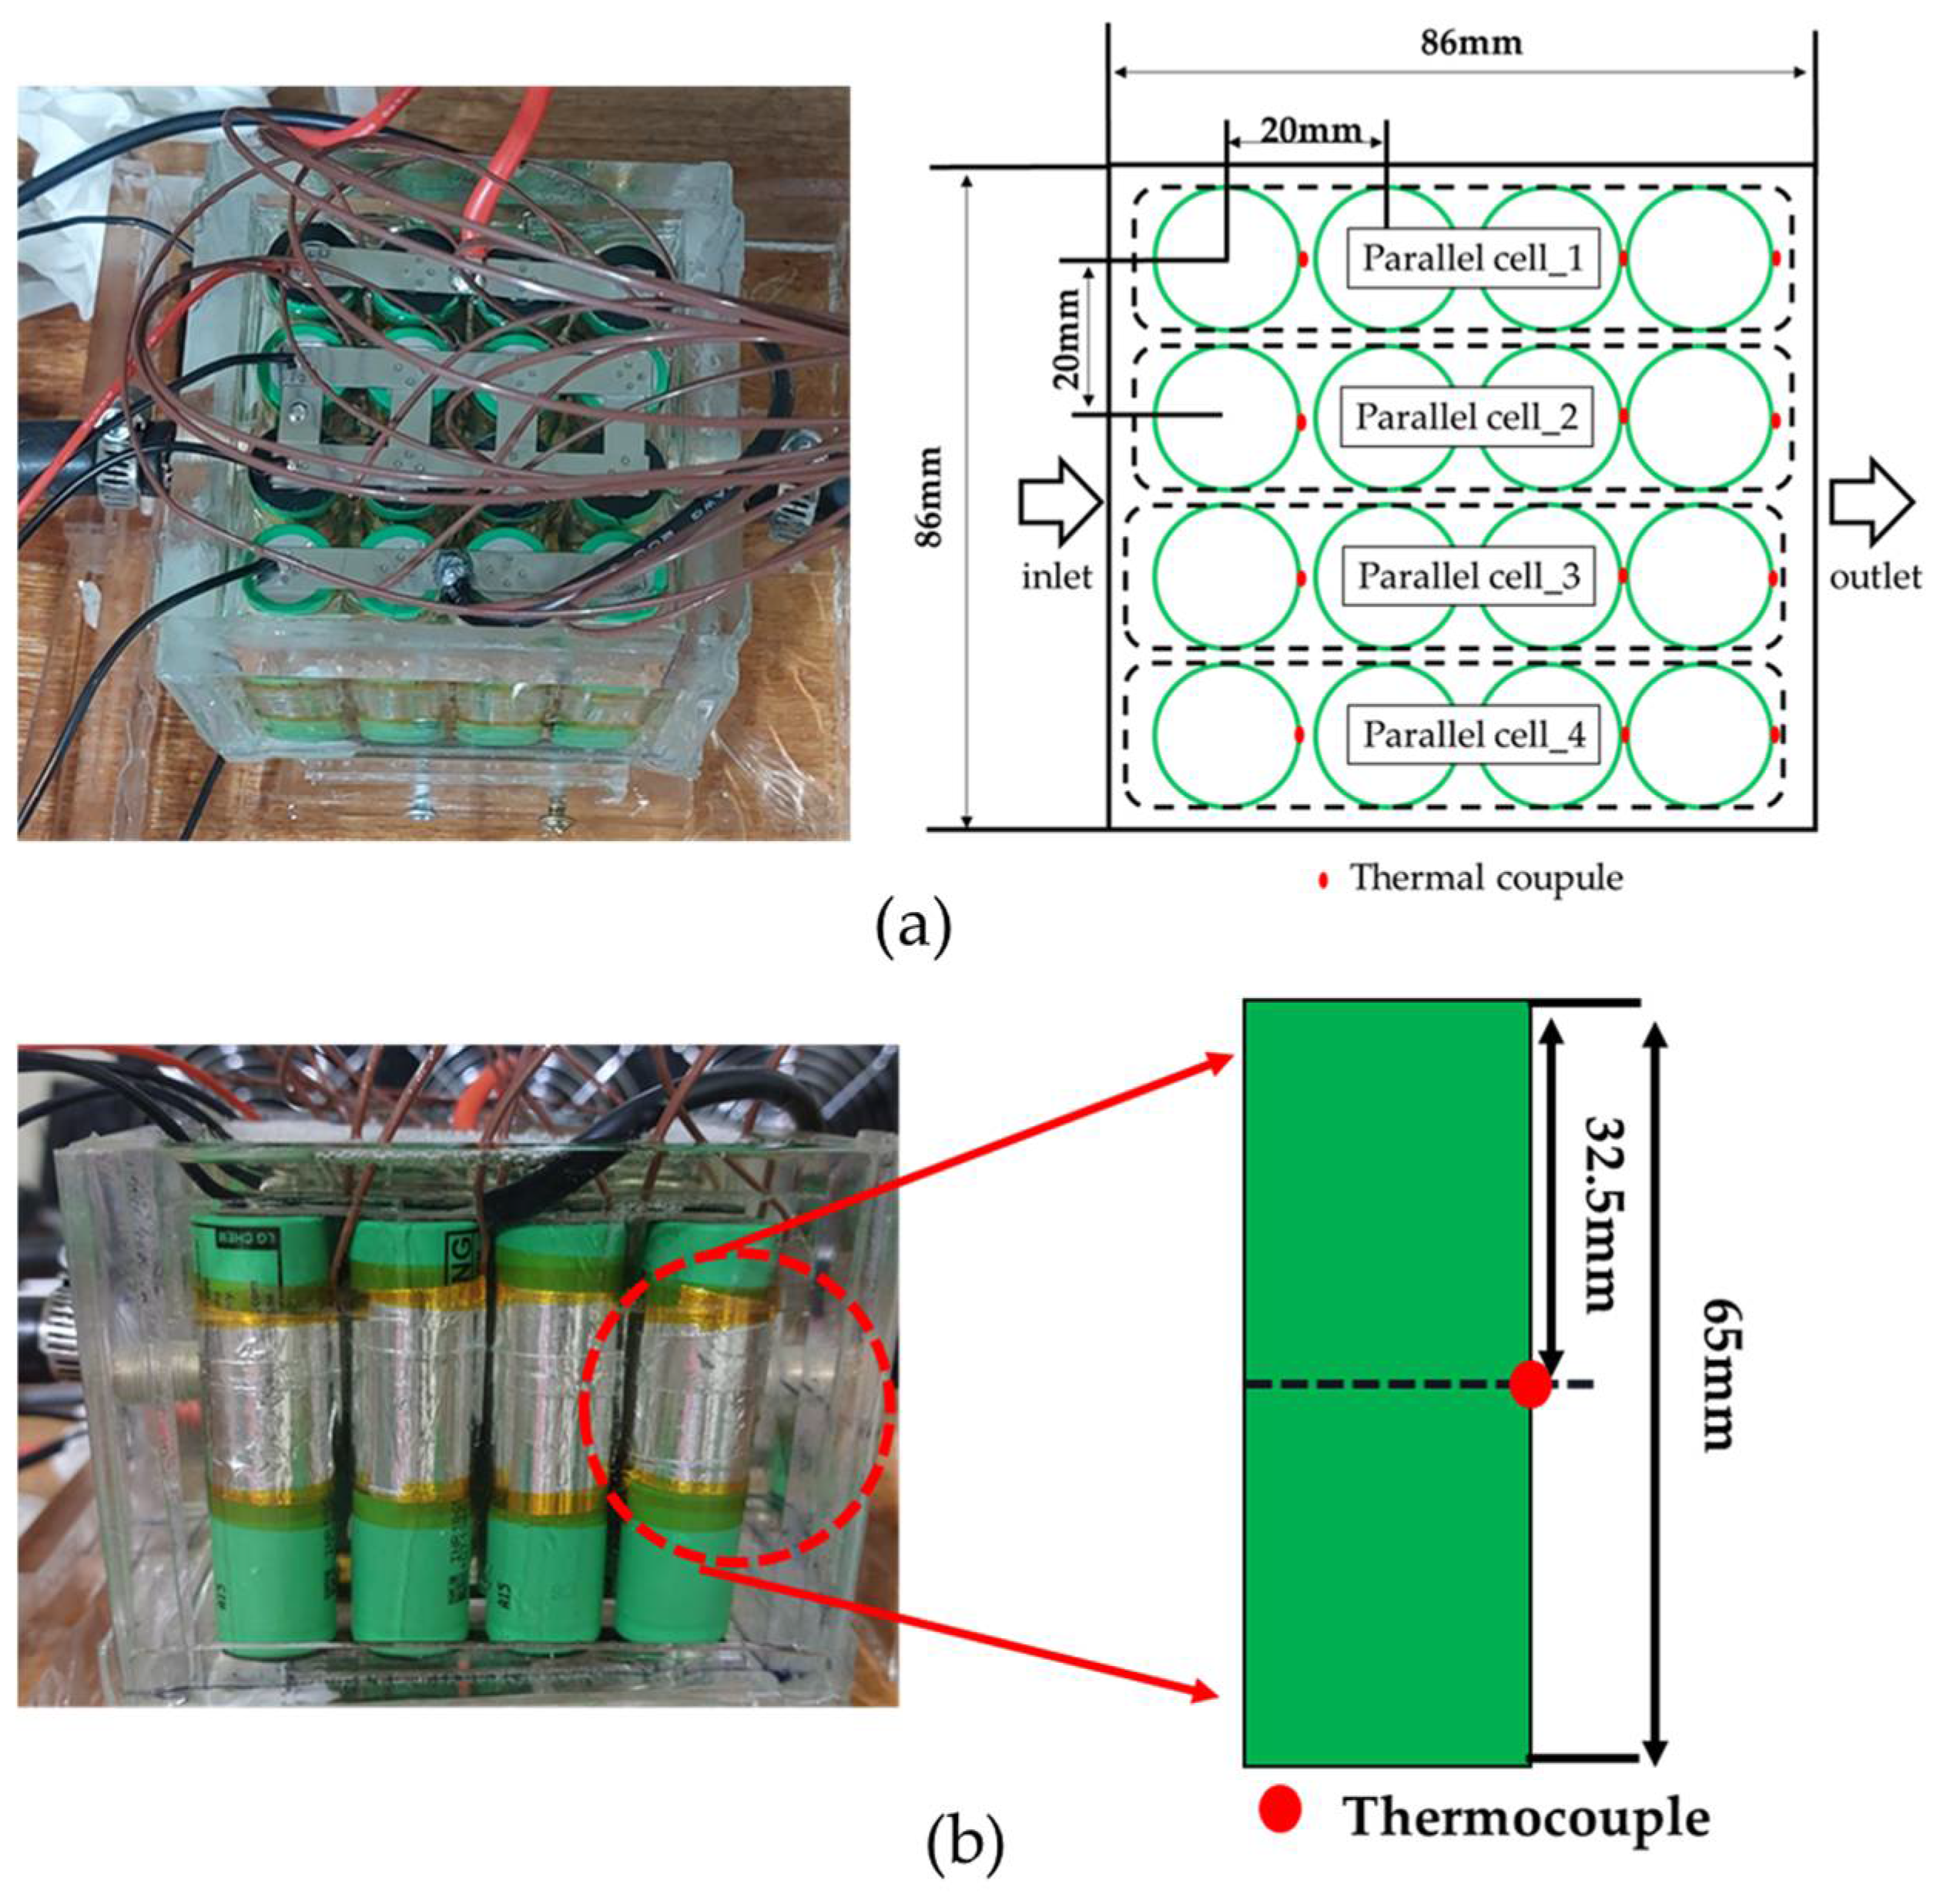
2.1. Battery Pack Configuration and Coolant Specifications

In the present study, the 18650 lithium-ion battery (LG Chem, INR18650 MJ1 3.5 Ah) with NMC-811 cathode material and silicone-graphite anode material is considered for the experiment. The specifications of considered battery are listed in Table 1 [22]. The battery pack consists of sixteen cells, in which four cells are connected in parallel and four cells are connected in series (4S4P). The E5-TM410 fluid is used for the EV thermal management system application [13]. Hence, the E5-TM410 fluid (Shell, Britain) is selected as coolant for direct liquid cooling of battery pack in the experiment. The properties of coolant are shown in Table 2. The battery pack is arranged symmetrically in acryl box with dimensions of 86 × 86 × 78 mm. The inlet and outlet for coolant flow are positioned symmetrically at center locations of front and back sides of acryl box. The distance between the cells arranged in series and parallel is 20 mm and that between battery and acryl box is 22 mm. The symmetrical and uniform temperature distribution of battery cell is an important parameter to design the BTMS. In case of pouch cell, the temperature near the positive tab position is higher than other positions due to the high current density and material characteristics [22]. Kong et al. and Li et al. found that, in case of cylindrical battery cell, the temperature difference can be negligible during discharge and the temperature at the middle position of battery can represent the battery cell temperature [21,23]. For this reason, one thermocouple is attached on each battery cell surface at the middle position, opposite to the coolant flow direction. The configuration of battery pack with coolant for direct liquid cooling is shown in Figure 1. Furthermore, the attachment and location of thermocouples is also shown in Figure 1.

2.2. Experimental Setup and Procedure (Needs to Mention Why You Set Up 2 Test Systems)

Figure 2 shows the schematic diagram of experimental setup for direct liquid cooling of considered battery pack. The experimental setup is equipped with 3.6 W radiator for cooling of coolant in the first configuration as shown in the Figure 2a and that with JWT-30 chiller for cooling of coolant in the second configuration as shown in the Figure 2b. The provision of chiller enables the facility to control and adjust the inlet temperature of coolant, which is not possible in case of radiator hence, two configurations with radiator and chiller are set-up for experimental test system. The heat exchanger is employed for exchanging the heat between chiller water and coolant. The TLF1200 DC electronic loader is used to discharge the battery pack. The voltage and current operating ranges of DC loader are 1 to 150 V and 0 A to 240 A, respectively, with maximum operating power 1200 W. The TS3010A-1 DC supply with operating ranges of voltage and current as 0 to 30 V and 0 to 10 A, respectively, and maximum power 300 W is used to charge the battery pack. The peristaltic pump with operating range of 0.4 mLPM to 2200 mLPM and accuracy of 0.2% is used to circulate the coolant and control the flow rate. The T-type thermocouples with range of −220 °C to 400 °C are attached on each battery cell surface and two Pt-100 thermocouples with range of 0 °C to 850 °C are used to measure the inlet and outlet coolant temperatures. The Graphtec midi logger GL840 is used to acquire the temperature data. Each parallel battery cell is connected to two electric wires for measuring the voltage. The electric wires are connected to Graphtec midi logger GL820 for acquisition of the parallel connected cell voltage data. The ambient temperature of the experiment setup was maintained at 25 °C using a constant temperature and humidity chamber with a temperature range of −30 °C to 60 °C and humidity range of 30 to 95%.
The charge process of the battery pack followed CC (constant current)–CV (constant voltage) protocol. During the CC mode, the battery pack is charged at 0.5C discharge rate (7A) until it reaches the charge cut-off voltage of 16.8 V. When battery pack reaches the charge cut-off voltage, the CC mode is changed to CV mode and the current drops. The CV mode is maintained until it reaches the cut-off current of 0.2A. After full charge, the battery pack is rested for 2 h to achieve an equilibrium state. The fully charged battery pack is discharged at CC with 1C (14A), 2C (28A), 3C (42A), and 4C (56A) discharge rates. When any parallel connected battery cell reaches the discharge cut off voltage, the discharge is stopped, and battery pack is rested for 2 h. Four different inlet volume flow rates of 400 mLPM, 600 mLPM, 800 mLPM, and 1000 mLPM are considered at each discharge rate including no flow condition (natural convection). Four different inlet temperatures of coolant are considered including 15 °C, 20 °C, 30 °C, and 35 °C. To investigate the behavior of discharge and heat transfer characteristics of battery with immersion cooling under variation of volume flow rate and inlet temperature, the abovementioned four conditions of both parameters were considered. The DC loader and the peristaltic pump were turned on simultaneously when the chiller temperature reached the desired value.

2.3. Data Reduction and Uncertainty Analysis

During discharge, the battery generates heat due to the electric-chemical reaction. The total heat generation of battery is divided into two parts, one is reversible heat ( Q r e v ) due to entropy change and the other is irreversible heat (   Q i r r ) due to polarization. The total heat generation rate of battery ( Q t o t a l ) is presented by Equation (1) [24].
Q t o t a l = Q r e v   + Q i r r = I T d U d T + I V U
here, I is the operating current during charge/discharge, T is temperature of battery, U is open circuit voltage, V is operating voltage, and d U d T is entropy coefficient.
In nickel tab, the joule heating ( Q N i c k e l ) is oriented due to current and is presented by Equation (2)
Q N i c k e l = I 2 R
where R is resistance of nickel.
The energy balance of the battery pack and coolant is presented by Equations (3) and (4) shows the convection heat transfer of coolant ( Q c o n v , c o o l a n t ).
                Q t o t a l + Q N i c k e l   = Q c o n v ,   c o o l a n t
Q c o n v , c o o l a n t = m ˙ c o o l a n t C p , c o o l a n t · T o u t l e t ,   c o o l a n t T i n l e t , c o o l a n t
where m ˙ c o o l a n t is mass flow rate of coolant, C p , c o o l a n t is specific heat of coolant, T o u t l e t ,   c o o l a n t is outlet bulk temperature of coolant, T i n l e t , c o o l a n t is inlet bulk temperature of coolant.
The average heat transfer coefficient of coolant ( h a v e , c o o l a n t ) can be calculated using Equation (5) [25].
h a v e , c o o l a n t = Q c o n v e c t i o n ,   c o o l a n t A b a t t e r y   s u r f a c e   Δ T m e a n   t e m p
Δ T m e a n   t e m p = T b a t t e r y   s u r T m e a n ,   c o o l a n t
where A b a t t e r y   s u r f a c e   is battery surface area, T m e a n ,   c o o l a n t is mean temperature of inlet and outlet, T b a t t e r y   s u r is battery surface temperature and ( Δ T ) m e a n   t e m p presents mean temperature difference.
The measurement errors, positional errors of probes, environmental errors, and poor calibration could result in inaccuracy in the measured experimental parameters [26]. Therefore, to assure the accuracy and reliability of experimental parameters, the uncertainty analysis is conducted using the data sheet of manufacturer. The accuracies of DC electronic loader, volume flow meter, T-type thermocouple, Pt-100 thermocouple, and data logger are ±0.1 %, ±0.2%, ±0.5%, ±0.5%, and ±0.1%, respectively. The uncertainties in temperature, voltage, absorbed heat, and heat transfer coefficient are calculated as 3.28%, 1.17%, 5.65%, and 6.53%, respectively, using Equation (7) [27].
U P = [ ( P X 1 U 1 ) 2 + ( P X 2 U 2 ) 2 + ( P X 3 U 3 ) 2 + ( P X n U n ) 2 ] 1 2
where U P presents uncertainty in dependent parameter, X 1 , X 2 , X 3 ,…   X n present independent parameters, U 1 , U 2 , U 3 ,…   U n present uncertainty in independent parameter, and P presents dependent parameter.

3. Results and Discussion

In this section, the performance of battery pack with immersion cooling is discussed in terms of discharge and heat transfer characteristics considering the effects of volume flow rate and inlet temperature of coolant at different discharge rates. The discharge characteristics of operating voltage and discharge capacity and heat transfer characteristics of maximum temperature, temperature difference, average temperature, absorbed heat, and heat transfer coefficient are elaborated in the Section 3.1 and Section 3.2.

3.1. Effect of Volume Flow Rate

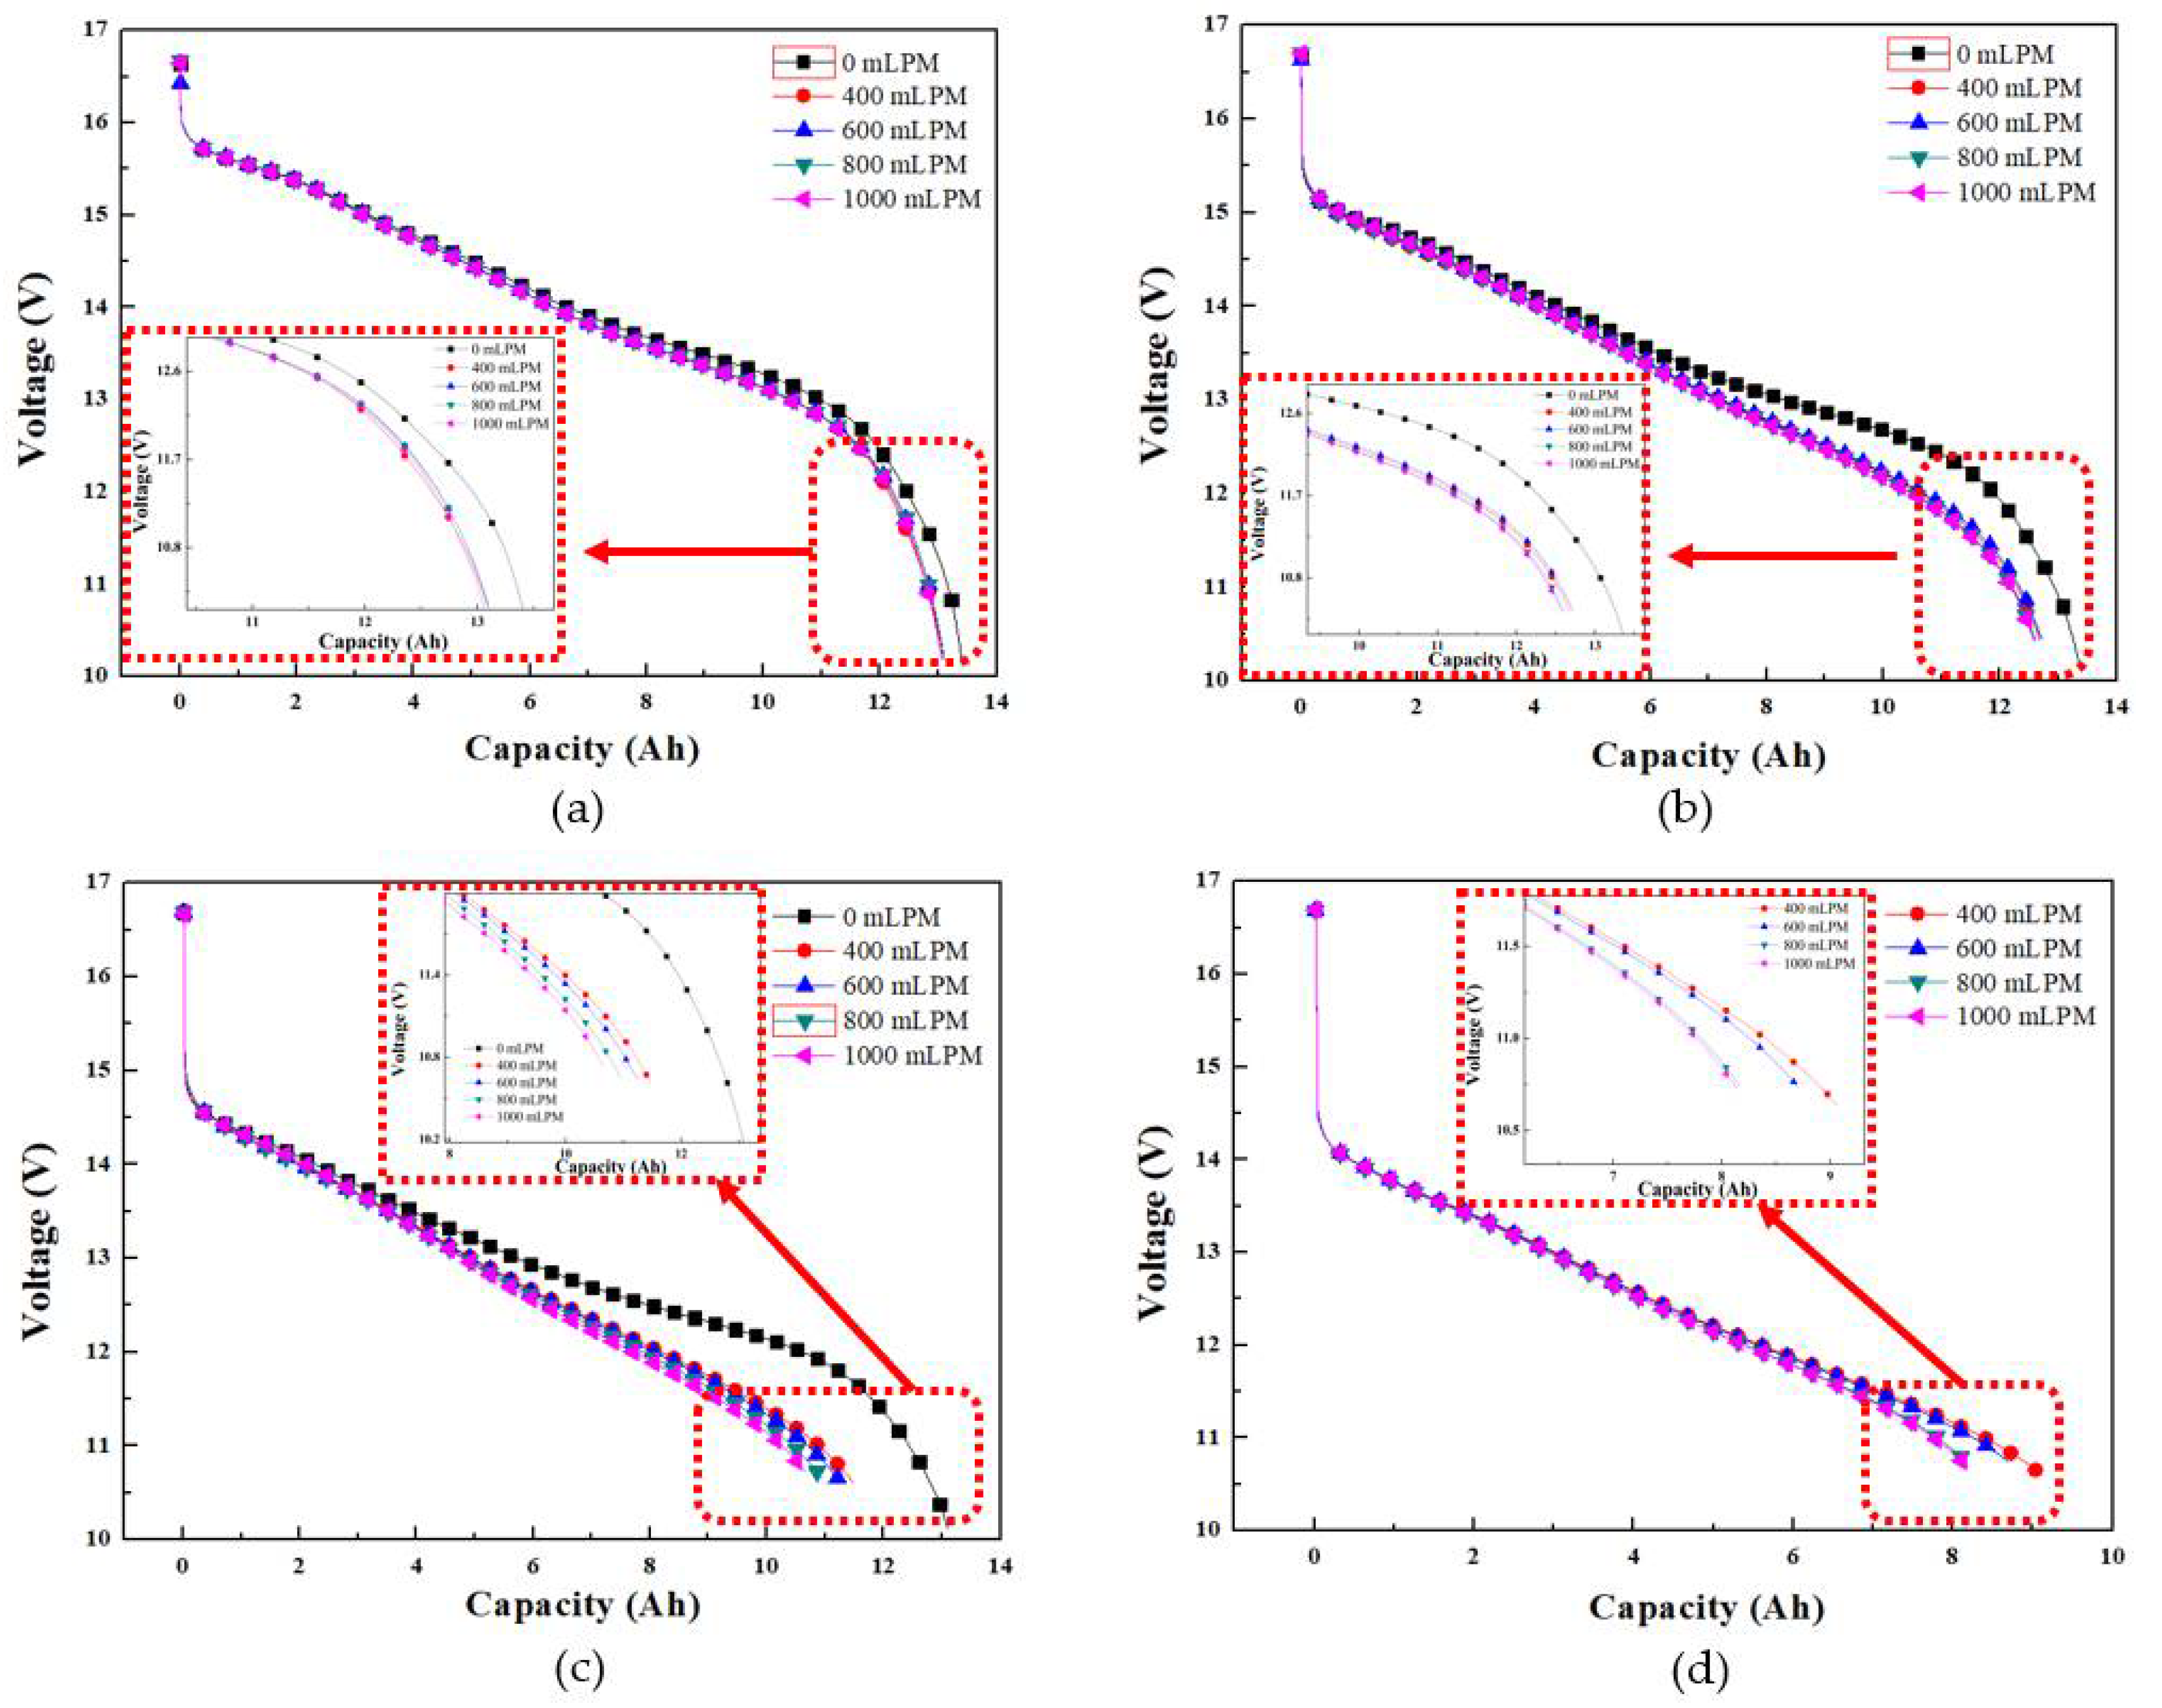
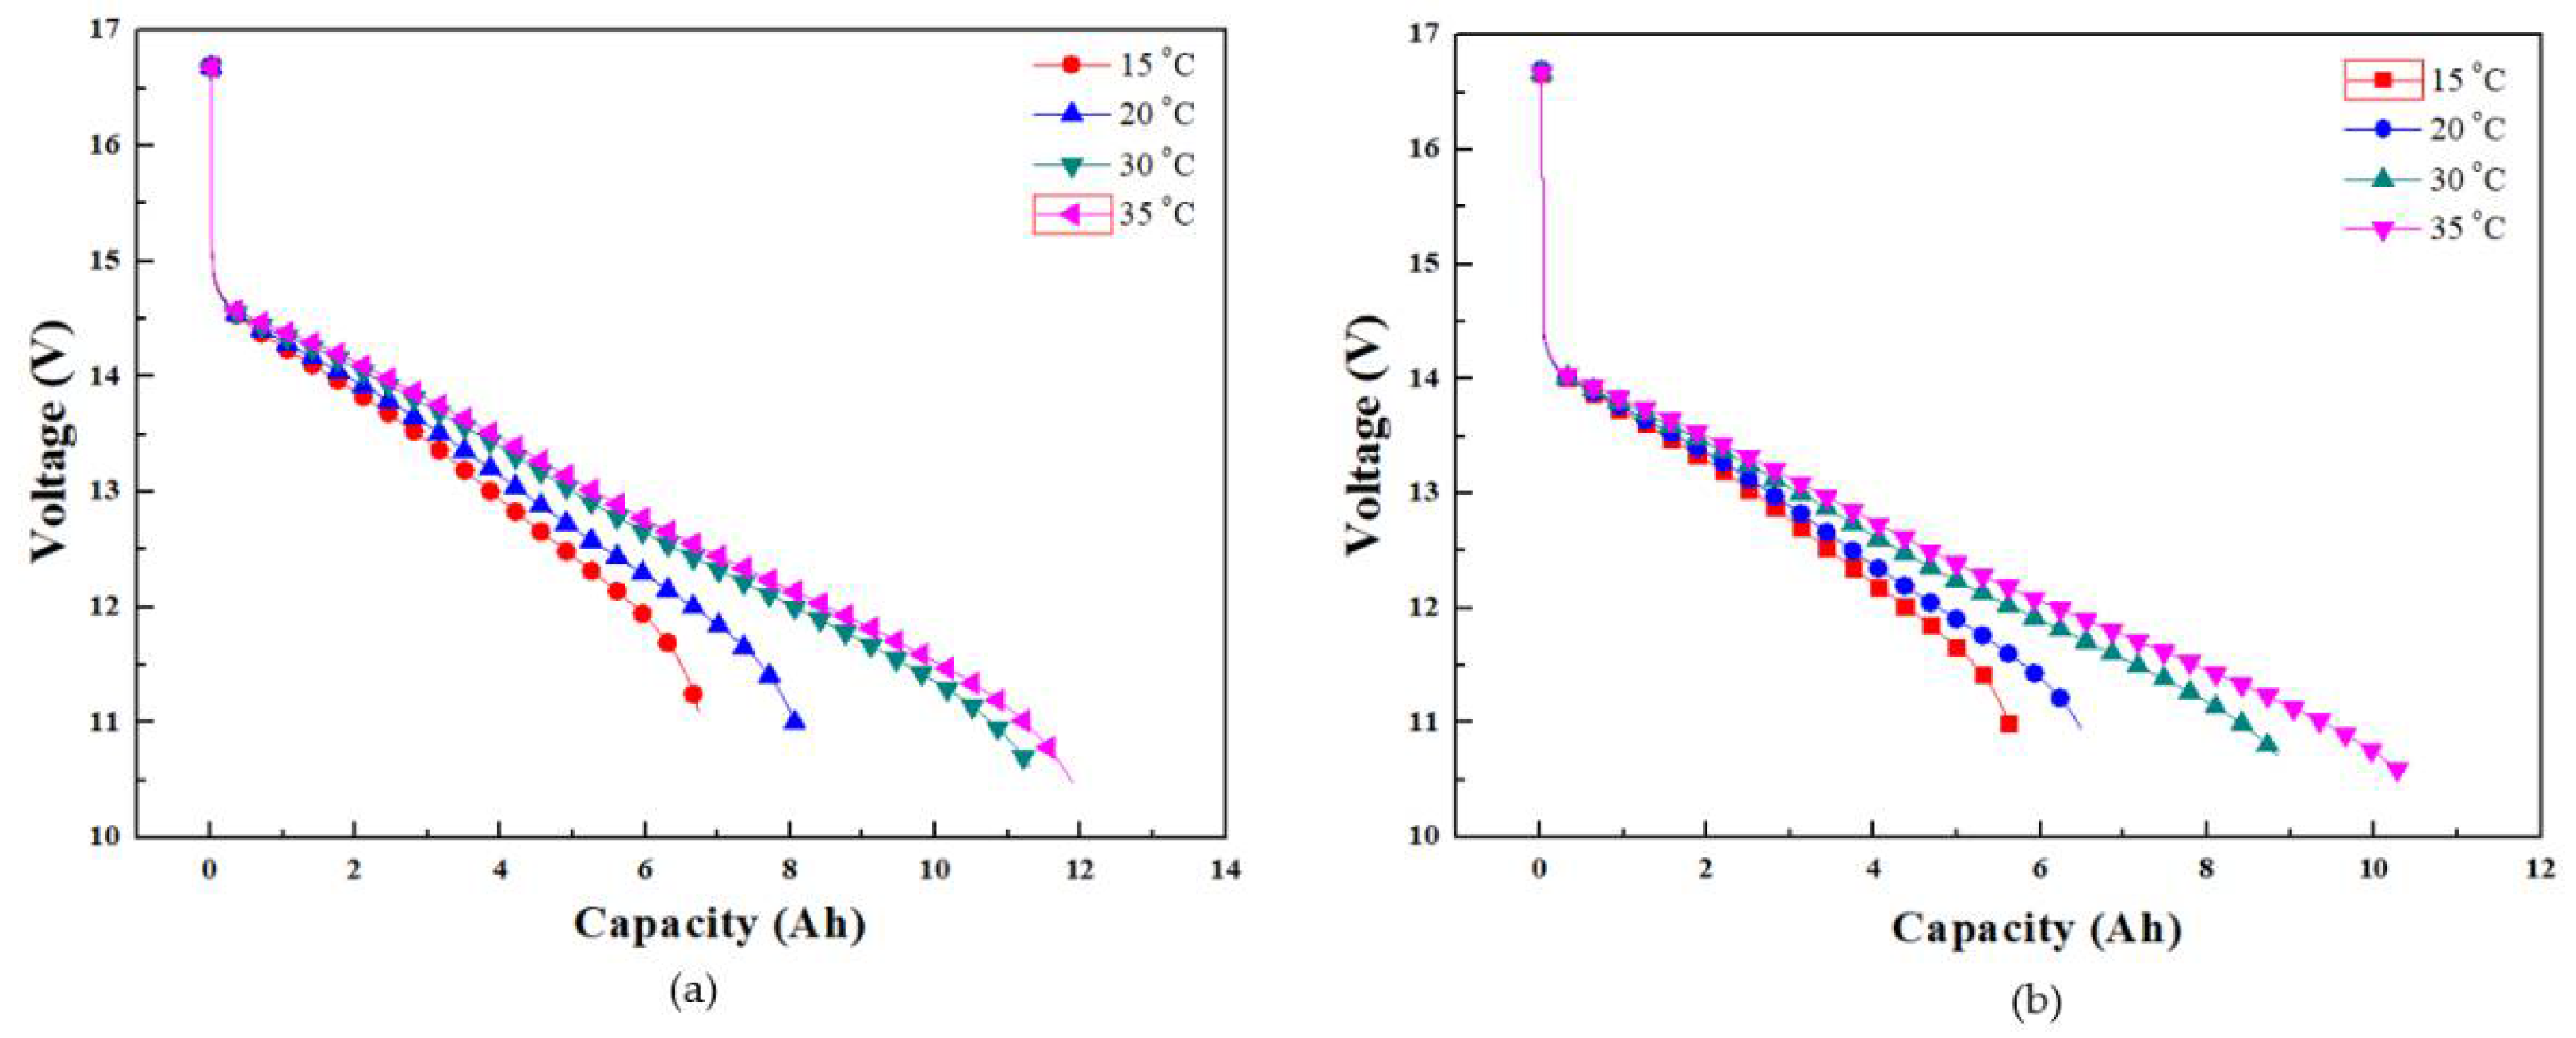
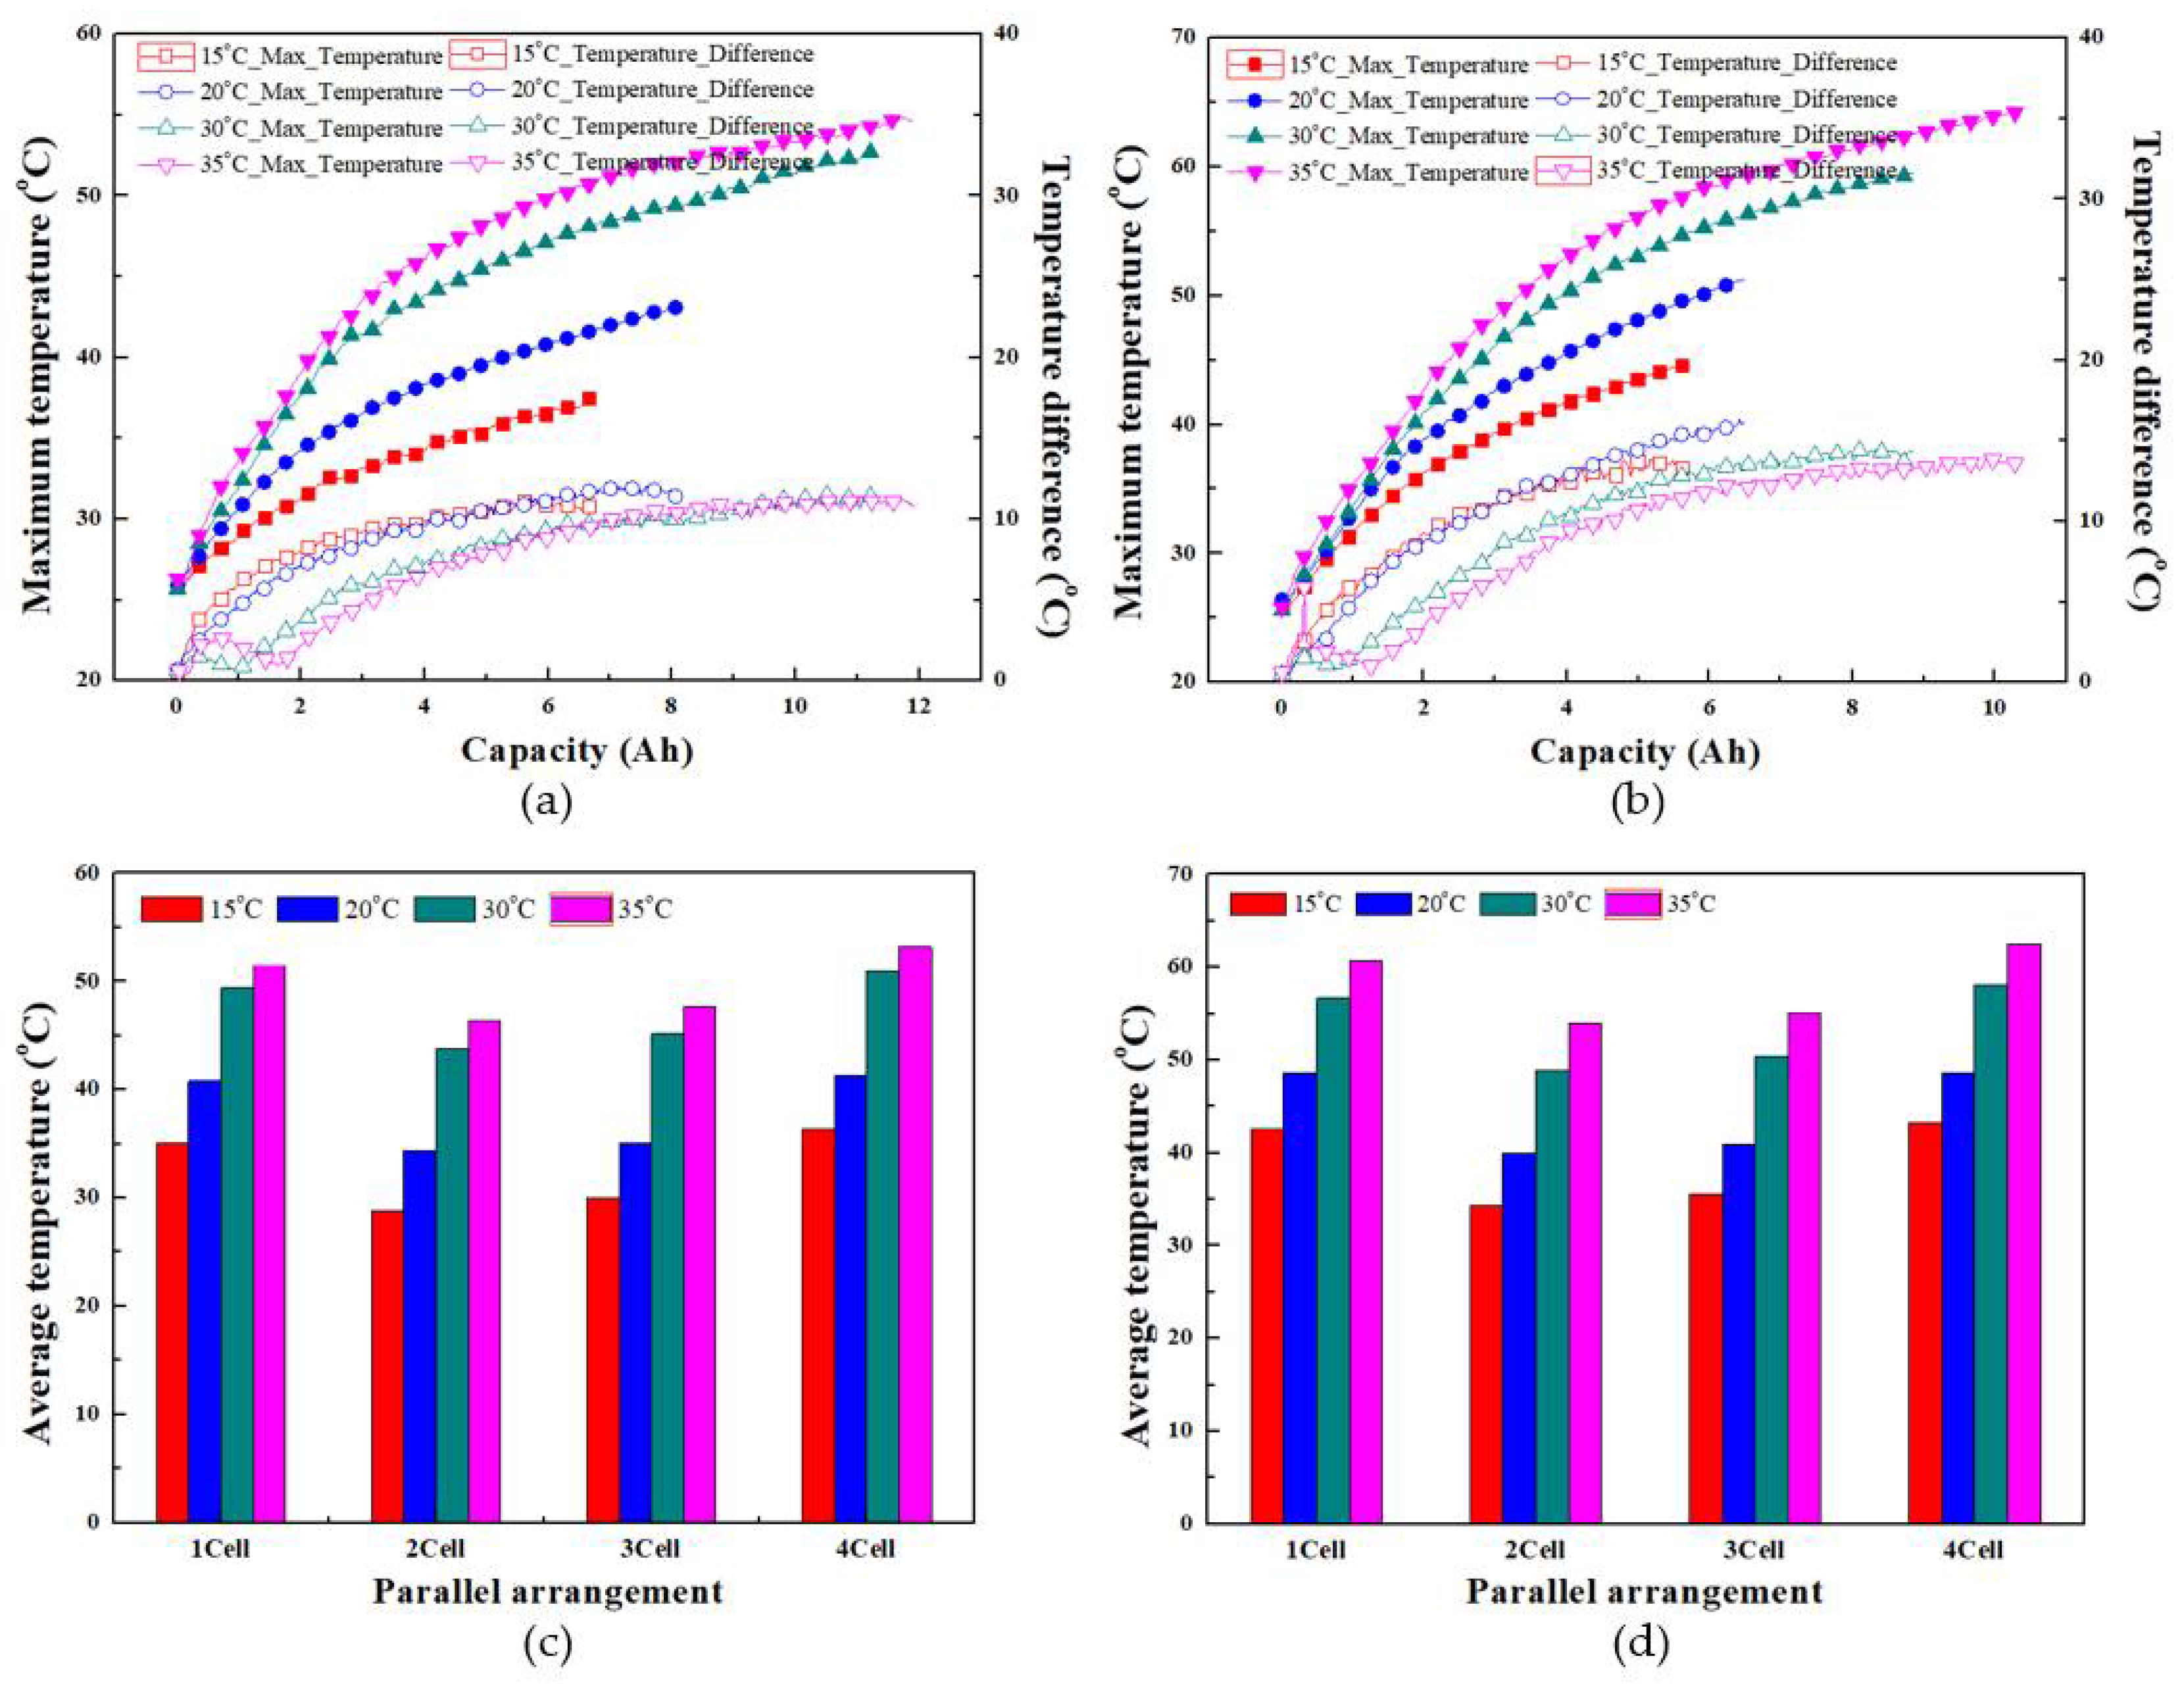
3.1.1. Discharge Characteristics

The variations of operating voltage and discharge capacity at different discharge rates and volume flow rates are shown in Figure 3. The natural convection experiments are conducted at 1C, 2C, and 3C discharge rates and not performed at 4C discharge rate due to the higher temperature and safety issue. The electrochemical characteristics of battery including operating voltage and discharge capacity are affected by its operating temperature [28]. It is observed that the natural convection shows greater discharge capacity and operating voltage than the force convection because the internal resistance in the natural convection is lower compared to the forced convection. Tong et al. concluded that with increase in the cooling effect, the discharge capacity of battery stack decreases because the cooling effect shows low ionic conductivity which results in rising of the internal resistance [29]. Owing to the higher internal resistance at the higher cooling rate, the operating voltage and discharge capacity are low.
The average temperature and operating voltage of each parallel connected battery cell at the end of discharge are shown in Figure 4 for volume flow rate of 1000 mLPM (force convection). The parallel connected battery cell shows standard deviations of voltage as 0.043, 0.089, 0.153, and 0.176 and the standard deviations of temperature as 0.363, 2.20, 2.82, and 3.873 at discharge rates of 1C, 2C, 3C, and 4C, respectively. For the parallel connected battery cells, it is observed that the degree of fluctuation between the highest and the lowest values of voltage and temperature is low at low discharge rate which means the uniformity of voltage and temperature is high at low discharge rate while the uniformity decreases with the increase in discharge rate. The voltage uniformity is decreased with the increase in C-rate because at the higher C-rate, the electrochemical reaction is significant to cause an instability of the battery discharge plateau and high battery temperature difference [30]. The thermal uniformity for BTMS is an important factor for the battery performance because the parallel connected battery cells of 2Cell and 3Cell are positioned near the inlet location which show the lower temperature with the lower voltage than the parallel connected battery cells of 1Cell and 4Cells which are located near the side wall at the end of discharge. In addition, the discharge capacity is also decreased with the increase in C-rate because of the decrease in operating voltage. For the natural convection, the discharge capacities are 13.41 Ah, 13.37 Ah, and 13.1 Ah for 1C, 2C, and 3C discharge rates, respectively, because the high current results in overvoltage and decreases the transport of Li-ions at a high reaction rate [31]. For the forced convection, the discharge capacities of the battery pack from 1C to 4C discharge rates are 13.06 Ah, 12.59 Ah, 10.65 Ah, and 8.136 Ah, respectively, at 1000 mLPM because the cooling effect is significant in the force convection. Owing to the increase in the cooling effect with the increase in volume flow rate, both operating voltage and discharge capacity of the battery are decreasing with the increase in volume flow rate.

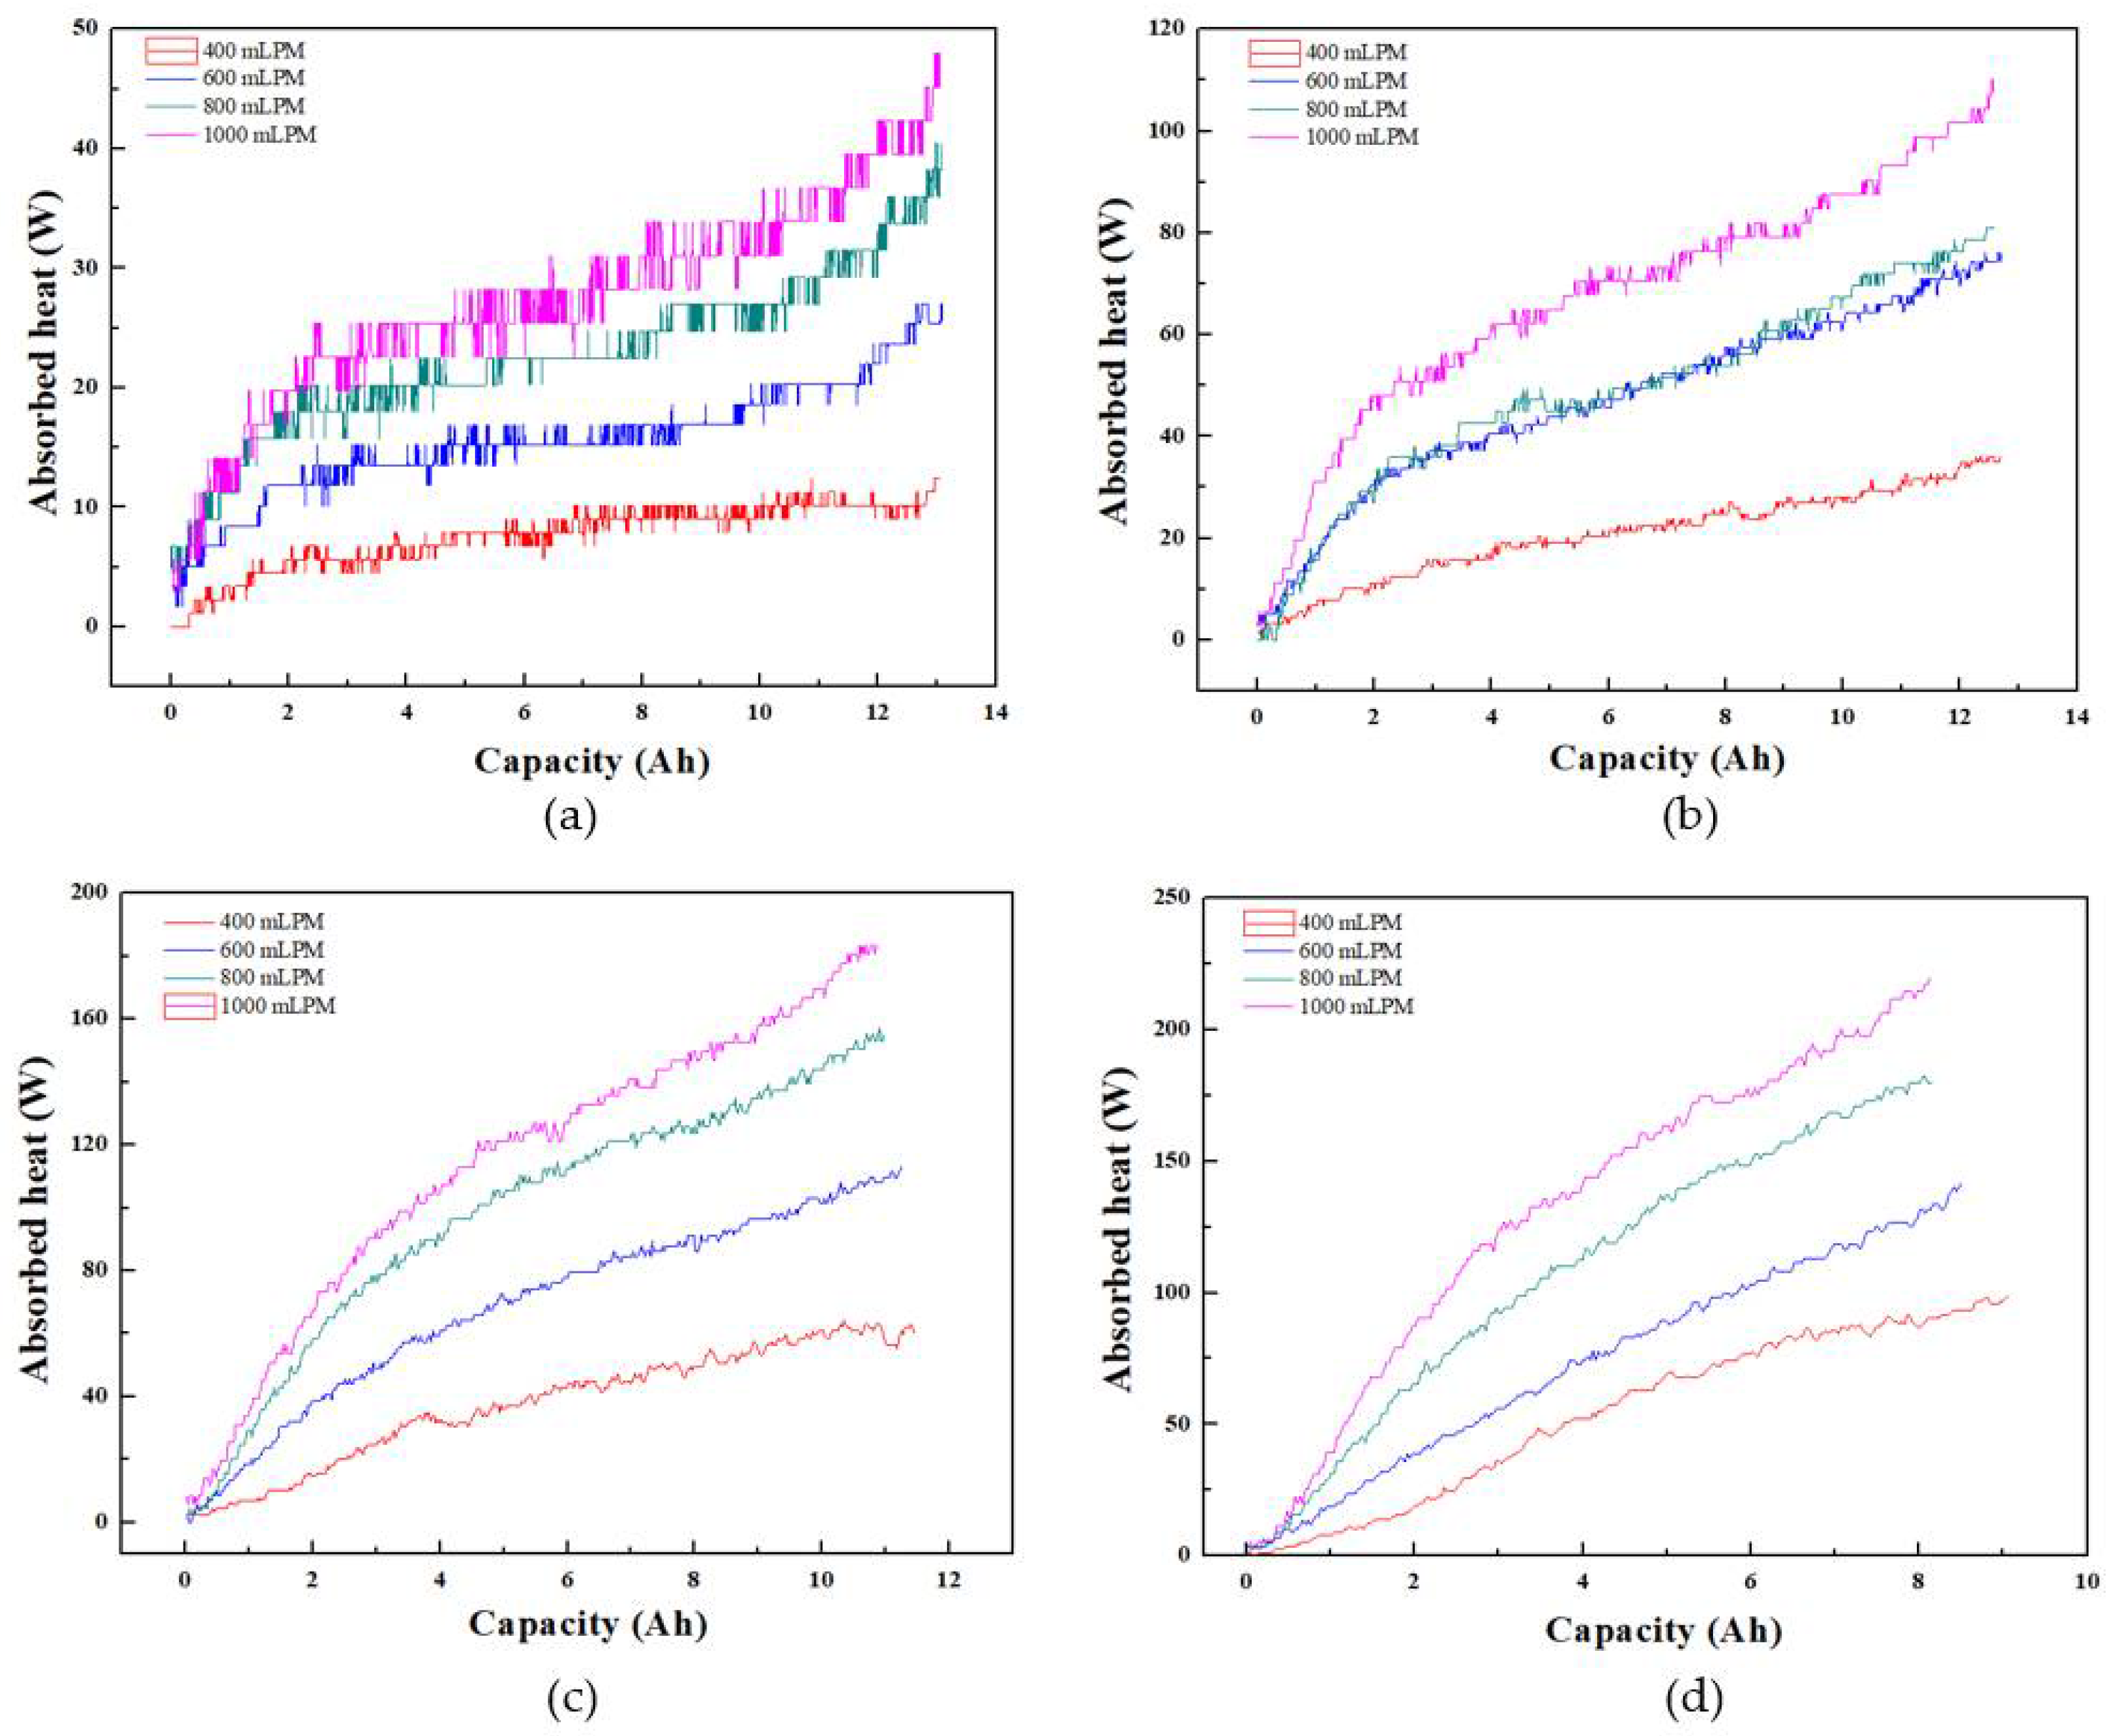
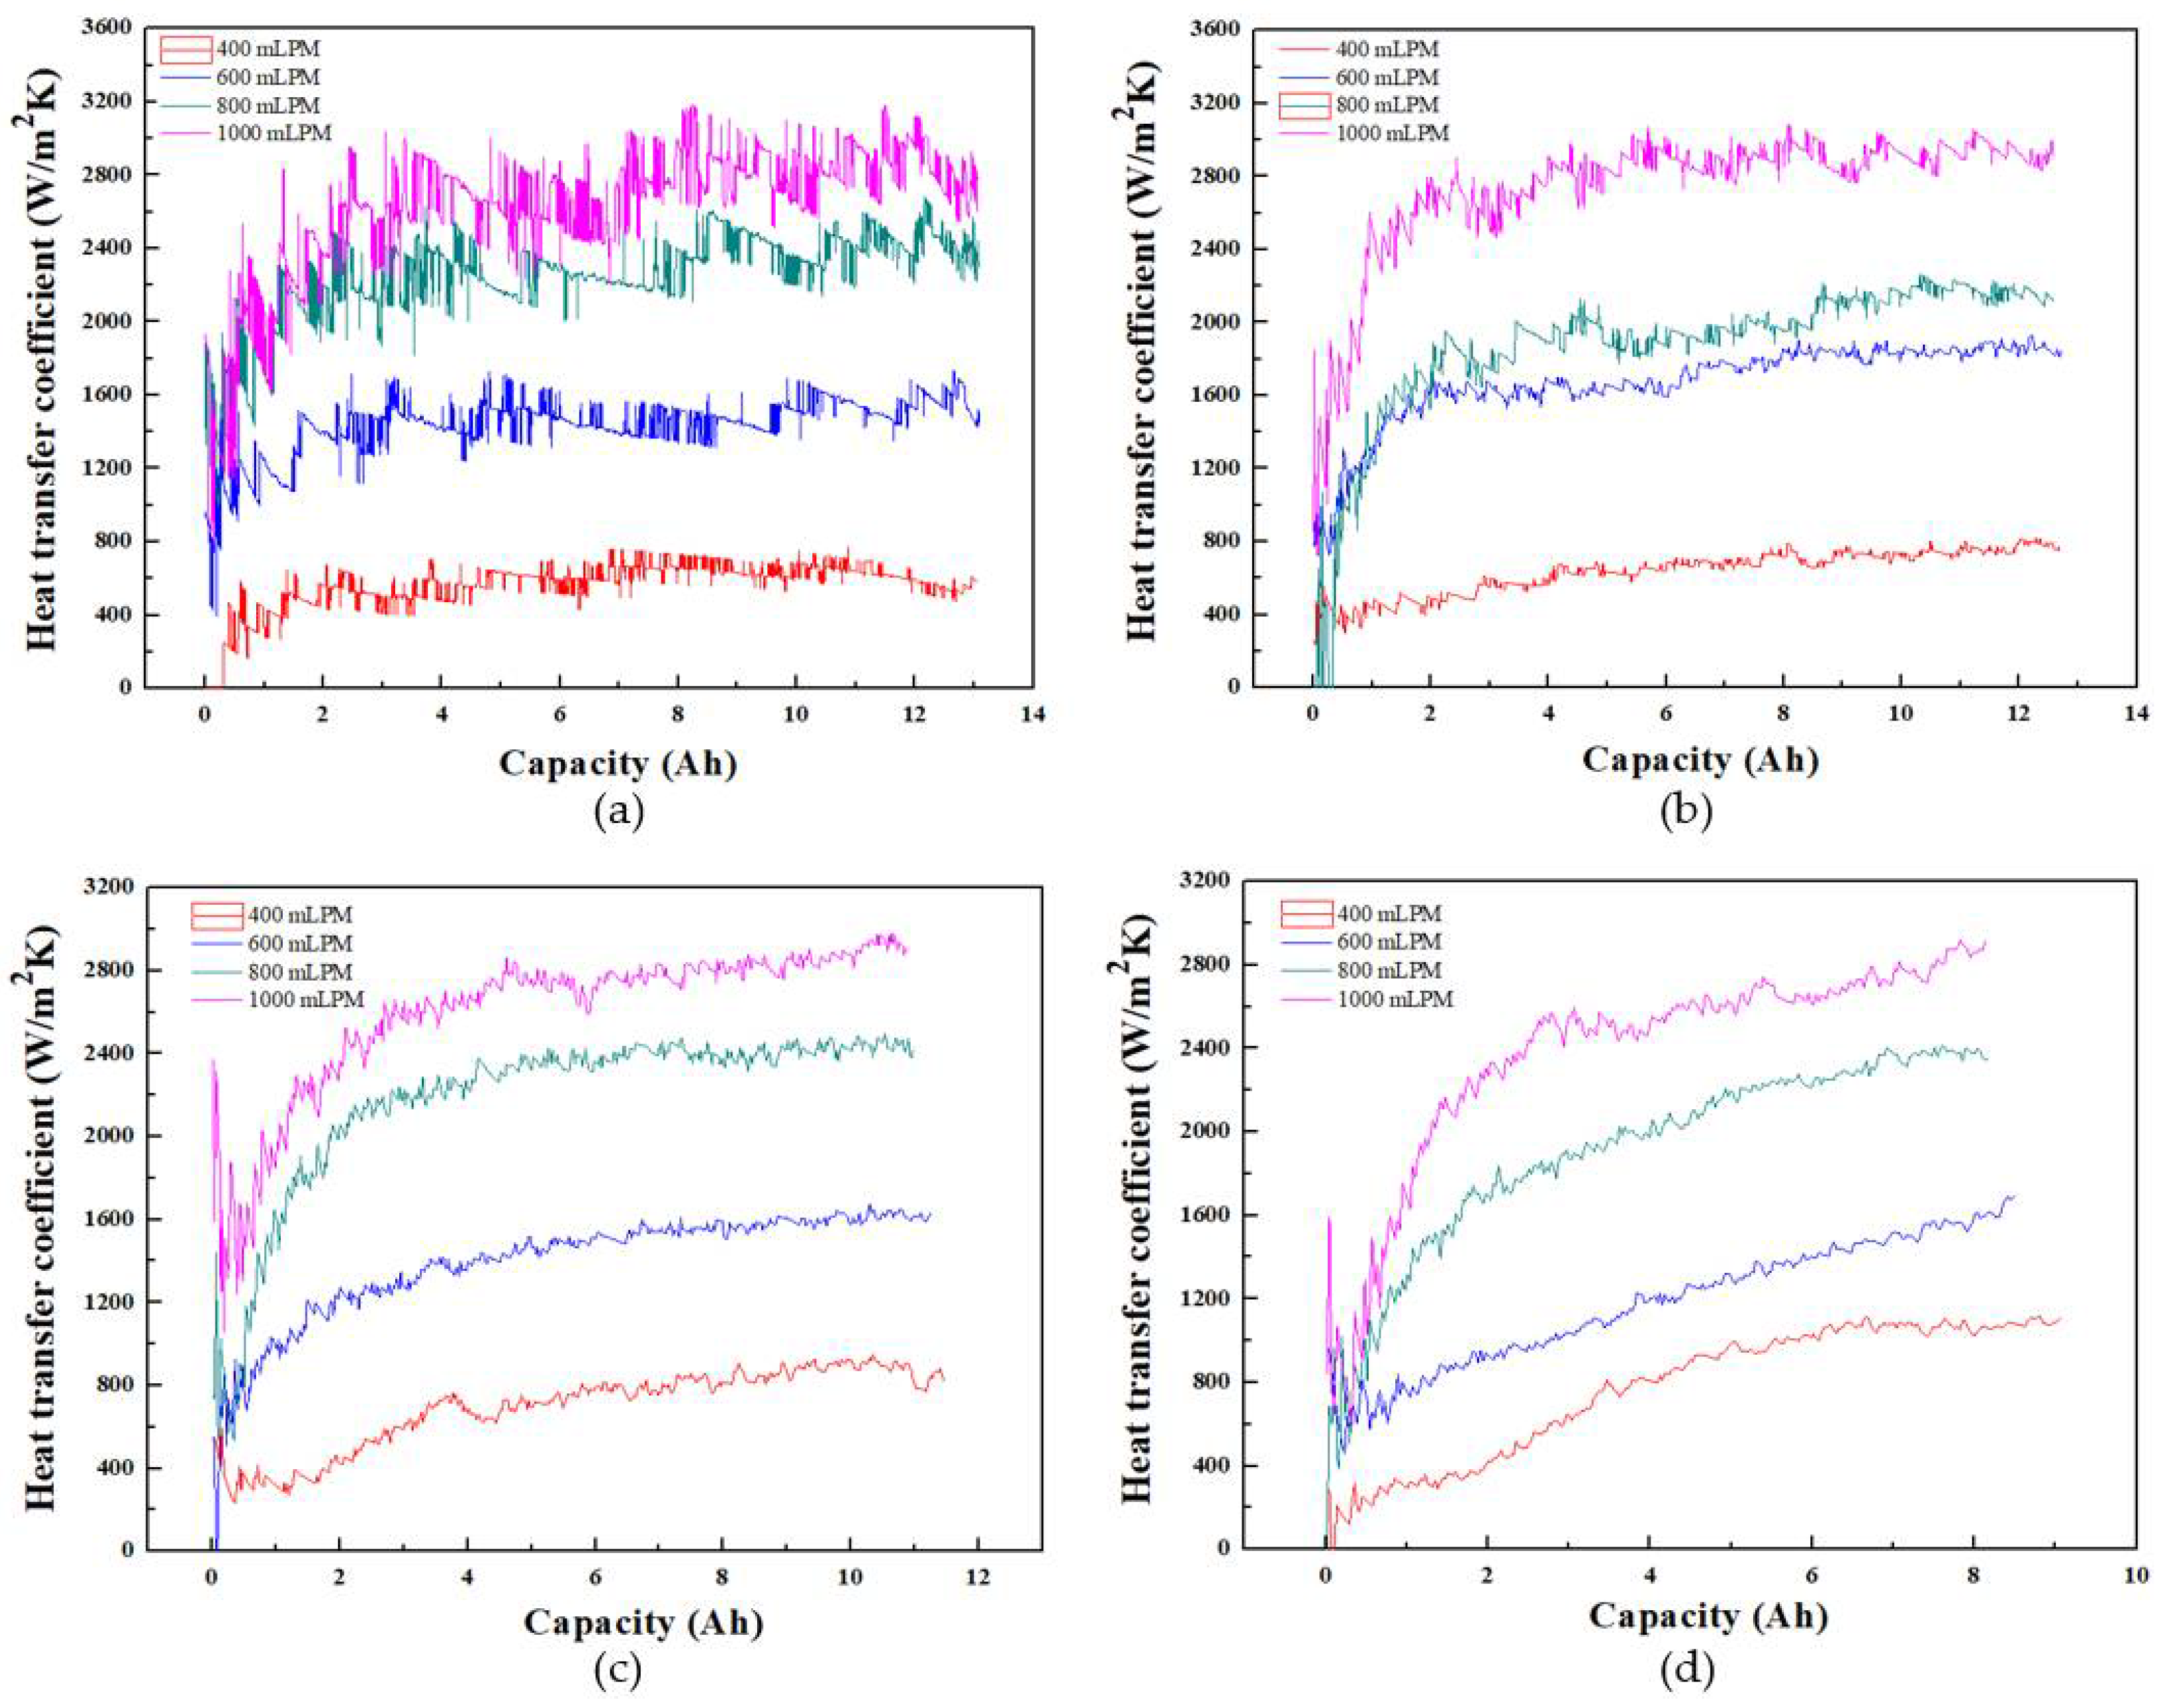
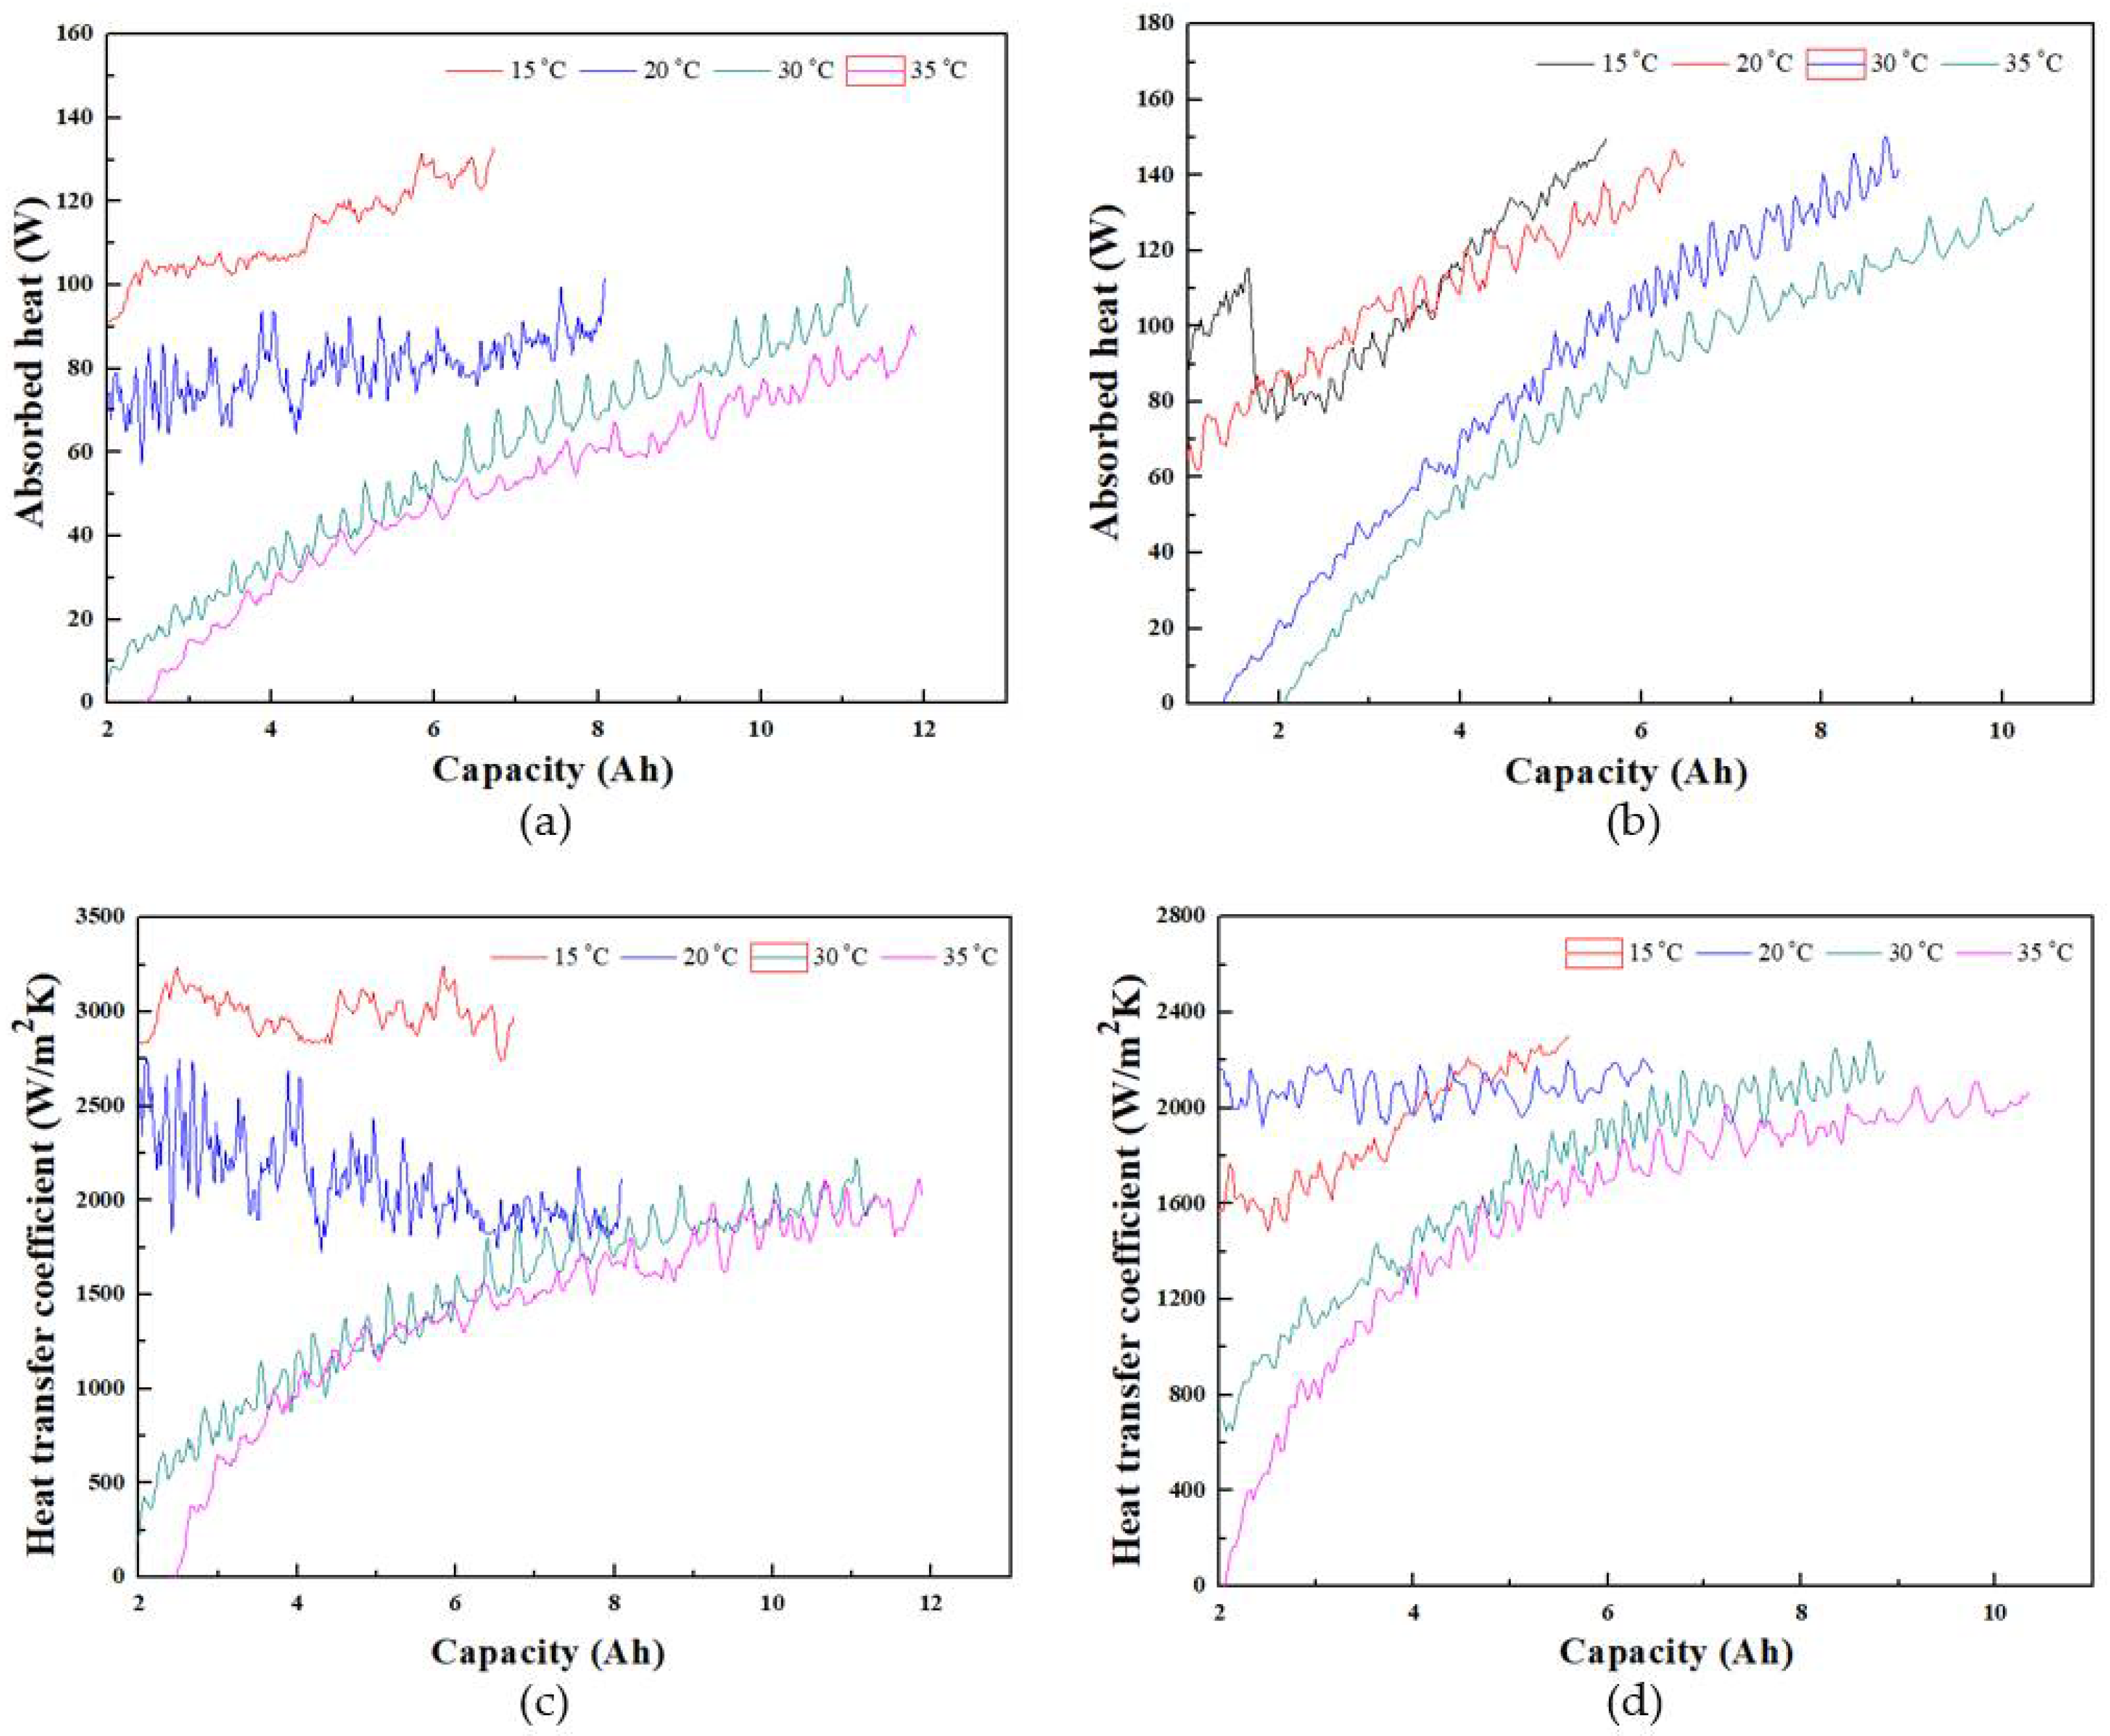
3.1.2. Heat Transfer Characteristics

The variation of maximum temperature and temperature difference of battery with capacity for different C-rates is shown in Figure 5. Compared to the natural convection, the maximum temperature deceases by 31.06%, 37.61%, and 37.24% for 1C, 2C, and 3C discharge rates, respectively, at the end of discharge in case of 1000 mLPM (force convection). In Figure 5a, the maximum temperatures of 33.5 °C, 32.6 °C, 32.1 °C, and 32.4 °C are reported at the side locations of cell number 4, 4, 4, and 15 for volume flow rates of 400 mLPM, 600 mLPM, 800 mLPM, and 1000 mLPM, respectively. In Figure 5b, the maximum temperatures of 43.1 °C, 43.1 °C, 42.7 °C, and 42.3 °C are reported at the side wall locations of cell number 13, 1, 4, 4 for volume flow rates of 400 mLPM, 600 mLPM, 800 mLPM, and 1000 mLPM, respectively. In Figure 5c, the maximum temperatures of 53 °C, 53.5 °C, 53.8 °C, and 54.1 °C are reported for volume flow rates of 400 mLPM, 600 mLPM, 800 mLPM, and 1000 mLPM, respectively, at the side locations of cell number 13, 4, 4, 4. In Figure 5d, the maximum temperatures of 60.4 °C, 60.3 °C, 61.0 °C, and 60.2 °C are observed for volume flow rates of 400 mLPM, 600 mLPM, 800 mLPM, and 1000 mLPM, respectively at the side wall locations of the cell number 4, 13, 4, 4. The maximum battery temperature is within the optimum operating temperature limit for 1C and 2C discharge rates, however, which exceeds the optimum operating range of battery for 3C and 4C discharge rates because of the higher heat generation at the higher discharge rates.
The variation of battery temperature difference with capacity for different discharge rates is also depicted in Figure 5. The battery temperature difference is indicated as the difference between maximum temperature and minimum temperature of battery. In case of natural convection, the temperature differences are below 2 °C. Compared to the natural convection, the temperature difference increases by 66.67%, 387.5%, and 706.67% in case of 1C, 2C, and 3C discharge rates, respectively, at the end of discharge for 1000 mLPM (forced convection). The heat generation for 1C discharge rate is low compared to other discharge rates; hence, the optimal temperature difference is constrained within 5 °C in case of 1C discharge rate for all volume flow rates. The maximum temperature differences of 3.8 °C and 8.3 °C are reported at volume flow rate of 400 mLPM in case of 1C and 2C discharge rates, respectively. The higher volume flow rate can lower the temperature difference and restrict within the limit for the lower discharge rates. However, it is observed that the temperature difference of the battery increases with increase in the heat generation of battery. Therefore, in case of the 3C and 4C discharge rates, the maximum temperature differences of 12.8 °C and 16.8 °C are reported at 1000 mLPM.
The coolant flow path and arrangement of the battery have a significant impact on its temperature [20]. Since the coolant flow path is not optimized in the present study, the change in volume flow rate is not significantly affecting the maximum temperature of the battery; however, the minimum temperature of the battery is significantly affected by volume flow rate in case of 3C and 4C discharge rates. Therefore, to understand the effect of volume flow rate, the average temperatures of parallel connected battery cells are shown in Figure 6a–d for different discharge rates. The battery cells near the inlet position are impacted more by coolant flow than that near the side wall position, hence, the parallel-connected battery cells positioned near the inlet location (2Cell, and 3Cell) have a lower temperature than that positioned at the side wall. However, it is observed that the average temperature of all 16 battery cells decreases with the increase in volume flow rate as shown in Figure 6e because the cooling effect improves with increase in the volume flow rate. The temperature uniformity in entire battery pack could be achieved by unifying the flow distribution of coolant for each cell. Patil et al. pointed out that inserting the baffles for direct cooling can improve the coolant flow distribution in case of battery pack and Fan et al. found that the arrangement of the battery impacts the battery cooling performance [10,32]. Therefore, it is important to design the optimum coolant flow path to maintain the optimal temperature difference and operating temperature at high C-rate for fast charging and high-power output for the direct cooling for BTMS.
Figure 7 shows the variation in heat absorbed by the coolant with capacity for different volume flow rates and discharge rates. It is observed that with the increase in the discharge rate and volume flow rate, the amount of heat absorbed by the coolant increased. The electrochemical reaction is significant at the higher discharge rate which generates the higher amount of heat at the higher discharge rate whereas the electrochemical reaction is slow at low discharge rate which generates less amount of heat. Therefore, the coolant gets the larger scope to absorb the higher heat at the higher discharge rate compared to the lower discharge rate. Furthermore, the higher volume flow rate indicates the higher mass flow rate of coolant which results in the higher heat transfer rate. Hence, the coolant at the higher volume flow rate absorbs the larger amount of heat compared to that at the lower volume flow rate. At the end of discharge, the heat absorbed by the coolant is 12.4 W, 27.05 W, 38.22 W, and 47.99 W at 1C discharge rate; 36.08 W, 76.07 W, 80.94 W, and 107.28 W at 2C discharge rate; 59.76 W, 113.26 W, 155.14 W, and 183.50 W at 3C discharge rate; and 99.22 W, 142.00 W, 179.86 W, and 220.20 W at 4C discharge rate for the volume flow rates of 400 mLPM, 600 mLPM, 800 mLPM, and 1000 mLPM, respectively.
Figure 8 shows the comparison of heat transfer coefficient with capacity for various volume flow rates and discharge rates of 1C to 4C. The enhancement in heat absorbed by coolant with the increase in volume flow rate and discharge rate results in the improvement of heat transfer coefficient with the increase in volume flow rate and discharge rate. The higher volume flow rate results in the superior heat transfer coefficient as the convection heat transfer rate is maximum at the higher volume flow rate. As mentioned, the higher discharge rate shows the higher heat generation which excites the coolant heat transfer rate to maximum. However, the battery surface temperature is high at the higher discharge rate owing to the higher heat generation which results in the higher heat transfer from the battery to coolant and thus the higher convection heat transfer rate. Hence, to evaluate the heat transfer coefficient at various discharge rates, the ratio of coolant heat transfer rate to convection heat transfer rate needs be considered. This ratio at various discharge rates might increase or decrease depending on the dominance of coolant heat transfer rate or convection heat transfer rate. At the end of discharge for the volume flow rates of 400 mLPM, 600 mLPM, 800 mLPM, and 1000 mLPM, the heat transfer coefficients are evaluated as 579.82 W/m2-K, 1482.74 W/m2-K, 2294.24 W/m2-K, and 2775.28 W/m2-K, respectively, at 1C discharge rate; as 778.54 W/m2-K, 1845.31 W/m2-K, 2117.86 W/m2-K, and 2910.69 W/m2-K, respectively, at 2C discharge rate; as 820.35 W/m2-K, 1633.31 W/m2-K, 2421.13 W/m2-K, and 2894.04 W/m2-K, respectively, at 3C discharge rate; and as 1109.02 W/m2-K, 1692.94 W/m2-K, 2349.10 W/m2-K, and 2884.25 W/m2-K, respectively, at 4C discharge rate.

3.2. Effect of Inlet Temperature

3.2.1. Discharge Characteristics

In case of direct liquid cooling, there is absence of auxiliary components (such as cooling plate and mini channel in case of indirect cooling) so the coolant inlet temperature can directly affect the electric performance of the battery. Therefore, the inlet temperature of the coolant is critical design factor for direct liquid cooling of battery. The operating voltage and discharge capacity at different discharge rates and inlet temperatures of coolant are shown Figure 9. The discharge capacities of the battery pack are 6.73 Ah, 8.09 Ah, 11.31 Ah, and 11.88 Ah at 3C discharge rate and 5.61 Ah, 6.49 Ah, 8.85 Ah, and 10.34 Ah at 4C discharge rate for coolant inlet temperatures of 15 °C, 20 °C, 30 °C, and 35 °C, respectively. It is observed that the inlet temperature of coolant significantly affects the electric performance of battery. With the decrease in coolant inlet temperature, the cooling effect improves which results in the increase in the internal resistance and thus the operating voltage and discharge capacity decrease. Wu et al. claimed that the ohmic resistance increases with the decrease in the ambient temperature which results in the decrease in the electrical performance of battery [33]. Lu et al. also pointed that, at the low ambient temperature, the ionic conductivity of electrolyte, electrode, and SEI decreased which results in the decrease in battery operating voltage [34]. As the coolant inlet temperature increases, the battery electrical performance is increases but it is hard to maintain the optimal operating temperature (25–40 °C) for battery at high C-rate. Compared to coolant inlet temperature of 35 °C, the reductions of battery capacity are reported as 40.35% and 45.74% at 3C and 4C discharge rates, respectively, for coolant inlet temperature of 15 °C.

3.2.2. Heat Transfer Characteristics

Figure 10a,b show the variation of maximum temperature and temperature difference with capacity for various coolant inlet temperatures and discharge rates of 3C and 4C. The coolant at the lower temperature absorbs a larger amount of heat from the battery and thus results in the lower maximum temperature of battery because the coolant at the lower temperature has the higher temperature gradient with battery temperature compared to coolant at the higher temperature. The higher gradient between two sources with different temperatures proposes the higher potential to absorb heat. Therefore, with the decrease in coolant inlet temperature the battery maximum temperature decreases. Furthermore, battery generates the larger amount of heat at the higher discharge rate of 4C compared to 3C discharge rate which results in the higher values of battery maximum temperature in case of 4C discharge rate compared to 3C discharge rate. Therefore, at the same inlet temperature of coolant, the maximum temperature of the battery is higher at 4C discharge rate compared to 3C discharge rate. The battery maximum temperatures of 37.4 °C, 43.0 °C, 52.7 °C, and 54.7 °C in case of 3C discharge rate and of 44.6 °C, 51.3 °C, 59.5 °C, and 64.3 °C in case of 4C discharge rate are reported for coolant inlet temperatures of 15 °C, 20 °C, 25 °C, and 35 °C, respectively, at the end of discharge. At each coolant inlet temperature, the temperature difference of the battery depends on the difference between maximum and minimum temperatures of battery. Like the maximum temperature of battery, the minimum temperature of the battery decreases with decrease in the coolant inlet temperature for both discharge rates. The dominance of maximum or minimum temperature of battery has an impact on the increasing or decreasing trend of battery temperature difference at each coolant inlet temperature. For example, the maximum and minimum temperatures of battery increase with the increase in coolant inlet temperature; however, the temperature difference of battery might increase or decrease. However, the higher discharge rate with the higher heat generation shows the superior battery temperature difference compared to the lower discharge rate with less heat generation. At the end of discharge, the battery temperature differences of 10.5 °C, 11.4 °C, 11.3 °C, and 10.8 °C in case of 3C discharge rate and of 13.3 °C, 16.1 °C, 14.3 °C, and 13.6 °C in case of 4C discharge rate are observed for coolant inlet temperatures of 15 °C, 20 °C, 25 °C, and 35 °C, respectively. The average temperature of the parallel connected battery cells for various coolant inlet temperatures is shown in Figure 10c,d at discharge rates of 3C and 4C. Owing to the decrease in the maximum and minimum temperatures of battery with the decrease in coolant inlet temperature, the average temperature of each parallel connected battery cell decreases with the decrease in coolant inlet temperature for both discharge rates. The higher discharge rate has shown the higher battery average temperature compared to the lower discharge rate for each coolant temperature because of the higher heat generation. The larger amount of coolant flow is experienced by the cells at the inlet compared to that at the side walls, therefore, the parallel connected battery cells 2 and 3 show the lower average temperature as they are located near the inlet of coolant flow compared to the parallel connected battery cells 1 and 4 which are located near the side walls. However, the average temperature of whole battery pack decreases with the decrease in coolant inlet temperature for both discharge rates of 3C and 4C. The battery average temperatures of 32.6 °C, 37.9 °C, 47.3 °C, and 49.8 °C at 3C discharge rate and that of 38.9 °C, 44.5 °C, 53.5 °C, and 58.1 °C at 4C discharge rate are evaluated for coolant inlet temperatures of 15 °C, 20 °C, 25 °C, and 35 °C, respectively.
Figure 11a,b show the effect of coolant inlet temperature on heat absorbed by coolant at discharge rates of 3C and 4C. As mentioned, the coolant at the lower temperature has the higher potential to absorb heat compared to that at the higher temperature. The heat absorbed by coolant increases with the decrease in coolant inlet temperature for both discharge rates because the lower coolant inlet temperature shows the lower battery maximum temperature which indicates that the coolant is absorbing the larger amount of heat at the lower coolant inlet temperature. Furthermore, the larger amount of heat is offered at the higher discharge rate which results in the higher amount of heat absorbed by coolant at the higher discharge rate compared to the lower discharge rate. The heat absorbed by coolant is evaluated as 132.97 W, 101.92 W, 95.70 W, and 87.80 W at 3C discharge rate and 149.91 W, 143.42 W, 138.05 W, and 132.97 W at 4C discharge rate for coolant inlet temperatures of 15 °C, 20 °C, 25 °C, and 35 °C, respectively. The heat absorbed by coolant increases with the decrease in coolant inlet temperature which results in the increase in heat transfer coefficient with the decrease in coolant inlet temperature for both discharge rate. However, the higher discharge rate of 4C shows the higher values of heat transfer coefficient compared to the lower discharge rate of 3C because in case of the higher discharge rate, the higher heat generation results in the higher battery surface temperature hence, the convection heat transfer rate is superior to the lower discharge rate. At the end of discharge, the heat transfer coefficients of 2975.61 W/m2-K, 2116.43 W/m2-K, 2042.99 W/m2-K, and 2027.62 W/m2-K in case of 3C discharge rate and of 2290.19 W/m2-K, 2151.89 W/m2-K, 2090.78 W/m2-K, and 1639.79 W/m2-K in case of 4C discharge rate are evaluated for coolant inlet temperatures of 15 °C, 20 °C, 25 °C, and 35 °C, respectively.
To assure the practical feasibility of direct liquid cooling for the thermal management of battery in electric vehicles, the present work proposes experimental investigations on thermal and electrical performance characteristics of lithium-ion battery with immersion cooling. The investigated dielectric fluid immersion cooling technology and proposed findings in the present study could be added as a reference database to the open literature to improve the overall performance of direct liquid cooling for electric vehicle batteries. The aim of the present study is to investigate and elaborate the discharge and heat transfer characteristics of lithium-ion battery with dielectric fluid immersion cooling under the influence of various factors. In future, the detailed numerical study will be conducted focusing on the parametric and optimization investigations on thermal and electrical performances of lithium-ion battery pack with immersion cooling system considering fins and baffles.

4. Conclusions

The discharge and heat transfer characteristics of dielectric immersion cooling system for the thermal management of lithium-ion battery are experimentally investigated in the present work. The operating voltage, discharge capacity, maximum temperature, temperature difference, average temperature, heat absorbed, and heat transfer coefficient of battery pack with immersion cooling are studied for various conditions of discharge rate, volume flow rate, and inlet temperature. The operating voltage and discharge capacity of battery decreases with the increase in discharge rate. The discharge capacity decreases from 13.06 Ah to 8.136 Ah with the increase in discharge rate from 1C to 4C. The discharge capacity increases from 10.61 Ah to 10.73 Ah at 3C discharge rate and 10.64 Ah to 10.72 Ah at 4C discharge rate for the increase in volume flow rate from 400 mLPM to 1000 mLPM. With the increase coolant inlet temperatures from 15 °C to 35 °C, the discharge capacity increases from 6.73 Ah to 11.88 Ah at 3C discharge rate and 5.61 Ah to 10.34 Ah at 4C discharge rate. The enhancement in the cooling effect with the increase in volume flow rate and the decrease in coolant inlet temperature reduces operating voltage and discharge capacity of battery. The battery heat transfer performance for immersion cooling improves with the increase in volume flow rate and the decrease in coolant inlet temperature. At 4C discharge rate, the average temperature of battery pack decreases from 56.18 °C to 52.93 °C and the heat transfer coefficient increases from 1109.02 W/m2-K to 2884.25 W/m2-K with the increase in volume flow rates from 400 mLPM to 1000 mLPM. For the increase in coolant inlet temperature from 15 °C to 35 °C, the increment in average temperature of battery pack and the reduction in heat transfer coefficient are observed as 38.94 °C to 58.06 °C and 2290.19 W/m2-K to 1639.79 W/m2-K, respectively, at 4C discharge rate. In future works, the focus will be on enhancing the thermal uniformity of battery pack for immersion cooling by providing fins and baffles in the existing model. This work will be extended numerically to further investigate the heat transfer and electrical characteristics of battery pack with immersion cooling under the influence of various operating conditions.

Author Contributions

Conceptualization, J.-W.H., K.S.G. and M.-Y.L.; methodology, J.-W.H. and K.S.G.; formal analysis, J.-W.H.; investigation, J.-W.H., K.S.G. and S.-G.H.; resources, J.-W.H., K.S.G. and M.-Y.L.; data curation, J.-W.H. and K.S.G.; writing—original draft preparation, J.-W.H., K.S.G. and M.-Y.L.; writing—review and editing, J.-W.H., K.S.G. and M.-Y.L.; visualization, J.-W.H., K.S.G. and S.-G.H.; supervision, M.-Y.L.; project administration, M.-Y.L.; funding acquisition, M.-Y.L. All authors have read and agreed to the published version of the manuscript.

Funding

This work was supported by the Dong-A University research fund.

Data Availability Statement

The data presented in this study will be available on request to the corresponding author.

Conflicts of Interest

The authors declare no conflict of interest.

References

  1. Liu, H.; Wei, Z.; He, W.; Zhao, J. Thermal issues about Li-ion batteries and recent progress in battery thermal management systems: A review. Energy Convers. Manag. 2017, 150, 304–330. [Google Scholar] [CrossRef]
  2. Patil, M.S.; Panchal, S.; Kim, N.; Lee, M.Y. Cooling performance characteristics of 20 Ah lithium-ion pouch cell with cold plates along both surfaces. Energies 2018, 11, 2550. [Google Scholar] [CrossRef] [Green Version]
  3. Liu, H.; Xiao, Q.; Jin, Y.; Mu, Y.; Meng, J.; Zhang, T.; Teodorescu, R. Improved LightGBM-Based Framework for Electric Vehicle Lithium-Ion Battery Remaining Useful Life Prediction Using Multi Health Indicators. Symmetry 2022, 14, 1584. [Google Scholar] [CrossRef]
  4. Patil, M.S.; Seo, J.H.; Panchal, S.; Jee, S.W.; Lee, M.Y. Investigation on thermal performance of water-cooled Li-ion pouch cell and pack at high discharge rate with U-turn type microchannel cold plate. Int. J. Heat Mass Transf. 2020, 155, 119728. [Google Scholar] [CrossRef]
  5. Zhang, X.; Li, Z.; Luo, L.; Fan, Y.; Du, Z. A review on thermal management of lithium-ion batteries for electric vehicles. Energy 2022, 238, 121652. [Google Scholar] [CrossRef]
  6. Jiaqiang, E.; Yi, F.; Li, W.; Zhang, B.; Zuo, H.; Wei, K.; Deng, Y. Effect analysis on heat dissipation performance enhancement of a lithium-ion-battery pack with heat pipe for central and southern regions in China. Energy 2021, 226, 120336. [Google Scholar]
  7. Lee, M.Y.; Kim, N.; Seo, J.H.; Patil, M.S. Thermal abuse behavior of the LIR2450 micro coin cell battery having capacity of 120 mAh with internal short circuit by penetrating element. Symmetry 2020, 12, 246. [Google Scholar] [CrossRef] [Green Version]
  8. Liu, Z.; Huang, J.; Cao, M.; Jiang, G.; Yan, Q.; Hu, J. Experimental study on the thermal management of batteries based on the coupling of composite phase change materials and liquid cooling. Appl. Therm. Eng. 2021, 185, 116415. [Google Scholar] [CrossRef]
  9. Huang, Y.; Wei, C.; Fang, Y. Numerical investigation on optimal design of battery cooling plate for uneven heat generation conditions in electric vehicles. Appl. Therm. Eng. 2022, 211, 118476. [Google Scholar] [CrossRef]
  10. Patil, M.S.; Seo, J.H.; Lee, M.Y. A novel dielectric fluid immersion cooling technology for Li-ion battery thermal management. Energy Convers. Manag. 2021, 229, 113715. [Google Scholar] [CrossRef]
  11. Akbarzadeh, M.; Kalogiannis, T.; Jaguemont, J.; Jin, L.; Behi, H.; Karimi, D.; Berecibar, M. A comparative study between air cooling and liquid cooling thermal management systems for a high-energy lithium-ion battery module. Appl. Therm. Eng. 2021, 198, 117503. [Google Scholar] [CrossRef]
  12. Tan, X.; Lyu, P.; Fan, Y.; Rao, J.; Ouyang, K. Numerical investigation of the direct liquid cooling of a fast-charging lithium-ion battery pack in hydrofluoroether. Appl. Therm. Eng. 2021, 196, 117279. [Google Scholar]
  13. Roe, C.; Feng, X.; White, G.; Li, R.; Wang, H.; Rui, X.; Wu, B. Immersion cooling for lithium-ion batteries—A review. J. Power Sources 2022, 525, 231094. [Google Scholar] [CrossRef]
  14. Amalesh, T.; Narasimhan, N.L. Liquid cooling vs hybrid cooling for fast charging lithium-ion batteries: A comparative numerical study. Appl. Therm. Eng. 2022, 208, 118226. [Google Scholar] [CrossRef]
  15. Wu, S.; Lao, L.; Wu, L.; Liu, L.; Lin, C.; Zhang, Q. Effect analysis on integration efficiency and safety performance of a battery thermal management system based on direct contact liquid cooling. Appl. Therm. Eng. 2022, 201, 117788. [Google Scholar] [CrossRef]
  16. Chen, D.; Jiang, J.; Kim, G.H.; Yang, C.; Pesaran, A. Comparison of different cooling methods for lithium ion battery cells. Appl. Therm. Eng. 2016, 94, 846–854. [Google Scholar] [CrossRef] [Green Version]
  17. Karimi, G.; Dehghan, A.R. Thermal analysis of high-power lithium-ion battery packs using flow network approach. Int. J. Energy Res. 2014, 38, 1793–1811. [Google Scholar] [CrossRef]
  18. Sundin, D.W.; Sponholtz, S. Thermal management of Li-ion batteries with single-phase liquid immersion cooling. IEEE Open J. Veh. Technol. 2020, 1, 82–92. [Google Scholar] [CrossRef]
  19. Zhou, H.; Dai, C.; Liu, Y.; Fu, X.; Du, Y. Experimental investigation of battery thermal management and safety with heat pipe and immersion phase change liquid. J. Power Sources 2020, 473, 228545. [Google Scholar] [CrossRef]
  20. Dubey, P.; Pulugundla, G.; Srouji, A.K. Direct comparison of immersion and cold-plate based cooling for automotive Li-ion battery modules. Energies 2021, 14, 1259. [Google Scholar] [CrossRef]
  21. Li, Y.; Zhou, Z.; Hu, L.; Bai, M.; Gao, L.; Li, Y.; Song, Y. Experimental studies of liquid immersion cooling for 18650 lithium-ion battery under different discharging conditions. Case Stud. Therm. Eng. 2022, 34, 102034. [Google Scholar] [CrossRef]
  22. Mei, W.; Chen, H.; Sun, J.; Wang, Q. Numerical study on tab dimension optimization of lithium-ion battery from the thermal safety perspective. Appl. Therm. Eng. 2018, 142, 148–165. [Google Scholar] [CrossRef]
  23. Kong, D.; Peng, R.; Ping, P.; Du, J.; Chen, G.; Wen, J. A novel battery thermal management system coupling with PCM and optimized controllable liquid cooling for different ambient temperatures. Energy Convers. Manag. 2020, 204, 112280. [Google Scholar] [CrossRef]
  24. Geng, Z.; Groot, J.; Thiringer, T. A time-and cost-effective method for entropic coefficient determination of a large commercial battery cell. IEEE Trans. Transp. Electrif. 2020, 6, 257–266. [Google Scholar] [CrossRef]
  25. Patil, M.S.; Seo, J.H.; Panchal, S.; Lee, M.Y. Numerical study on sensitivity analysis of factors influencing liquid cooling with double cold-plate for lithium-ion pouch cell. Int. J. Energy Res. 2021, 45, 2533–2559. [Google Scholar] [CrossRef]
  26. Garud, K.S.; Hwang, S.G.; Han, J.W.; Lee, M.Y. Performance characteristics of the direct spray oil cooling system for a driving motor of an electric vehicle. Int. J. Heat Mass Transf. 2022, 196, 123228. [Google Scholar] [CrossRef]
  27. Garud, K.S.; Seo, J.H.; Cho, C.P.; Lee, M.Y. Artificial neural network and adaptive neuro-fuzzy interface system modelling to predict thermal performances of thermoelectric generator for waste heat recovery. Symmetry 2020, 12, 259. [Google Scholar] [CrossRef] [Green Version]
  28. Wei, L.; Jia, L.; An, Z.; Dang, C. Experimental study on thermal management of cylindrical Li-ion battery with flexible microchannel plates. J. Therm. Sci. 2020, 29, 1001. [Google Scholar] [CrossRef]
  29. Tong, W.; Somasundaram, K.; Birgersson, E.; Mujumdar, A.S.; Yap, C. Numerical investigation of water cooling for a lithium-ion bipolar battery pack. Int. J. Therm. Sci. 2015, 94, 259–269. [Google Scholar] [CrossRef]
  30. An, Z.; Jia, L.; Li, X.; Ding, Y. Experimental investigation on lithium-ion battery thermal management based on flow boiling in mini-channel. Appl. Therm. Eng. 2017, 117, 534–543. [Google Scholar] [CrossRef]
  31. Kwon, S.J.; Lee, S.E.; Lim, J.H.; Choi, J.; Kim, J. Performance and life degradation characteristics analysis of NCM LIB for BESS. Electronics 2018, 7, 406. [Google Scholar] [CrossRef] [Green Version]
  32. Fan, Y.; Bao, Y.; Ling, C.; Chu, Y.; Tan, X.; Yang, S. Experimental study on the thermal management performance of air cooling for high energy density cylindrical lithium-ion batteries. Appl. Therm. Eng. 2019, 155, 96–109. [Google Scholar] [CrossRef]
  33. Wu, H.; Zhang, X.; Cao, R.; Yang, C. An investigation on electrical and thermal characteristics of cylindrical lithium-ion batteries at low temperatures. Energy 2021, 225, 120223. [Google Scholar] [CrossRef]
  34. Lu, Z.; Yu, X.L.; Wei, L.C.; Cao, F.; Zhang, L.Y.; Meng, X.Z.; Jin, L.W. A comprehensive experimental study on temperature-dependent performance of lithium-ion battery. Appl. Therm. Eng. 2019, 158, 113800. [Google Scholar] [CrossRef]
Figure 1. (a) Configuration of battery pack with coolant for direct liquid cooling and (b) location of thermocouples for each battery cell.
Symmetry 14 02126 g001
Figure 2. Schematic diagram of experimental setup (a) with radiator and (b) with chiller for coolant cooling.
Symmetry 14 02126 g002
Figure 3. Discharge characteristics of battery for discharge rates of (a) 1C, (b) 2C, (c) 3C, and (d) 4C.
Symmetry 14 02126 g003
Figure 4. Average temperature and voltage of parallel connected battery cells for discharge rates of (a) 1C, (b) 2C, (c) 3C, and (d) 4C.
Symmetry 14 02126 g004
Figure 5. Maximum temperature and temperature difference of the battery pack for (a) 1C, (b) 2C, (c) 3C, and (d) 4C discharge rates.
Symmetry 14 02126 g005
Figure 6. Effect of flow rate on average temperature of parallel-connected battery cells at discharge rates of (a) 1C, (b) 2C, (c) 3C, (d) 4C, and (e) battery pack average temperature.
Symmetry 14 02126 g006
Figure 7. Comparison of heat absorbed by coolant for different flow rates at discharge rates of (a) 1C (b) 2C, (c) 3C, and (d) 4C.
Symmetry 14 02126 g007
Figure 8. Variation of heat transfer coefficient with capacity for various volume flow rates and discharge rates of (a) 1C, (b) 2C, (c) 3C, and (d) 4C.
Symmetry 14 02126 g008
Figure 9. Battery operating voltage with capacity for various coolant inlet temperatures at discharge rates of (a) 3C and (b) 4C.
Symmetry 14 02126 g009
Figure 10. Maximum temperature and temperature difference of battery at discharge rates of (a) 3C and (b) 4C and average temperature of battery at discharge rates of (c) 3C and (d) 4C for various coolant inlet temperatures.
Symmetry 14 02126 g010
Figure 11. Absorbed heat with capacity at discharge rates of (a) 3C and (b) 4C and heat transfer coefficient with capacity at discharge rates of (c) 3C and (d) 4C for various coolant inlet temperatures.
Symmetry 14 02126 g011
Table 1. Specifications of battery cell considered in experiments.
SpecificationValue
Nominal energy (mAh)3500
Minimal energy (mAh)3400
Nominal Voltage (V)3.653
Standard charge current (mA)1700
Standard charge cut off current (mA)50
Max charge voltage (V)4.2 ± 0.05
Discharge cut off voltage (V)2.5
Diameter (mm)18.4 + 0.1/−0.3
Height (mm)65.0 + 0.2
Weight (g)49.0 g
Table 2. Properties of coolant used in direct liquid cooling.
SpecificationValue
Density (kg/m3)805
Specific heat (J/kg · K)2100
Thermal conductivity (W/m · K)0.14
Kinematic viscosity (m2/s)1.94 × 10−7
Electric resistivity (Ohm · cm)109
Freezing point (°C)−40
Flash point (°C)190
Publisher’s Note: MDPI stays neutral with regard to jurisdictional claims in published maps and institutional affiliations.

