Article

An Insight of the Theoretical Physics of Ru-Alloyed Iron Pyrite Studied for Energy Generation

1
Department of Mathematics and Sciences, Prince Sultan University, Riyadh 11586, Saudi Arabia
2
Laboratory of Semiconductors, Nanostructures and Advanced Technologies, Borj Cédrie Science and Technologie Park, Hammam-Lif 2050, Tunisia
3
Departement de Physique, Faculté des Sciences de Bizerte, Université de Carthage, Bizerte 7200, Tunisia
4
Department of Physics, College of Sciences, Imam Mohammed Ibn Saud Islamic University, Riyadh 11432, Saudi Arabia
*
Author to whom correspondence should be addressed.
Symmetry 2022, 14(11), 2252; https://doi.org/10.3390/sym14112252
Submission received: 21 September 2022 / Revised: 19 October 2022 / Accepted: 20 October 2022 / Published: 26 October 2022
(This article belongs to the Special Issue Experimental Particle Physics)

Abstract

:
Pyrite FeS 2 has become the focus of many researchers in thin-film photovoltaics because it has some possibilities in photovoltaics. In this manuscript, we present an experimental and a theoretical study of the electronic structure of pyrite FeS 2 alloyed with a small concentration of 1.19% of ruthenium ( Fe 0.9881 Ru 0.0119 S 2 ) by using the Linear Muffin-Tin Orbital Method in the Atomic-Sphere approximation (LMTO-ASA) calculations and the density of states. We observed that the bandgap of FeS 2 increases from 0.90508 to 1.21586   eV when we replace ~ 1.19 % of the Fe atoms with ruthenium atoms x = 0.0119   concentration   of   Ru . We prove that this low concentration of Ru saved the gap states and the electronic and optical properties of FeS 2 pyrite. Our calculated electronic bandgap is 1.21586   eV and direct. Our results confirm that the symmetric operation of the space T h 6   Pa 3 saves electronic structure of iron pyrite when alloyed with ruthenium.

1. Introduction

Our work is inspired by the fact that making photovoltaic cells is an interest of many researchers and this is due to the fact that these cells are used in renewable energy. So, finding a low-cost and abundant material that can be used in making such cells is very important and interesting work.
Iron pyrite FeS 2 is very important among metal sulfide minerals which is recently in the focus of experimental interest because of its high abundance, its low cost, its nontoxic constituent elements, and high light absorption coefficient ( ~ 10 5   cm 1 for h ν > 1.4   ev ), see [1,2]. This interesting material has been the major interest of many researchers in the field of photovoltaics because it is a promising material for photovoltaic cells [3,4,5,6,7,8,9,10,11,12,13,14,15,16,17]. It has been proven that the Solid State Schottky solar cells and pyrite photoelectrochemical cells (PEC) have large short-circuit current densities (30–42 mA cm−2) and quantum efficiencies (up to 90%) [1,2]. Iron pyrite is a semiconductor which has a bandgap of 0.95 eV [3] which is relatively small for solar cell applications. Therefore, it is essential to introduce suitable techniques to enlarge this bandgap of iron pyrite to develop pyrite-based photovoltaic cells and photoelectrochemical solar cells. The bandgap of FeS 2 pyrite can be enlarged by adding the anions of FeA x S 2 x (where A is an anion element such as As, O, etc.) or cations Fe 1 x M x S 2 where M is a cation element such as Zn, Ru, etc.). These alloying techniques have been used extensively, see [18,19]. Anion alloying of FeS 2 with oxygen has been proven to increase its bandgap [20]. Furthermore, Sun in [18] claimed that FeS 2 pyrite alloys with Os and Zn increases the bandgap from 0.95   eV to 1.2 1.5   eV . One of the elements that can alloy with FeS 2 pyrite to increase its bandgap is Ruthenium (Ru). Ru is an element that has been used widely for alloying and surface-coating of N-Chlorosuccinimide (NCS) due to its stability. Ruthenium sulfide RuS 2 has a bandgap of 1.8 eV [21], hence, the bandgap of Ru-alloyed FeS 2 pyrite, Fe 1 x Ru x S 2 , can be increased from 0.95 to 1.8   eV if we can reach the whole alloying composition range. Sun and Ceder [22] calculated the bandgap of pyrite Fe 1 x Ru x S 2 and Fe 1 x O s x S 2 using density functional theory (DFT). They showed that it is possible to enlarge the bandgap of FeS 2 pyrite if some Fe is replaced by Os or Ru . Jun Hu et al. [18] studied iron pyrite alloyed with oxygen by DFT calculation; their calculated bandgap shows an increase from 1.02   eV to 1.52   eV . FeS 2 pyrite has a direct bandgap [23,24,25,26], while RuS 2 has an indirect bandgap [27,28,29,30]. Until now, determining the properties (optical and electric) of FeS 2 pyrite alloying with ruthenium Ru has been inconclusive. Ouertani et al. [23] found that the gap of Ru-alloy can increases to 1.31 eV with a direct bandgap. There is also some new theoretical work done in [31]. In this manuscript, we used the Linear Muffin-Tin Orbital Method in the Atomic-Sphere approximation LMTO-ASA calculation to study the effect of small concentrations of 1.9 % of Ru on the bandgap, electronic structure, and optical properties of FeS 2 pyrite because LMTO-ASA is imperative for calculations of the ground-state properties of compounds. It includes the effect of charge transfer which is expected to provide the main uncertainty in energy band calculations for compounds.

2. Experimental

2.1. Materials and Method

We used spray pyrolysis for fabrication of our sample. In our procedures, we chose of a solution obtained from the dissolution of 8.3 g of RuCl3.3H2O and FeCl3.6H2O with a molar ratio as FeCl3.6H2O: RuCl3.3H2O = x:1 − x (x = 0.0119) through 10 min substrates and heated at 370 . The transport rate is about 70 cm and 7 mL/min. In the aqueous solution, we have the following reactions:
FeCl 3 .6 H 2 O Fe 3 + + 3 Cl + 6   H 2 O
RuCl 3 .3 H 2 O Ru 3 + + 3 Cl + 3 H 2 O
We obtained Fe 0.9881 Ru 0.0119 S 2 phases in our Iron pyrite layers.

2.2. Characterization Techniques

The crystal structures of Fe 0.9881 Ru 0.0119 S 2 are studied by XRD (X-ray diffraction) by using Phillips D500 powder with CuK α radiation at λ = 1.42   Å . The XRD patterns is shown in Figure 1. Representative diffraction peaks at 2 θ = 32.92, 37.85, and 57.59 correspond to the (200), (210), and (311) planes. These lines were obtained by using powder diffraction data bases (JCPDS card n ° : 00-36-1453). The resulting structure of Fe 0.9881 Ru 0.0119 S 2 is a cubic crystal structure belonging to the space group Pa 3 ¯   205 . Both Iron pyrite FeS 2 and Ruthenium sulfide R u S 2 have a pyrite Pa 3 ¯ space group structure with 5.419   Å and 5.635   Å as lattice constants, respectively. We determined the lattice parameter using the Rietveld method utilizing the PDXL program.
Moreover, this Ru-alloyed iron sulfide ( Fe 0.9881 Ru 0.0119 S 2 ) exhibits cubic crystal structure in the pyrite phase. The lattice constant and the atomic positions are presented in Table 1. The pyrite structure of Fe 0.9881 Ru 0.0119 S 2 was presented in a cubic crystal, by replacing one Fe atom with an Ru atom in metal positions and eight positions of sulfur atoms.
Note that compared to the pure Iron pyrite [24], we can see that the distance S S is similar to one in the S 2 molecule and the lattice constant increases because R u ions are larger than Fe ions.
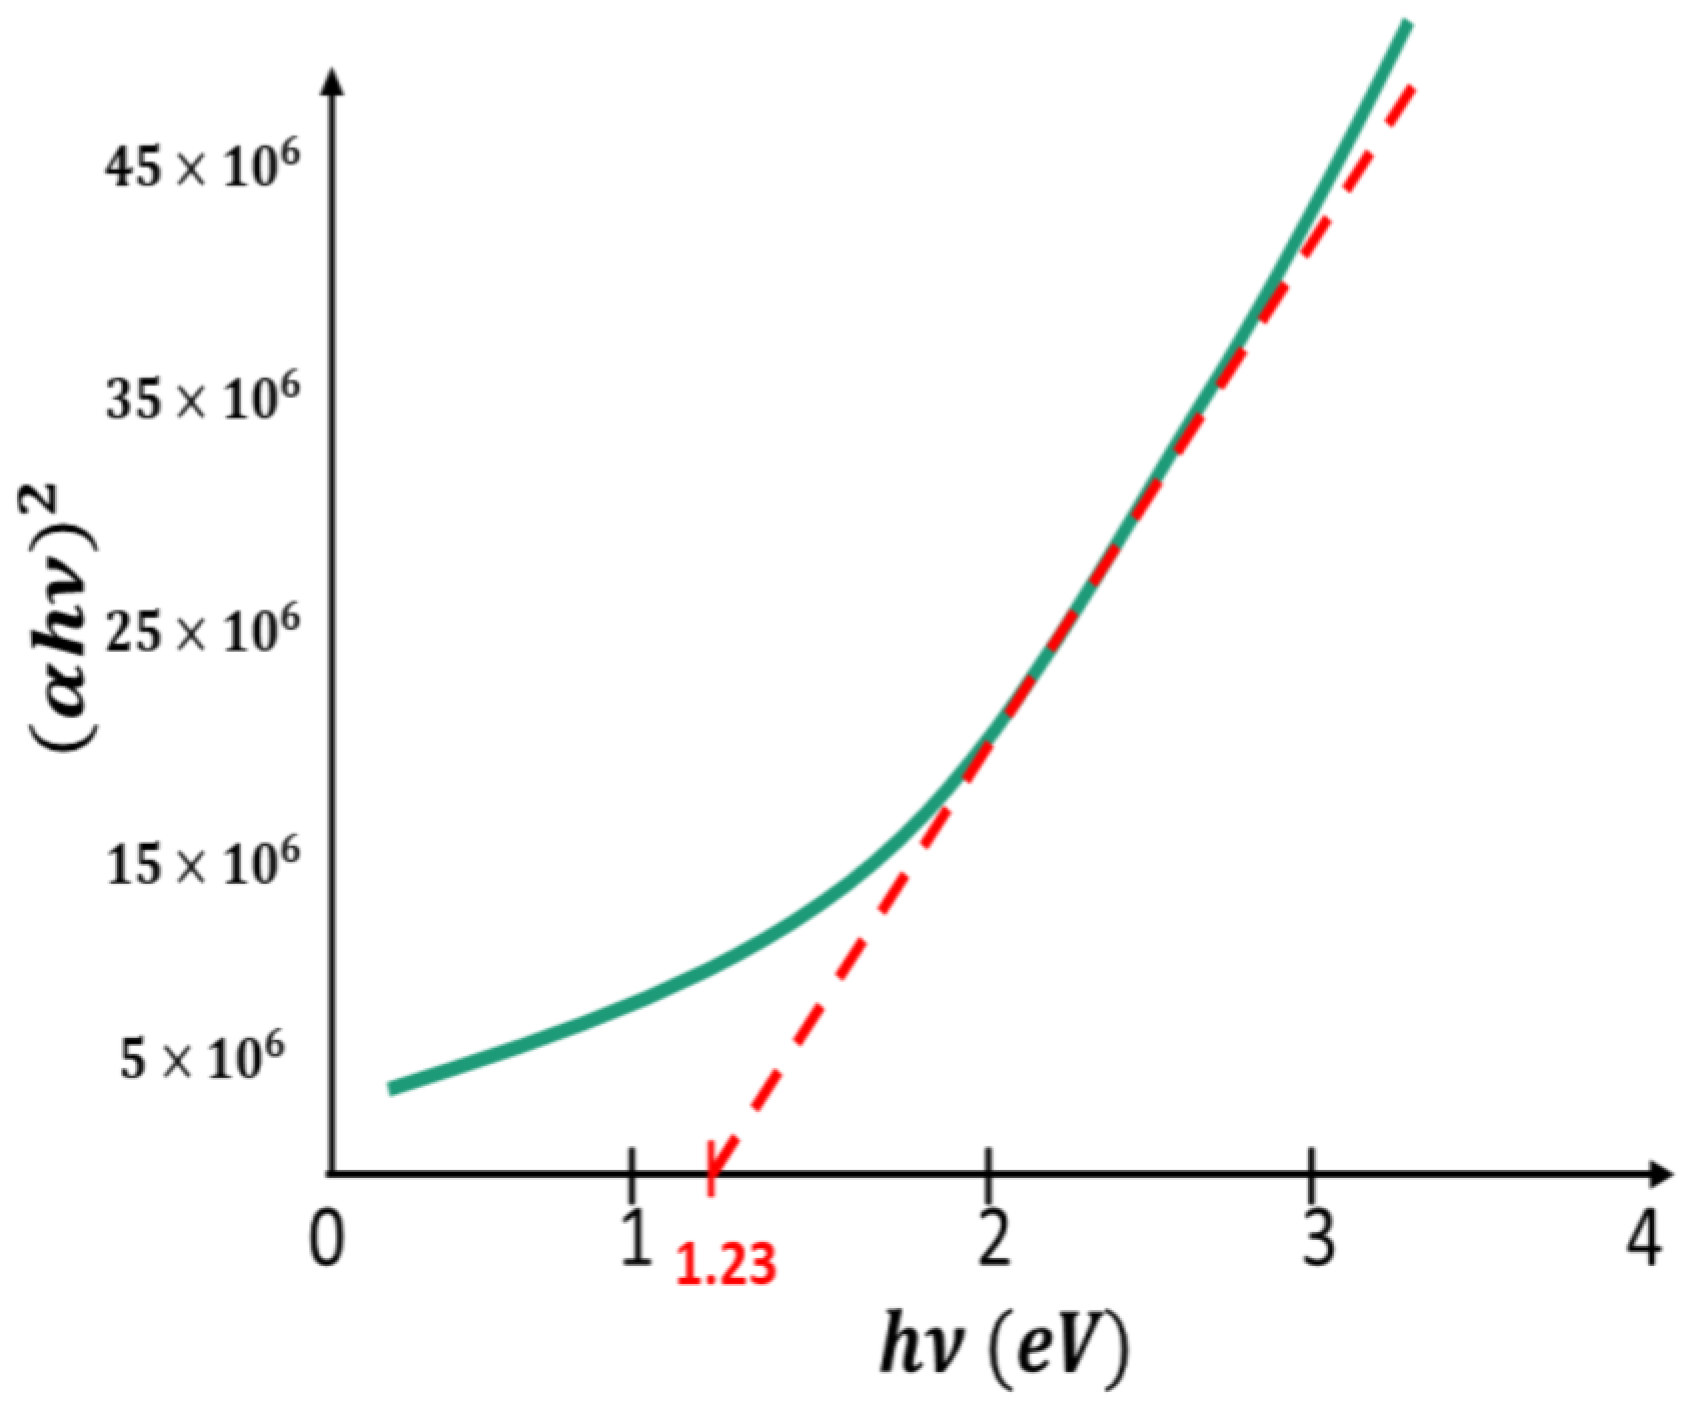
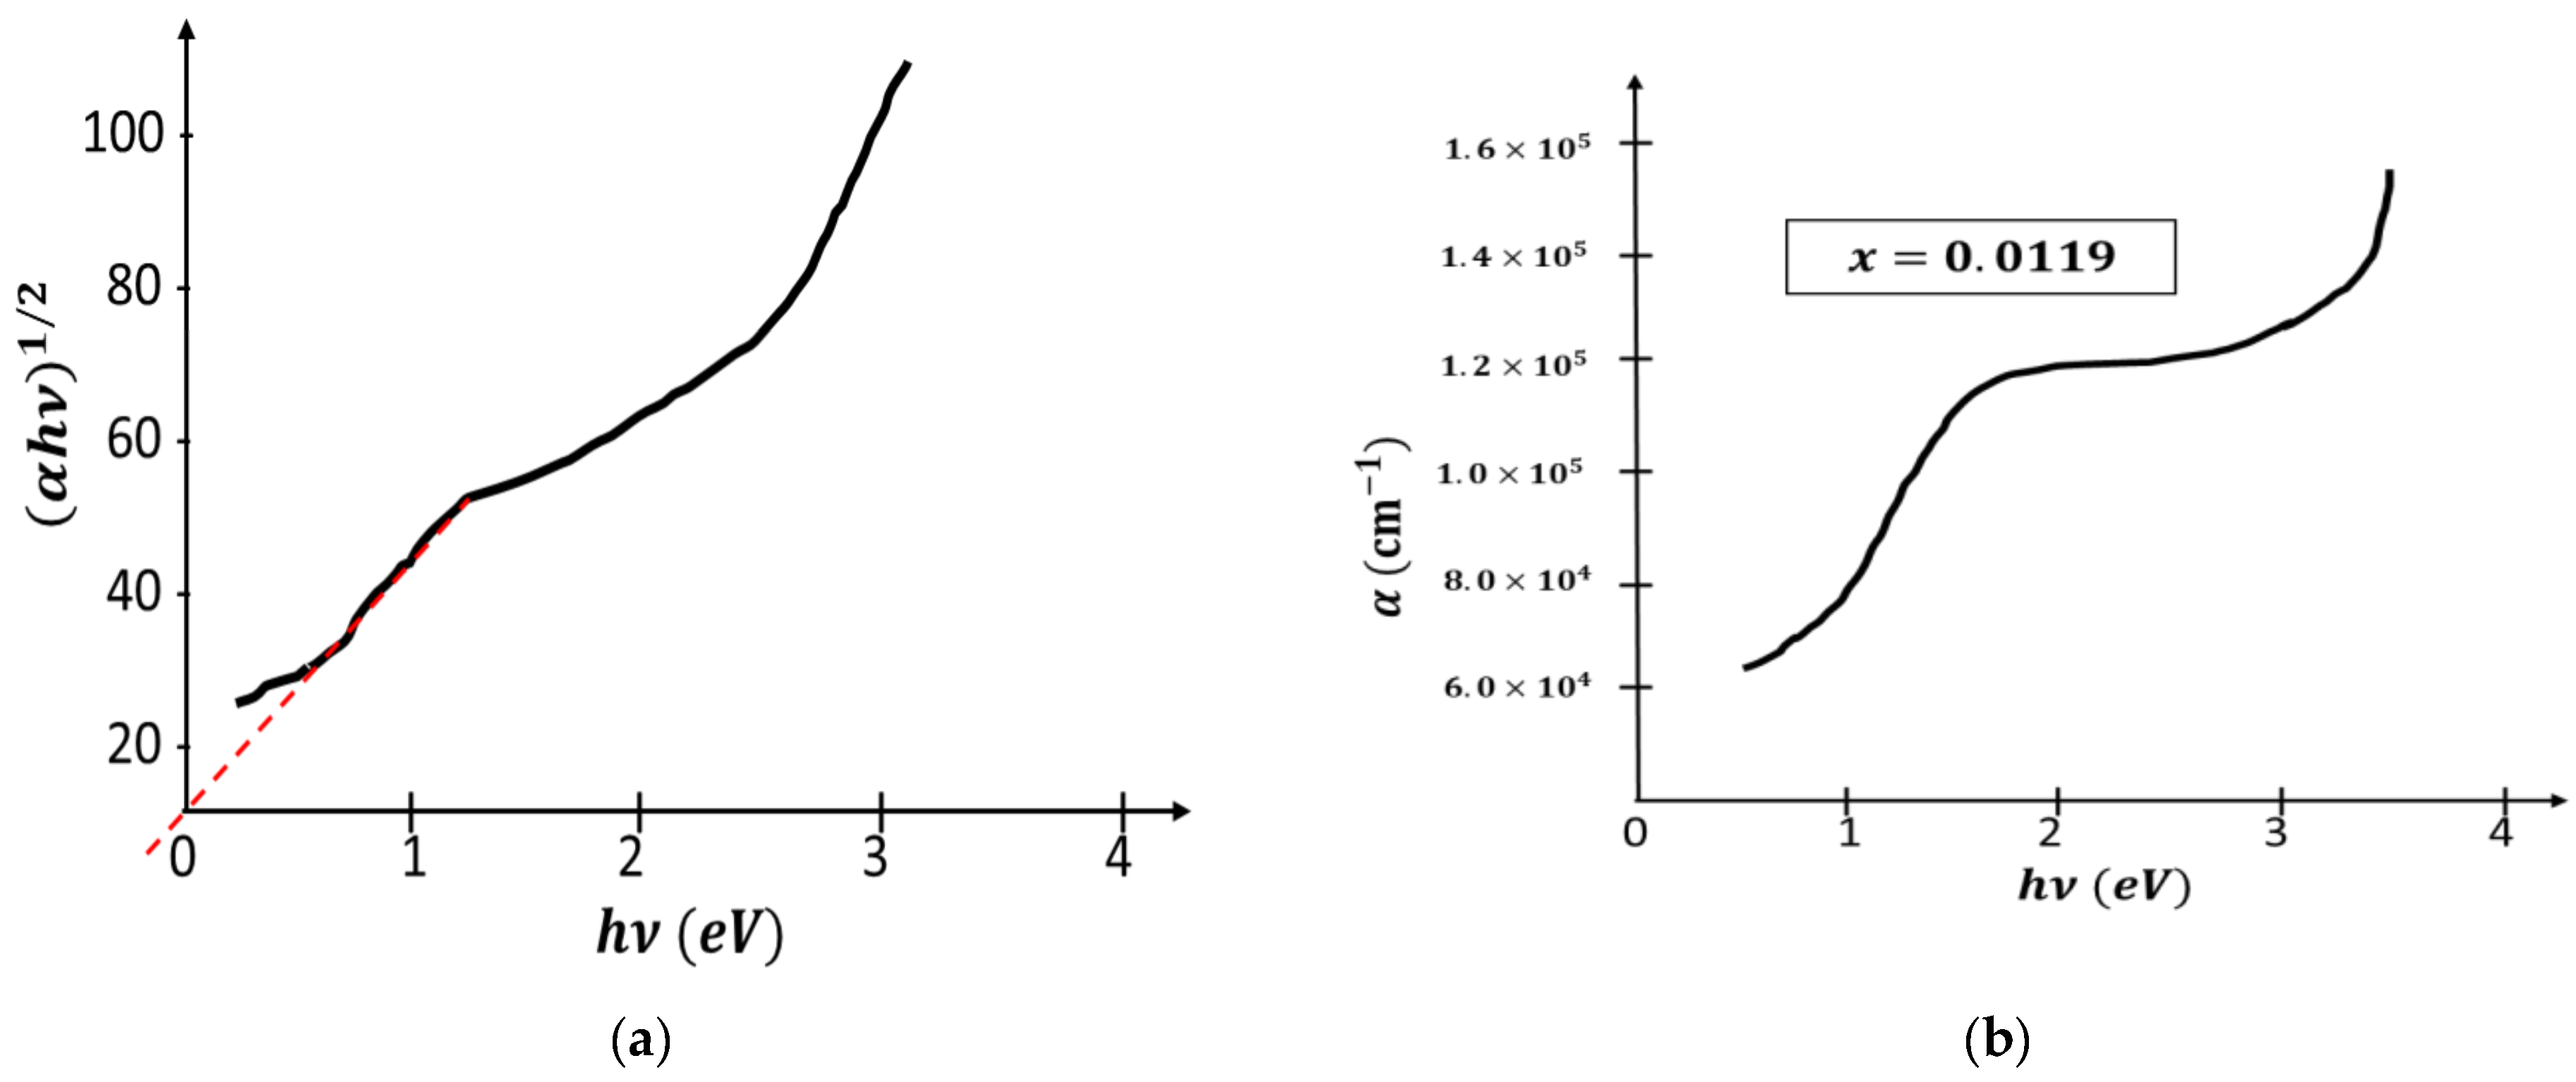
The optical absorption diagram of Fe 0.9881 Ru 0.0119 S 2 was carried out using a SHIMADZU 3100s spectrophotometer. Figure 2 shows α h ν 2 versus the photon energy h ν and Figure 3 shows α h ν 1 2 versus h ν . The two graphs indicate that Fe 0.9881 Ru 0.0119 S 2 has a direct bandgap energy of 1.23 eV.
Figure 3b shows the plot of absorption coefficients versus h ν and we note that the absorption coefficients are always high ( α > 1.2 × 10 5   cm 1 ) , which encourages their use in the photovoltaic domain.

3. Calculated Band Energy of F e 0.9881 R u 0.0119 S 2

3.1. Method

In our calculations, we apply the LMTO ASA method which has been explained in detail in several reports [32,33,34]. In our system, we have four metal atoms and eight sulfur atoms. In our case, the percentage of Ru is about 1.19 % and is 25 % lesser than that we have for one Ru atom and three Fe atoms and eight sulfur atoms. The data of sample are listed in the following Table 2:
In our calculations, we employ the self-consistent band calculations. This is because it is a first-principles calculation where the density functional theory was used, see [35], using the local density approximation, see [36], and using numerical techniques which rely on the electron ion’s treatment of interaction in the pseudopotential approximation [31]. However, the ASA Hamiltonian is completely specified by the potential parameters. It will generate moments from the eigenvectors of the Hamiltonian. For a certain potential, there is a unique correspondence between the logarithmic derivative D v at the sphere radius and the energy Eν of the wave function φ . In principle, it is possible to specify either one. The potential P becomes simple because we use [37,38]
P ε = const D ε + l + 1 D ε l Δ l ε C l + γ l 1
where C 1 , Δ 1 , and γ 1 , are the “potential parameters” that parameterize P. C 1 corresponds to the band “center of gravity”, Δ 1 is the “band width” parameter which corresponds approximately to the bandwidth of that l channel if it were uncoupled from the other l channels, and γ 1 is the “band distortion parameter” which describes the deformations relative to a universal shape. Generally, a small parameterization is a perfect method to study a band structure. First, we obtain the potential parameter for all atomic spheres. The muffin-tin potential constant V MTZ around Fe , Ru , and S is equal to 0.835283 . We have 24 symmetry operations. The muffin-tin MT radii are 2.939   a . u . for Ru , 2.951   a . u . for Fe , and 2.202   a . u . for S . The initial sphere packing was equal to 79.2 % , scaled to 87.9 % . The role of these empty spheres is to reduce the number of iterations in this procedure and to reduce the overlap between the spheres centered at Fe , Ru , and S .

3.2. Band Structure

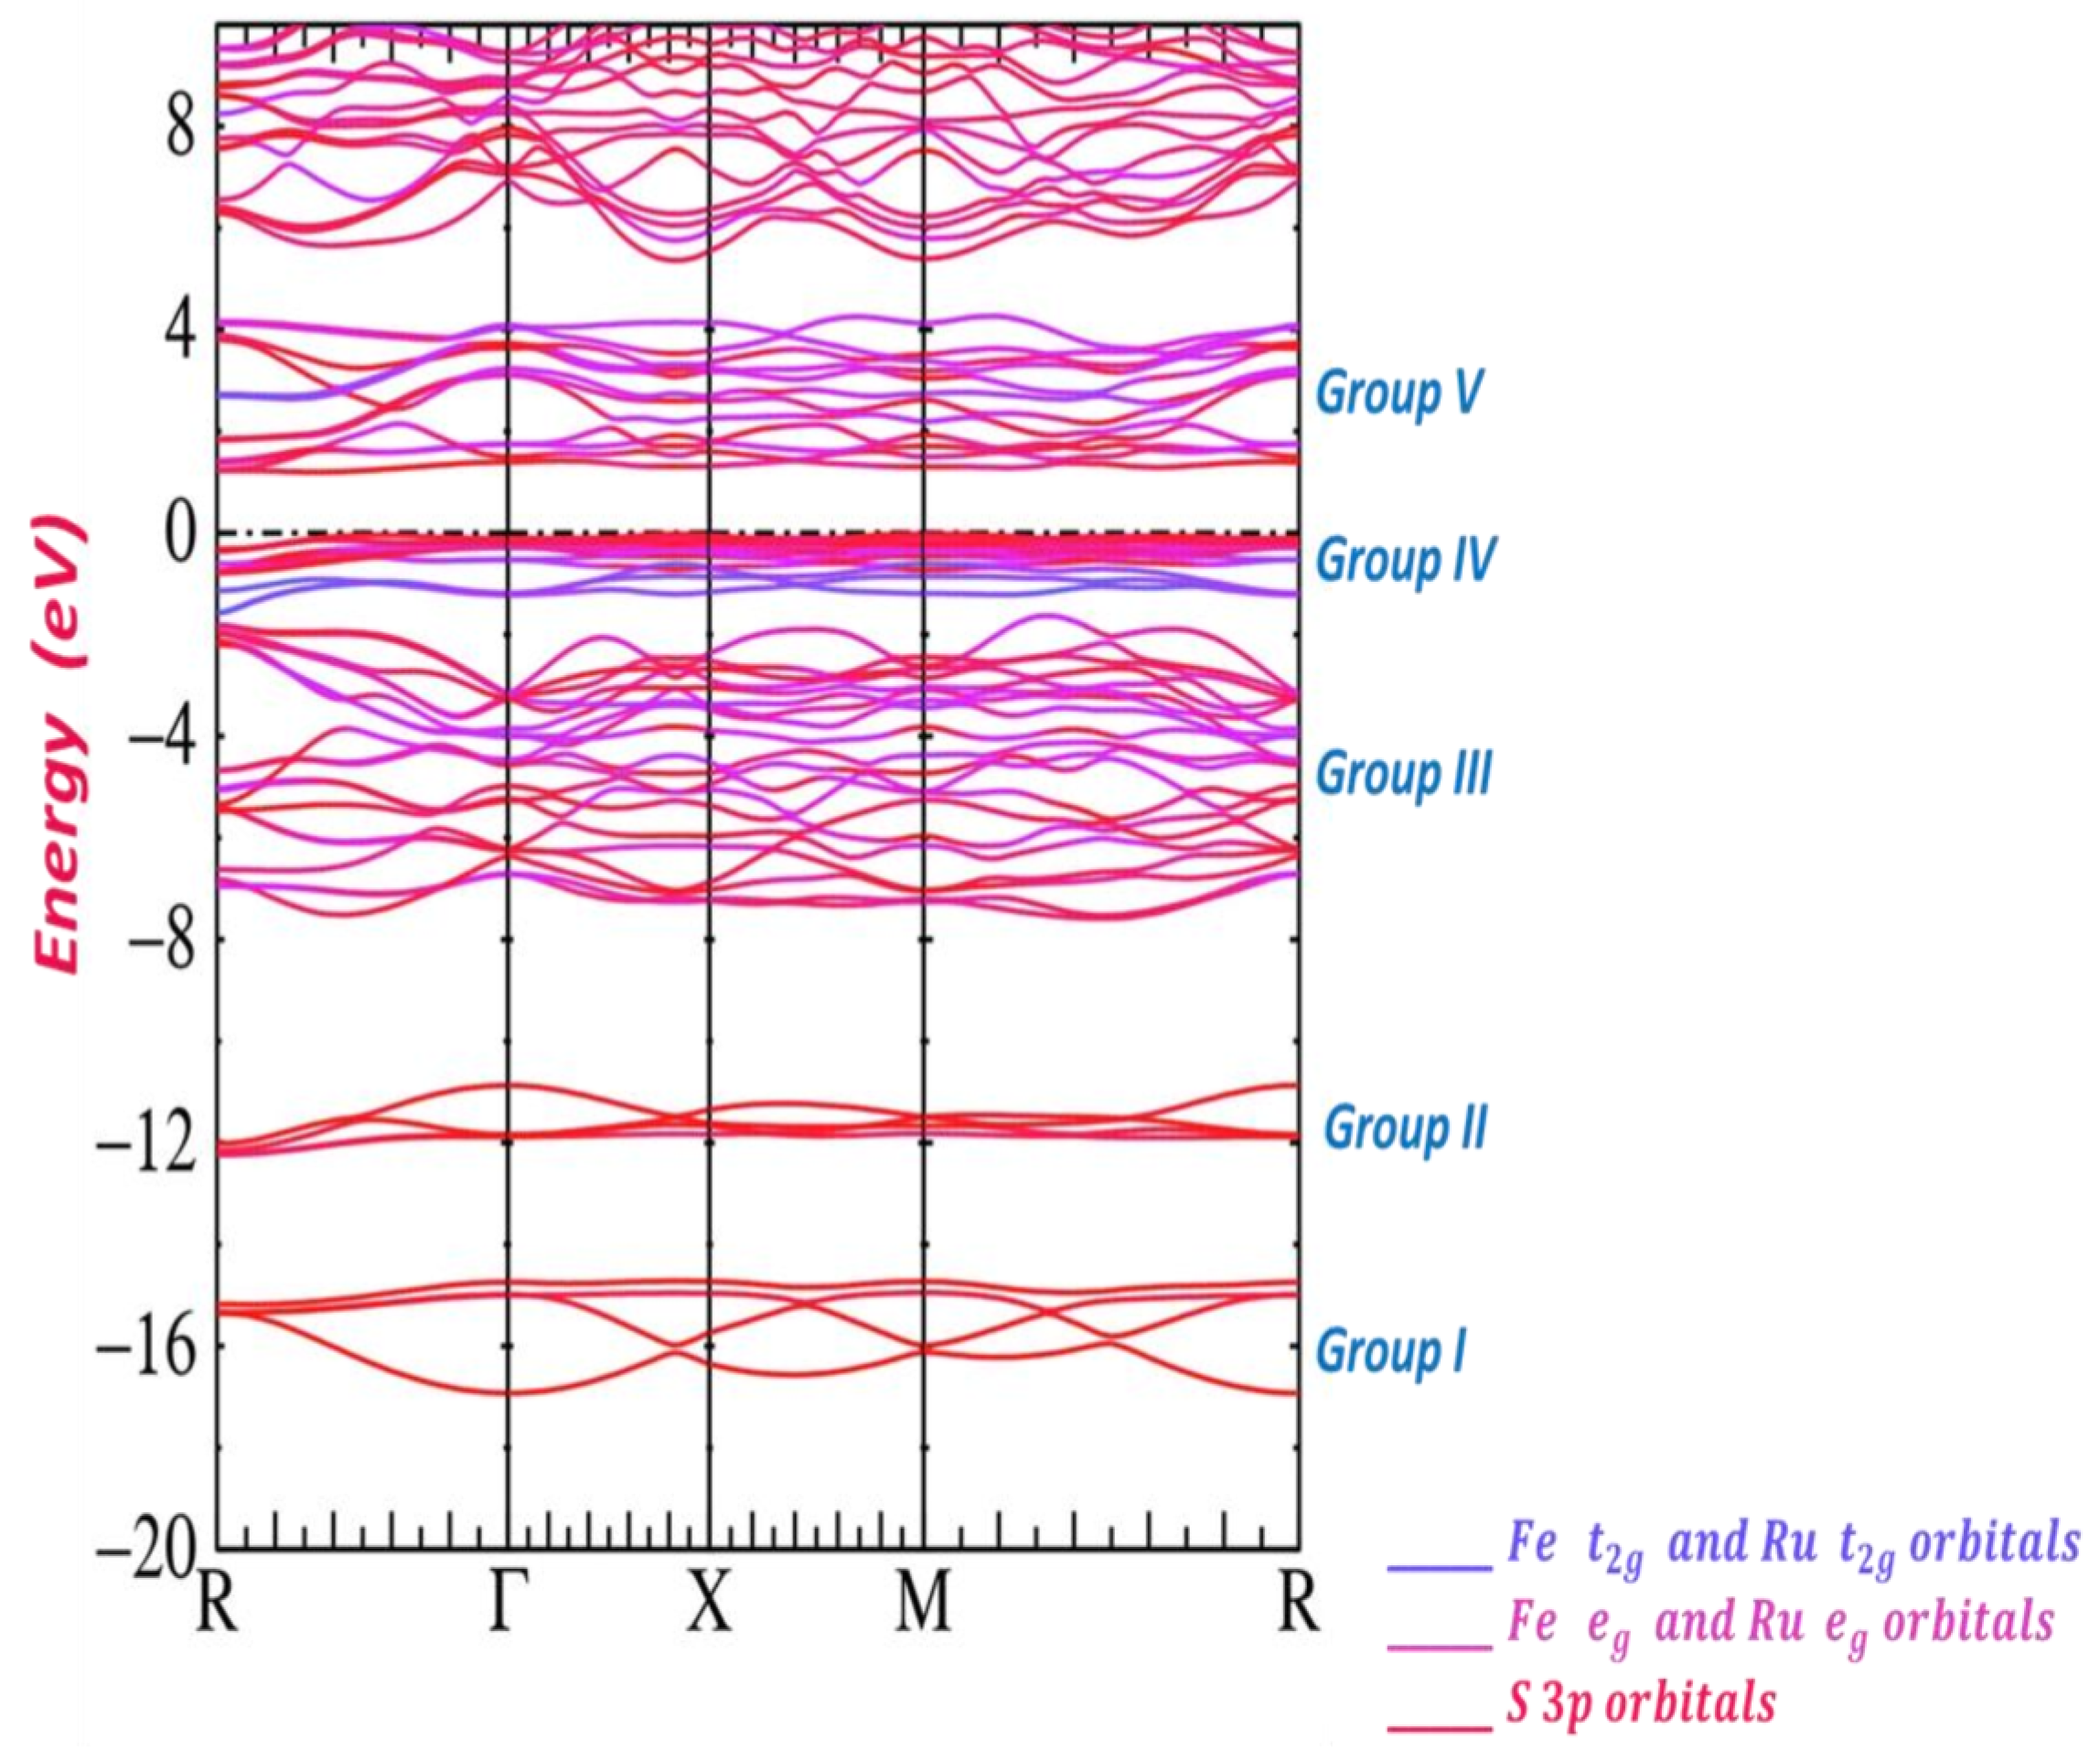
Figure 4 represents energy band structure of Fe 0.9881 Ru 0.0119 S 2 . It shows all details of the valence and conduction bands in an energy range between −20 eV and +8 eV. Different colors are used to describe this band structure to indicate the contributions of the cations ( Fe and Ru ) and the anion ( S ). We have five distinct groups based on the order of increasing energy of this band structure. Note that the occupied bands have 80 valence electrons. First, we can see that the first two groups of bands (I, II) are associated with bonding and antibonding pairs of orbitals on S 2 pairs. The two groups have a maximum energy of −11 eV and their character is S 3 s , where S 3 s states are predominant. The structure of sulfur 3p states start approximately at −7 eV; their basic states include an extra structure due to the Fe 3d levels and a small admixture of Ru 4d levels. This group composes with bonding S 3p and Fe e g and Ru e g . The Fe 3d t 2 g and Ru 4d t 2 g bands, which give us the fourth group of bands (IV), are under the Fermi level. Note that, above the Fermi level, we have a split of conduction bands; these bands have S 3p and Fe 3d e g and Ru 4d e g characters, due to the group V.
Our calculations indicate that Fe 0.9881 Ru 0.0119 S 2 is a direct gap semiconductor of 1.21586 eV. The valence band maximum (VBM) is −0.055993 Ry (−0.761823 eV), and the conduction band minimum (CBM) is 0.033408 Ry (0.454539 eV). The Fermi energy of −0.055993 Ry (−0.761823 eV) is very close to the maximum valence band, which leads us to deduce that we have an empty conduction band and a filled valence band. Thereby, we can conclude that our bandgap of Fe 0.9881 Ru 0.0119 S 2 is direct at the Gamma point ( Γ ). Figure 2 and Figure 3 show that the optical measurement of Fe 0.9881 Ru 0.0119 S 2 has a direct gap of 1.23 eV, which is in good agreement with our calculations.
Figure 5a presents the band structure of FeS 2 pyrite obtained by LMTO-ASA. Our calculation indicates that FeS 2 pyrite is a direct-gap semiconductor, with a calculated gap of 0.90508   eV . The valence-band energy ev is 0.000533   Ry , and the energy of the conduction band (ec) is 0.066017   Ry . The Fermi energy 0.000533   Ry matches the valence-band energy, which indicates that the valence band is filled while the conduction band is completely empty. Consequently, our bandgap of FeS 2 is direct at the Γ gamma point . The optical measurement of FeS 2 pyrite has a direct gap of approximately 0.95   eV [24], in good agreement with our calculation.
Figure 5b is a structure of RuS 2 pyrite obtained by LMTO-ASA. Moreover, our figures indicate that RuS 2 has a bandgap semiconductor. The max valence band is at X, and the min conduction band is at Γ . The indirect bandgap is between X and gamma Γ , and the direct transition at Γ . We found the indirect bandgap has the following value: 1.80727   eV . The values of the filled bands encountered ev is about −0.126036 Ry and the empty bands encountered (ec) is about 0.006851 Ry. The Fermi energy is about −0.126036 Ry. Our obtained gap energy by the linear muffin-tin is in a good agreement with an experimental bandgap of 1.8 eV [27]. Note that the band structure of Fe 0.9881 Ru 0.0119 S 2 is similar to the band structure of FeS 2 pyrite and that is due to the fact that both have a direct bandgap and five groups of energy levels.
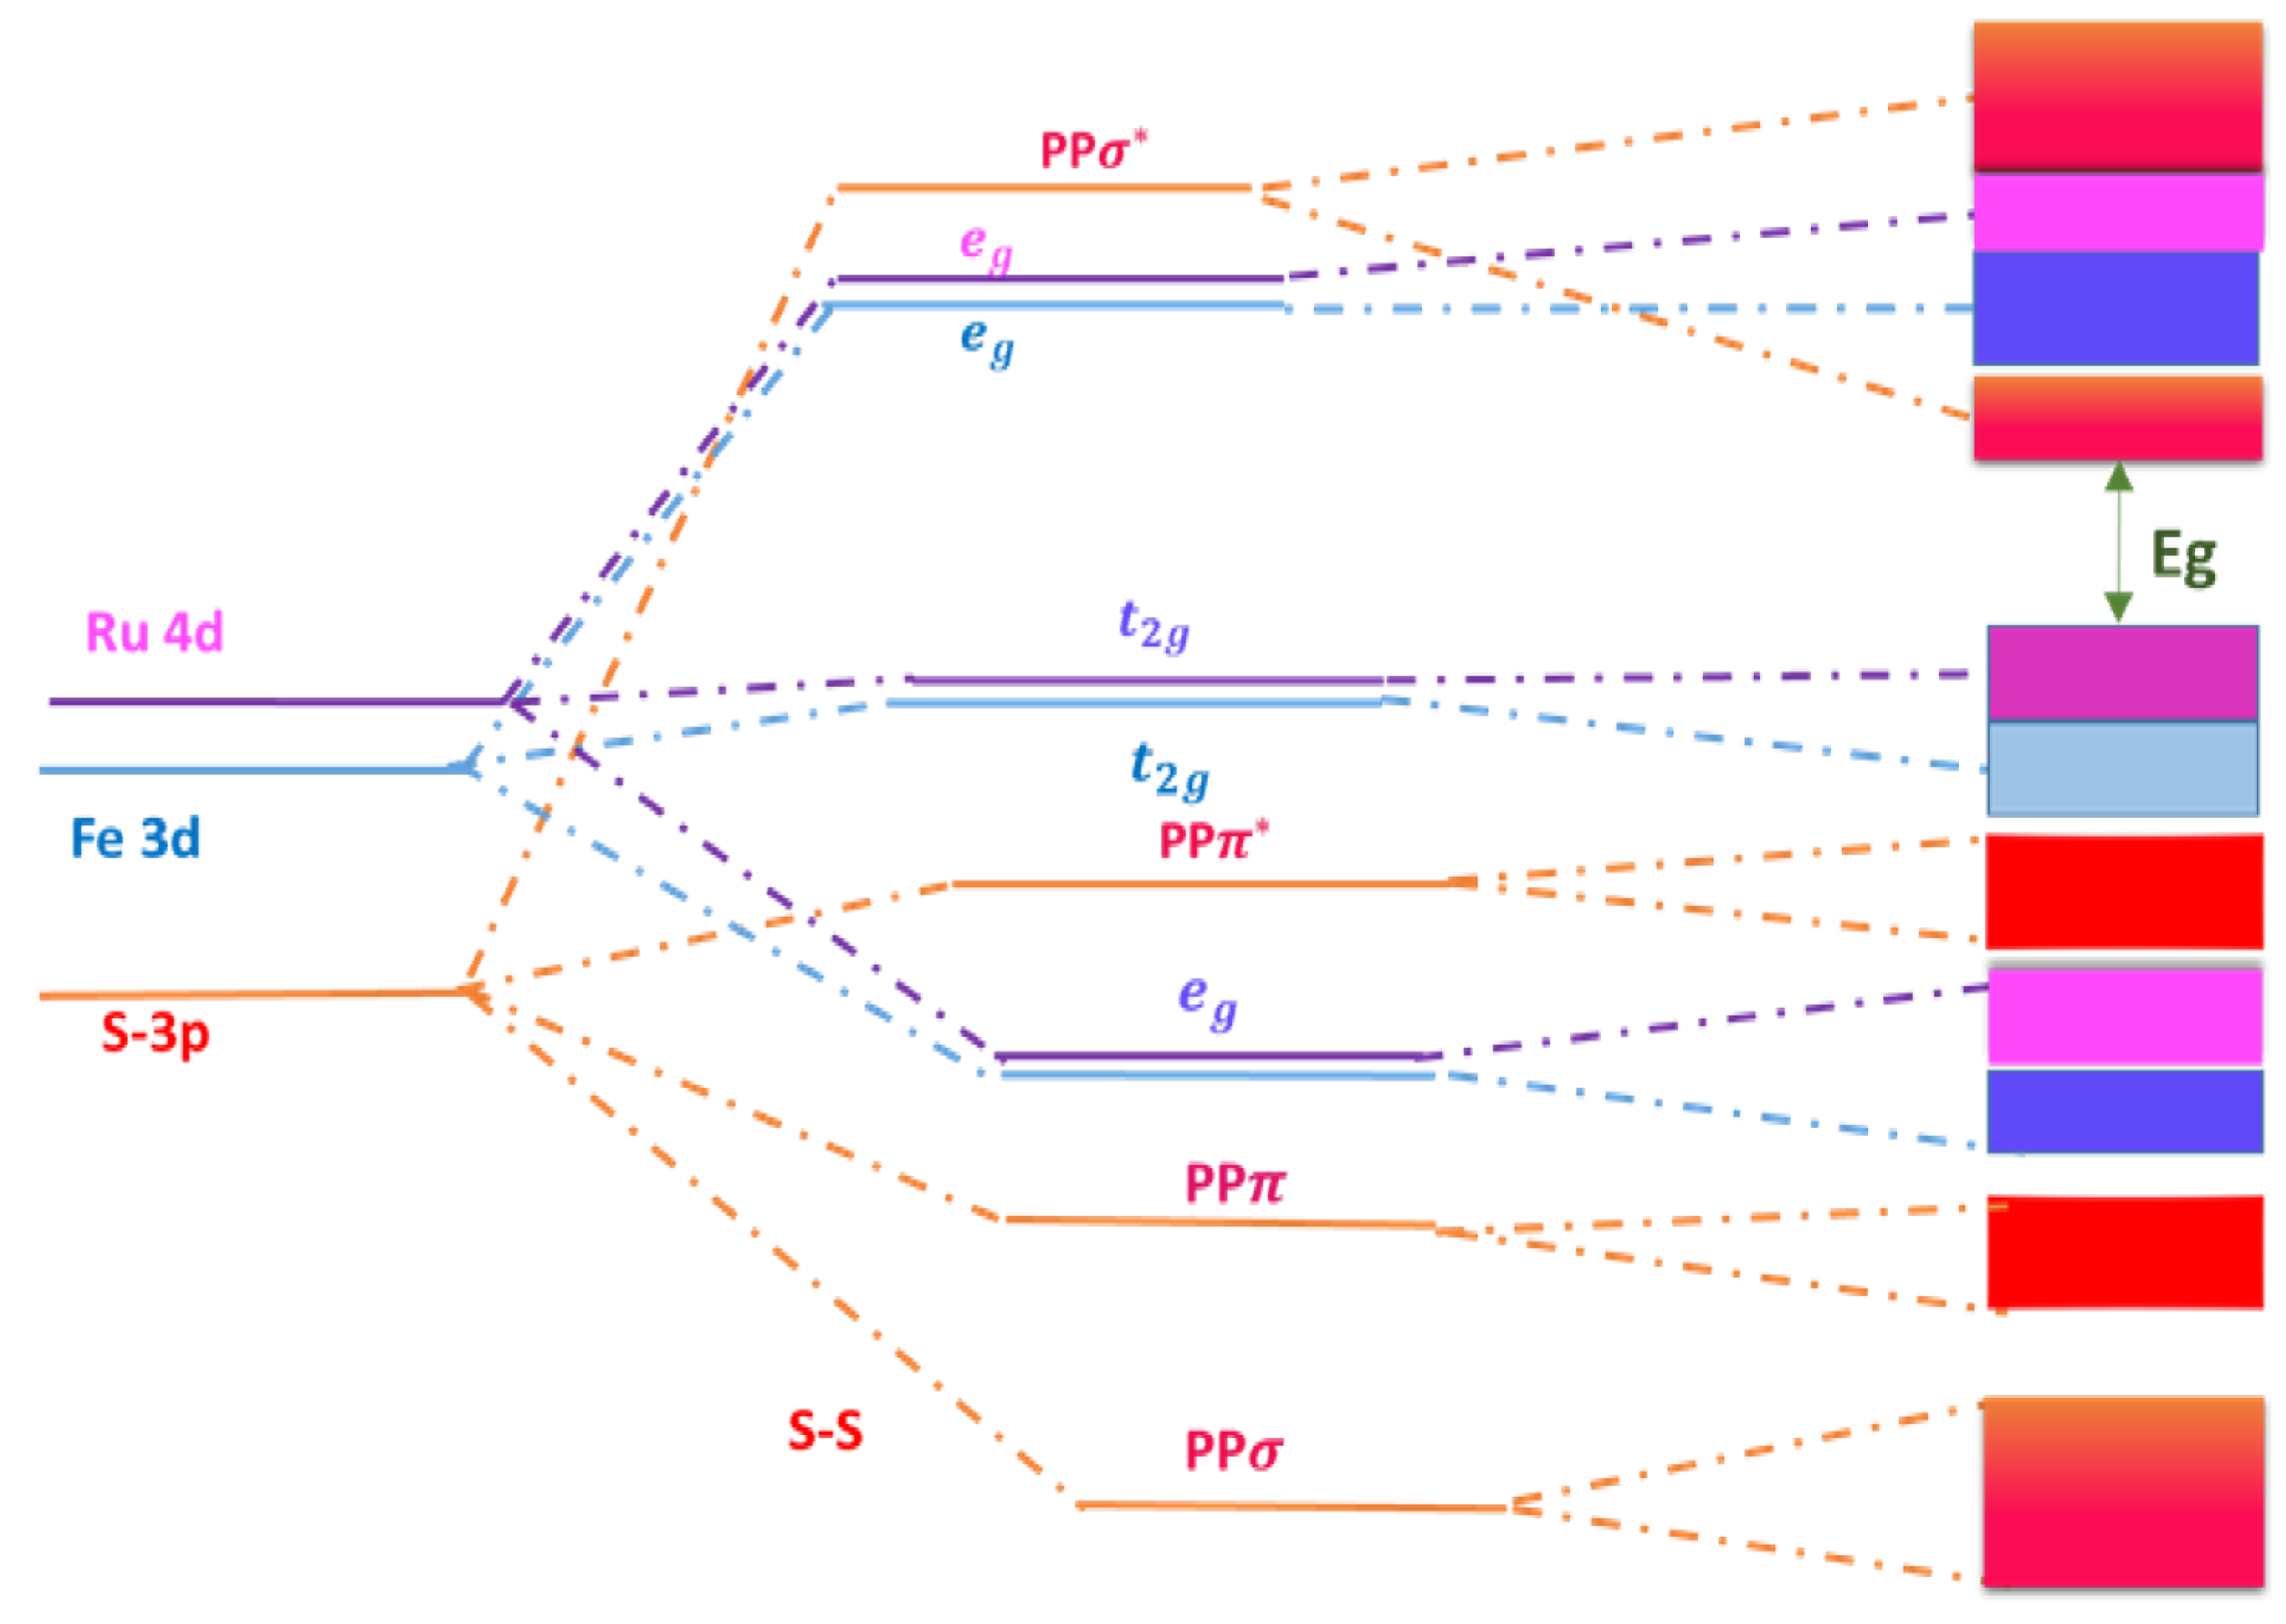
Figure 6 shows the energy diagram for Ru 4d, Fe 3d, and S 3p orbitals under the influences of crystal field splitting (CFS) and S-S dimerization. The bandgap Eg is denoted by the green arrow. The 3d and 4d orbitals of Fe and Ru are split into t 2 g and e g groups, while the 3p orbitals of S are split into PP σ ,   PP π ,   PP π * and   PP σ * groups. This indicates that the CBM of Fe 0.9881 Ru 0.0119 S 2 alloy shifts upward toward the Fe e g band, the CBM still originates from PP σ * .
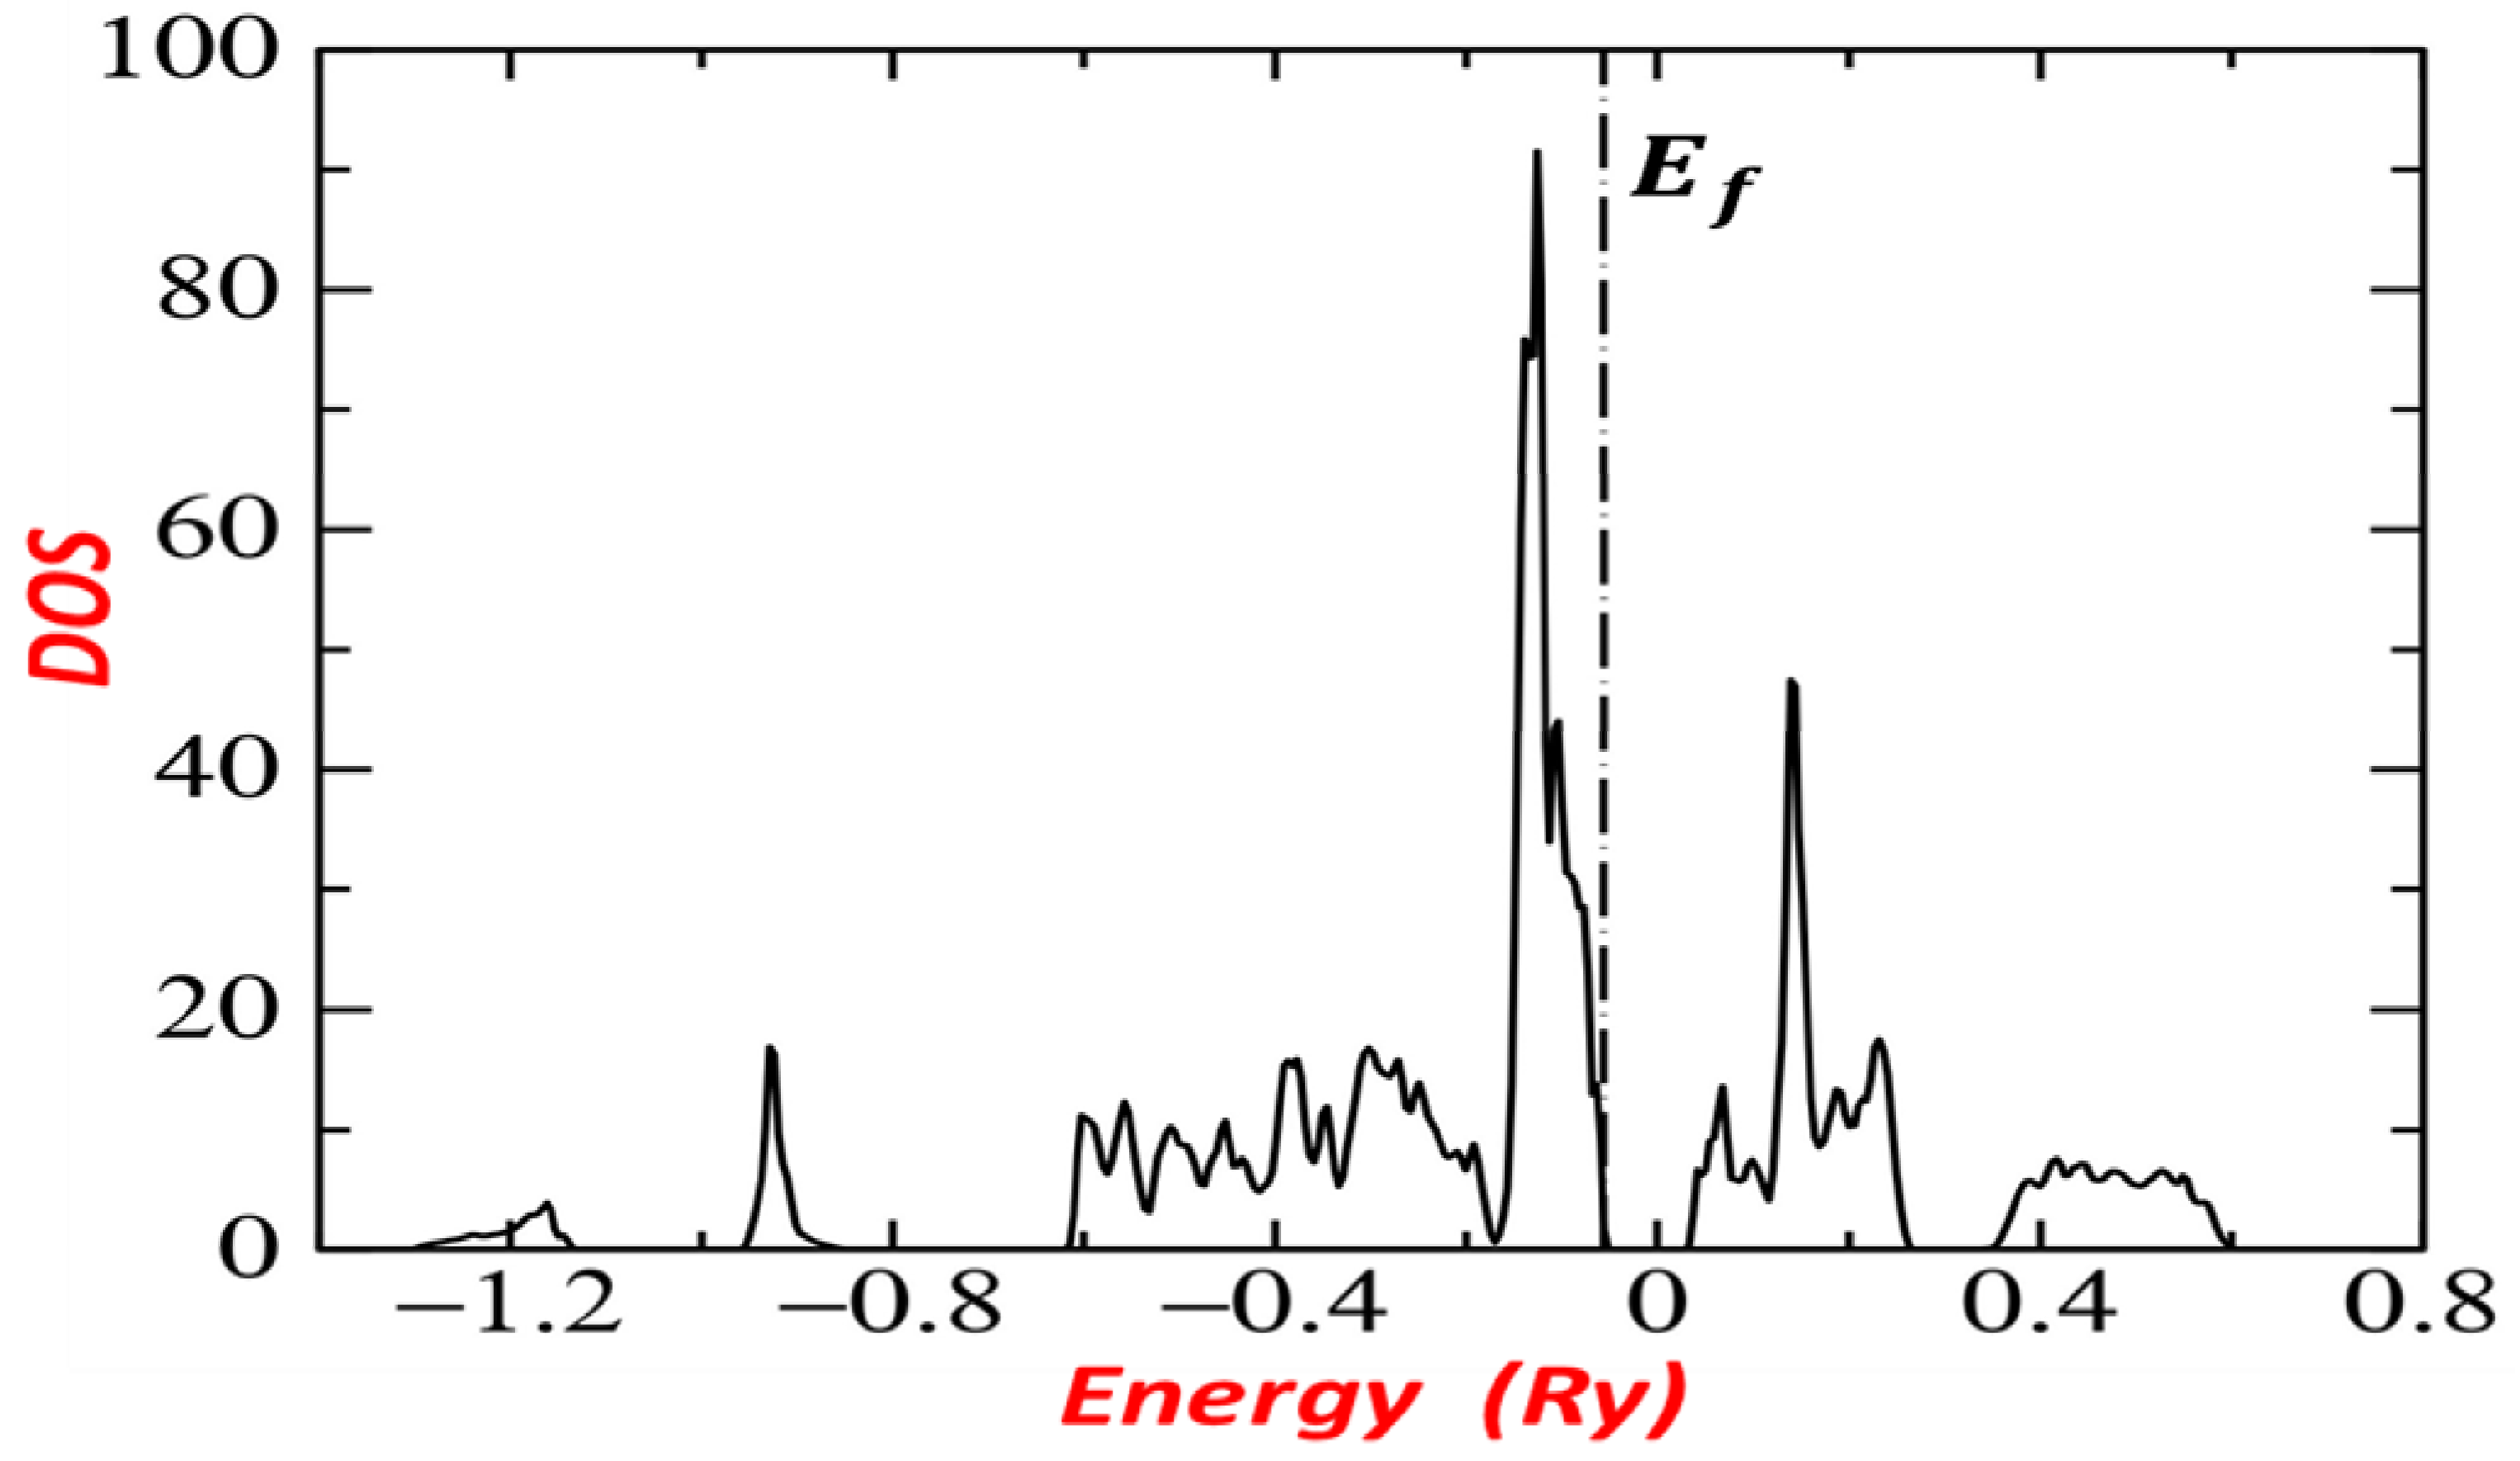
The density of states (DOS) calculated below and above the Fermi level for Fe 0.9881 Ru 0.0119 S 2 is presented in Figure 7, in which a clear hybridization between Fe, Ru, and S states is clearly seen. The two smallest peaks around −1.2 Ry and −0.8 Ry show that the S contributions are dominant. Note that the valence bands of the first two groups (I and II) are the lowest. Fe and Ru in the third group (III) have a small contribution dominance, which is mostly dominant by S. The third and the fourth groups (III, IV) are between −0.6 Ry and −0.05599 Ry. In addition, in the fourth and the fifth groups (IV, V), Fe and Ru have a dominant contribution. The highest peak in group IV lies between −0.2 Ry and −0.055993 Ry below but very close to the Fermi level, which shows that the level t 2 g is filled and all S 3p, Fe t 2 g and Ru t 2 g states (group IV states) are occupied. Hence, all S 3p and Fe e g and Ru e g states (group V) are empty indicating unoccupied e g states.
In summary, the valence bands are almost completely driven from the t 2 g orbitals while the conduction band is almost pure Sp. In Figure 4, it can be clearly seen that the bottom of the conduction band is red (the S 3p states) and that the conduction band is similar to that of Iron pyrite [24]. We conclude that the presence of a low concentration of 1.19% of Ru alloy will shift the bandgap up by ~ 0.4   eV ; at the same time, it does not change the state of Iron pyrite. Furthermore, our calculated bandgap of   1.21586   eV is in very good agreement with the experimental value 1.23 eV.

4. Conclusions

An adequate molar ratio was chosen to fabricate Fe 0.9881 Ru 0.0119 S 2 thin films having good properties for solar cell application. We have investigated the electronic structure of Fe 0.9881 Ru 0.0119 S 2 using LMTO-ASA calculations. We showed that substituting ruthenium for Fe atoms is a good method to enlarge the bandgap of FeS 2 pyrite while saving gap states and the optical and electrical properties of FeS 2 pyrite. The small concentration of 1.19 % of Ru alloy raises the maximum of the conduction band by 0.3 eV, which is considered as a desired bandgap value for solar cell applications. We note that it is highly possible to use Fe 0.9881 Ru 0.0119 S 2 as multispectral photovoltaic cells (1.2–1.3 eV).

Author Contributions

Conceptualization R.S. and I.S.; methodology, R.S.; validation, R.S. and M.M.N.; formal analysis, R.S. and M.M.N.; investigation, M.A.A. and M.M.N.; resources, M.M.N. and I.S.; data curation, R.S.; writing—original draft preparation, M.A.A. and R.S.; writing—review and editing, M.M.N.; visualization, M.M.N. and R.S.; supervision, R.S. All authors have read and agreed to the published version of the manuscript.

Funding

This research did not receive any external funding.

Institutional Review Board Statement

Not applicable.

Informed Consent Statement

Not applicable.

Data Availability Statement

The data used support the findings of this study are available from the corresponding author upon request.

Acknowledgments

The author I. Shawish would like to thank Prince Sultan University for paying the publication fees for this work through EWE LAB.

Conflicts of Interest

The authors declare no conflict of interest.

References

  1. Ennaoui, A.; Fiechter, S.; Jaegermann, W.; Tributsch, H. Photoelectrochemistry of highly quantum efficient single-crystalline n-FeS2 (Pyrite). J. Electrochem. Soc. 1986, 133, 97. [Google Scholar] [CrossRef]
  2. Büker, K.; Alonso-Vante, N.; Tributsch, H. Photovoltaic output limitation of n-FeS2 (pyrite) Schottky barriers: A temperature-dependent characterization. J. Appl. Phys. 1992, 72, 5721. [Google Scholar] [CrossRef]
  3. Ennaoui, A.; Fiechter, S.; Pettenkoer, C.; Alonso-Vante, N.; Büker, K.; Bronold, M.; Höpfner, C.; Tributsch, H. Iron disulfide for solar energy conversion. Sol. Energy Mater. Sol. Cells 1993, 29, 289. [Google Scholar] [CrossRef]
  4. Murphy, R.; Strongin, D.R. Surface reactivity of pyrite and related sulfides. Sur. Sci. Rep. 2009, 64, 1–45. [Google Scholar] [CrossRef]
  5. Schlegel, A. Wachter, Optical properties, phonons and electronic structure of iron pyrite (FeS2). J. Phys. C Solid State Phys. 1976, 9, 3363. [Google Scholar] [CrossRef]
  6. Altermatt, P.P.; Kiesewetter, T.; Ellmer, K.; Tributsch, H. Specifying targets of future research in photovoltaic devices containing pyrite (FeS2) by numerical modelling. Sol. Energy Mater. Sol. Cells 2002, 71, 181. [Google Scholar] [CrossRef]
  7. Ennaoui, A.; Tributsch, H. Energetic characterization of the photoactive FeS2 (pyrite) interface. Sol. Energy Mater. 1986, 14, 461. [Google Scholar]
  8. Smestad, G.; Ennaoui, A.; Fiechter, S.; Tributsch, H.; Hofmann, W.K.; Birkholz, M.; Kautek, W. Photoactive thin film semiconducting iron pyrite prepared by sulfurization of iron oxides. Sol. Energy Mater. 1990, 20, 149. [Google Scholar] [CrossRef]
  9. Wadia, C.; Alivisatos, A.P.; Kammen, D.M. Materials availability expands the opportunity for large-scale photovoltaics deployment. Environ. Sci. Technol. 2009, 43, 2072. [Google Scholar] [CrossRef]
  10. Joshi, H.; Ram, M.; Limbu, N.; Rai, D.P.; Thapa, B.; Labar, K.; Laref, A.; Thapa, R.K.; Shankar, A. Modulation of optical absorption in m Fe_(1-x) Ru_x S_2 and exploring stability in new m RuS_2. Sci. Rep. 2021, 11, 6601. [Google Scholar] [CrossRef]
  11. Anantharaj, S.; Noda, S. Nickel selenides as pre-catalysts for electrochemical oxygen evolution reaction. Int. J. Hydrog. Energy 2020, 45, 15763–15784. [Google Scholar] [CrossRef]
  12. Hussain, R.A.; Hussain, I. Copper selenide thin films from growth to applications. Solid State Sci. 2020, 100, 106101. [Google Scholar] [CrossRef]
  13. Pesko, E.; Zero, Z.E.; Krzton-Maziopa, A. Electrocrystallization of nanostructured iron-selenide films for potential application in dye sensitized solar cells. Thin Solid Film. 2020, 709, 138121. [Google Scholar] [CrossRef]
  14. Luo, M.; Yu, H.; Hu, F.; Liu, T.; Shu, J. Metal selenides for high performance sodium ion batteries. Chem. Eng. J. 2020, 380, 122557. [Google Scholar] [CrossRef]
  15. Ao, K.L.; Shao, Y.; Chan, I.N.; Shi, X.; Pan, H. Design of novel pentagonal 2D transitional-metal sulphide monolayers for hydrogen evolution reaction. Int. J. Hydrog. Energy 2020, 45, 16201–16209. [Google Scholar] [CrossRef]
  16. Theerthagiri, J.; Senthil, R.A.; Nithyadharseni, P.; Lee, S.J.; Durai, G.; Kuppusami, P.; Madhavan, J.; Choi, M.Y. Recent progress and emerging challenges of transition metal sulfides based composite electrodes for electrochemical supercapacitive energy storage. Ceram. Int. 2020, 46, 14317–14345. [Google Scholar] [CrossRef]
  17. Sahoo, S.; Naik, K.K.; Late, D.J.; Rout, C.S. Electrochemical synthesis of a ternary transition metal sulfide nanosheets on nickel foam and energy storage application. J. Alloy. Compd. 2017, 695, 154–161. [Google Scholar] [CrossRef]
  18. Hu, J.; Zhang, Y.N.; Law, M.; Wu, R.Q. Increasing the band gap of iron pyrite by alloying with oxygen. J. Am. Chem. Soc. 2012, 134, 13216–13219. [Google Scholar] [CrossRef]
  19. Sun, R.; Ceder, G. First-principles electronic structure and relative stability of pyrite and marcasite: Implications for photovoltaic performance. Phys. Rev. B Condens. Matter Mater. Phys. 2011, 84, 245211. [Google Scholar] [CrossRef] [Green Version]
  20. Sun, R.S.; Chan, M.K.Y.; Kang, S.Y.; Ceder, G. Intrinsic stoichiometry and oxygen-induced-type conductivity of pyrite FeS2. Phys. Rev. B Condens. Matter Mater. Phys. 2011, 84, 035212. [Google Scholar] [CrossRef]
  21. Ezzaouia, H.; Foise, J.W.; Gorochov, O. Crystal growth in tellurium fluxes and characterization of RuS2 single crystals. Mat. Res. Bull. 1985, 20, 1353–1358. [Google Scholar] [CrossRef]
  22. Sun, R.; Ceder, G. Feasibility of band gap engineering of pyrite FeS2. Phys. Rev. B 2011, 84, 245211. [Google Scholar] [CrossRef] [Green Version]
  23. Ouertani, B.; Ezzaouia, H.; Theys, B. Effect of ruthenium alloy on the band gap value of FeS2-pyrite. Colloids Surf. A Physicochem. Eng. Asp. 2017, 20, 13–19. [Google Scholar] [CrossRef]
  24. Sai, R.; Ezzaouia, H.; Muaffaq, M.M. Electronic structure of iron pyrite by the LMTO_ASA method. Results Phys. 2021, 22, 103950. [Google Scholar] [CrossRef]
  25. Ouertani, B.; Ouerfelli, J.; Saadoun, M.; Ezzaouia, H.; Bessaïs, B. Characterisation of iron oxide thin films prepared from spray pyrolysis of iron trichloride-based aqueous solution. Thin Solid Film. 2008, 516, 8584–8586. [Google Scholar] [CrossRef]
  26. Ouertani, B.; Ouerfelli, J.; Saadoun, M.; Bessais, B.; Hajji, M.; Kanzari, M.; Ezzaouiaa, H.; Hamdadoud, N.; Bernède, J.C. Characterization of FeS2-pyrite thin films synthesized by sulphuration of amorphous iron oxide films pre-deposited by spray pyrolysis. Mater. Lett. 2005, 59, 734–739. [Google Scholar] [CrossRef]
  27. Sai, R.; Gorochov, O.; Ezzaouia, H. The study of the electronic structure of RuS2. Results Phys. 2021, 26, 104393. [Google Scholar] [CrossRef]
  28. Foise, J.W.; Ezzaouia, H.; Gorochov, O. Crystal growth of p-type RuS2 using bismuth flux and its photoelectrochemical properties. Mat. Res. Bull. 1985, 20, 1421–1425. [Google Scholar] [CrossRef]
  29. Ezzaouia, H.; Heindl, R.; Loriers, J. Synthesis of ruthenium and osmium dichalcogenide single crystals. J. Mater. Sci. 1984, 165, 155. [Google Scholar] [CrossRef]
  30. Tsay, M.; Chen, S.; Chen, C.; Huang, Y. Preparation and characterization of iron-doped RuS2 single crystals. J. Cryst. Growth 1994, 144, 91–96. [Google Scholar] [CrossRef]
  31. Louie, S.G.; Ho, K.-M.; Cohen, M.L. Self-consistent mixed-basis approach to the electronic structure of solids. Phys. Rev. B 1979, 19, 1774. [Google Scholar] [CrossRef]
  32. Anderson, O.K. Coring and Core Analysis Handbook; Petroleum Publishing Company: Tulsa, OK, USA, 1975; p. 123060. [Google Scholar]
  33. Jan, J.P.; Skriver, H.L. Optical properties of single crystal thallium between 0.6 and 5 eV. J. Phys. F Met. Phys. 1977, 7, 1719. [Google Scholar] [CrossRef]
  34. Skriver, H.L. One-Electron Theory of Metals; Springer: Berlin/Heidelberg, Germany, 1984. [Google Scholar]
  35. Hohenberg, P.; Kohn, W.; Sham, L.J. Self-consistent equations including exchange and correlation effects. Phys. Rev. 1965, 140, A1133. [Google Scholar]
  36. Hedin, L.; Lundqvist, B.I. Explicit local exchange-correlation potentials. J. Phys. C 1971, 4, 2064. [Google Scholar] [CrossRef]
  37. Andersen, O.K.; Jepsen, O.; Krier, G. Lectures on Methods of Electronic Structure Calculations; Kumar, V., Andersen, O.K., Mookerjee, A., Eds.; World Scientific Publishing Co.: Singapore, 1994; pp. 63–124. [Google Scholar]
  38. Andersen, O.K.; Arcangeli, C.; Tank, R.W.; Saha-Dasgupta, T.; Krier, G.; Jepsen, O.; Dasgupta, I. Tight-Binding Approach to Computational Materials Science; Colombo, L., Gonis, A., Turchi, P., Eds.; Materials Research Society: Pittsburgh, PA, USA, 1998; Volume 491, pp. 3–34. [Google Scholar]
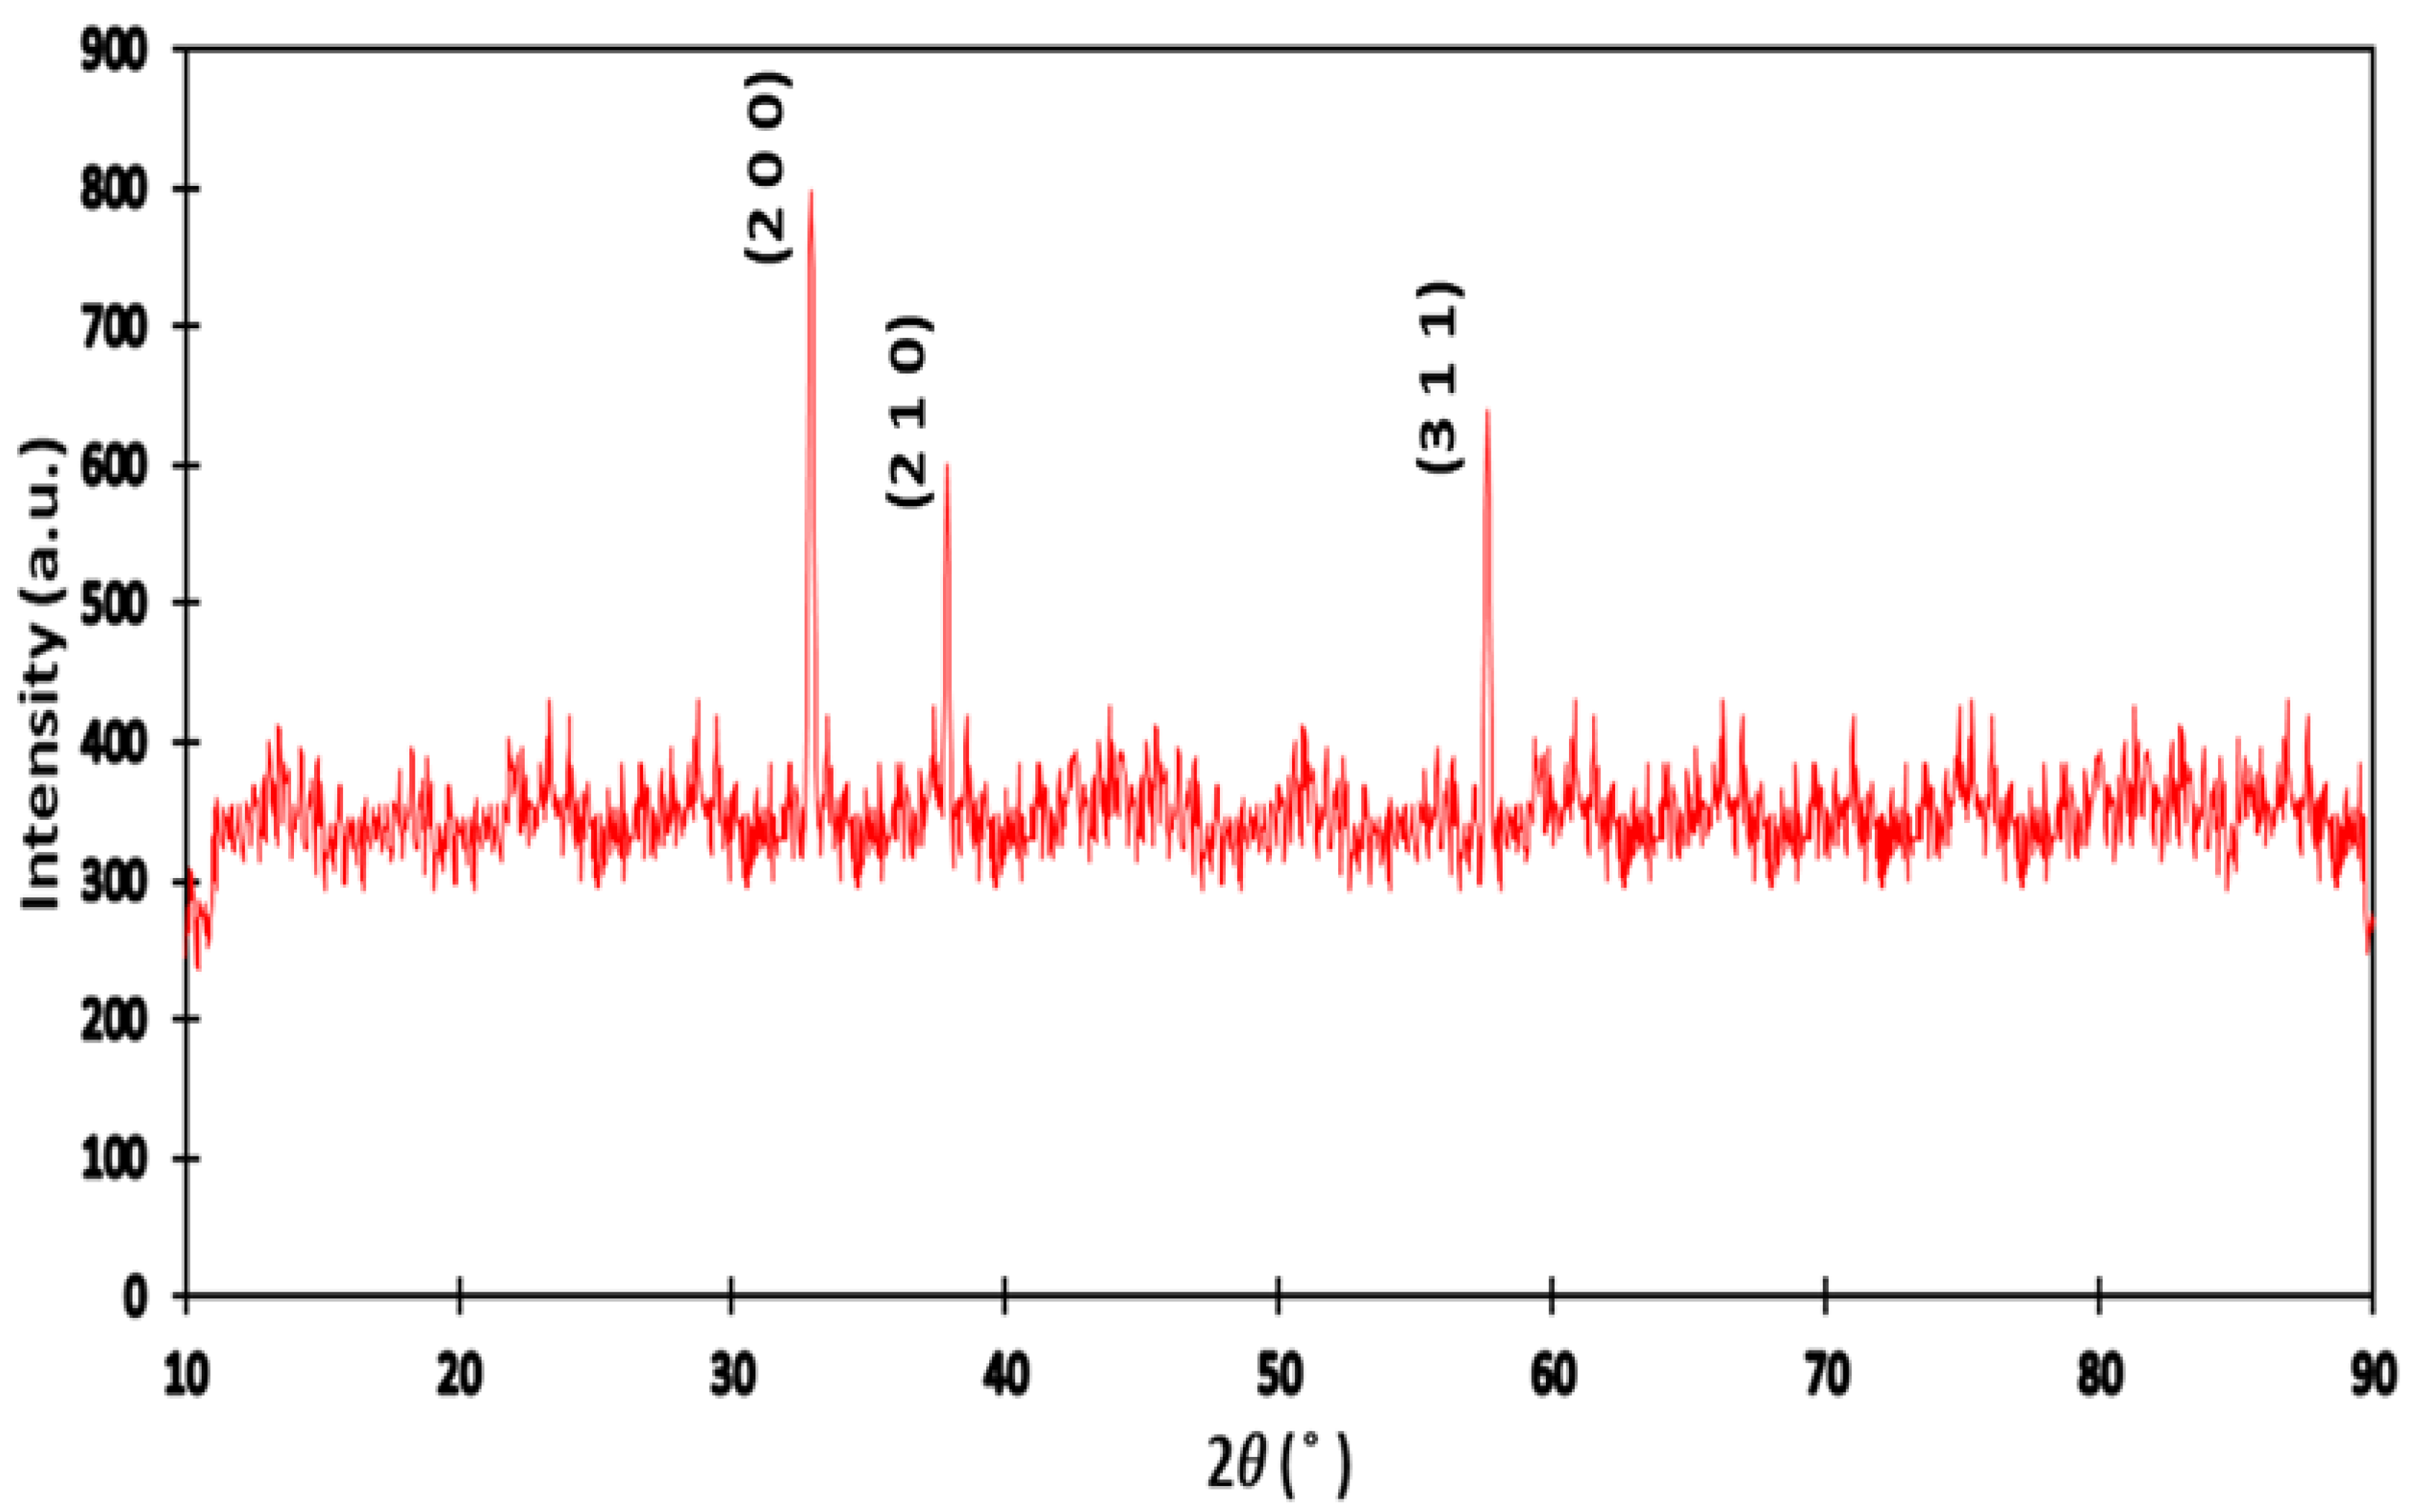
Figure 1. XRD spectrum for Fe 1 x Ru x S 2 for x = 0   and   x = 0.0119 .
Symmetry 14 02252 g001
Figure 2. α h ν 2 versus h ν gives straight line, suggesting that the Ru-alloyed FeS2 films have a direct band gap energy.
Symmetry 14 02252 g002
Figure 3. (a): α h ν 1 2 versus h ν . (b): α versus h ν .
Symmetry 14 02252 g003
Figure 4. Band structure of Fe 0.9881 Ru 0.0119 S 2 .
Symmetry 14 02252 g004
Figure 5. (a): Band structure of FeS 2 pyrite. (b): Band structure of RuS 2 pyrite.
Symmetry 14 02252 g005
Figure 6. Energy diagram for orbitals.
Symmetry 14 02252 g006
Figure 7. Density of states of Fe 0.9881 Ru 0.0119 S 2 .
Symmetry 14 02252 g007
Table 1. Cell Parameters.
Cubic   lattice   a 5.517  
ν   Position   paramater 0.113
u   Suffer   position 0.387
Bond   length   d s s 2.1212  
Table 2. Sample Parameters.
Cubic   lattice   a 5.517  
ν   Position   paramater 0.113
u   Suffer   position 0.387
Fe   position 0.5   0.5   0 ,   0   0.5   0.5 , 0.5   0   0.5
Ru   position 0   0   0
Bond   length   d s s 2.1212  
Publisher’s Note: MDPI stays neutral with regard to jurisdictional claims in published maps and institutional affiliations.