Article

A CFD Validation Effect of YP/PV from Laboratory-Formulated SBMDIF for Productive Transport Load to the Surface

by
Dennis Delali Kwesi Wayo
1,*,
Sonny Irawan
1,
Mohd Zulkifli Bin Mohamad Noor
2,
Foued Badrouchi
3,
Javed Akbar Khan
4 and
Ugochukwu I. Duru
5
1
Department of Petroleum Engineering, School of Mining and Geosciences, Nazarbayev University, Astana 010000, Kazakhstan
2
Faculty of Chemical and Process Engineering Technology, Universiti Malaysia Pahang, Kuantan 26300, Malaysia
3
Department of Petroleum Engineering, University of North Dakota, Grand Forks, ND 58202, USA
4
Institute of Hydrocarbon Recovery, Universiti Teknologi PETRONAS, Seri Iskander 32610, Malaysia
5
Department of Petroleum Engineering, Federal University of Technology, Owerri PMB 1526, Nigeria
*
Author to whom correspondence should be addressed.
Symmetry 2022, 14(11), 2300; https://doi.org/10.3390/sym14112300
Submission received: 4 October 2022 / Revised: 10 October 2022 / Accepted: 18 October 2022 / Published: 2 November 2022
(This article belongs to the Special Issue Artificial Intelligence, Adaptation and Symmetry/Asymmetry)

Abstract

:
Several technical factors contribute to the flow of cuttings from the wellbore to the surface of the well, some of which are fundamentally due to the speed and inclination of the drill pipe at different positions (concentric and eccentric), the efficacy of the drilling mud considers plastic viscosity (PV) and yield point (YP), the weight of the cuttings, and the deviation of the well. Moreover, these overlaying cutting beds breed destruction in the drilling operation, some of which cause stuck pipes, reducing the rate of rotation and penetration. This current study, while it addresses the apropos of artificial intelligence (AI) with symmetry, employs a three-dimensional computational fluid dynamic (CFD) simulation model to validate an effective synthetic-based mud-drilling and to investigate the potency of the muds’ flow behaviours for transporting cuttings. Furthermore, the study examines the ratio effects of YP/PV to attain the safe transport of cuttings based on the turbulence of solid-particle suspension from the drilling fluid and the cuttings, and its velocity–pressure influence in a vertical well under a concentric and eccentric position of the drilling pipe. The resulting CFD analysis explains that the YP/PV of SBM and OBM, which generated the required capacity to suspend the cuttings to the surface, are symmetric to the experimental results and hence, the position of the drill pipe at the concentric position in vertical wells required a lower rotational speed. A computational study of the synthetic-based mud and its potency of not damaging the wellbore under an eccentric drill pipe position can be further examined.

1. Introduction

An effective hole cleaning [1] comes with a high expectation of formulating a good drilling mud with accurate rheological properties to remove cuttings from the wellbore. Cuttings [2] from boreholes are intended to rise to the surface while drilling operations are ongoing. This process of lifting cuttings is crucial for drilling operators to avoid some drilling challenges faced, such as lost circulation, stuck pipes, poor rate of penetration, and drilling bit wear. A machine learning approach had been adopted to predict stuck pipe incidents in the drilling operation to decrease non-productive time [3].
Some conventional wells are challenged with this process as well as horizontal wells at an inclined position [4,5], posing a threat to reaching the desired depth of drilling. A higher rate of penetration in a wellbore means that the cuttings from the wellbore are lifted mainly because the mud under operation is assisting the drilling bit to cut fresh rock with little exertion of force; this further explains why it is necessary to keep the mud design in an accurate state, suitable for the wellbore and the effective removal of cuttings.
Conventional wells and some factors associated with picking up a good mud map have implications on the type of formation to be drilled, the size of the drill bit, and the position of the drill pipe, and the summation of all these requires a complex mud program to interpret and avoid these problems. To satisfy the needs of this current study, a formulated synthetic-based drilling mud from the Nazarbayev University drilling laboratory [6] was considered for computational fluid dynamic analysis. Synthetic-based drilling mud is chosen because a larger kick volume can be achieved when using water-based mud compared to synthetic-based mud. Kick tolerance varies with the mud type used due to its mud rheology (PV and YP) which impact the mud equivalent circulating density to drop more in water-based mud [7]. A simulation study shows that foam is also effective in the cutting transport from low bottom hole pressure wellbore [8,9]. However, in this study pipe rotation is not taken into account as the study’s purpose was to investigate particle transport during well cleanout operation.
Muds and cuttings transport phenomena occur through their respective drilling [10] and the annular column of the drilling system, factoring in the position of the drilling pipe at the time of rotation. However, previous studies over the years dived into the concentric and eccentric [11,12,13] effects of drilling pipes and their capacity to lift cuttings to the surface; while other research experimented [14,15,16,17,18], a few considered optimizing these effects with computational analysis [19,20,21,22,23,24,25,26,27,28,29,30]. Nonetheless, T.N. Ofei [31] focused on the entire fluid hydraulic effects of transport cuttings, and in most cases, it revealed that the drilling fluids which do not consider Newton’s law of viscosity (non-Newtonian) had the essential mud properties for the safe transport of cuttings. Studies from O. Erge [19] explain that the fluids’ viscous nature [32] which supports the safe transport of load or cuttings from the wellbore is influenced by the velocity of the mud and drill pipe rotation. An increase in mud velocity and rotation of the drill pipe minimises the chances of the mud carrying cuttings to the surface, but the reverse was revealed to be the best practice. Moreover, studies are at a record high finding better means to hit the threshold of regulating an efficient mud velocity and drill pipe rotation for safe cuttings transport through the annular section.
The investigation of cuttings size was nominated as one of the key effects on solid transport; previous studies under both experimental and computational analysis also highlighted the fact that an increase in the size of the loads in turn decreases the safe cuttings transport proficiency. Other analyses also explain that the geometry of the well and the position of the drill pipe in an eccentric position create pressure fluctuations [33] in lifting the loads to the surface. The ratio of these two rheological properties is a determinant of safe cuttings transport, or effective hole cleaning [34,35]. The focus of the study uses the experimental values from these rheological properties, both synthetic-based and oil-based muds to validate the actual effect using a computational fluid dynamic analysis. These fluids were considered non-Newtonian because the applied mechanical stresses were seen as independent of their shear rates. The plastic model according to Bingham explains that when the yield point is extrapolated, the value of the shear rate moves to zero, whereas in the same model, when the plastic viscosity is extrapolated, the shear rate moves to infinity [36]. A sensitive experimental comparison of the YP/PV property ratio from previous literature is demonstrated in Table 1. These formulated muds made references to the recommended API drilling fluid testing standards [37].
This current study employs a three-dimensional CFD simulation for the following reasons:
  • To validate the effective synthetic-based drilling mud formulated from the drilling fluid laboratory at Nazarbayev University.
  • To validate the distribution of synthetic-based mud particles and cuttings in the wellbore.
  • To investigate how rotating the drill pipe affects drilling mud transport capacity.
  • To examine the effects of fluid hydraulics on transport cuttings based on the turbulence of solid-particle suspension.
The novel results of this study will lead to a deeper understanding of the significance of synthetic-based and oil-based mud, perfect for the safe transport of cuttings from the wellbore to the surface. For effective fluid circulation, operators will be able to decide where on the annulus to modify pressure and velocity for effective drilling optimization. However, the arduous challenges combating the oil and gas industry keenly access AI symmetry techniques to simulate, model, and better still, automate the solutions for drilling optimization.

2. Methods

2.1. Empirical Data

The crucial response of CFD modelling will be a validation for the experimental data collated from the Nazarbayev University drilling laboratory. This is accompanied by a fairer comparison of data from previous research conducted by other authors [38]. Table 1 showcases rheological data considering only two properties that are a determinant of the safe transporting of cuttings [39] from the wellbore to the surface. An API standard [40] for drilling rheology explains that the ratio of yield point (YP) and plastic viscosity (PV) can be a determinant of an effective drilling fluid capable of lifting cuttings from the well. The ratio of YP and PV gives the transport index (TI), and for a safe index, the ratio is stipulated to be around 0.75–1.5 [6,35]. Earlier studies formulated several drilling fluids, but Table 1 gives structured data to reduce data noise. However, the data emanated from two different types of mud design, synthetic-based and oil-based mud. Each of these contains barite and bentonite as solid [41] particles and oil and water as liquid fluids, as demonstrated in Figure 1.

2.2. CFD–Eulerian–Eulerian Model

CFD can solve complex radical problems, and this study finds Matlab-CFD an insightful choice for the demonstration of solid-particle dispersion tracking, particle-particle collision, and multiphase flow velocity–pressure monitoring. In modelling this current study, Eulerian–Eulerian (EE) model analysis was considered for the fluid flow of various particle size distributions in the wellbore. Since this chosen model tends to handle particle-to-particle interactions, turbulence, and solid volume fractions all in the same domain, it is regarded as the best, however, Figure 2 provides the algorithm for computation.
The trajectory of the concentrated particles under this model reduces the operational cost for predicting or forecasting solutions to flow impedance in the wellbore or the essence of pressure drops during circulation. Moreso, the limitation of this current study under the EE model is based on the assumption that the particles are all considered spherical. For this reason, emphasis is made on transport equations such as continuity of flow and momentum balance. Particle-to-particle interactions [43,44] and their rigorous movement (turbidity) make a sense of collisions with their bodies which are a result of momentum and pressure, and this, however, is the parameter for EE modelling. Notwithstanding, the model for this study prioritizes the fluid phase under solid–liquid exchanges.

2.3. Drag Adaptation

The resistance to particle-free flow is attributed to drag. Previous studies in empirical analysis and on fields have tested the drag force as a means of capitulating the free flow of solid fluids in its domain. Others are of the view that the particles’ maximum velocity trajectory is influenced by their shape and size [20]. This current study limits its predictive novelty to spherical particle analysis. The coefficient of drag is a determinate of particle sphericity and a function of the Reynolds number; the lower the number, the laminar the flow and the higher the number showcases the turbidity of the flow.
Particles under the influence of drag force in a microscopic view are easy to analyse and are not in large quantity. It is hard to determine the influence of drag by a large volume of particles and in different sizes. The influence of particle sizes and shapes from the previous empirical results is considered as a whole. However, the moderated drag models published from Epelle–Gerogiorgis (EG), Refs [45,46,47] were considered for adaptation.

2.4. Model Assumptions

Satiating the current study’s validity, the CFD–Eulerian–Eulerian model is conducted based on an informed assumption below that:
  • The flow of solid–liquid particles under surveillance is in a continuous phase.
  • Particle-particle interactions do not result in a change in mass or form.
  • Particles’ shapes are spherical and uniform.
  • The synthetic and oil-based fluids are non-Newtonian and incompressible.
  • The position of the drill pipe is in both a concentric and eccentric position.
  • The walls of the drill pipe are smooth.

2.5. Governing Equations

The volume fraction of the solid–liquid assumed uniform flow in the annuli of the wellbore in question is expressed by the continuity equation.
The summation of all momentum acting on the solid–liquid phases describes the force, mass, and velocity of the solid-fluid movement in the wellbore given by:
1 ρ r s t a s ρ s + a s ρ s v s = l = 1 n m ˙ l s m ˙ s l   ,
t a s ρ s v s + a s ρ s v s v s = a s p p s + τ = q + a s ρ s g + l = 1 n K l s v l v s + m ˙ l s v l s m ˙ s l v s l + F s + F l i f t , s + F v m , s + F t d , s   , t a s ρ s v s + a s ρ s v s v s = a s p p s + τ = q + a s ρ s g + l = 1 n K l s v l v s + F s + F l i f t , s + F v m , s   .
Equations (1) and (2) are models considered from Epelle–Gerogiorgis (EG). The flow continuity and momentum parameters [48,49,50,51] involve the volume fraction solid phase a s , solid phase density ρ s , liquid phase density ρ l , liquid velocity v s , velocity interphases v l s s l , gravity g , mass transfers m ˙ l s s l , external force F s , and lift force F l i f t , s . However, in Equation (2), turbidity force is made relevant because of the high-pressure injection of drilling fluids and the rotational speed of the drilling pipe in the wellbore.
For the efficient review of the solid–liquid exchange coefficient K s l , as adapted from [2,20,31,52], previous studies explain that when the volume fraction of the liquid phase a l > 0.8 , then K s l is transformed into:
K s l = 3 4 C D a s a l ρ l v s v l d s a l 2.65   ,
where C D is the drag coefficient,
C D = 24 a l R e s 1 + 0.5 a l R e s 0.687   ,
where R e s is the Reynolds number of the solid-particle phase,
R e s = ρ l d s v s v l μ l   ,
and, in a case where a l 0.8 , then,
K s l = 150 a s 1 a l μ l a l d s 2 + 1.75 ρ l a s v s v l d s   .
The drill pipe is rotating and drilling fluids [53] are released from the drill bit’s nozzles to improve the cutting of the formation bed. Therefore, the current study does not anticipate that the fluid will flow in a uniform laminar flow. The pressure and velocity scale under this circumstance would create a turbulence model, where Reynolds numbers are expected to be high. The rate of dissipation k , and the kinetic energy ε for this model were considered dependent on the factors evolving around the transport equation in a single-phase flow:
t C α ρ α k α + C α ρ α U α k α μ + μ t α σ k k α
= C α P α ρ α ε α + T α β k   .
t C α ρ α ε α + C α ρ α U α ε α μ + μ t α σ ε ε α
= C α ε α k α C ε 1 P α C ε 2 ρ α ε α + T α β ε   .
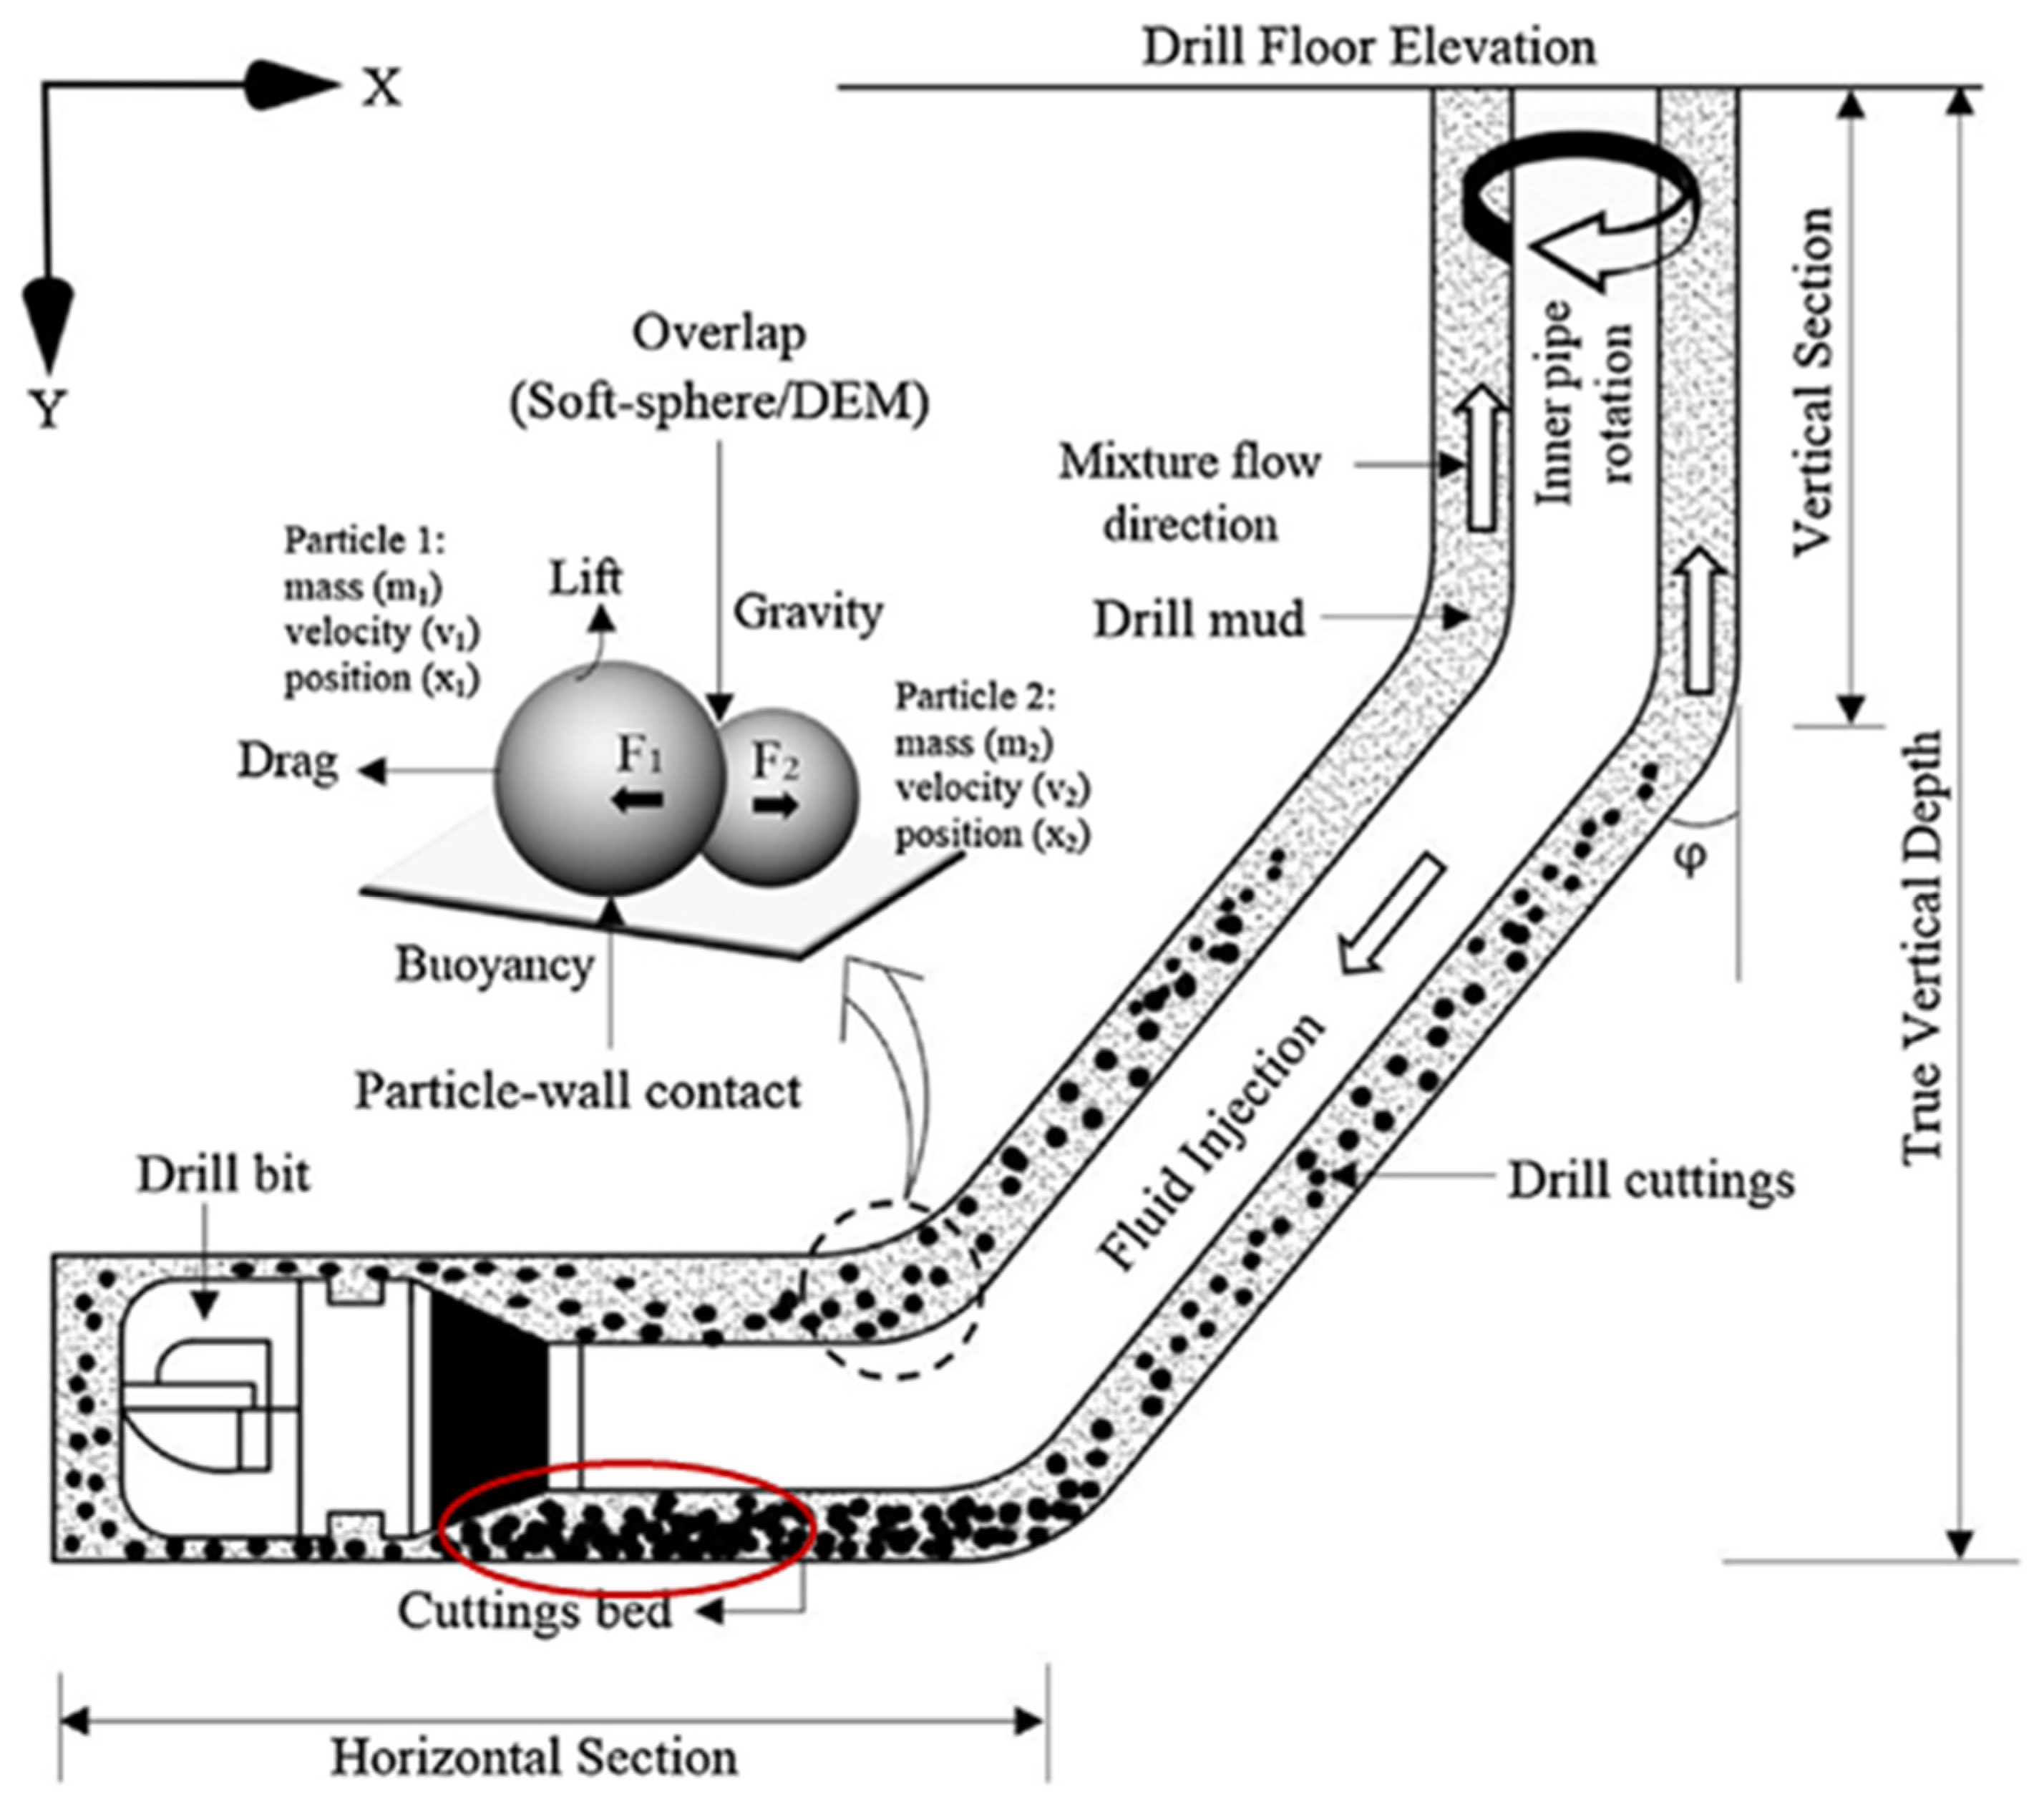
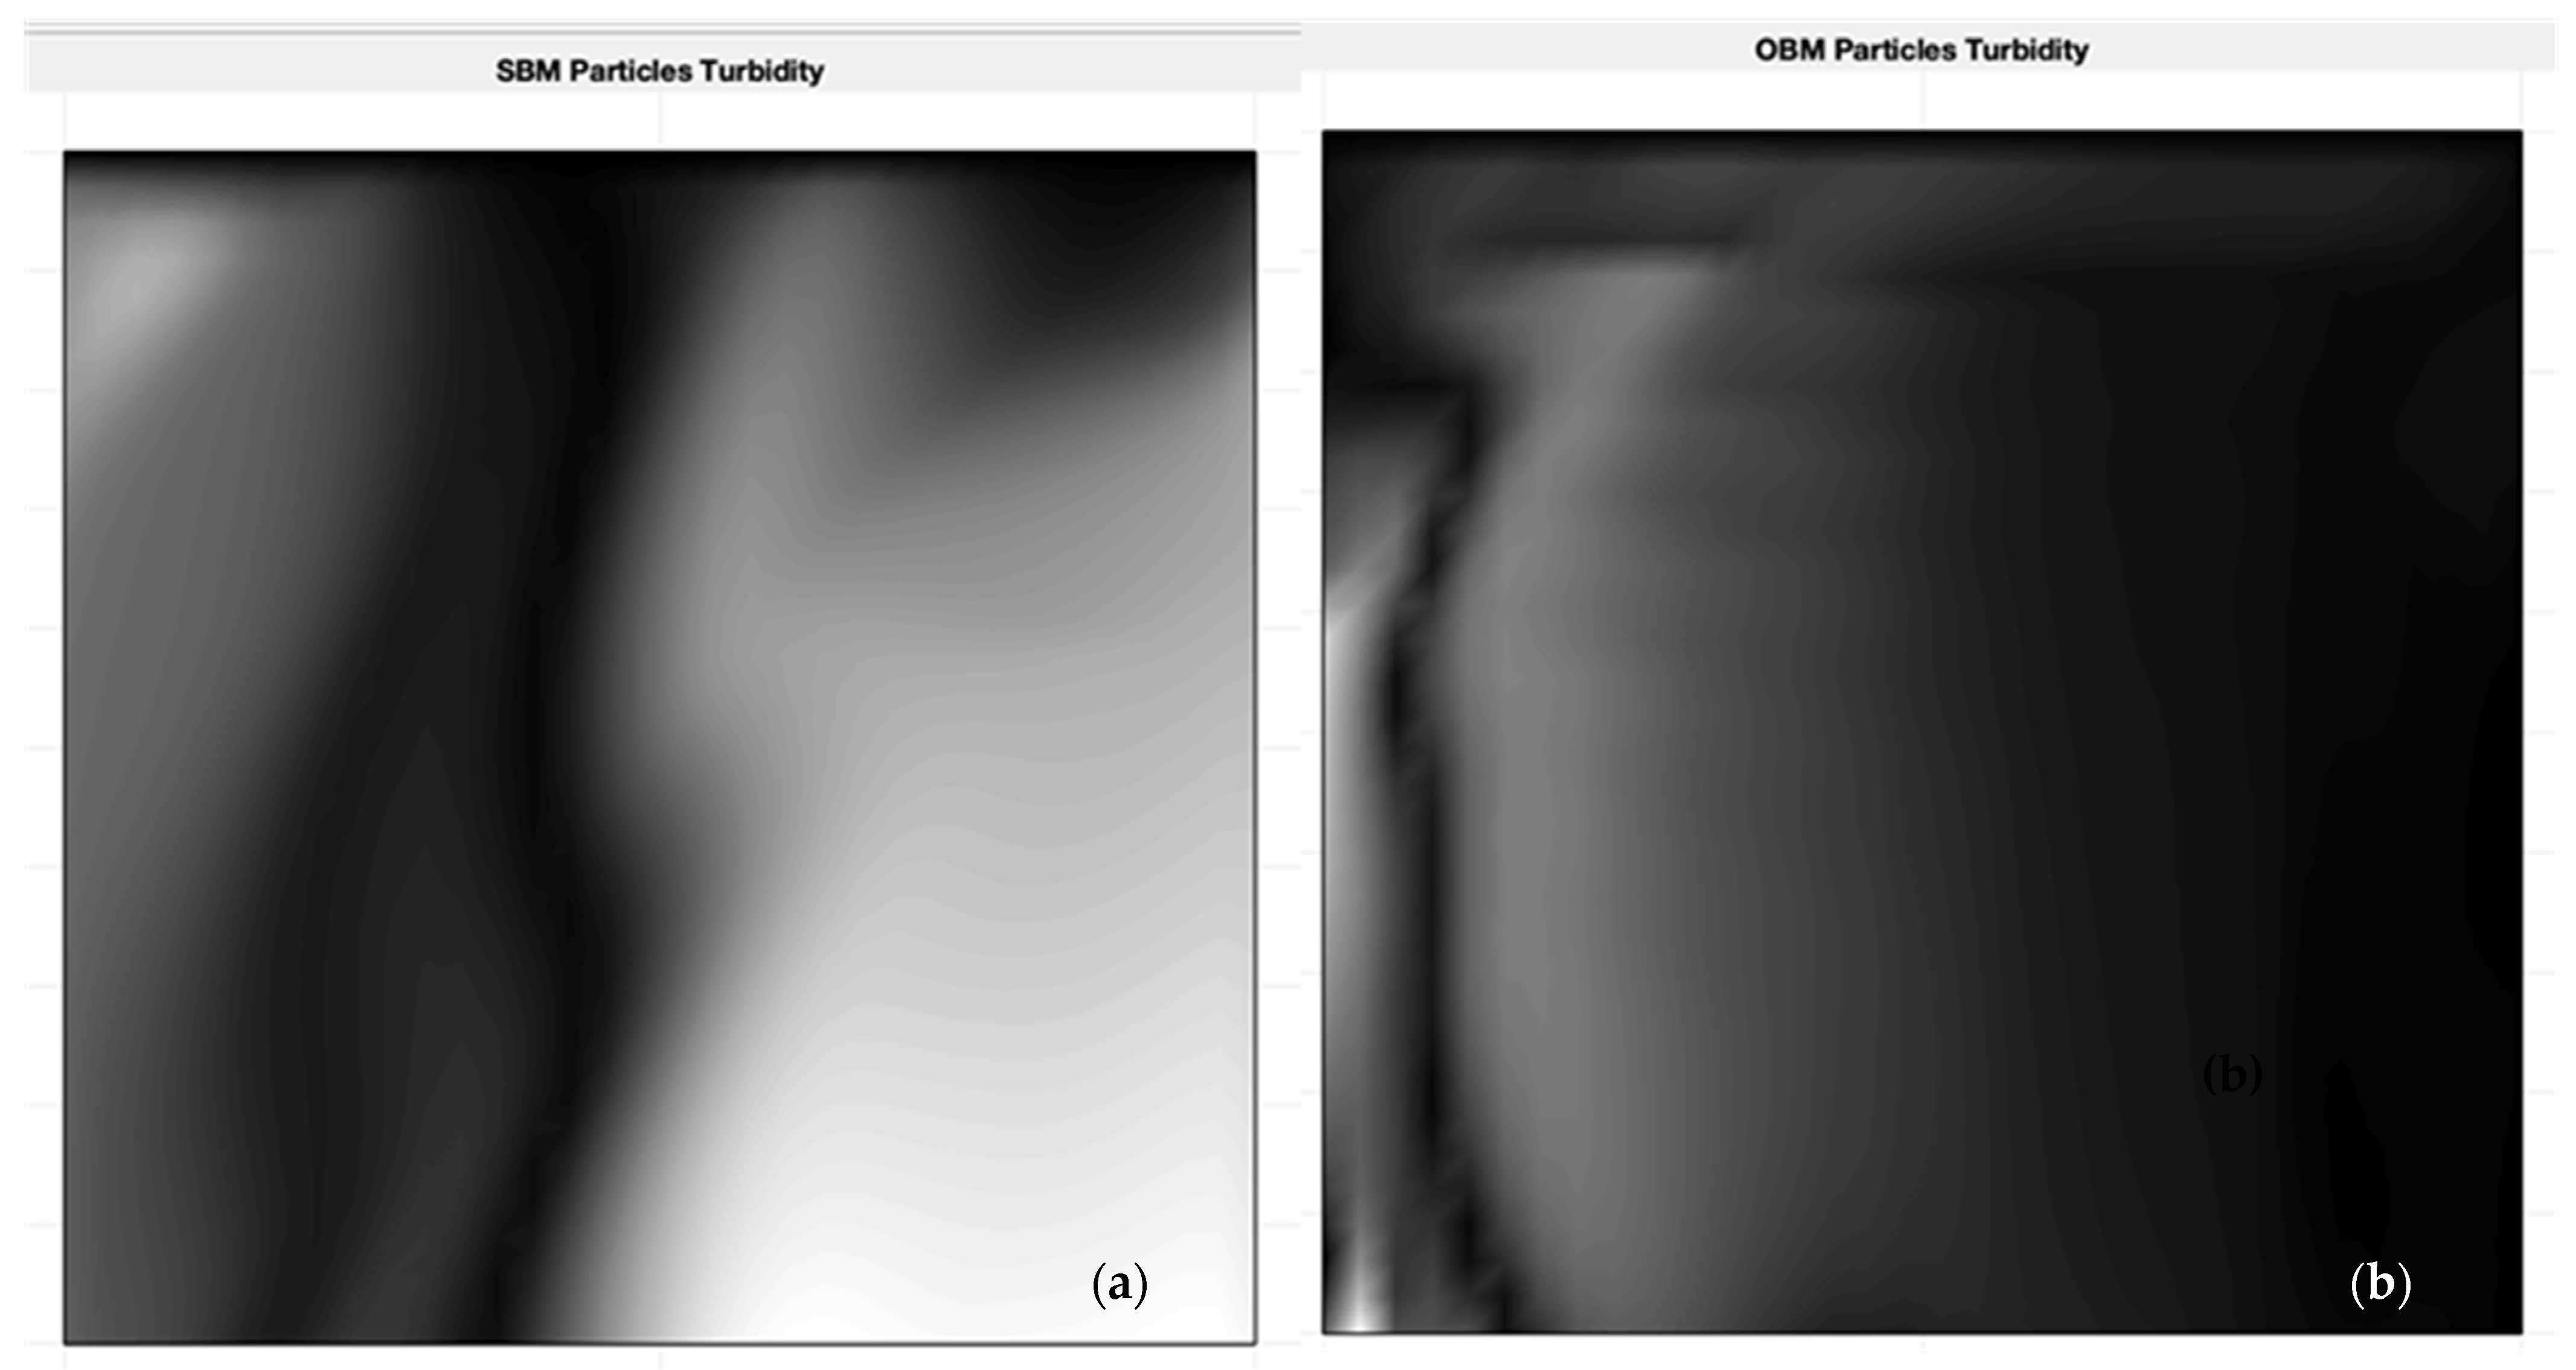
The turbidity of the particles in Figure 3 and Figure 4 is the focus of the investigation, verifying how the physical properties of these formulated muds (synthetic and oil) in the laboratory can be used to validate a CFD simulation to enhance predictive analysis. The turbulence viscosity of the particles under investigation is intermittently linked to the rate of dissipation and the kinetic energy, as adopted in Equation (9):
μ t a = c μ ρ α k α 2 ε α
The modelling of computational fluid flow does not only consider the above equations adopted from previous studies, the iterations of the pressure–velocity profiles of the mud capabilities were also considered using the Eulerian–Eulerian formulas active in the MATLAB FEATool Multiphysics.

2.6. CFD Model Implementation

The Eulerian–Eulerian model proposed in this study was implemented to define the efficacy of mud, demonstrating its tendency to carry cuttings in the wellbore to the surface. The finite element method was adapted while conducting the simulation using MATLAB FEATool Multiphysics. This pattern of computation focuses on the continuity of flow, momentum, and transport equations. Table 2, based on previous experimental analysis, gives explicit parameters needed for the simulation, however, the basis of the two-dimensional flow regime was factored on several factors including mud-nozzle inlet velocity, the velocity of the cuttings in the wellbore and the volume of force acting in the x-y direction.

Geometry, Grid & Boundary

A cross-sectioned wellbore coupled with drilling pipe and casing was used for this analysis; liquid–solid interactions between the outer walls of the drill pipe and the inner walls of the casing were the interest of the investigation. The trajectory of the particle’s collision with the walls of the casing and drill pipe were set to the limit boundary.
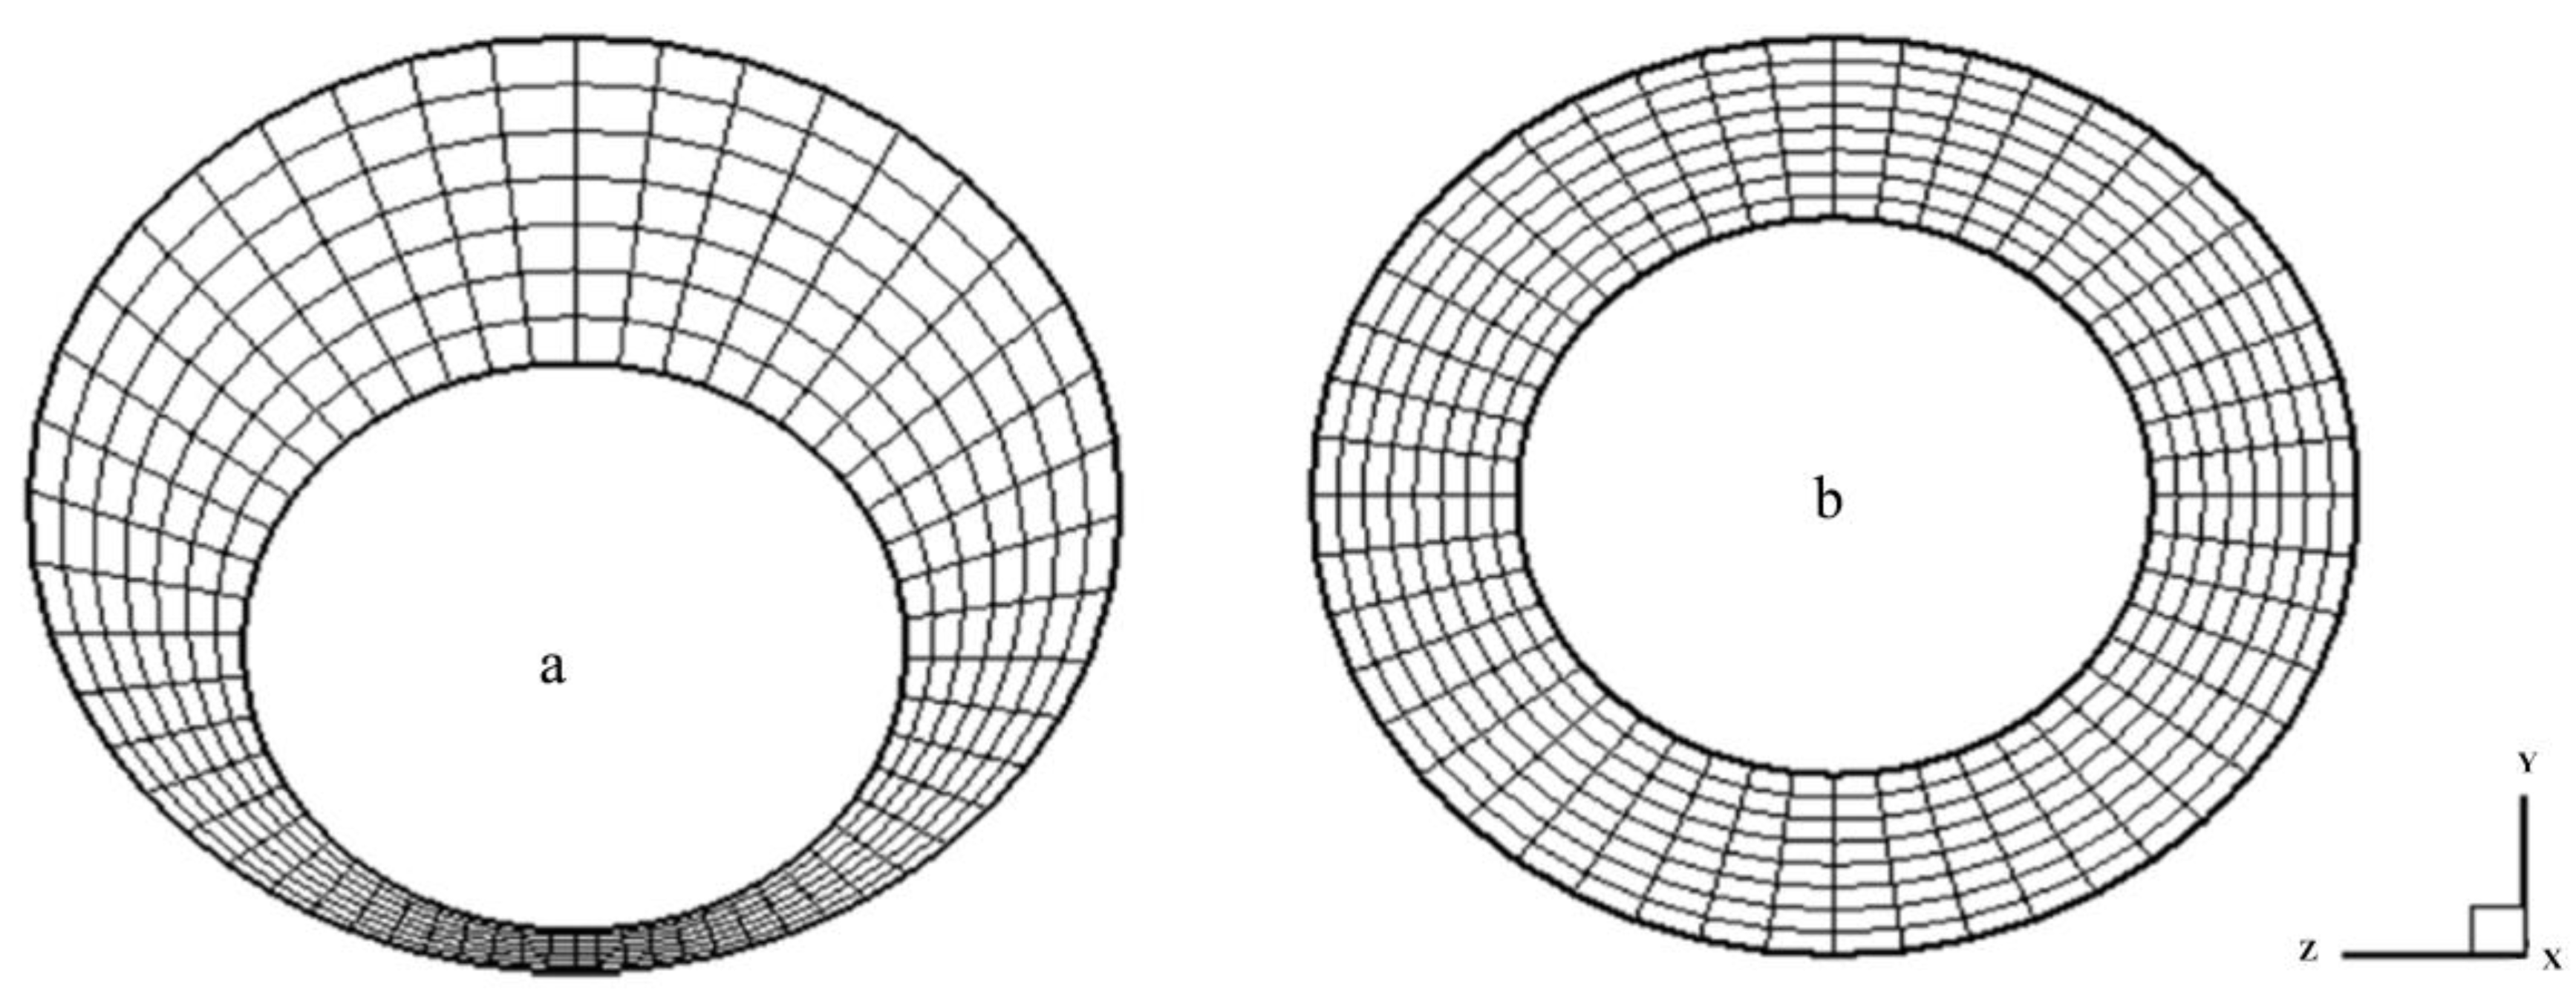
The space in between the casing and the drill pipe is termed the annulus. Additionally, the domain for this simulation was set up in both concentric and eccentric locations using Equation (10), where E is the distance between the centres of the inner ( R i ) and outer ( R o ) tubes of the annulus, as demonstrated in Equation (10) and Figure 5.
e = E R o R i
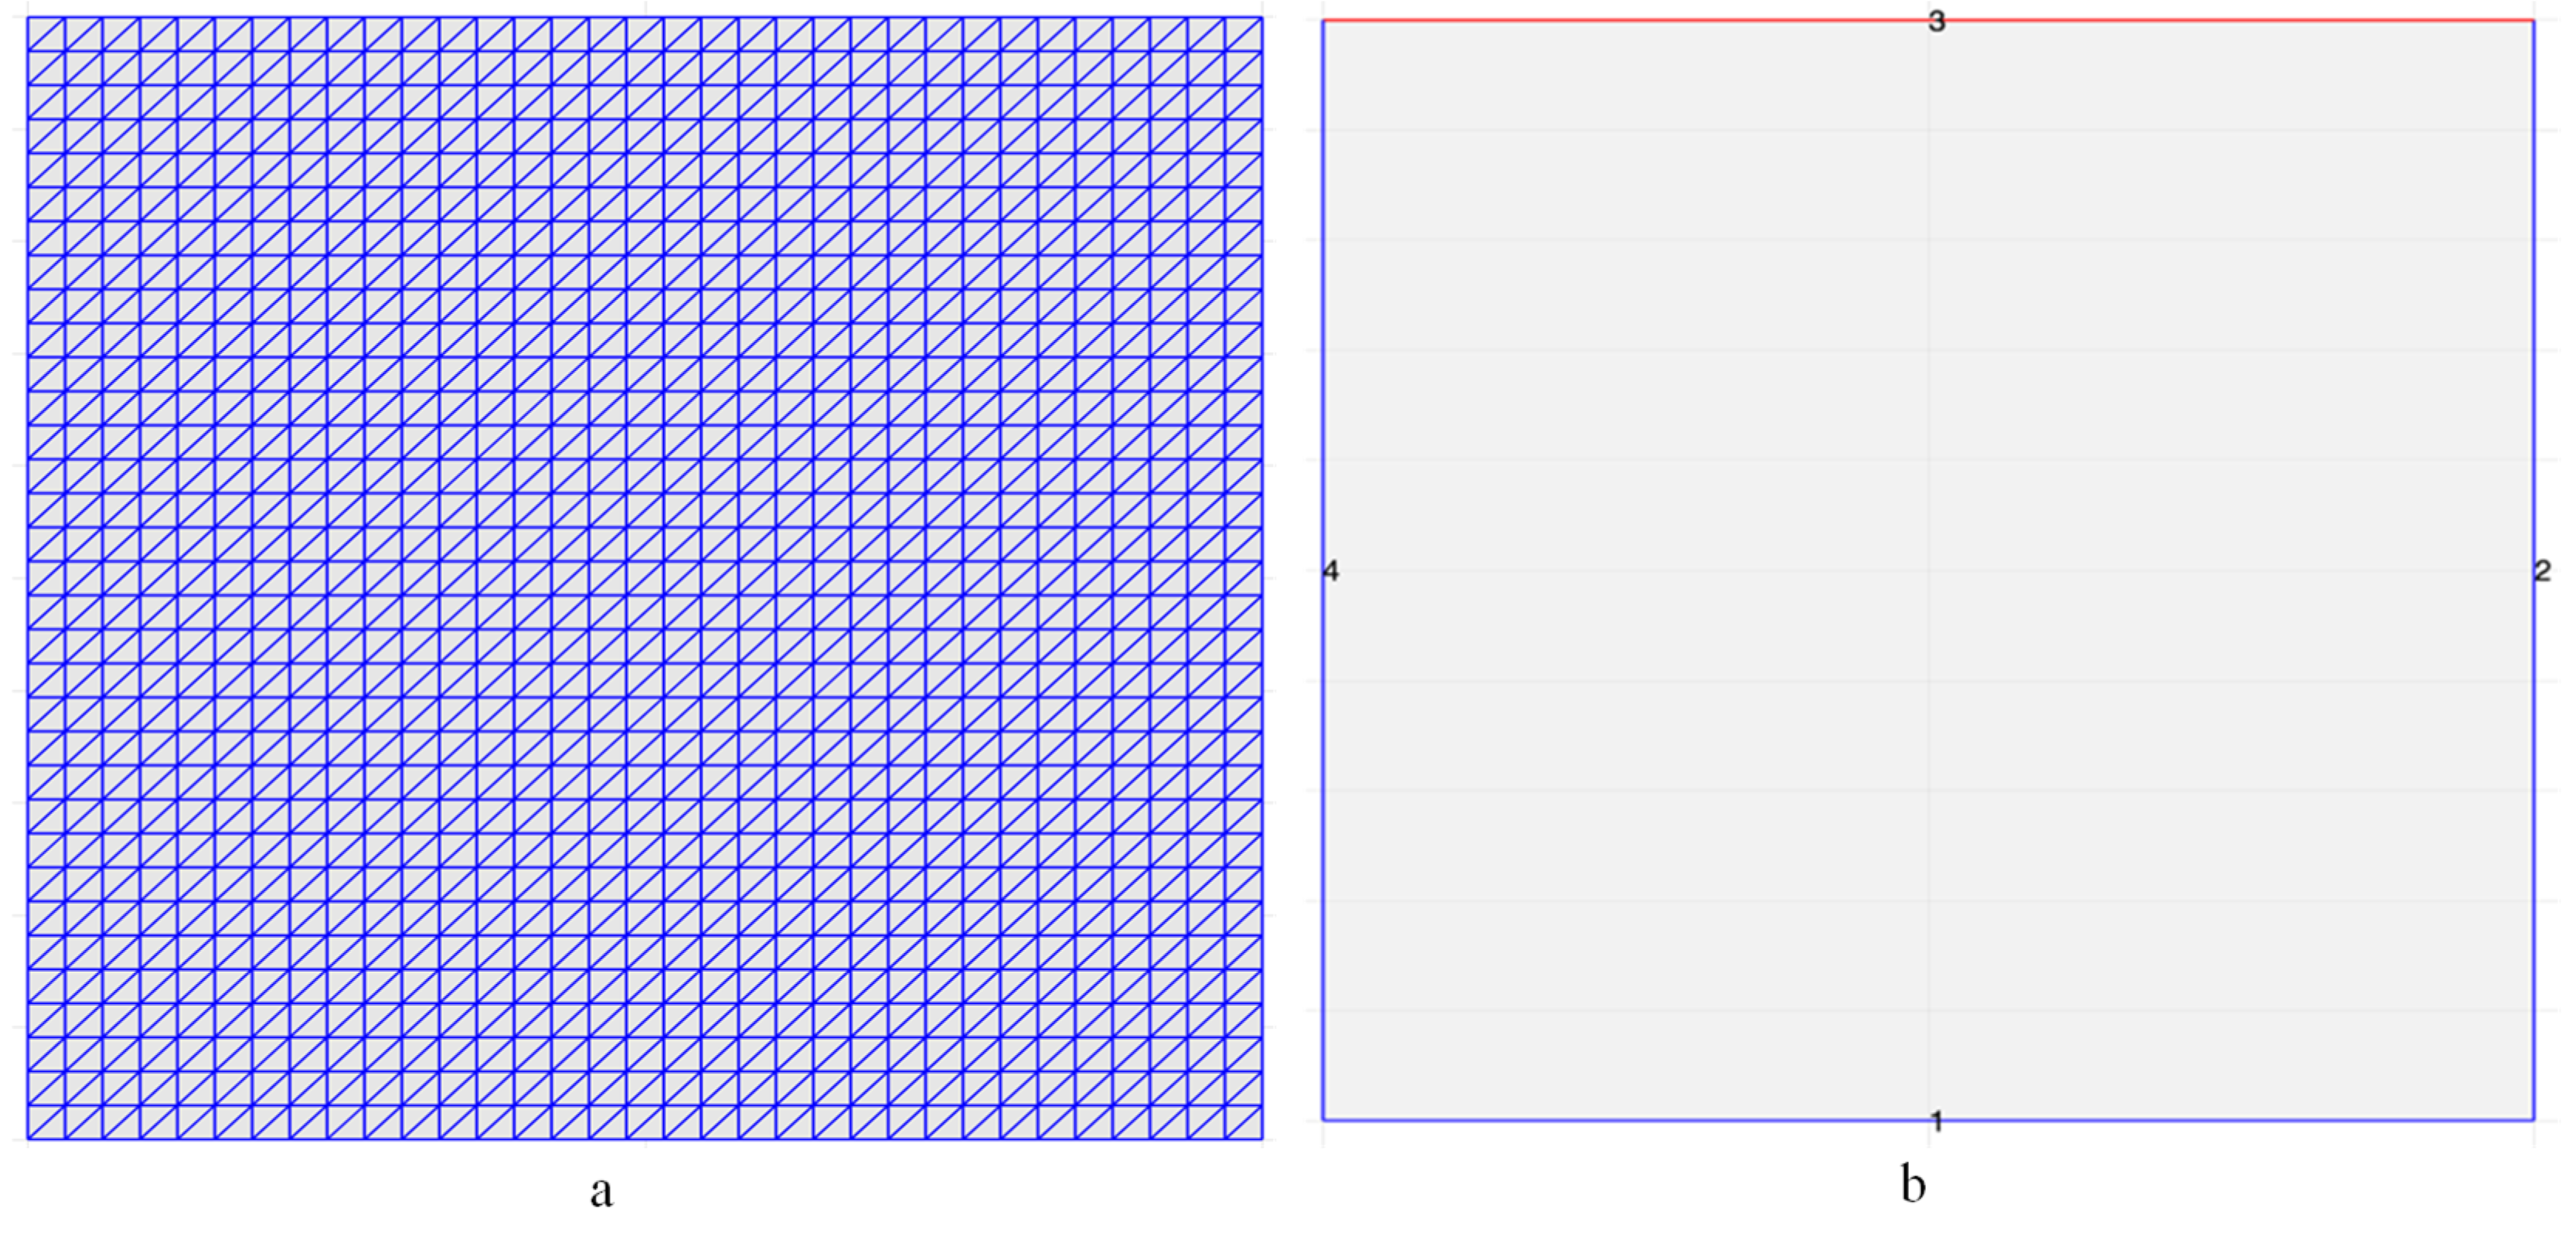
The grid for the analysis maintained the shape and size set by the geometry to support running the set of equations governing this analysis. The grid was set at 0.03 to discretize the domain efficiently. Also, Figure 6a,b exposes the true cross-sectional view and boundaries of the wellbore, and in further assumptions stated above, the right wall (boundary 2) was considered the outer wall of the drill pipe which was assumed smooth. Boundary 4, being the left wall was named the inner wall of the casing, while boundary 3 was classified as the annulus of the drilling column; it is termed to be the inlet/outlet boundary. No stress or neutral boundary was set to have boundary 1; this was because the focus of the investigation was limited to finding the behaviour of liquid–solid interactions between the casing and drill pipe, so long as an established assumption of cuttings was already in the loop of investigation.

3. Results and Discussion

The computational liquid–solid modelling considered the schematic flowchart in the above Figure 2 as the basis to determine a two-dimensional fluid particle distribution, dispersion, and turbidity. These cuttings emanating from the formation beds were simulated using the pressure (80 psi) from the drilling fluids under review to force out, or clean the wellbore, thereby maintaining constant hydrostatic pressure to carry these cuttings to the surface.
Simulated fluids, investigating their rheological properties [54], were simply classified under non-Newtonian fluids. The potentiality of these fluid flows (synthetic and oil-based muds) was tested through a cross-sectioned vertical eccentric annulus. The CFD model development examined the turbulence of the particles holding the assumptions made for its success.
CFD analysis was tuned to hold other parameters constant, as demonstrated in Table 2, while other parameters had different values due to the disparities in fluid rheology [55]. Moreso, the experimental results from Table 1 (results emanating from the laboratory drilling fluids) were keenly used to validate the CFD 2D simulation for this study.
The transport index from the experimental analysis satisfies the API standards [40] for drilling fluids capacity. This, in its original form, had the cutting transport ratio adapted from Rooki’s model [29], used for the CFD simulations as demonstrated in Equation (11), where R T is the cuttings transport ratio, V t is the velocity for cuttings transportation, and V a is the velocity of the fluid in the annulus.
The fluid dynamic analysis and the experimental results were duly compared using the transport index or ratio as the basis of analysis, as demonstrated in Figure 7.
The non-Newtonian fluids experimented with by Wayo, Okon and Murtaza were analysed by calculating each cutting transport ratio considering yield point and plastic viscosity. The CFD analysis was based on Equation (11); the ratio of transport cutting velocity and the velocity of the fluid in the annulus was defined.
Moreover, each model analysis paid attention to the safe transport of cuttings ranging from 0.75 to 1.5. This explains that the higher the safe cutting range, the greater the drag force with a greater proportion of solid cuttings transported through the annulus. The experimental data and the CFD simulations are both agreeable.

3.1. Effects of Particle Diameter and Density

The size of the particle and density from the synthetic-based mud had a substantial effect on the cuttings [56] carriage and an impactful increase in the development of turbulent flow. However, fluid motion often has traces of particles in its direction, and the collisions of these particles in an opposite direction. The response time of each collision creates a rise in turbulences and alters the flow patterns. The highest appreciable particle diameter under investigation was 1 mm for both synthetic and oil-based muds. Also, the density of fluids in their entirety, whose motion was in a turbulent flow, was tolerable at over 14,000 kg/m3.
The velocities acting on the same particle diameter from different fluids, as demonstrated in grey in Figure 8, spell out the increasing flow of the said particles rushing out to fill the void spaces in the annulus. Moreso, particles from cuttings are noted to have high densities and larger particle diameters (7 mm), and the velocities of the cutting particles (60 m/s) expound the disposition of typical fluid turbulence.
The deposition of smaller particles in high velocities that turn to fill up the void spaces act swiftly to create higher turbidity. Spreading, or the transfer of particles to previously particle-free areas was demonstrated by the 1 mm diameter particles, which further demonstrates the carrier fluid’s ability to act continually. Additionally, the velocity profiles demonstrate that when compared to smaller particles, larger particles have a higher propensity to travel along the drill pipe’s rotating path.
As shown in Figure 8a,b, the combination of particles and cuttings from the corresponding synthetic-based and oil-based muds predict the movement of the particles in various directions. Figure 8 generally shows the movement of concentrated particles from the right to the mid-left (towards the formation walls) during the drilling operations.
Most appreciable, the smaller particles (1 mm) were compelled to travel toward the formation’s walls by the influence of the drilling pipe rotation.

3.2. Effects of Pipe Rotation and Velocity Profiles on SBM/OBM

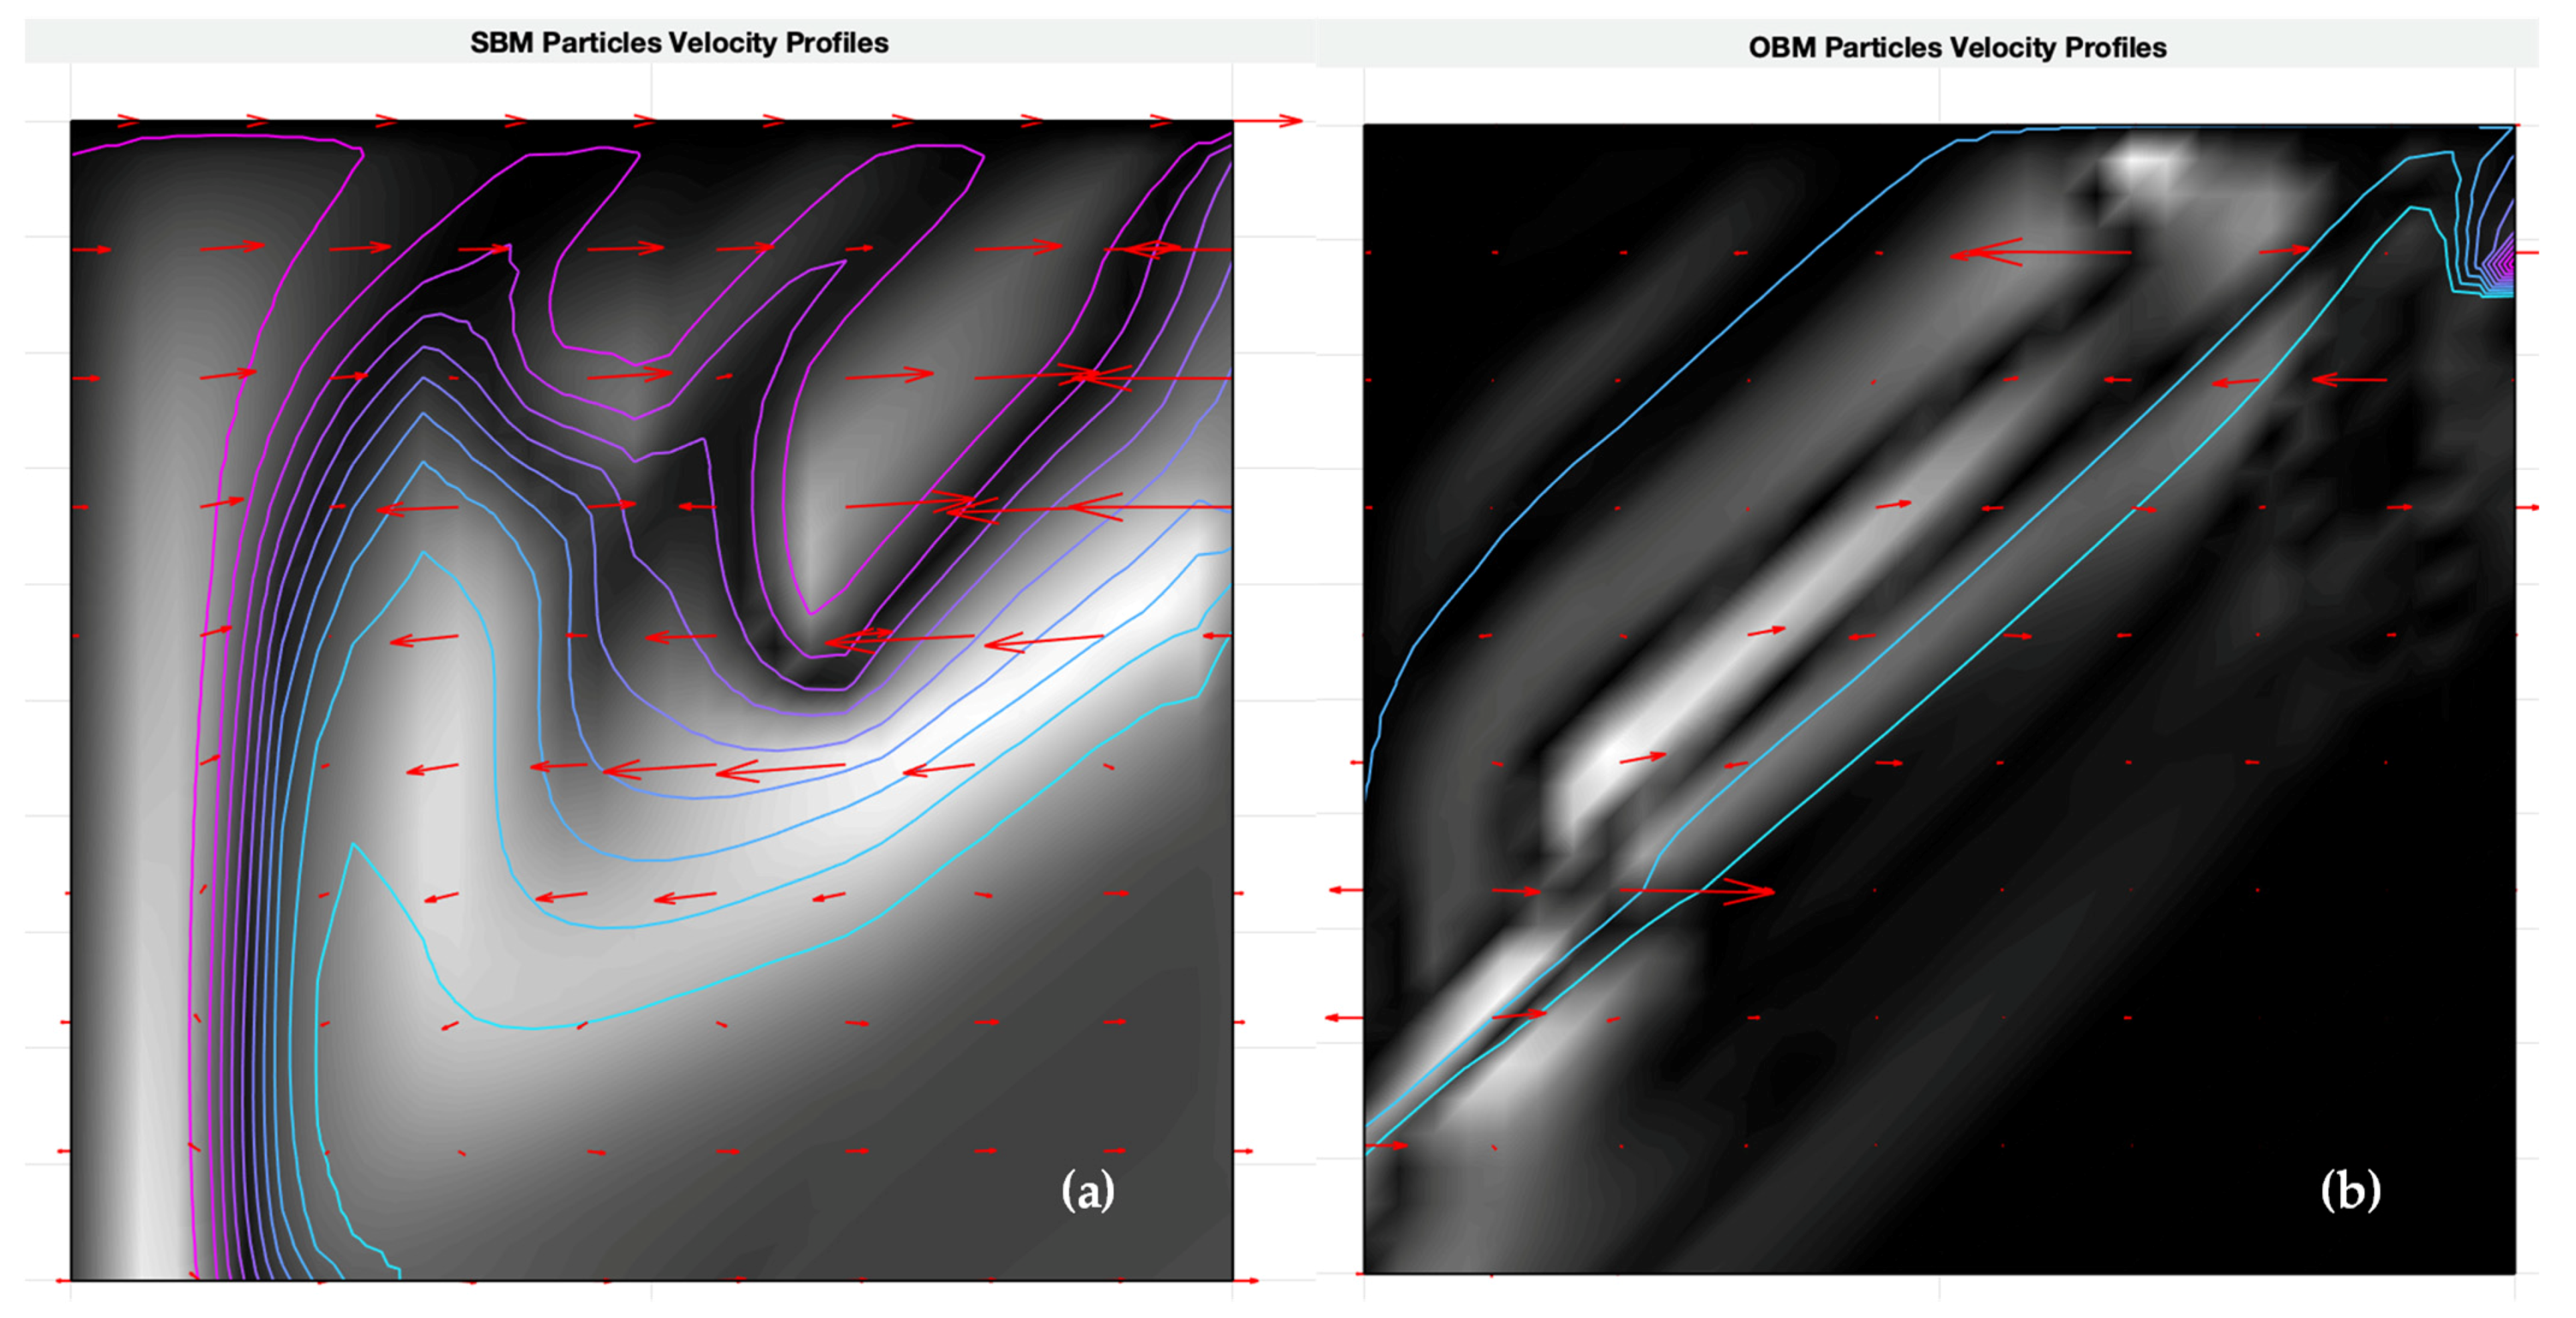
By further simulating its effectiveness, fluid rheology was evaluated to define its potency, by keeping the pipe rotation constant and the velocity of the cuttings and mud also persistent. Figure 9a,b depict a CFD simulation of both synthetic and oil-based muds. It could be identified that the velocity profiles of these mud particles collide; concentrating on the red arrows, particle-particle collision is imminent. However, the explanation for setting boundaries in Figure 6b applies to Figure 9.
At lower velocities, there are higher tendencies of increased frictional resistance, because the depositions of the cuttings and mud particles on the floors of the formation bed at the lower annulus will adversely reduce the rotation of the drill pipe. Nonetheless, Figure 9 is notably displaying mud particles and cuttings above the annulus; this explains that the velocity of these particles under surveillance is, at its best, not increasing frictional resistance.
Mud particles comprehend the fact that the rotation of the drill pipe rapidly moves these particles toward the formation walls; though we assumed the pipe is smooth and has no slip. The slip velocity for these profiles was considered not to have any adverse effect on the simulation. The EG model elucidates the relevance of slip velocity fluctuations being the results of the speed of the drill pipe rotation, as illustrated in Figure 10. Hence, a lower slip velocity is a ramification of an increased drill pipe rotation.
Although it has been established that the velocity profile of the cuttings and the mud particles are not in any way increasing the frictional resistance, closing up the space between the walls of the formation and the assumed smooth drill pipe walls would create an eccentric position. Simulation from authors [42,57,58] and this study predict that the particle-particle collisions will intensify; cuttings from the bed would however rise because smaller particles will tend to occupy void spaces causing drag and lift. An eccentric position will adversely create a stuck pipe [59] if the drill pipe rotation for this simulation remains constant; this is because proven fluid viscosity varies, and this is aligned with previous studies delineating that they are non-Newtonian; their shear rates openly lead to cuttings’ carriage. For the avoidance of thought and to optimise the fluids carriage rheology, the drill pipe rotation should be maintained constant only at the concentric position, or increased drill pipe rotation at an eccentric position.
The higher the shear region, the lower the viscosity and the lesser the synthetic and oil-based mud transport capacity; this is for the case of an eccentric position. Inversely, the lower the shear region, the higher the viscosity, then the greater the propensity of mud being able to carry or transport cuttings. This is also for the case of concentric position.
The positions of the cuttings in the annulus have no constraints on the fluid transport capacity under a concentric position. This is because the shearing rate at the most extremity is termed pseudo-uniform. This cannot be said the same for eccentric positions because the flow cutting and the dispersion of cuttings are seemly, not uniform.
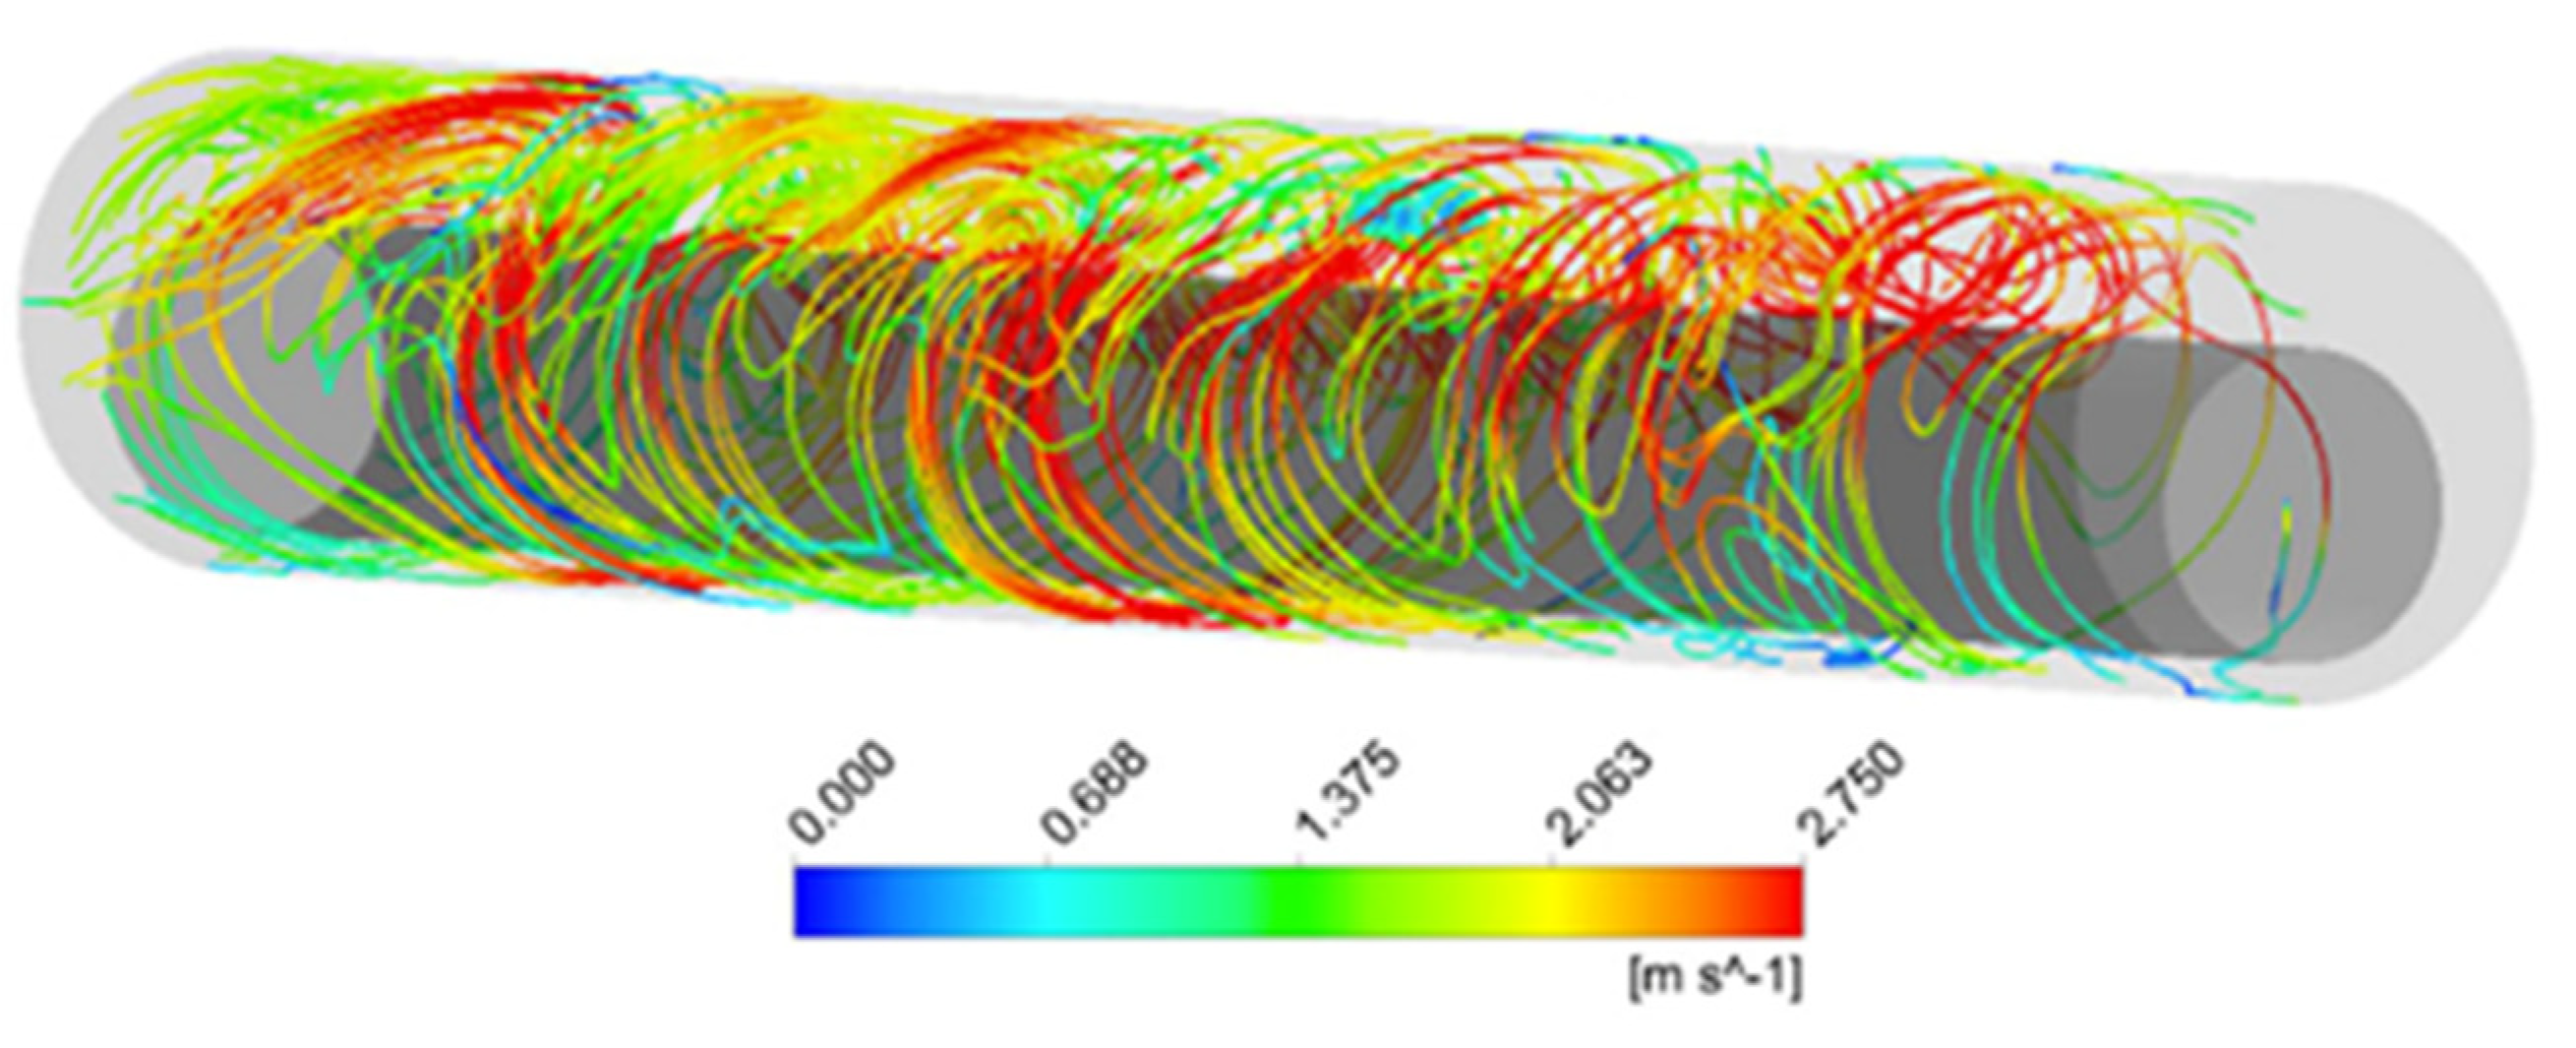
The ideal situation for optimizing the fluid rheology transport capacity is to keep drill pipe rotation at a favourable speed in a concentric position. Field practice would have the combination of the two positions at their best. For drilling optimization, as purported by previous studies [60,61], the efficiency of transporting cuttings to the surface of the wells is to increase the propitious speed of the drill pipe in an eccentric position, as illustrated in Figure 11.

3.3. Effects of Fluid Rheology

The properties of drilling fluid rheology, i.e., yield point and plastic viscosity, at any given point in time must have cuttings transport or carriage capabilities otherwise it tends to lose its significance as a drilling fluid. These listed properties cannot be said the same for water which is less viscous. Fluid rheology under surveillance for any given position (concentric and eccentric) demonstrated the capacity to shear and transport cuttings to the surface. Maintaining the drill pipe rotation at 80 RPM, particles in the annulus were seen to have a pseudo-uniform movement in a concentric position rather than in an eccentric position. Further, the vertical well under simulation played a major role in reducing friction resistance, since the walls of the formation are not inclined to challenge the behaviour of the particles.
Both the synthetic and oil-based muds exhibited greater proportionate means of transporting cuttings from the well to the surface.

4. Conclusions

The novelty of this paper presents the opportunity to simulate experimental results emanating from our previous studies to support the efficiency of the drilling fluids transport index considering some fluid rheology (yield point and plastic viscosity). While defining terms under the Eulerian–Eulerian Model, the CFD analysis emphasized liquid–solid particle dispersion and collisions, their velocity profiles, and their effects on limited annulus space. The simulation revealed that:
  • The CFD simulation validates the experimental results; the symmetrical results purport that the transport index or transport capacity for these two different drilling fluids (synthetic-based and oil-based muds) under surveillance were agreeably efficient and suitable for drilling operations.
  • The smaller particles swiftly occupied the void spaces aiding the lift of cuttings to the surface. Particle diameters of 1 mm were spotted as suitable particle sizes for the enhancement of cuttings carriage. Also, the distribution of cuttings at any point of the annulus was only seen as efficient at the concentric positions.
  • An 80 RPM pipe rotation maintained throughout the simulation favoured particles in the concentric annulus; movement of these particles was seen as uniformly distributed.
  • The turbulence of the solid particles was caused by the velocity profiles of the smaller particles in question.

Author Contributions

D.D.K.W. and S.I. designed the experimental work and generated the data. D.D.K.W. computed the simulation flow and wrote the manuscript. The methods and results of the manuscripts were reviewed by M.Z.B.M.N., F.B., J.A.K. and U.I.D. All authors have read and agreed to the published version of the manuscript.

Funding

The authors declare that the source of funding for this study was The Faculty Development Competitive Research Grants for 2020–2022 at Nazarbayev University. Project No. 080420FD1911.

Data Availability Statement

Not applicable.

Acknowledgments

We are thankful to Nazarbayev University for the opportunity given to us to further share our work under the competitive grant in the School of Mining and Geosciences. Notwithstanding, we passionately acknowledge all authors cited in this piece of work and we are most grateful for their extensive research work which supports knowledge transfer.

Conflicts of Interest

We hereby state that there are no known competing financial interests or personal ties that could have influenced the research presented in this study.

Nomenclature

CFDcomputational fluid dynamic
RPMrevolution per minute
OBMoil-based mud
SBMsynthetic-based mud
YPyield point, lbf/100 ft2
PVplastic viscosity, lbf/100 ft2
a s solid phase volume fraction
a l liquid phase volume fraction
C D drag coefficient
d s particle diameter, m
E distance between centres, m
e eccentricity
ε α kinetic energy
F s solid phase force, N
F l i f t , s lift force, N
F v m , s virtual mass force, N
F t d , s turbulence dispersion force, N
g gravity, m/s2
k α rate of dissipation
K l s interphase momentum exchange coefficient
m ˙ l s mass transfer from liquid phase to solid phase, kg/s
m ˙ s l mass transfer from solid phase to liquid phase, kg/s
P α volume fraction pressure
P s solids pressure, Pa
ρ s solid phase density, kg/m3
ρ l liquid phase density, kg/m3
R i centre of inner tube
R e s particle Reynolds number
R o centre of outer tube, m
R T cuttings transport ratio
μ viscosity, Pa·s
μ l fluid viscosity, Pa·s
μ t α turbulence viscosity, Pa·s
V a velocity of cuttings transport, m/s
V t fluid velocity in annulus m/s
v l liquid phase velocity m/s
v s solid phase velocity m/s

References

  1. Badrouchi, F.; Rasouli, V.; Badrouchi, N. Impact of hole cleaning and drilling performance on the equivalent circulating density. J. Pet. Sci. Eng. 2022, 211, 110150. [Google Scholar] [CrossRef]
  2. Huque, M.M.; Butt, S.; Zendehboudi, S.; Imtiaz, S. Systematic sensitivity analysis of cuttings transport in drilling operation using computational fluid dynamics approach. J. Nat. Gas Sci. Eng. 2020, 81, 103386. [Google Scholar] [CrossRef]
  3. Khan, J.A.; Irfan, M.; Irawan, S.; Yao, F.K.; Rahaman, M.S.A.; Shahari, A.R.; Glowacz, A.; Zeb, N. Comparison of machine learning classifiers for accurate prediction of real-time stuck pipe incidents. Energies 2020, 13, 3683. [Google Scholar] [CrossRef]
  4. Oseh, J.O.; Norddin, M.N.A.M.; Ismail, I.; Gbadamosi, A.O.; Agi, A.; Ismail, A.R. Experimental investigation of cuttings transportation in deviated and horizontal wellbores using polypropylene–nanosilica composite drilling mud. J. Pet. Sci. Eng. 2020, 189, 106958. [Google Scholar] [CrossRef]
  5. Ulker, E.; Sorgun, M. Comparison of computational intelligence models for cuttings transport in horizontal and deviated wells. J. Pet. Sci. Eng. 2016, 146, 832–837. [Google Scholar] [CrossRef]
  6. Wayo, D.D.K. Primary Evaluation of Filter Cake Breaker in Biodegradable Synthetic-Based Drill-In-Fluid. Master’s Thesis, Nazarbayev University, Astana, Kazakhstan, 2022. [Google Scholar] [CrossRef]
  7. Khan, J.A.; Irawan, S.; Dan, I.B.M.; Cai, B. Determining the difference of kick tolerance with single bubble and dynamic multiphase models: Evaluation of well-control with water/synthetic based muds. Ain Shams Eng. J. 2022, 13, 101678. [Google Scholar] [CrossRef]
  8. Pao, W.; Khan, J.A.; Ofei, T.N.; Irawan, S. Fill removal from horizontal wellbore using foam in different coiled tubing/annulus diameter ratios. Int. J. Oil Gas Coal Techbol. 2015, 9, 129–147. [Google Scholar] [CrossRef]
  9. Khan, J.A.; Pao, K.S. Fill removal with foam in horizontal well cleaning in coiled tubing. Res. J. App. Sci. Eng. Technol. 2013, 6, 2655–2661. [Google Scholar] [CrossRef]
  10. Bin Mohamad Noor, M.Z.; Chin, I.L.Y.; Irawan, S. Study of the transportation behavior of nanoparticles through low-porosity sand pack in the absence and presence of oil. J. Pet. Explor. Prod. Technol. 2019, 9, 2845–2851. [Google Scholar] [CrossRef]
  11. Epelle, E.I.; Obande, W.; Okolie, J.A.; Wilberforce, T.; Gerogiorgis, D.I. CFD modelling and simulation of drill cuttings transport efficiency in annular bends: Effect of particle size polydispersity. J. Pet. Sci. Eng. 2022, 208, 109795. [Google Scholar] [CrossRef]
  12. Epelle, E.I.; Gerogiorgis, D.I. Drill cuttings transport and deposition in complex annular geometries of deviated oil and gas wells: A multiphase flow analysis of positional variability. Chem. Eng. Res. Des. 2019, 151, 214–230. [Google Scholar] [CrossRef]
  13. Busch, A.; Johansen, S.T. Cuttings transport: On the effect of drill pipe rotation and lateral motion on the cuttings bed. J. Pet. Sci. Eng. 2020, 191, 107136. [Google Scholar] [CrossRef]
  14. Barooah, A.; Khan, M.S.; Khaled, M.; Rahman, M.A. Investigation of cutting transport in horizontal/deviated annulus using visualization and pressure drop techniques for two-phase slurry flow. J. Nat. Gas Sci. Eng. 2021, 100, 104460. [Google Scholar] [CrossRef]
  15. Huque, M.M.; Rahman, M.A.; Zendehboudi, S.; Butt, S.; Imtiaz, S. Investigation of cuttings transport in a horizontal well with high-speed visualization and electrical resistance tomography technique. J. Nat. Gas Sci. Eng. 2021, 92, 103968. [Google Scholar] [CrossRef]
  16. Oezkaya, E.; Baumann, A.; Eberhard, P.; Biermann, D. Analysis of the cutting fluid behavior with a modified micro single-lip deep hole drilling tool. CIRP J. Manuf. Sci. Technol. 2022, 38, 93–104. [Google Scholar] [CrossRef]
  17. Moraveji, M.K.; Sabah, M.; Shahryari, A.; Ghaffarkhah, A. Investigation of drill pipe rotation effect on cutting transport with aerated mud using CFD approach. Adv. Powder Technol. 2017, 28, 1141–1153. [Google Scholar] [CrossRef]
  18. Pang, B.; Wang, S.; Jiang, X.; Lu, H. Effect of orbital motion of drill pipe on the transport of non-Newtonian fluid-cuttings mixture in horizontal drilling annulus. J. Pet. Sci. Eng. 2018, 174, 201–215. [Google Scholar] [CrossRef]
  19. Erge, O.; van Oort, E. Modeling the effects of drillstring eccentricity, pipe rotation and annular blockage on cuttings transport in deviated wells. J. Nat. Gas Sci. Eng. 2020, 79, 103221. [Google Scholar] [CrossRef]
  20. Epelle, E.I.; Gerogiorgis, D.I. CFD modelling and simulation of drill cuttings transport efficiency in annular bends: Effect of particle sphericity. J. Pet. Sci. Eng. 2018, 170, 992–1004. [Google Scholar] [CrossRef]
  21. Pang, B.; Wang, S.; Wang, Q.; Yang, K.; Lu, H.; Hassan, M.; Jiang, X. Numerical prediction of cuttings transport behavior in well drilling using kinetic theory of granular flow. J. Pet. Sci. Eng. 2018, 161, 190–203. [Google Scholar] [CrossRef]
  22. GhasemiKafrudi, E.; Hashemabadi, S.H. Numerical study on cuttings transport in vertical wells with eccentric drillpipe. J. Pet. Sci. Eng. 2016, 140, 85–96. [Google Scholar] [CrossRef]
  23. Manjula, E.V.P.J.; Ariyaratne, W.K.H.; Ratnayake, C.; Melaaen, M.C. A review of CFD modelling studies on pneumatic conveying and challenges in modelling offshore drill cuttings transport. Powder Technol. 2017, 305, 782–793. [Google Scholar] [CrossRef]
  24. Vaziri, E.; Simjoo, M.; Chahardowli, M. Application of foam as drilling fluid for cuttings transport in horizontal and inclined wells: A numerical study using computational fluid dynamics. J. Pet. Sci. Eng. 2019, 194, 107325. [Google Scholar] [CrossRef]
  25. Ferroudji, H.; Rahman, M.A.; Hadjadj, A.; Ofei, T.N.; Khaled, M.S.; Rushd, S.; Gajbhiye, R.N. 3D numerical and experimental modelling of multiphase flow through an annular geometry applied for cuttings transport. Int. J. Multiph. Flow 2022, 151, 104044. [Google Scholar] [CrossRef]
  26. Awad, A.M.; Hussein, I.A.; Nasser, M.S.; Ghani, S.A.; Mahgoub, A.O. A CFD- RSM study of cuttings transport in non-Newtonian drilling fluids: Impact of operational parameters. J. Pet. Sci. Eng. 2022, 208, 109613. [Google Scholar] [CrossRef]
  27. Wang, G.; Dong, M.; Wang, Z.; Ren, T.; Xu, S. Removing cuttings from inclined and horizontal wells: Numerical analysis of the required drilling fluid rheology and flow rate. J. Nat. Gas Sci. Eng. 2022, 102, 104544. [Google Scholar] [CrossRef]
  28. Wang, S.; Wang, Y.; Wang, R.; Yuan, Z.; Chen, Y.; Shao, B.; Ma, Y. Simulation study on cutting transport in a horizontal well with hydraulic pulsed jet technology. J. Pet. Sci. Eng. 2021, 196, 107745. [Google Scholar] [CrossRef]
  29. Rooki, R.; Ardejani, F.D.; Moradzadeh, A.; Norouzi, M. CFD Simulation of Rheological Model Effect on Cuttings Transport. J. Dispers. Sci. Technol. 2015, 36, 402–410. [Google Scholar] [CrossRef]
  30. Chen, Y.; Zhang, H.; Li, J.; Zhou, Y.; Lu, Z.; Ouyang, Y.; Tan, T.; Liu, K.; Wang, X.; Zhang, G. Simulation study on cuttings transport of the wavy wellbore trajectory in the long horizontal wellbore. J. Pet. Sci. Eng. 2022, 215, 110584. [Google Scholar] [CrossRef]
  31. Ofei, T.N.; Irawan, S.; Pao, W. CFD Method for Predicting Annular Pressure Losses and Cuttings Concentration in Eccentric Horizontal Wells. J. Pet. Eng. 2014, 2014, 1–16. [Google Scholar] [CrossRef] [Green Version]
  32. Martyushev, D.A.; Govindarajan, S.K. Development and study of a visco-elastic gel with controlled destruction times for killing oil wells. J. King Saud Univ. Eng. Sci. 2022, 34, 408–415. [Google Scholar] [CrossRef]
  33. Ponomareva, I.N.; Galkin, V.I.; Martyushev, D.A. Operational method for determining bottom hole pressure in mechanized oil producing wells, based on the application of multivariate regression analysis. Pet. Res. 2021, 6, 351–360. [Google Scholar] [CrossRef]
  34. Elkatatny, S. Enhancing the stability of invert emulsion drilling fluid for drilling in high-pressure high-temperature conditions. Energies 2018, 11, 2393. [Google Scholar] [CrossRef] [Green Version]
  35. Murtaza, M.; Alarifi, S.A.; Kamal, M.S.; Onaizi, S.A.; Al-Ajmi, M.; Mahmoud, M. Experimental investigation of the rheological behavior of an oil-based drilling fluid with rheology modifier and oil wetter additives. Molecules 2021, 26, 4877. [Google Scholar] [CrossRef] [PubMed]
  36. Plastic Viscosity|Energy Glossary. Available online: https://glossary.slb.com/en/terms/p/plastic_viscosity (accessed on 10 July 2022).
  37. Mahto, V.; Sharma, V.P. Rheological study of a water-based oil well drilling fluid. J. Pet. Sci. Eng. 2004, 45, 123–128. [Google Scholar] [CrossRef]
  38. Okon, A.N.; Agwu, O.E.; Udoh, F.D. Evaluation of the cuttings carrying capacity of a formulated synthetic-based drilling mud. In Proceedings of the Society of Petroleum Engineers—SPE Nigeria Annual International Conference and Exhibition, NAICE, Lagos, Nigeria, 4–6 August 2015. [Google Scholar] [CrossRef]
  39. Pang, B.; Wang, S.; Lu, C.; Cai, W.; Jiang, X.; Lu, H. Investigation of cuttings transport in directional and horizontal drilling wellbores injected with pulsed drilling fluid using CFD approach. Tunn. Undergr. Space Technol. 2019, 90, 183–193. [Google Scholar] [CrossRef]
  40. API-13I. Recommended Practice for Laboratory Testing Drilling Fluids; American Petroleum Institute: Washington, DC, USA, 2018; Volume 2008, Available online: https://www.techstreet.com/standards/api-rp-13i-r2016?product_id=1613565 (accessed on 3 September 2022).
  41. Jahari, A.F.; Shafian, S.R.M.; Husin, H.; Razali, N.; Irawan, S. Quantification method of suspended solids in micromodel using image analysis. J. Pet. Explor. Prod. 2021, 11, 2271–2286. [Google Scholar] [CrossRef]
  42. Epelle, E.I.; Gerogiorgis, D.I. Transient and steady state analysis of drill cuttings transport phenomena under turbulent conditions. Chem. Eng. Res. Des. 2018, 131, 520–544. [Google Scholar] [CrossRef]
  43. Wayo, D.D.K.; Irawan, S.; Khan, J.A.; Fitrianti, F. CFD Validation for Assessing the Repercussions of Filter Cake Breakers; EDTA and SiO2 on Filter Cake Return Permeability. Appl. Artif. Intell. 2022, 36, 3099. [Google Scholar] [CrossRef]
  44. Foued, B.; Vamegh, R. Simulation of settling velocity and motion of particles in drilling operation. J. Pet. Sci. Eng. 2021, 196, 107971. [Google Scholar] [CrossRef]
  45. Ouchene, R.; Khalij, M.; Tanière, A.; Arcen, B. Drag, lift and torque coefficients for ellipsoidal particles: From low to moderate particle Reynolds numbers. Comput. Fluids 2015, 113, 53–64. [Google Scholar] [CrossRef]
  46. Gerhardter, H.; Prieler, R.; Mayr, B.; Knoll, M.; Mühlböck, M.; Tomazic, P.; Hochenauer, C. Evaluation of drag models for particles and powders with non-uniform size and shape. Powder Technol. 2018, 330, 152–163. [Google Scholar] [CrossRef]
  47. Chhabra, R.P.; Agarwal, L.; Sinha, N.K. Drag on non-spherical particles: An evaluation of available methods. Powder Technol. 1999, 101, 288–295. [Google Scholar] [CrossRef]
  48. Richardson, J.F. This Week’s Citation Classic NUMBER FEBRUARY 12. Sedimentation and Fluidisation. Richardson J F & Zaki W N. Part 1. Trans. Inst. Chem. Eng. 1979, 32, 35–53. Available online: http://garfield.library.upenn.edu/classics1979/A1979HZ20300001.pdf (accessed on 10 September 2022).
  49. Gera, D.; Gautam, M.; Tsuji, Y.; Kawaguchi, T.; Tanaka, T. Computer simulation of bubbles in large-particle fluidized beds. Powder Technol. 1998, 98, 38–47. [Google Scholar] [CrossRef]
  50. Wen, C.Y. Mechanics of fluidization. In The Chemical Engineering Progress Symposium Series; AIChE Chemical: New York, NY, USA, 1966; Volume 62, pp. 100–111. [Google Scholar]
  51. Gidaspow, D.; Bezburuah, R.; Ding, J. Hydrodynamics of Circulating Fluidized Beds: Kinetic Theory Approach; Illinois Institute of Technology Department of Chemical: Chicago, IL, USA, 1991. [Google Scholar]
  52. Shynybayeva, A. Eulerian–Eulerian Modeling of Multiphase Flow in Horizontal Annuli: Current Limitations and Challenges. Processes 2020, 8, 1426. [Google Scholar] [CrossRef]
  53. Duru, U.I.; Kerunwa, A.; Omeokwe, I.; Uwaezuoke, N.; Obah, B. Suitability of Some Nigerian Barites in Drilling Fluid Formulations. Pet. Sci. Eng. 2019, 3, 46. [Google Scholar] [CrossRef]
  54. Sauki, A.; Khamaruddin, P.N.F.M.; Irawan, S.; Kinif, I.; Ridha, S. Statistical relationship of drilled solid concentration on drilling mud rheology. J. Adv. Res. Fluid Mech. Therm. Sci. 2020, 69, 122–136. [Google Scholar] [CrossRef]
  55. Onugha, I.; Igwilo, K.; Duru, U.I. Reduction in annular pressure loss by mud rheology control—A means of mud pump pressure optimization, a case study of a Niger delta well. J. Basic App. Res. Int. 2019, 16, 172–183. [Google Scholar]
  56. Irawan, S.; Kinif, I.B. Solid Control System for Maximizing Drilling. Drilling 2018, 1, 192. [Google Scholar] [CrossRef]
  57. Minakov, A.V.; Zhigarev, V.A.; Mikhienkova, E.I.; Neverov, A.L.; Buryukin, F.A.; Guzei, D.V. The effect of nanoparticles additives in the drilling fluid on pressure loss and cutting transport efficiency in the vertical boreholes. J. Pet. Sci. Eng. 2018, 171, 1149–1158. [Google Scholar] [CrossRef] [Green Version]
  58. Erge, O.; van Oort, E. Time-dependent cuttings transport modeling considering the effects of eccentricity, rotation and partial blockage in wellbore annuli. J. Nat. Gas Sci. Eng. 2020, 82, 103488. [Google Scholar] [CrossRef]
  59. Biyanto, T.R.; Cordova, H.; Matradji; Anggrea, T.O.; Suryowicaksono, H.; Irawan, S. Stuck pipe optimization using duellist algorithm. In Proceedings of the The 3rd International Conference on Food and Agriculture, Jember, East Java, Indonesia, 7–8 November 2020; Volume 672. [Google Scholar] [CrossRef]
  60. Irawan, S.; Khaleeda, S.; Shakeel, M.; Fathaddin, M.T. Maximizing well productivity by using filter cake breaker for synthetic-based mud drill-in fluid (SBMDIF) system. Upstream Oil Gas Technol. 2021, 9, 100075. [Google Scholar] [CrossRef]
  61. Irawan, S.; Kinif, B.I.; Bayuaji, R. Maximizing drilling performance through enhanced solid control system. In Proceedings of the International Conference of Applied Science and Technology for Infrastructure Engineering, Surabaya, East Java, Indonesia, 5 August 2017; Volume 267. [Google Scholar] [CrossRef]
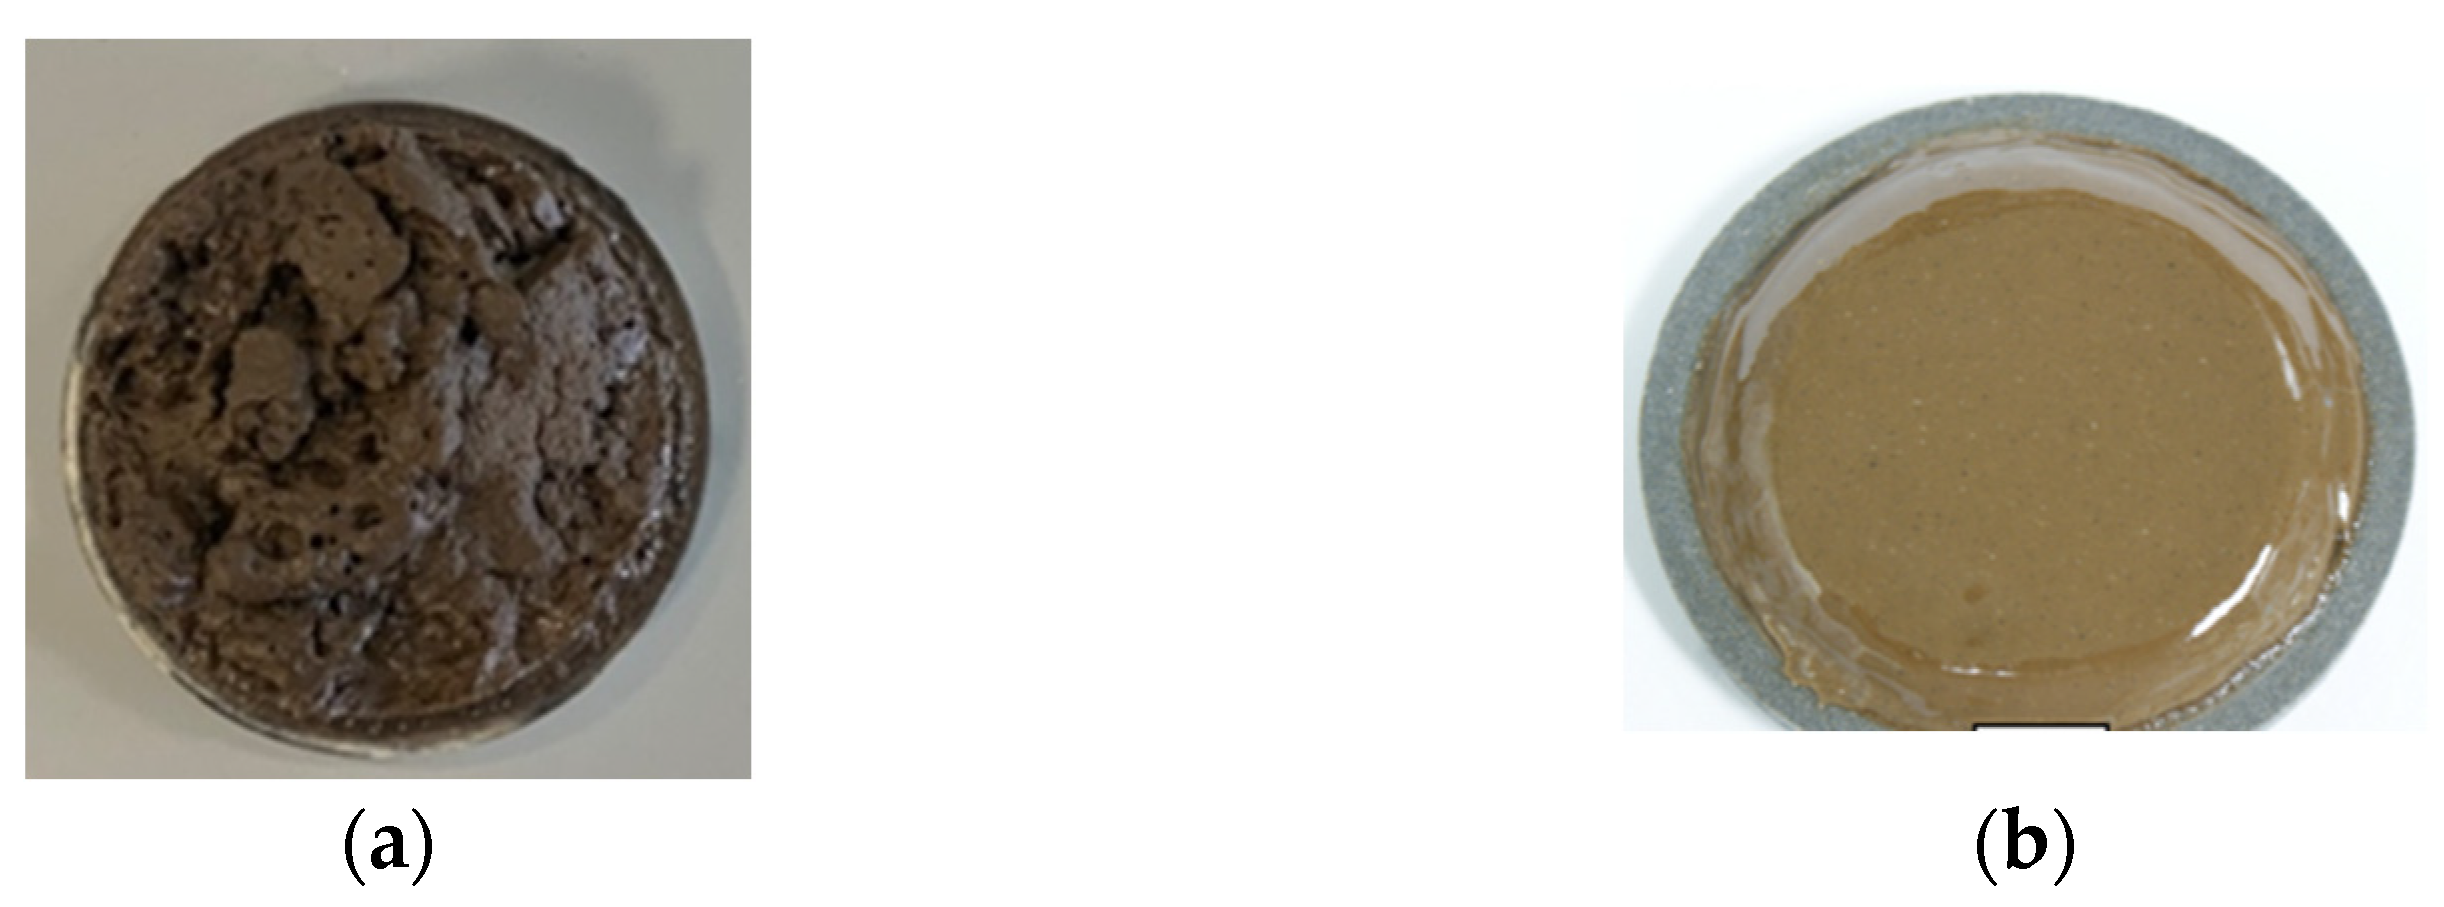
Figure 1. Images of drill-in fluids formulated from (a) synthetic-based mud, and (b) oil-based mud.
Symmetry 14 02300 g001
Figure 2. EE–CFDs Algorithm adapted with permission from Ref. [42], 2018, Epelle, E.I.
Symmetry 14 02300 g002
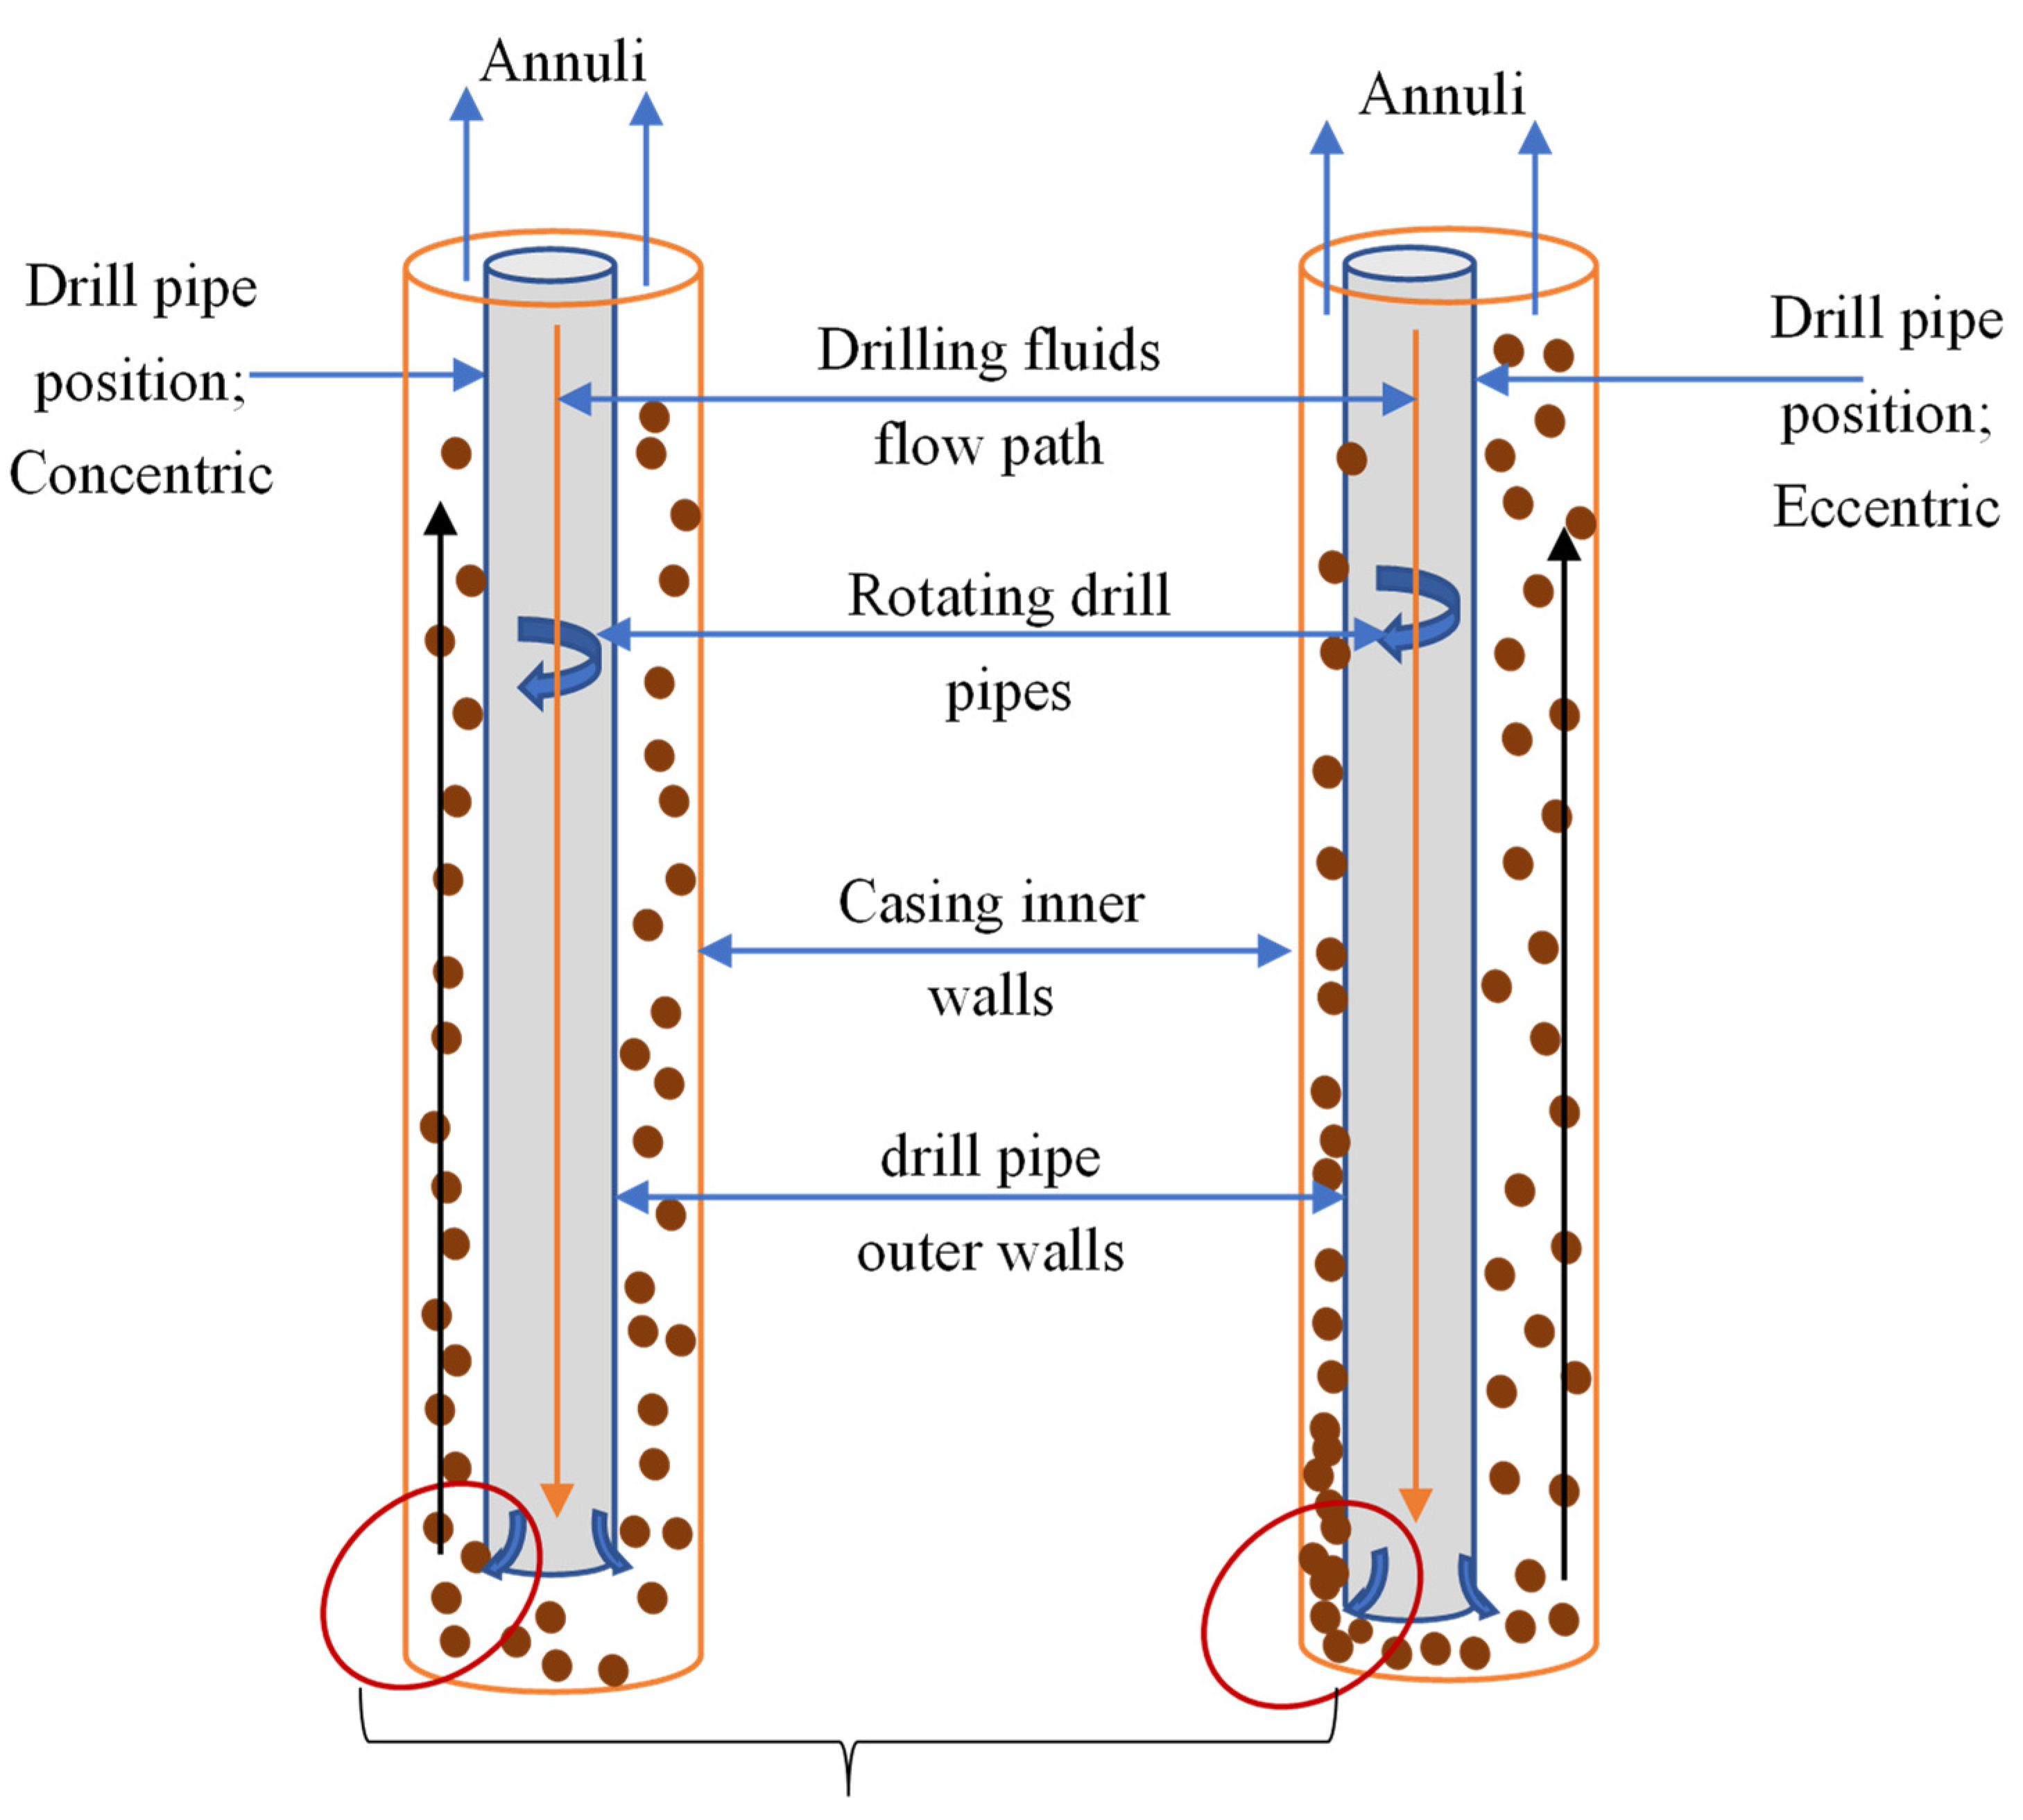
Figure 3. Particles from cuttings and mud, drag, collide and lift at two different drill positions.
Symmetry 14 02300 g003
Figure 4. Particles in turbulence enhance the safe transport of cuttings in a horizontal eccentric position adapted with permission from Ref. [42], 2018, Epelle, E.I.
Symmetry 14 02300 g004
Figure 5. An adapted outlook of (a) eccentric and (b) concentric annuli adapted with permission from Ref. [29]. 2015, Rooki, R.
Symmetry 14 02300 g005
Figure 6. (a) Grid and (b) Boundary.
Symmetry 14 02300 g006
Figure 7. Effects of CTR on different Models.
Symmetry 14 02300 g007
Figure 8. Particles (mud and cuttings) in turbulence; (a) synthetic-based mud, (b) oil-based mud.
Symmetry 14 02300 g008
Figure 9. Velocity Profiles of (a) synthetic-based mud, (b) oil-based mud.
Symmetry 14 02300 g009
Figure 10. (ad) Slip velocity profiling at different drill pipe rotations, adapted with permission from Ref. [42]. 2018, Epelle, E.I.
Symmetry 14 02300 g010
Figure 11. Streamlines at an eccentric position with RPM ≥ 80 adapted with permission from Ref. [42]. 2018, Epelle, E.I.
Symmetry 14 02300 g011
Table 1. Effect of YP/PV on safe transport.
AuthorYield Point (YP)Plastic Viscosity (PV)Transport Index (TI)Average TIMud Type
Wayo’s Experiment [6]136.497.01.4061.413Synthetic-Based
133.493.81.422
135.395.91.411
Okon’s Experiment [38]1061.6671.005Synthetic-Based
13170.765
14240.583
Murtaza’s Experiment [35]24.60181.3671.166Oil-based
39.4837.11.064
43.9141.11.068
Table 2. CFD Parameters for Simulation.
Parameters for Computation
Synthetic-Based MudOil-Based Mud
Geometry
Drill pipe outer wall y m i n , y m a x (mm)0, 10, 1
Casing inner wall, y m i n , y m a x (mm)0, 10, 1
Annulus inlet/outlet, x m i n , x m a x (mm)0, 10, 1
Computational distance (Drill pipe & Casing) (mm)0.5, 0.70.5, 0.7
Drill pipe eccentricity0.5, 0.70.5, 0.7
Rheology
Fluid density ρ (kg/m3)14,382 14,200
Yield point (YP) (lbf/100 ft2) 136.4, 133.4, 135.324.60, 39.48, 43.91
Plastic viscosity (PV) (lbf/100 ft2)97.0, 93.8, 95.918, 37.1, 41.1
Transport index 1.406, 1.422, 1.4111.367, 1.064, 1.068
Particles
Mud particle diameter d s (mm)0.2, 0.5, 10.2, 0.5, 1
Cuttings Particle diameter d s (mm)1, 3, 61, 3, 6
Cuttings diameter d s (mm)1.2, 3.5, 71.2, 3.5, 7
Cuttings density (kg/m3)20002000
Other Variables
Mud-Nozzle inlet velocity, u (m·s−1)0, 10, 500, 10, 50
Cuttings velocity, v (m·s−1)50, 6050, 60
Pressure (psi)100, 80100, 80
Pipe rotation (RPM)8080
Publisher’s Note: MDPI stays neutral with regard to jurisdictional claims in published maps and institutional affiliations.