Abstract
In this paper, the moment inequalities for some aging distributions are derived based on a mathematical class entitled “a new better than renewal used in Laplace transform order in increasing convex order class (NBRULC)”. The introduced inequalities can be utilized as a new mathematical test for the exponentiality property versus NBRULC. If the mean life is finitely based on these inequalities, then all higher-order moments exist. Pitman’s asymptotic efficiency of the new mathematical test is derived and studied in detail for some asymmetric probability models. The new mathematical test’s power is estimated in reliability studies for a few well-known alternative asymmetric models. The problem in the case of right-censored data is also handled. After that, applying the suggested test to practical issues is demonstrated using asymmetric, real datasets.
1. Introduction
For more than three decades, aging theories have been the focus of research and have been crucial to reliability theory. Age-related improvements or declines in a population of units or systems are described by concepts of aging. We look at some statistical characteristics and probability distributions before looking at various classes of aging-related life distributions. Gaining greater efficiency is the major goal of creating new tests. Many authors used moment inequalities to compare certain classes of life distributions; Ahmad [1] studied the tests of exponentiality against increasing failure rate (IFR), new better than used (NBU), and new better than used in expectation (NBUE). Ahmad and Mugdadi [2] developed the tests of new better than used convex ordering (NBUC), increasing failure rate average (IFRA), and decreasing mean residual life (DMRL), while Mahmoud et al. [3,4] studied the tests of new better than renewal used in Laplace transform order (NBRUL) and new renewal better than used in Laplace transform order (NRBUL). El-Arishy et al. [5] created a test statistic to compare the exponentiality to the class renewal new better than used in moment generating function (RNBU) using the moment inequalities of this class. Further, the new better than renewal used in moment generating function order (NBRU), used better than aged in convex ordering (UBAC), and overall decreasing life (ODL) classes have been studied by Hassan and Said [6], Abu-Youssef [7], and Diab and El-Atfy [8].
The main classes of life distributions that have been introduced in the literature are based on NBU, NBUC, new better than used convex ordering moment generation function (NBUC), new better than used in increasing convex in Laplace transform order (NBUCL), exponential better than equilibrium life in convex (EBELC), new better than used in the increasing convex average order (NBUCA), new better than renewal used (NBRU), and new better than renewal used in Laplace transform order at age t (NBRUL-t). Numerous academics have advocated comparing some kinds of classes of life distributions with testing the exponentiality from various angles. For more details, one can refer to Kumazawa [9], Cao and Wang [10], Abu-Youssef et al. [11], Mahmoud et al. [12], Mahmoud et al. [13], Al-Gashgari et al. [14], Abouammoh et al. [15], EL-Sagheer et al. [16], Bryson and Siddiqui [17], and Barlow and Proschan [18].
The paper is set up as follows: We provide some definitions for NBRU, NBRUL, and NBRULC classes of life distributions in the remainder of this section. In Section 2, the moment inequalities for the NRBULC class are obtained. In Section 3, testing the exponentiality versus NRBULC is investigated. In Section 4, we obtained the Pitman asymptotic for some asymmetric distributions. Section 5 simulates the critical values and power estimates for Monte Carlo null distributions. Section 6 dealt with right-censored data and critical values. Finally, the use of the proposed test on some real asymmetric data is discussed in Section 7.
Definition 1.
Assume that X and Y are random variables with the cumulative distribution functions and , respectively, and the survival functions and . It is stated that X is smaller than Y in the following cases:
- (i)
- Usual stochastic order (), symbolized by if
- (ii)
- Increasing convex order (), symbolized by if
Definition 2.
A random variable X is said to be
- (i)
- New better than renewal used (), symbolized by , if
- (ii)
- New better than renewal used in Laplace transform order (), symbolized by , if
or
where and μ is the expected value of Now, depending on definitions (1) and (2), Etman et al. [19] introduced a new class named as follows
Definition 3.
The random variable X is said to be , if
where It is obvious that
2. Moment’s Inequalities
Theorem 1.
Suppose F is an NBRULC life distribution with finite moments and all moments existing, then for integers , we get
where
Proof.
Since is NBRULC, then
Making use of Equation (2), yields
Now, we can formulate the expression for the right-hand side of Equation (3) as follows
observe that
and
Thus,
The left side of Equation (3) can be formulated as
where
then
such as
Moreover, by making some mathematical simplifications, Equation (5) can be formulated as
From Equations (4) and (6), the theorem is proven. □
Remark 1.
When , Theorem 1 reduces to
where .
3. Testing Exponentiality vs. NBRULC Class
We may test that the null hypothesis is exponential versus is NBRULC and not exponential by using the inequality in Equation (7), where has been used as the following
Under m the value of whereas based on the value of . Let be a random sample from a distribution . The empirical estimate of can be obtained as
To make the test invariant, let where is the sample mean. Then,
It is simple to demonstrate Now, set
and define the symmetric kernel
where the summation is over all arrangements of and . Then, in Equation (9) is equivalent to the -statistic given by
The following theorem encapsulates the asymptotic normality of .
Theorem 2.
(i) As is asymptotically normal with a mean of 0 and a variance of where
(ii) Under the variance is
Proof.
As in Lee [20], based on the U-statistic theory,
Looking at Equation (10), it follows that it is easy to formulate the following expression
and
Therefore,
Under
□
4. Pitman Asymptotic Efficiency (PAE)
The PAEs are calculated and compared with various other tests for the following other option distributions to assess the effectiveness of this technique.
- (i)
- The WD,
- (ii)
- The LFRD,
- (iii)
- The MD,The PAE is defined bywhereHence,whereBased on PAE expression in Equation (14), we getAt , this leads toandTable 1 lists some computations for PAE that outperforms the other tests based on the PAEs.
 Table 1. The results of comparing the proposed test with previous tests based on PAE.
5. Critical Points
In this section, the upper percentile of for and are computed using Mathematica v.12 based on a generated sample size of . The empirical results are listed in Table 2 and Figure 1. From Table 2 and Figure 1, we note that the critical values are increasing as the confidence level increases. Further, the critical values decrease as the sample size n increases. In addition, when the significance level decreases, the critical value increases, which indicates the strength of the proposed test.
Table 2.
The upper percentile of with 10,000 iterations.
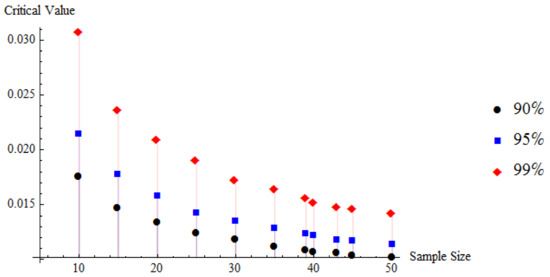
Figure 1.
Plot of the sample sizes with critical values.
The Power Estimates of Test
For some famous models, such as LFRD, WD, and GaD, based on 10,000 samples listed in Table 3, the power of will be calculated at the confidence level, where with adequate parameter values of 20, and 30. As we can see, has good power for all other choices.
Table 3.
Power estimates of .
6. Testing for Randomly Right-Censored Data
A test statistic is suggested to compare to with randomly right-censored data (RRCD). Such censored data are typically the only ones accessible in a life-testing model or clinical trial where patients may be lost before the study is finished. The following formal model applies to this experimental situation. Assume n items are tested, with designating each object’s actual lifetime. Let be a continuous, independent and identically distributed life distribution . Let be by a continuous, independent and identically distributed life distribution . In addition, we presume X’s and Y’s are independent. In the RRCD, we notice the pairs , where , and
Let denote the ordered Z’s and is corresponding to Using the censored data (, ),, Kaplan and Meier [24] proposed the product limit estimator,
Now, for testing versus we suggest the following test statistic based on RRCD
where . To simplify the computation, may be rewritten as
such that
and
In order to install the test, let
Table 4 shows the critical values’ percentiles for the test.
Table 4.
The upper percentile of at .
Using Mathematica v. 12, the critical values of the Monte Carlo null distribution at and 10,000 replications from ED are shown. The empirical results can be sketched in Figure 2. Table 4 and Figure 2 show that the critical values increase as the confidence level increases and decrease as the sample sizes increase.
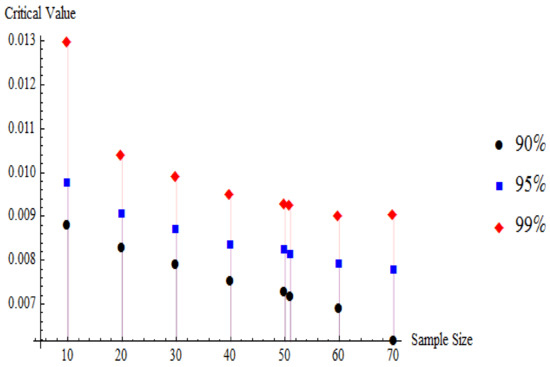
Figure 2.
Relationship between sample size and critical values.
The Power Estimates of the Test
With occasion parameter values of , and 30, our test’s power is evaluated at the significance level concerning three choices. The findings demonstrate that the power estimates of our test are good powers for all other options using Weibull, LFR, and gamma distributions based on 10,000 samples (see Table 5).
Table 5.
Power estimates of .
7. Real-Life Data Analysis
Here, we apply our test to a few real datasets with a confidence level for both censored and uncensored data.
7.1. Uncensored Data
Example 1.
Take a look at the data in Abouammoh et al. [15]. The data are an assortment of 43 patients with blood cancer (leukemia) from a ministry of health hospital in Saudi Arabia, the order values in years are:
| 0.315 | 0.496 | 0.699 | 1.145 | 1.208 | 1.263 | 1.414 | 2.025 | 2.036 | 2.162 |
| 2.211 | 2.370 | 2.532 | 2.693 | 2.805 | 2.910 | 2.912 | 3.192 | 3.263 | 3.348 |
| 3.348 | 3.427 | 3.499 | 3.534 | 3.718 | 3.751 | 3.858 | 3.986 | 4.049 | 4.244 |
| 4.323 | 4.323 | 4.381 | 4.392 | 4.397 | 4.647 | 4.753 | 4.929 | 4.973 | 5.074 |
| 5.203 | 5.274 | 5.384 |
is achieved, which is less than the similar critical value in Table 2. It is evident at the significance level . This indicates that the type of data does not match the NBRULC property.
Example 2.
Consider the Kotz and Johnson [25] dataset, which shows the survival periods (in years) following diagnosis for 43 patients with a specific kind of leukemia.
| 0.019 | 0.129 | 0.159 | 0.203 | 0.485 | 0.636 | 0.748 | 0.781 | 0.869 | 1.175 |
| 1.206 | 1.219 | 1.219 | 1.282 | 1.356 | 1.362 | 1.458 | 1.564 | 1.586 | 1.592 |
| 1.781 | 1.923 | 1.959 | 2.134 | 2.413 | 2.466 | 2.548 | 2.652 | 2.951 | 3.038 |
| 3.6 | 3.655 | 3.754 | 4.203 | 4.690 | 4.888 | 5.143 | 5.167 | 5.603 | 5.633 |
| 6.192 | 6.655 | 6.874 |
We get , which is less than the critical value in Table 2. Then, the null hypotheses are accepted, which shows that the dataset has exponential properties.
Example 3.
Consider the data in Mahmoud et al. [26]. This data represents 39 patients with liver cancer from the Elminia Cancer Center, according to the Ministry of Health in Egypt, who entered in (1999). The ordered lifetimes (in days) are
| 10 | 14 | 14 | 14 | 14 | 14 | 15 | 17 | 18 | 20 |
| 20 | 20 | 20 | 20 | 23 | 23 | 24 | 26 | 30 | 30 |
| 31 | 40 | 49 | 51 | 52 | 60 | 61 | 67 | 71 | 74 |
| 75 | 87 | 96 | 105 | 107 | 107 | 107 | 116 | 150 |
In this case, , which is less than the similar critical value in Table 2. It is evident at the significance level . This indicates that the type of data does not match the NBRULC property.
7.2. Censored Data
Example 4.
Consider the data in Susarla and Vanryzin [26]. These data represent the survival times of 82 patients with melanoma. Forty-six represent whole lifetimes (non-censored data), and the observed values are
| 13 | 14 | 19 | 19 | 20 | 21 | 23 | 23 | 25 | 26 | 26 | 27 |
| 27 | 31 | 32 | 34 | 34 | 37 | 38 | 38 | 40 | 46 | 50 | 53 |
| 54 | 57 | 58 | 59 | 60 | 65 | 65 | 66 | 70 | 85 | 90 | 98 |
| 102 | 103 | 110 | 118 | 124 | 130 | 136 | 138 | 141 | 234 | ||
The ordered censored observations are
| 16 | 21 | 44 | 50 | 55 | 67 | 73 | 76 | 80 | 81 | 86 | 93 |
| 100 | 108 | 114 | 120 | 124 | 125 | 129 | 130 | 132 | 134 | 140 | 147 |
| 148 | 151 | 152 | 152 | 158 | 181 | 190 | 193 | 194 | 213 | 215 |
Taking into account the whole set of survival data (both censored and uncensored), we get , which is less than the critical value from Table 4. Then, it is evident to reject at which states that the set of data has an NBRULC property.
Example 5.
Consider the data in Mahmoud et al. [27]. This data represents 51 patients with liver cancer from the Elminia Cancer Center, according to the Ministry of Health in Egypt, who entered in (1999). Out of these, 39 represent non-censored data, and the others represent censored data. The ordered lifetimes (in days) are
Non-censored data
| 10 | 14 | 14 | 14 | 14 | 14 | 15 | 17 | 18 | 20 |
| 20 | 20 | 20 | 20 | 23 | 23 | 24 | 26 | 30 | 30 |
| 31 | 40 | 49 | 51 | 52 | 60 | 61 | 67 | 71 | 74 |
| 75 | 87 | 96 | 105 | 107 | 107 | 107 | 116 | 150 |
Censored data
| 30 | 30 | 30 | 30 | 30 | 60 | 150 | 150 | 150 | 150 | 150 | 185 |
Considering the whole set of survival data (both censored and uncensored), it was found that , which is less than the critical value in Table 4. It is evident at the significance level . This indicates that the type of data does not match the NBRULC property.
8. Concluding Remarks
In this article, a new mathematical test for the exponentiality property has been established. Quality criteria of the new test have been discussed using Pitman asymptotic efficiency in the case of censored and non-censored data to show the test’s usefulness. It was found that the proposed test is more flexible compared to the other mathematical tools here. We have noticed that Pitman’s efficiency of our test is higher compared to the other tests, and this is illustrated by the comparison made in Table 1. In general, we can conclude that the introduced inequalities can be utilized as a new mathematical test for the exponentiality property versus NBRULC. These inequalities demonstrate that if the mean life is finite, then all higher-order moments exist.
Author Contributions
Conceptualization, M.S.E.; Data curation, M.E.-M., R.M.E.-S. and M.S.E.; Formal analysis, A.A.-B., B.A. and W.B.H.E.; Investigation, A.A.-B. and W.B.H.E.; Methodology, M.E.-M., R.M.E.-S., W.B.H.E. and M.S.E.; Project administration, B.A.; Resources, M.E.-M., R.M.E.-S. and M.S.E.; Software, M.E.-M.; Visualization, R.M.E.-S.; Writing—Original draft, A.A.-B. and W.B.H.E.; Writing—Review & editing, B.A. All authors have contributed to manuscript refinement, preparation, and revision. All authors have read and agreed to the published version of the manuscript.
Funding
This work was supported by the Deanship of Scientific Research, Qassim University, Saudi Arabia.
Institutional Review Board Statement
Not applicable.
Informed Consent Statement
Not applicable.
Data Availability Statement
The datasets are available in the paper.
Acknowledgments
The researchers would like to thank the Deanship of Scientific Research, Qassim University, for funding the publication of this project.
Conflicts of Interest
The authors declare no conflict of interest.
References
- Ahmad, I.A. Moments inequalities of aging families of distributions with hypothesis testing applications. J. Stat. Plan. Inference 2001, 92, 121–132. [Google Scholar] [CrossRef]
- Ahmad, I.A.; Mugdadi, A.R. Further moments inequalities of life distributions with hypothesis testing applications: The IFRA, NBUC, DMRL classes. J. Stat. Plan. Inference 2004, 120, 1–12. [Google Scholar] [CrossRef]
- Mahmoud, M.A.W.; EL-Sagheer, R.M.; Etman, W.B.H. Moments inequalities for NBRUL distributions with hypotheses testing applications. Austrian J. Stat. 2018, 47, 95–104. [Google Scholar]
- Mahmoud, M.A.W.; Hassan, E.M.A.; Gadallah, A.M. On NRBUL class of life distributions. J. Egypt. Math. 2018, 26, 489–496. [Google Scholar] [CrossRef]
- El-Arishy, S.M.; Diab, L.S.; El-Atfy, E.S. Characterizations and testing hypotheses for RNBUmgf class of life distributions. J. Stat. Adv. Theory Appl. 2019, 21, 71–89. [Google Scholar] [CrossRef]
- Hassan, E.M.A.; Said, M.M. A new class of life distributions based on moment inequalities. Asian J. Probab. Stat. 2021, 13, 47–57. [Google Scholar] [CrossRef]
- Abu-Youssef, S.E. On properties of UBAC class of life distributions. J. Adv. Math. 2015, 10, 3340–3348. [Google Scholar]
- Diab, L.S.; El-Atfy, E.S. A moment inequality for overall decreasing life class of life distributions with hypotheses testing applications. Int. J. Math. Stat. (IJMSI) 2017, 5, 62–71. [Google Scholar]
- Kumazawa, Y. A class of tests statistics for testing whether new is better than used. Commun. Stat. Theory Methods 1983, 12, 311–321. [Google Scholar] [CrossRef]
- Cao, J.; Wang, Y. The NBUC and NWUC classes of life distributions. J. Appl. Probab. 1991, 28, 473–479. [Google Scholar] [CrossRef]
- Abu-Youssef, S.E.; Gerges, S.T. Based on the goodness of fit approach, a new test statistics for testing NBUCmgf class of life distributions. Pak. J. Stat. 2022, 38, 129–144. [Google Scholar]
- Mahmoud, M.A.W.; Diab, L.S.; Radi, D.M. A nonparametric test for testing NBUCL class of life distributions with applications. Iosr J. Math. 2019, 15, 15–21. [Google Scholar]
- Mahmoud, M.A.W.; Diab, L.S.; Radi, D.M. Testing exponentiality against exponential better than equilibrium life in convex based on Laplace transformation. Int. J. Comput. 2018, 182, 6–10. [Google Scholar]
- Al-Gashgari, F.H.; Shawky, A.I.; Mahmoud, M.A.W. A nonparametric test for testing exponentiality against NBUCA class of life distributions based on Laplace transform. Qual. Reliab. Int. 2016, 32, 29–36. [Google Scholar] [CrossRef]
- Abouammoh, A.M.; Abdulghani, S.A.; Qamber, I.S. On partial orderings and testing of new better than renewal used classes. Reliab. Eng. Syst. Saf. 1994, 43, 37–41. [Google Scholar] [CrossRef]
- EL-Sagheer, R.M.; Mahmoud, M.A.W.; Etman, W.B.H. Characterizations and testing hypotheses for NBRUL-t0 class of life distributions. J. Stat. Theory Pract. 2022, 16, 31. [Google Scholar] [CrossRef]
- Bryson, M.C.; Siddiqui, M.M. Some criteria for ageing. J. Am. Stat. Assoc. 1969, 64, 1472–1483. [Google Scholar] [CrossRef]
- Barlow, R.E.; Proschan, F. Statistical Theory of Reliability and Life Testing; To Begin With: Silver Spring, MD, USA, 1981. [Google Scholar]
- Etman, W.B.H.; EL-Sagheer, R.M.; Abu-Youssef, S.E.; Sadek, A. On some characterizations to NBRULC class with hypotheses testing application. Appl. Math. Inf. Sci. 2022, 16, 139–148. [Google Scholar]
- Lee, A.J. U-Statistics; Marcel Dekker: New York, NY, USA, 1989. [Google Scholar]
- Kango, A.I. Testing for new is better than used. Commun. Stat. Theory Methods 1993, 12, 311–321. [Google Scholar]
- Mugdadi, A.R.; Ahmad, I.A. Moment inequalities derived from comparing life with its equilibrium form. J. Stat. Plan. Inference 2005, 134, 303–317. [Google Scholar] [CrossRef]
- Mahmoud, M.A.W.; Abdul Alim, N.A. A goodness of fit approach to for testing NBUFR (NWUFR) and NBAFR (NWAFR) properties. Int. J. Reliab. Appl. 2008, 9, 125–140. [Google Scholar]
- Kaplan, E.L.; Meier, P. Nonparametric estimation from incomplete observation. J. Am. Stat. 1958, 53, 457–481. [Google Scholar] [CrossRef]
- Kotz, S.; Johnson, N.L. Encyclopedia of Statistical Sciences; Wiley: New York, NY, USA, 1983. [Google Scholar]
- Susarla, V.; Van Ryzin, J. Empirical Bayes estimation of a distribution (survival) function from right-censored observations. Ann. Stat. 1978, 6, 740–754. [Google Scholar] [CrossRef]
- Mahmoud, M.A.W.; Attia, F.A.; Taib, I.B. Test for exponential better than used in average based on the total time on test transform. In Proceedings of the 17th Annual Conference on Statistics, Modelling in Human and Social Science, Cairo, Egypt, 29–30 March 2005; Faculty of Economics and Political Science, Cairo University: Cairo, Egypt, 2005. [Google Scholar]


Publisher’s Note: MDPI stays neutral with regard to jurisdictional claims in published maps and institutional affiliations. |
© 2022 by the authors. Licensee MDPI, Basel, Switzerland. This article is an open access article distributed under the terms and conditions of the Creative Commons Attribution (CC BY) license (https://creativecommons.org/licenses/by/4.0/).