Article

Characterization of Microstructure of Crept Nb and Ta-Rich γ-TiAl Alloys by Automated Crystal Orientation Mapping and Electron Back Scatter Diffraction

1
Electron Microscopy Group, Defence Metallurgical Research Laboratory, Kanchanbagh, Hyderabad 500058, India
2
Rolling & Formability Group, Defence Metallurgical Research Laboratory, Kanchanbagh, Hyderabad 500058, India
3
Mechanical Behavior Group, Defence Metallurgical Research Laboratory, Kanchanbagh, Hyderabad 500058, India
*
Author to whom correspondence should be addressed.
Symmetry 2022, 14(2), 399; https://doi.org/10.3390/sym14020399
Submission received: 26 November 2021 / Revised: 17 January 2022 / Accepted: 10 February 2022 / Published: 17 February 2022
(This article belongs to the Special Issue Electron Diffraction and Structural Imaging)

Abstract

:
Understanding of the creep behavior Nb and Ta-rich γ-TiAl alloys plays a crucial role towards realization of their potential applications. The present article reports the evolution of microstructural features in the crept γ-TiAl-based Ti-5Al-8Nb-2Cr-0.2B and Ti-45Al-8Ta-0.2C-0.2B-0.2C alloys. Structural characterizations have been carried out using automated crystal orientation mapping (ACOM) along with precession electron diffraction (PED) in a transmission electron microscope, in conjunction with electron back-scattered diffraction (EBSD) in a scanning electron microscope (SEM) and transmission electron microscopy (TEM). Creep behavior of the fourth generation γ-TiAl-based alloys has been comparatively investigated under constant load tensile creep tests performed in the temperature range from 800–850 °C and applied stresses range of 125–200 MPa. It has been demonstrated that the ACOM with PED technique has accurate and reliable diffraction pattern recognition and higher spatial resolution, and supplements effectively the conventional EBSD technique for characterization of complex microstructural features evolved during creep of multiphase (γ + α2 + β)-based TiAl alloys. The results show that the Nb and Ta additions have distinctly different effects on the microstructural instability and phase transformation during the creep deformation. The formation of the Ta-rich intermetallic phase (Ti4Al3Ta, the so-called τ phase) has been detected preferentially along the colony and the γ-α2 interphase boundaries in the Ta-rich alloy, whilst its isomorph, Ti4Al3Nb intermetallic, has hardly been detected in the Nb-rich alloy. Implications of τ-phase formation and related microstructural instabilities have been discussed with respect to the creep behavior of the two alloys.

1. Introduction

γ-TiAl based alloys have the potential to replace the existing high-temperature materials used in the structural application of gas turbine and automotive industries. The alloying addition to the γ-TiAl alloys significantly modifies the microstructure in terms of single-phase, two-phase, or multiphase combinations, which further control the high-temperature mechanical properties such as creep. Typically, solidification of γ-TiAl alloys in the composition range of Ti-(40–50 at %) Al results in a near or fully lamellar microstructure which can be further modified to duplex and equiaxed types by heat treatment and thermo-mechanical processing [1]. Systematic research on alloy design has shown that the lamellar microstructure exhibits better creep resistance as compared to other morphologies. However, the structural instability in terms of the microstructural coarsening and spheroidization do occur in fully lamellar structure especially when exposed to high temperature for a long time. Microstructure coarsening is caused via the diffusion mechanism [2,3]. In addition, long heat treatment also activates precipitation and phase transformation which either improves or deteriorates the creep resistance. To improve the creep resistance and structural stability of γ-TiAl based alloys for aerospace and automotive applications, the alloys are required to be modified by the addition of alloying elements such as Nb, Ta in the range of (5–10 at %) and Cr, Mo, and V (2–4 at %) and B, C (0.1–0.2 at %) which reduce the diffusion rate, provide solid solution hardening, and refine the microstructure [1,4]. In recent years, investigations have been reoriented toward Nb-based and Ta-based γ-TiAl alloys, the so-called third-generation, and fourth-generation alloys. These alloys show improvement in mechanical strength and creep resistance. Furthermore, Nb and Ta additions to TiAl alloys increase the oxidation resistance significantly and reduce the stacking fault energy [5,6]. In recent studies, Ti–-45Al-8Nb single crystal (poly-synthetically twinned) and Ti-46Al-8Ta (at %) air-hardenable alloy show superior creep resistance properties, but poor hot workability limits their application potentials [7,8]. This limitation can be overcome by introducing a novel alloy design concept called the “β-solidification route” [9,10]. The β-solidifying alloys contain either high Nb or Ta element along with β-stabilizers (such as Mo, W, Cr, Mn, etc.), and B and/or C as refiners. However, the retained β(B2) phase also has a deleterious effect on creep resistance when present in high volume fractions in γ-TiAl based alloys [11]. From the foregoing discussion it is amply clear that understanding the role of microstructural constituents and their stability play a crucial role in controlling the creep behavior. The present study aims to characterize the microstructural evolution and stability during the creep deformation of the β(B2)-stabilized Ti-45Al-8Nb-2Cr-0.2B and Ti-45Al-8Ta-2Cr-0.2B-0.2C alloys.

2. Materials and Methods

Gamma TiAl alloys having nominal compositions of Ti-45Al-8Nb-2Cr-0.2B and Ti-45Al-8Ta-2Cr-0.2B-0.2C (at %) were fabricated in vacuum arc furnace in the form of pancake. The carbon was avoided in high-Nb alloy, as carbon addition leads to the formation of Ti3AlC or Ti2AlC phases in these alloys, which causes brittleness in the alloy system and deteriorates the workability, as reported by Gabrisch et al. [12]. Contrarily, the formation of the carbide phases in high-Ta alloy has still not been verified. Creep behavior was evaluated on the as-cast condition in the temperature range of 800–850 °C at stresses ranging from 150 to 200 MPa. Compression creep tests were carried out under constant load conditions in air using STAR creep test Systems having a lever ratio of 1:20 using parallelepiped samples of 10 (L) × 5 (w) × 5 (t) mm.
The microstructural evaluation of the cast alloy was carried out in pre- and post-creep tested specimens by Field Emission Scanning Electron Microscope (FESEM, model: Supra 55 and Cross Beam 350), Energy Dispersive X-ray spectroscopy (EDS), and Electron Backscatter Diffraction (EBSD) Oxford make in FEG SEM Carl Zeiss make. XRD analysis was done by using a diffractometer equipped with an X-ray tube with a rotating Cu anode at 12 kW. EBSD samples were prepared using standard metallographic methods and final polishing was done in a Buehler vibratory polisher for 12 h. The acquisition of orientation data has been done with an Oxford Nordlys detector and analyses have been carried out using TSL 8.0 software. The raw data have been further processed by removing the pseudo-symmetry effect [13]. Moreover, an advanced technique called Automated Crystal Orientation Mapping (ACOM) along with precession electron diffraction (PED) in TEM (NanoMegas ASTAR system, Brussel, Belgium) was used [14,15]. A precession angle of 0.5° with 100 Hz frequency was employed for ACOM maps to characterize finer microstructural features involving nano level lath and precipitates in the crept samples. A step size of 20 nm, and camera exposure time of 20 ms were used for all the maps. ACOM, along with PED study and conventional imaging, were undertaken using the TEM (Tecnai G2 Model, FEI make, Hillsboro, OR, USA), and the spatial resolution was kept at 20 nm for the present experiment. The raw data was converted through the TSL software for further analysis. ACOM analysis is similar to EBSD; however, in the former method the grain orientation and the phases are identified through the diffraction spots/patterns with very high spatial resolution in sub-nanometer range. The samples for TEM and PED were prepared by Precision Ion Polishing System (PIPS, make: Gatan, Pleasanton, CA, USA) using 4 kV and ±4° gun tilt (upper and lower) followed by final polishing with 3 kV and ±3° gun tilt.

3. Results and Discussion

3.1. Microstructure of the As-Cast Materials

The microstructures of the as-cast Ti-45Al-8Nb-2Cr-0.2B and Ti-45Al-8Ta-2Cr-0.2B-0.2C alloys are shown in Figure 1a–e, respectively. The back-scattered SEM micrographs show the presence of a bright region near the colony boundaries. These bright regions are due to retained β(B2) phase formed by segregation of Nb, Ta, and Cr during solidification, which was also confirmed through EDS microanalyses (not shown here).
At low magnification, the microstructure shows a non-uniform distribution of the colony size and some intermittent γ-TiAl grains. EBSD band contrast images (Figure 1b,e) of both the alloys further illustrates the as-cast microstructure. The colony size for both the alloys was found to vary between 40–100 µm. Figure 1b shows that the microstructure is predominantly lamellar, and that the Ta-rich alloy has a much finer lamellar spacing compared to the Nb-rich alloy (Figure 1e). For both the alloys, the retained β-phase is mostly observed in the colony boundaries, and frequently punctuated by transformed γ-TiAl phase. One of the prominent differences between the as-cast microstructures of Nb-rich and Ta-rich alloys is the presence of strong inter-dendritic negative-segregation of Ta, whereas in the case of Nb-rich alloy, such segregation is generally absent. X-ray diffraction (XRD) study has been further carried out to identify the phases present. The representative XRD patterns of the alloys are shown in Figure 1c,f. The phase analysis of the major peaks reveals the presence of three constituent phases, namely α2, γ, and β. These results are consistent with the findings of the SEM analysis.

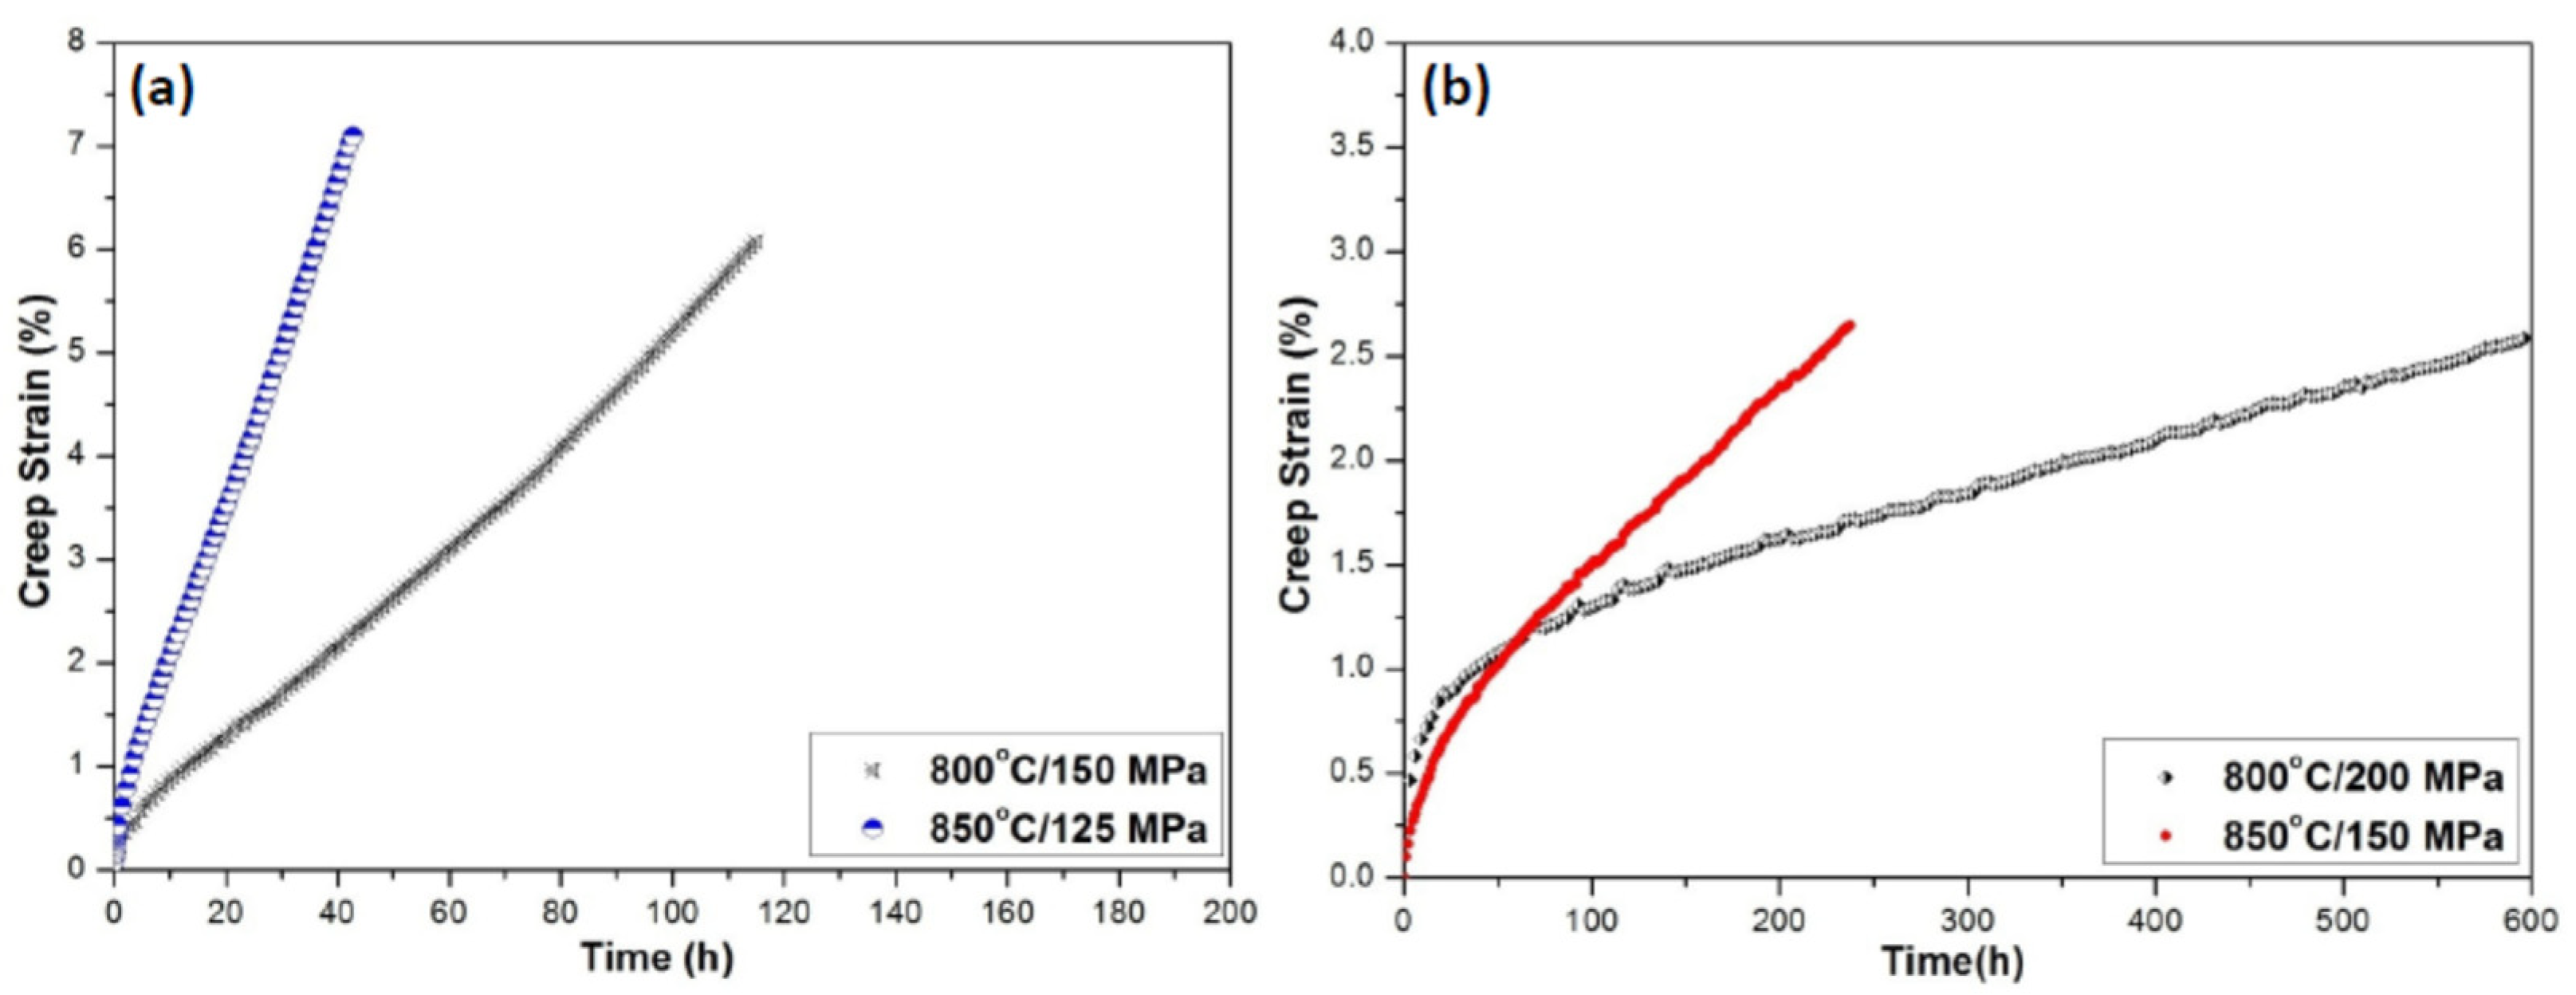
3.2. Compressive Creep Behavior

Representative creep curves for the Nb- and Ta-rich alloys in the as-cast condition at 800–850 °C and an applied stress level of 125–200 MPa are shown in Figure 2. At lower temperature (800 °C), two distinct stages of creep can be noted in the creep curve i.e., a primary creep stage and a well-defined secondary or steady-state creep region. The primary stage becomes increasingly shorter at higher temperatures.
The steady-state creep data obtained at different stress levels and temperatures are further considered, and the stress dependence of minimum creep rate can be represented by Norton–Bailey power-law [16]. From the double logarithmic plots of the temperature compensated steady state creep rate and the applied stress, the apparent activation energy and the stress exponents have been determined. For the Nb-rich alloy, the apparent activation energy and the stress exponent have been found to be 375 KJ/mol, and 3.6, respectively [16]. On the other hand, in the current study, the apparent activation energy of 400 KJ/mol, and the stress exponent of 5.0 have been estimated for the Ta-rich alloy [17]. The value of the activation energy for self-diffusion of Ti and Al in TiAl were reported to be 250–295 kJ/mol and 358 kJ/mol, respectively [18]. The calculated activation energy values of 375–400 kJ/mol for the Nb- and Ta-rich γ-TiAl alloys are higher than that reported for self-diffusion of Ti in TiAl. The higher value of activation energy of creep deformation for the present alloys could be due to the presence of Nb and Ta alloying elements, which are reported to have a low diffusion coefficient in both α (Ti-base solid solution with hexagonal structure) and γ (TiAl) phase. It indicates that Nb and Ta alloying to TiAl alloys substantially increases the activation energy of self-diffusion of Ti in γ-TiAl.
It is to be noted that the stress exponent values obtained for the Nb and Ta containing alloys in the present study are very similar to the stress exponents reported in several TiAl based alloys. In particular, values agree well with that of the Ti-46Al-Ta alloy whose composition is somewhat close to that of the present alloy [19,20]. The higher stress exponent value suggests that creep is controlled by diffusion assisted dislocation climb.
It is clear from the creep curves and corresponding analyses that Ta-rich γ-TiAl based alloy shows superior creep resistance compared to the Nb-rich alloys. At a comparable creep deformation condition, Ta-rich alloy exhibits significantly lower steady state creep rate. Here, we have reported the creep curves for Ta-rich alloys at higher stress so as to produce comparable creep strain for evaluation of deformation microstructure. In the present article we will explore the microstructural features responsible for the difference in creep behavior of Nb- and Ta-rich alloys.

3.3. Microstructural Characterization of Crept Samples
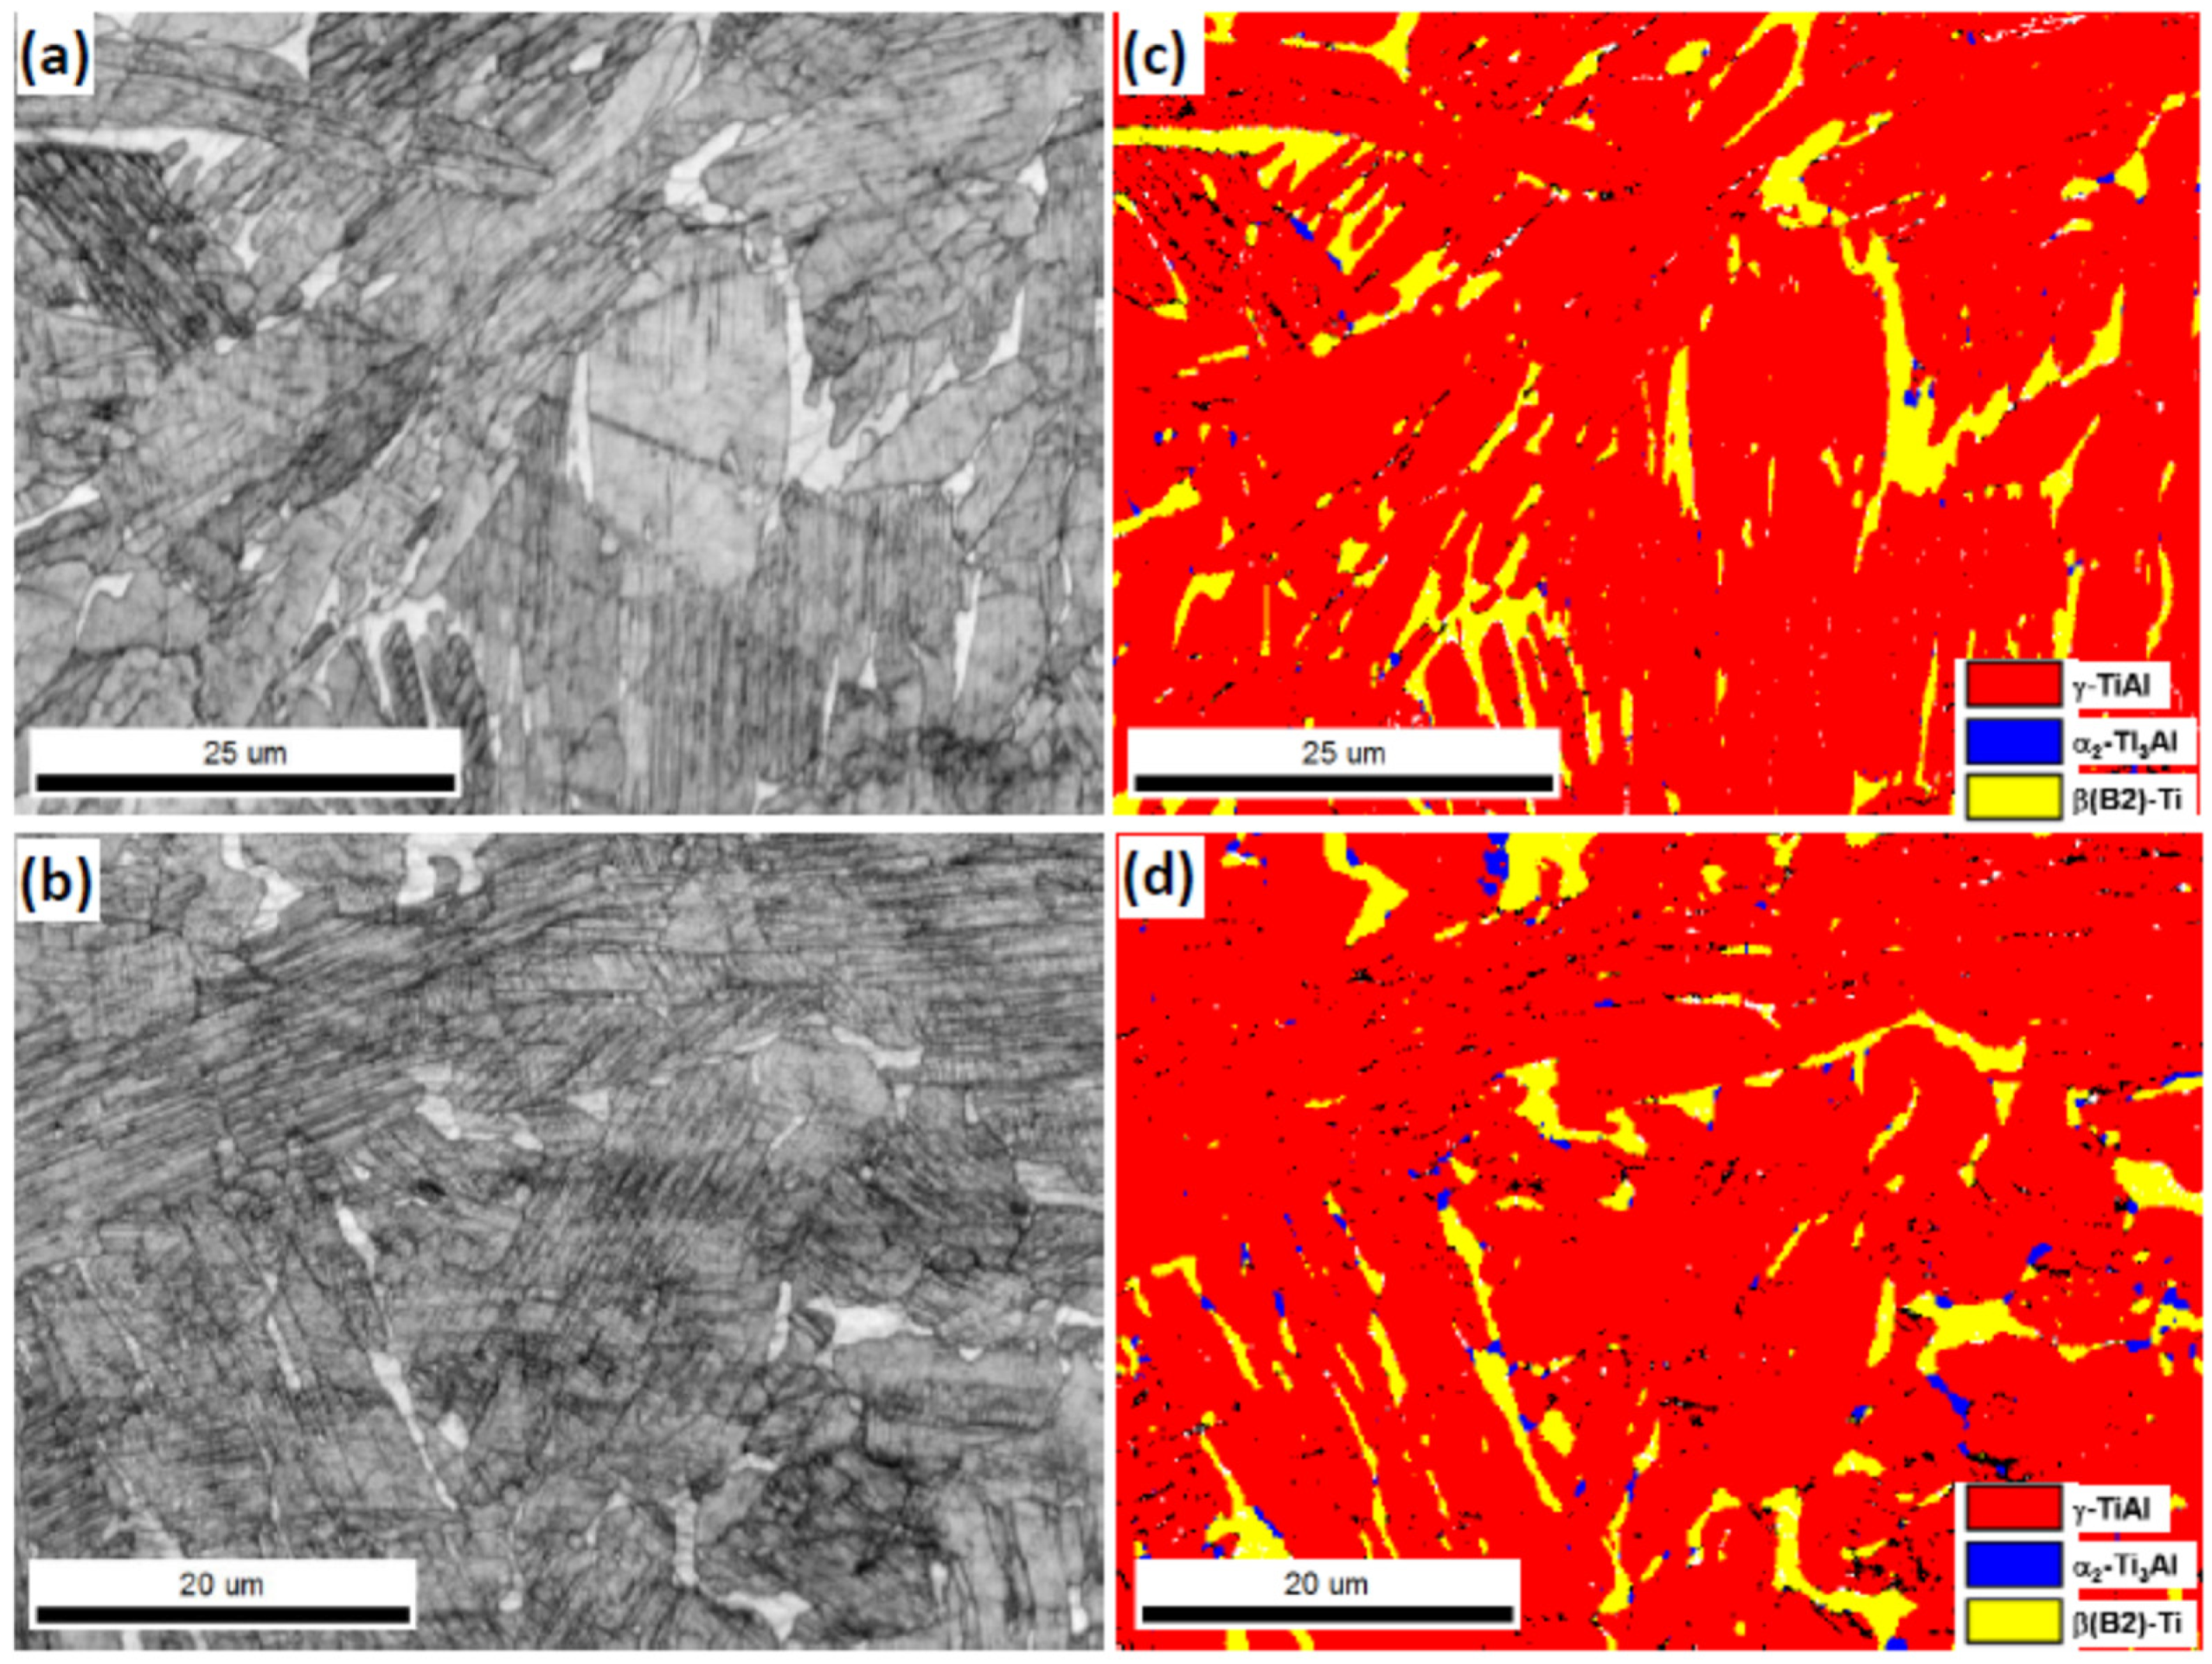
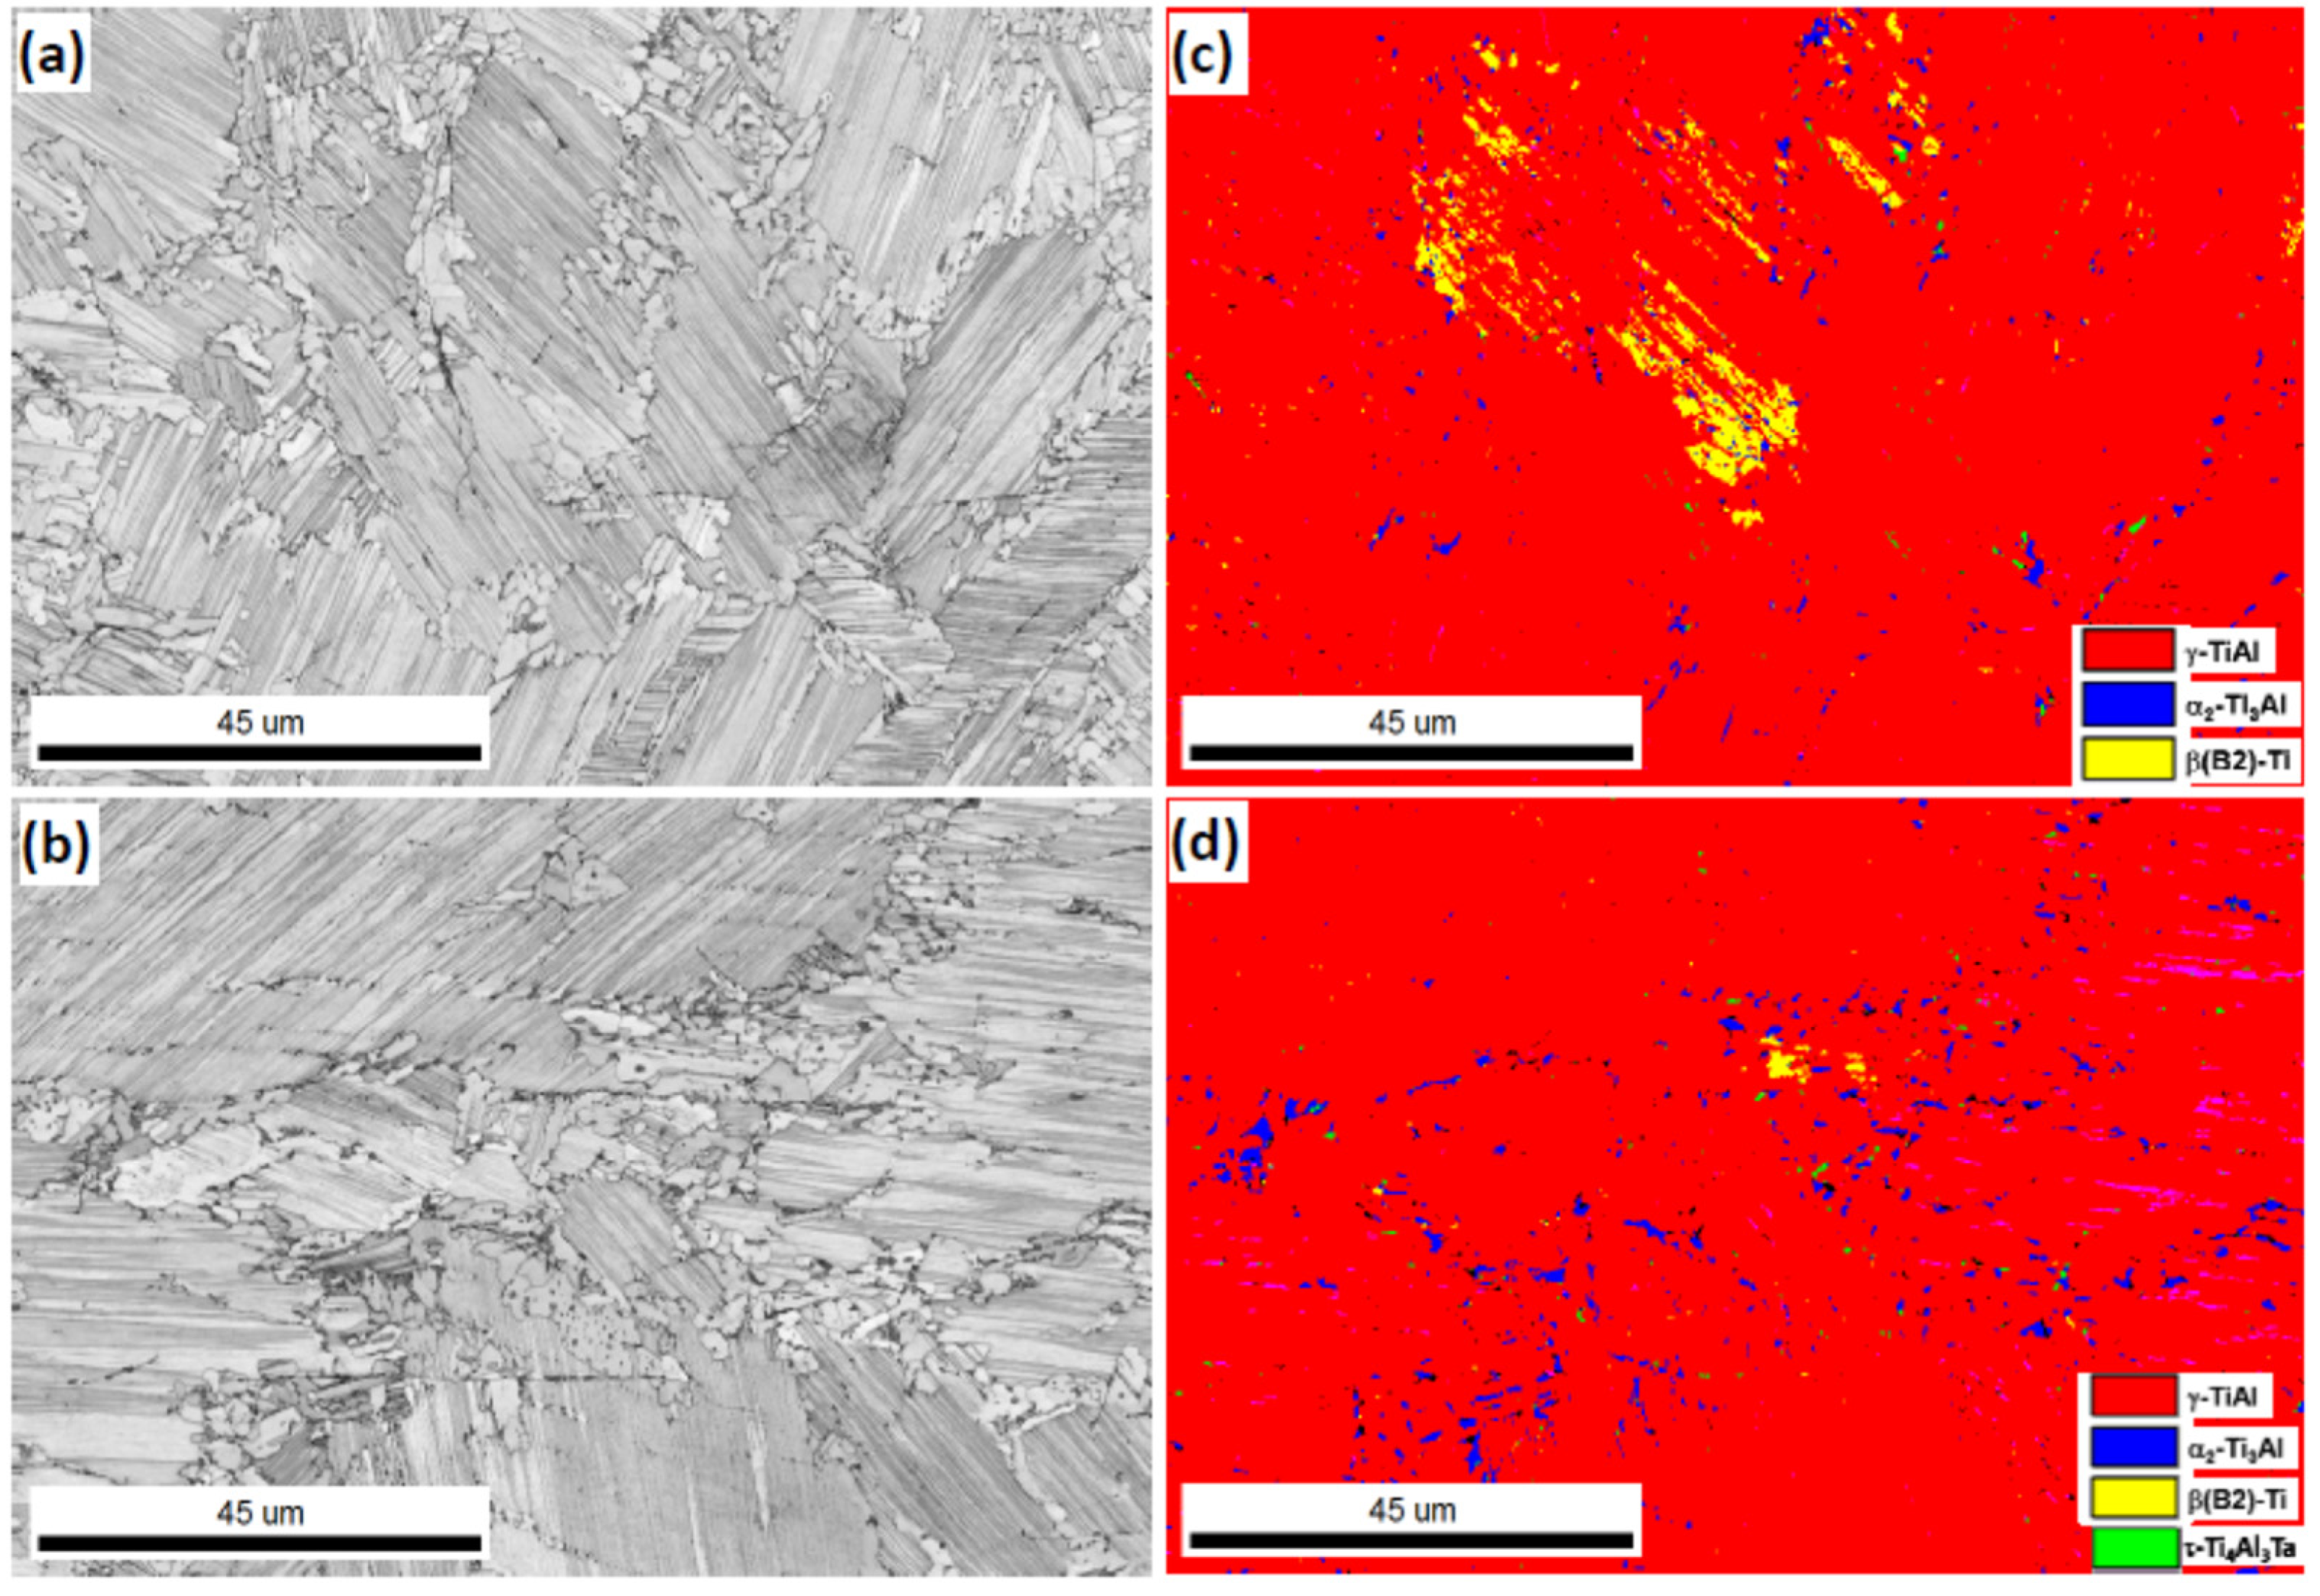
Microstructural features of the post-creep samples of both the alloys have been examined using electron microscopy (SEM, EBSD) on the longitudinal sections in terms of degradation of the lamellar structures, dynamic recrystallization, and phase transformation. It has been found that there is no major change in lamellar colony structure, with marginal change in the lamellar spacing and lathe size of the crept samples of both the alloys at lower temperature (800 °C). For the Nb-rich alloy, in addition to lath coarsening and lamellar fragmentations, dynamically recrystallized γ grains are observed in the investigated crept samples. The detailed microstructural characterization of the Nb-rich alloy over the entire creep testing range can be found elsewhere [16]. Microstructural development of crept Ta-rich alloys is significantly different from those of the Nb-rich alloy. In the Ta-rich alloy, copious precipitation along the colony and lath boundaries along with phase transformations could be noticed, as shown in the EBSD section. This part has been discussed in detail elsewhere [17]. The development of microstructural features of crept Nb-rich and Ta-rich alloys pertaining to the present article have been examined in detail through EBSD as described in the following section.

3.3.1. EBSD Mapping

Microstructural development of crept Ti-45Al-8Nb-2Cr-0.2B alloy subjected to creep deformation at 800 °C/150 MPa and 850 °C/125 MPa is shown in Figure 3 in terms of band contrast map and phase distribution map. At lower temperatures, the disintegration of lamellar structures due to γ-lath coarsening and β → γ transformation at the bulky β grains situated on the colony boundary could be noticed (Figure 3a,c). At higher temperature (850 °C), the microstructure is characterized by both β → γ transformation as well as β → α2 transformations along with γ-lath coarsening and partial fragmentation of laths (Figure 3b,d).
On the other hand, the microstructure of the crept samples of the Ti-45Al-8Ta-2Cr-0.2B-0.2C alloy reveals considerable modification of the initial condition. Figure 4 exhibits typical microstructures of crept samples subjected to creep deformation at 800 °C/200 MPa and 850 °C/150 MPa. It is evident that γ-lath coarsening, β → γ transformation and considerable coarsening of transformed γ-grains at the colony boundaries are common features of the crept microstructure at both the temperatures. At lower temperature, the stability of γ-phase is predominant, as shown in Figure 4c. With increase in creep deformation temperature to 850 °C, in addition to the transformation of remnant β phase to γ, there are α2 grains at the colony boundary area, possibly due to a β → α2 transformation (Figure 4d). In contrast to the microstructural development of Nb-rich alloy, the crept Ta-rich alloy samples show precipitation of a Ta-rich τ-phase (Ti4Al3Ta, isomorphous with the reported τ-phase based on Ti4Al3Nb; the crystal data (CIF file) of Ti4Al3Ta for Kikuchi bands was generated from reported phase Ti4Al3Nb by replacing the Nb atoms with Ta atoms. The Kikuchi bands of Ti4Al3Ta phase were detected in EBSD with a mean angular deviation (MAD) value less than one, which indicates good matching of the simulated patterns. Extent of the τ-phase precipitation increases with the increasing temperature of creep deformation.

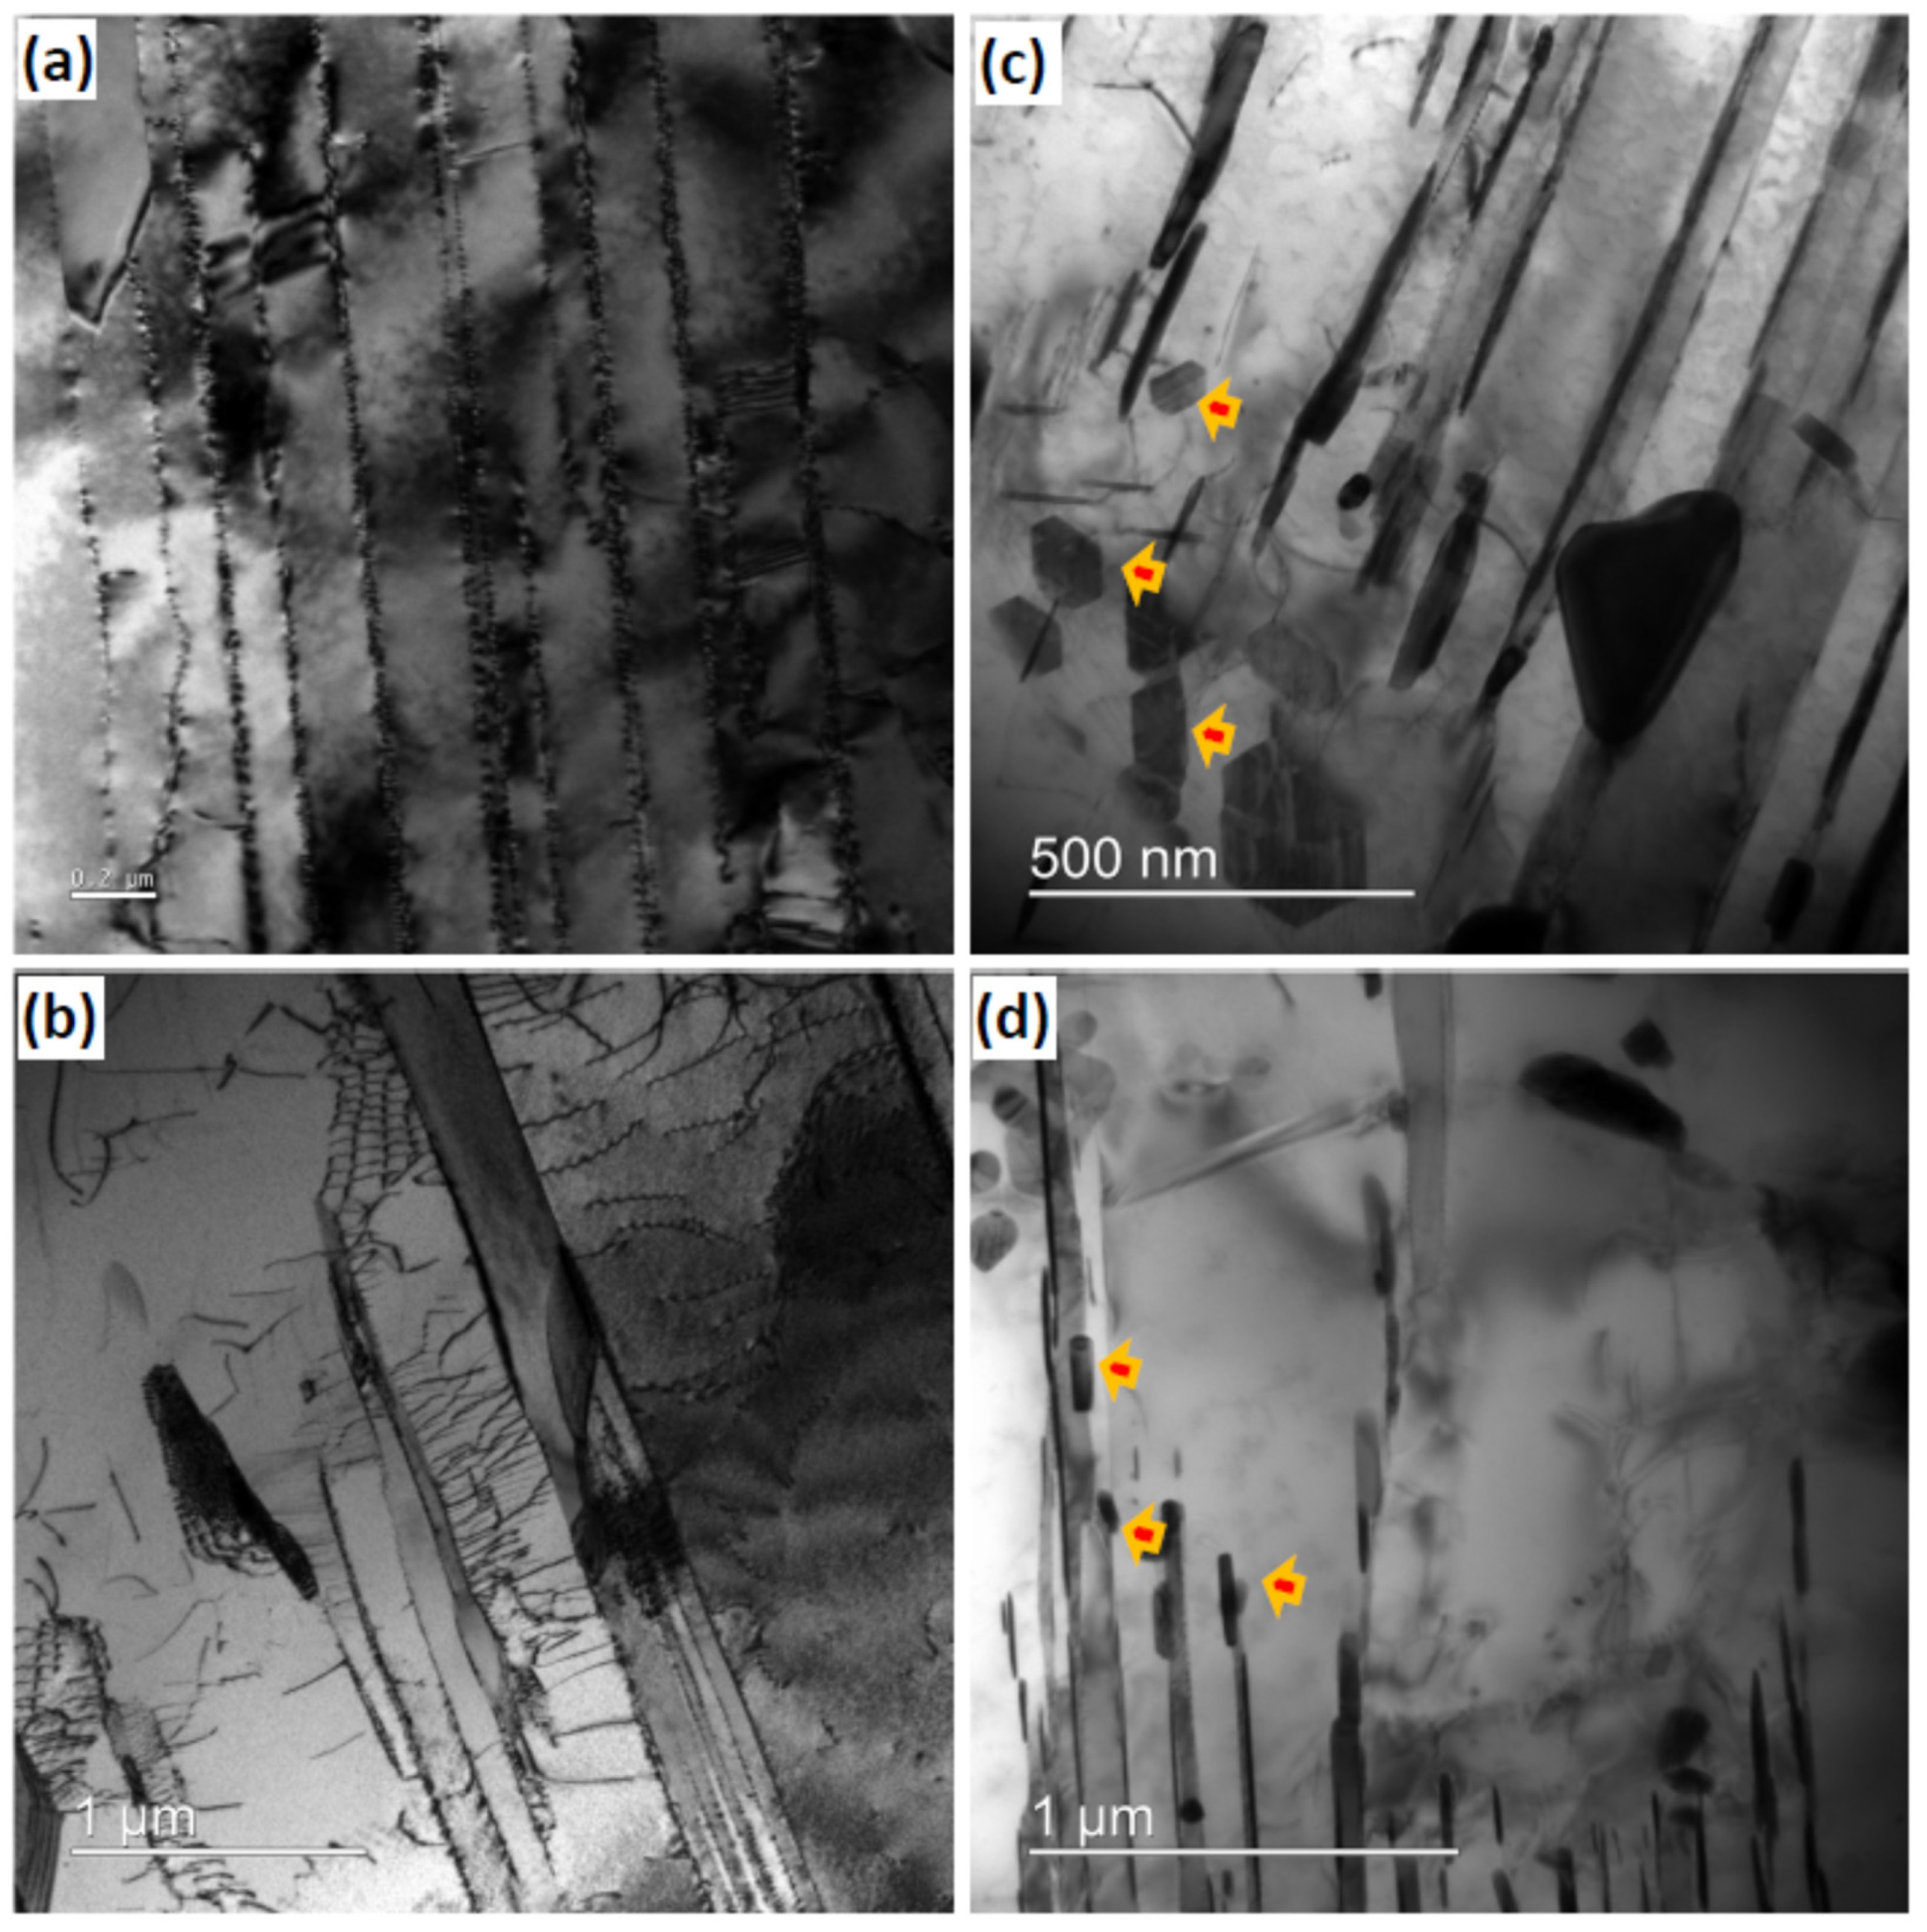
3.3.2. Transmission Electron Microscopy

Figure 5 represents the bright field TEM images showing comparison of microstructural development of Nb- and Ta-rich alloys crept at 800 °C (Figure 5a,c) and 850 °C (Figure 5b,d). It is evident from the TEM images that the lamellar structure is largely retained for the Nb-rich alloy during the creep deformation at 800 °C (Figure 5a), whereas considerable lath coarsening can be observed at higher temperature (Figure 5b). On the other hand, Ta-rich alloy shows considerable lamellar disintegration in terms of fragmentation and thinning of α2 laths, and formation of recrystallized γ-grains at both the creep deformation temperatures (Figure 5c,d). It could further be noticed that there is lamellar instability accompanied by copious precipitation of phases based on α2 and τ. The complex co-precipitation of multiple phases makes it difficult to precisely determine their identity. It is, therefore, required that microstructural development be evaluated using an advanced technique such as ACOM with PED for a detailed characterization.

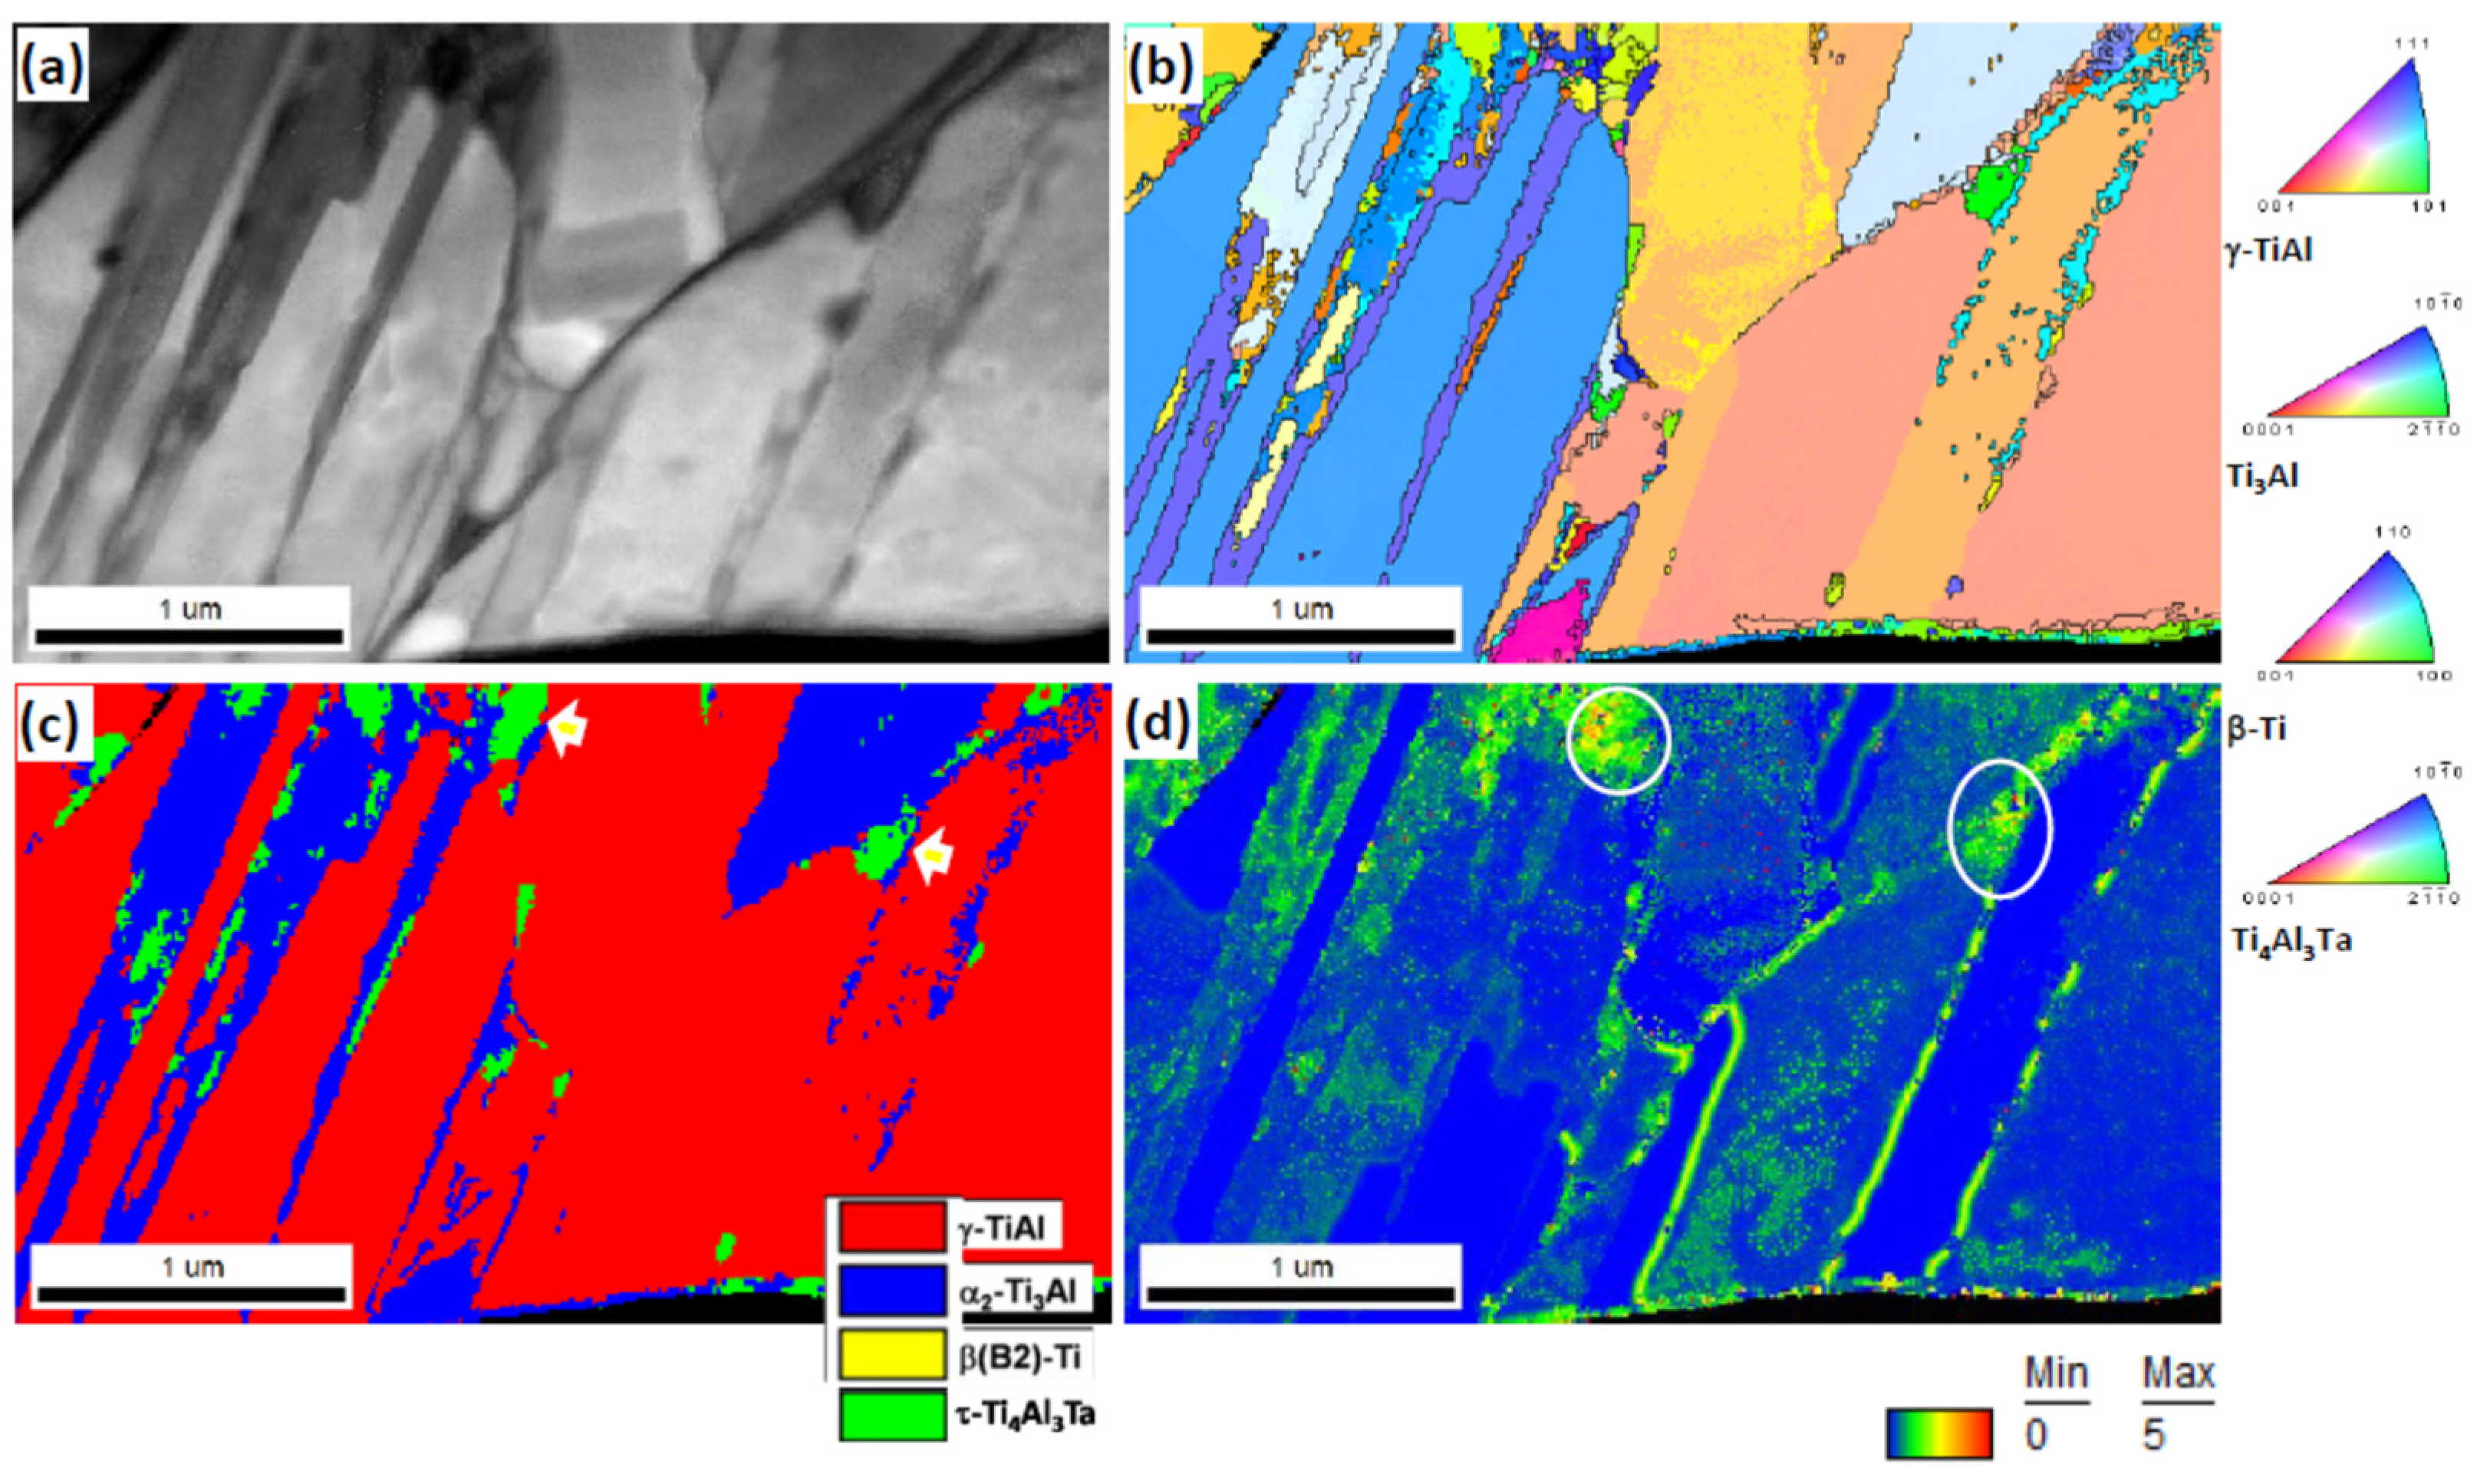
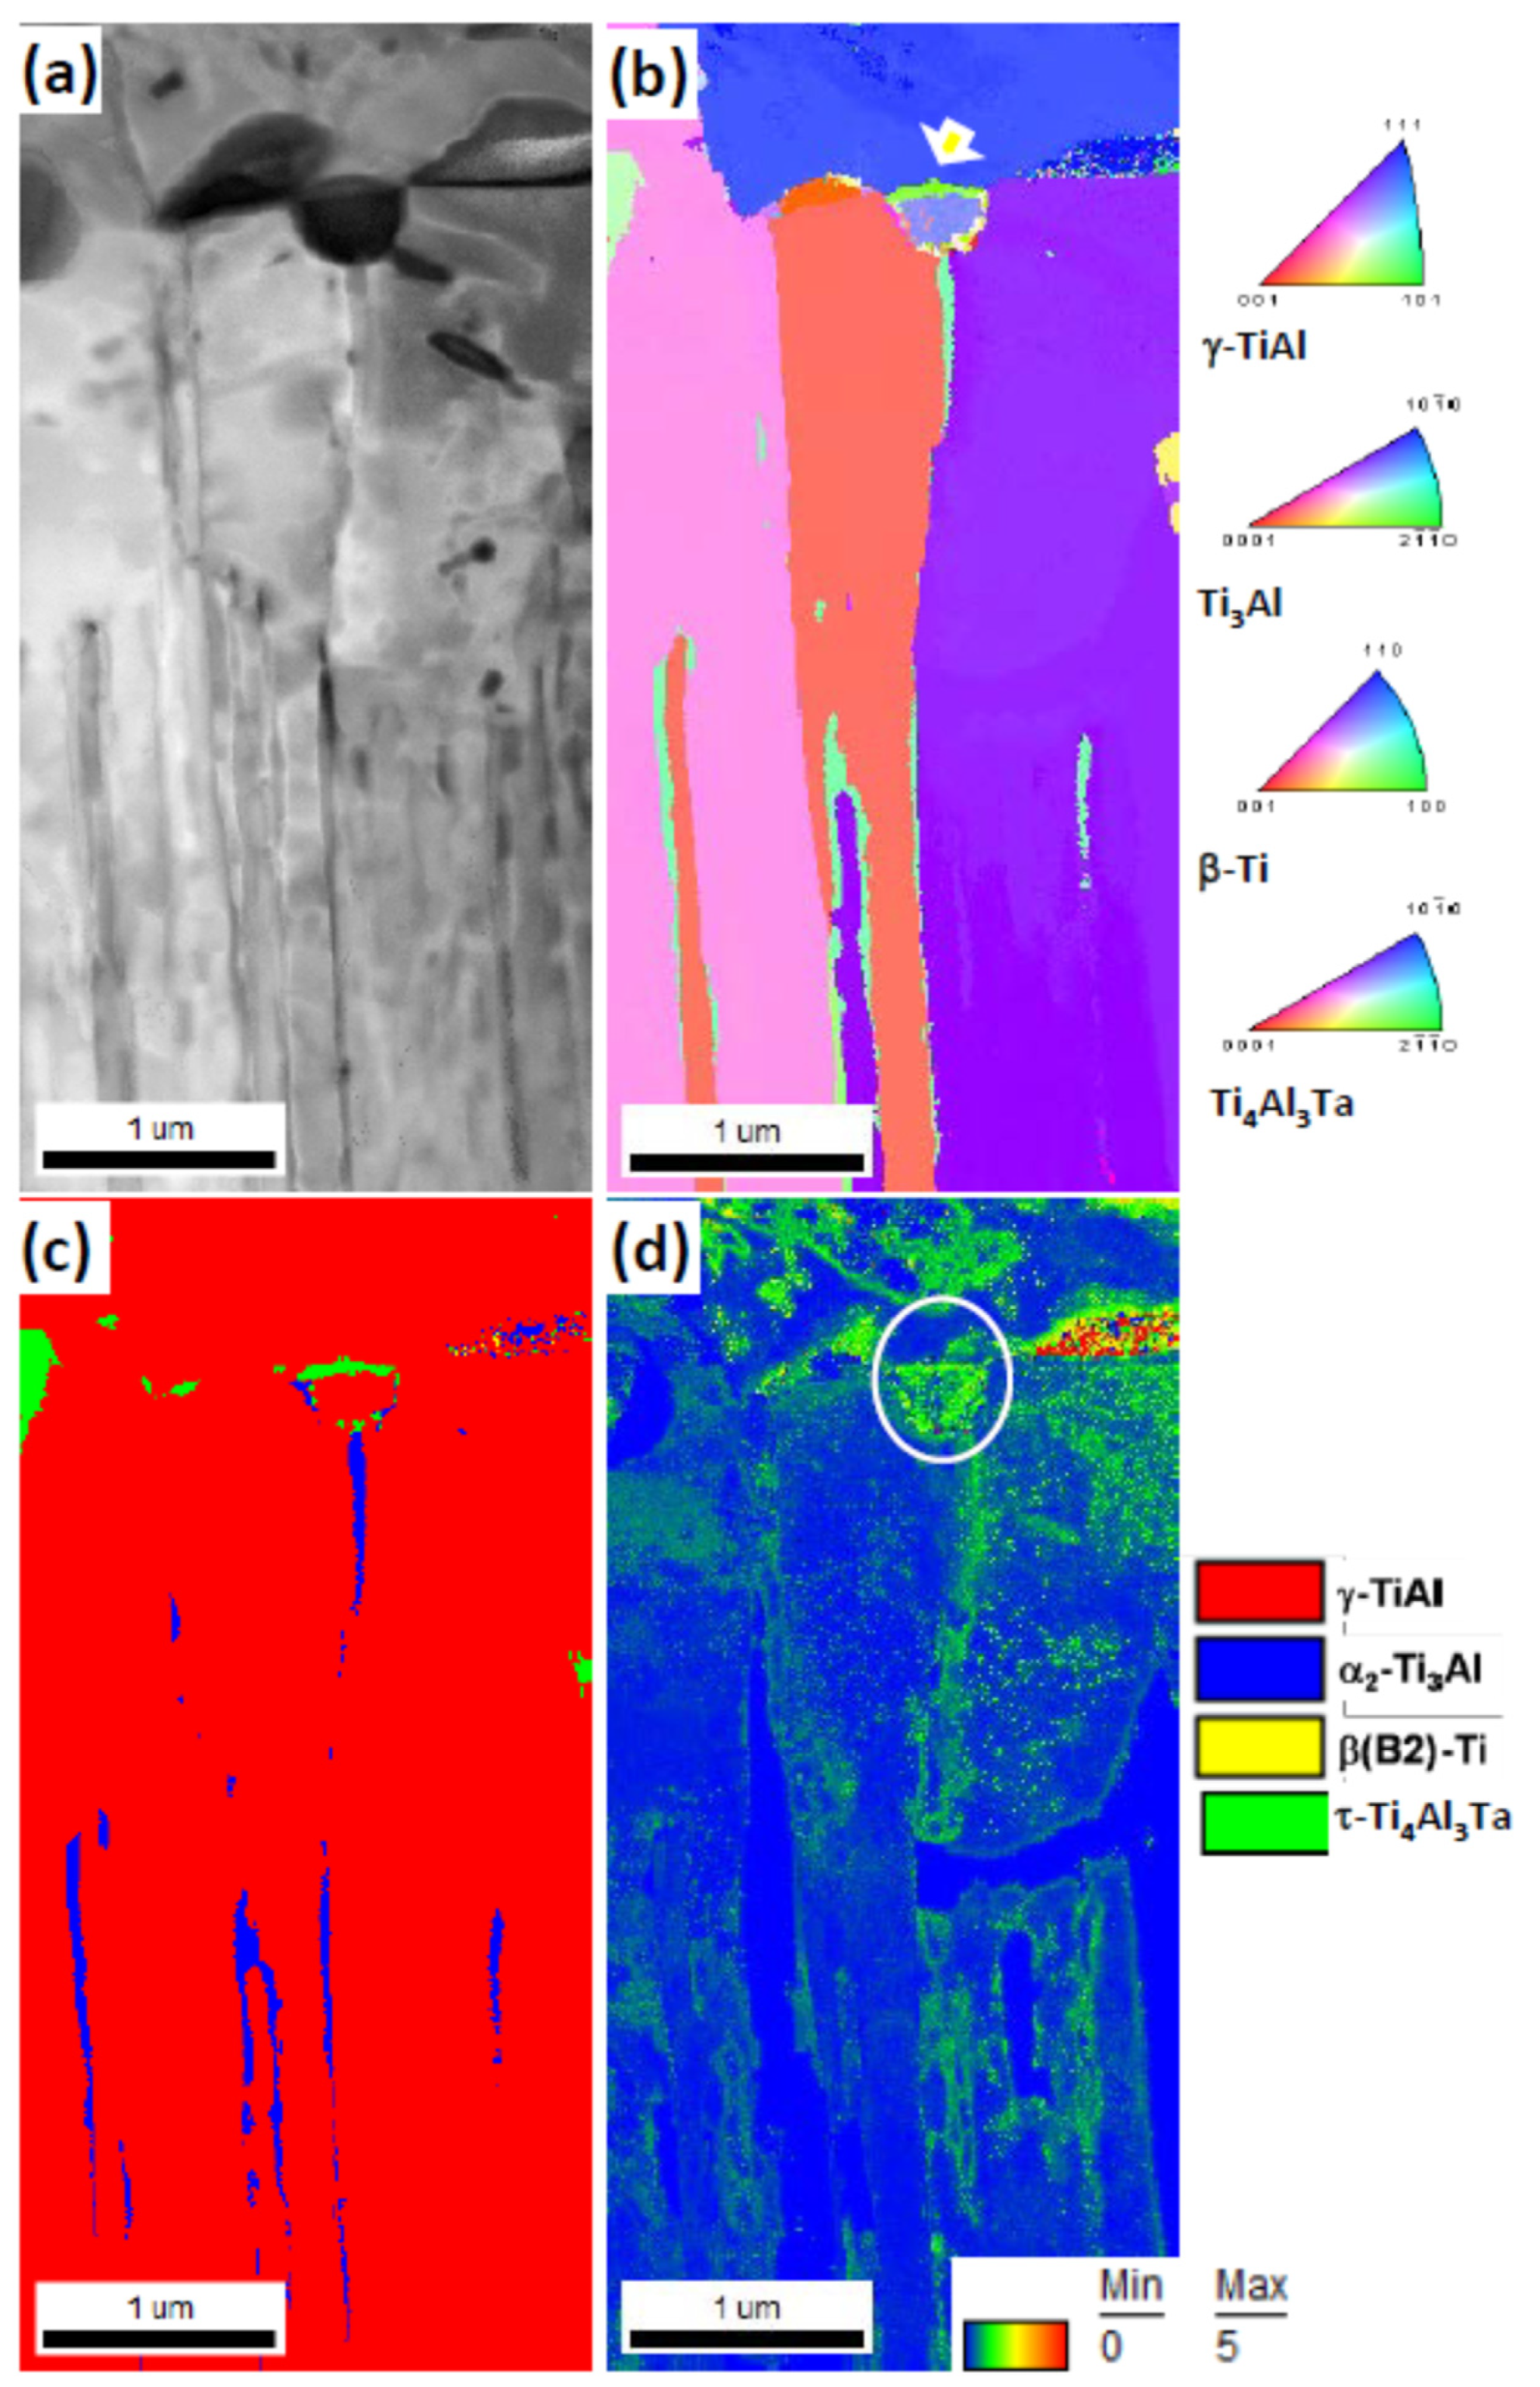
3.3.3. ACOM with PED

The results of ACOM along with PED analysis of the sample crept at 800 °C/200 MPa are displayed in Figure 6, showing the index quality map and corresponding inverse pole figure map (IPF), phase map, and kernel average misorientation (KAM) map. The coarsening of γ-laths and precipitation of τ-phase after creep deformation can clearly be observed from Figure 6a,c. However, coarse α2-laths still remain, and relatively fine laths tend to dissolve. Further, fine Ti3Al particles are observed which could possibly form by fragmentation of laths and/or precipitation at the prior inter-lamellar and colony boundaries. The KAM map indicates the spatial localization of strain gradients developed in the microstructure. It could be noticed that the higher strain gradient regions are associated with the precipitation of τ and α2-particles. The coarse γ-laths are relatively strain free indicating strong dynamic recovery during the creep deformation.
Similar ACOM with PED analyses of the Ta-rich alloy sample crept at 850 °C/150 MPa further corroborate the observations described above. The index quality map and IPF map, phase map, and KAM map of Ta-rich alloy sample are displayed in Figure 7. Considerable coarsening of the γ-laths (an estimate of average γ-lath size of the as-cast material and crept sample are 280 ± 105 nm, 360 ± 55 nm, respectively measured from high magnification SEM images) and remnants of the α2-laths are evident from the phase maps (Figure 7c). The nature of prior α2-laths can be confirmed from the fact that there are exactly same orientations of the remnant laths as depicted in Figure 7b. It is to be noted that in a γ + α2 colony structure the α2-laths inherit the parent phase orientation from which α → γ transformation occurs. The precipitation of τ-phase can be noticed along the boundary of a γ-grain and colony boundaries (Figure 7c). Similar to Ta rich sample crept at 800 °C/200 MPa, the KAM map for the sample crept at 850 °C/150 MPa indicates the presence of localized strain gradients near the regions of the precipitation of τ and α2-particles.
One of the interesting aspects of microstructural development of the crept Ta-rich alloy is the precipitation of τ and α2-particles and the relatively high strain gradient associated with them. It is to be noted that the relatively superior creep resistance of the Ta-rich alloy is rather surprising considering the fact the lamellar structure of the Nb-rich alloy has been shown to be more stable under the creep deformation condition studied here. This indicates the possible role of the precipitation of τ and α2-particles in improving the creep resistance of the Ta-rich alloy. The existence of higher strain gradients associated with precipitation zones (Figure 6d and Figure 7d) corroborates well with such an interpretation (a few precipitated τ-particles are marked with arrowheads and relevant areas are encircled in KAM maps in Figure 6 and Figure 7). Conventional TEM bright field imaging of the dislocation structures near the precipitation zones further confirms the results. Figure 8 shows the development of dislocation structure of crept Ta-rich alloy. It is evident from the TEM images that extensive dislocation networks are present near the precipitation zones. Considering the typical dislocation structure of coarse γ-laths and dynamically recrystallized γ-grains, such a dense dislocation network around the precipitates indicates “pinning” effect against the dislocation movement, and consequently, dynamic recovery will be hindered.
From the foregoing discussion, it is evident the precipitation of τ-phase assumes greater significance in the context of improved creep resistance of Ta-rich γ-TiAl based alloys. Hence, transformation of the τ-phase has been examined to a greater extent. The crystallographic nature of the τ-phase reveals that it has B82 type structure (space group: P63/mmc, Pearson symbol: hP6) and the ternary hexagonal Ti4Al3Nb phase has been shown to have a similar symmetry with Ni2In, as reported by Witusiewicz et al. [21] in Nb-rich Ti-46Al-8Nb alloy. The present investigation also suggests that Ti4Al3Ta phase could be considered as isomorphous to the Ti4Al3Nb phase with replacement of Ta atoms at the Nb sites. It has been reported in literature that Ti4Al3Ta phase is known to form from β (B2) phase [22] through intermediate ω phase. Direct transformation of β(B2) phase to B82 is not reported in the literature and needs further investigation.
However, Lapin et al. [19,20] have suggested that the τ-phase forms at the expense of the α2-lathes by partially transforming to the γ-matrix and τ-particles during creep deformation (i.e., α2 → γ + τ). In the present study, the τ-phase is often found to be associated with α2-laths, which tends to support the later view. However, a closer examination of the crystallographic orientation relationship (OR) between the γ, τ, and α2-phases reveals that there exists a strong OR between γ and τ-phase, whereas the OR between α2 and τ has a misorientation >15°.
Figure 9 confirms the existence of OR between the γ- and τ-phases in terms of 〈111〉γ//〈0001〉τ; 〈110〉γ//〈10–10〉τ. However, considering the fact that τ-phase composition (Ti = 45–48%, Al = 41–42%, Ta = 9–10%, Cr = 2–3%) is significantly richer in Ta, it is unlikely that γ-laths (Ti = 46–47%, Al = 45–46%, Ta = 6–7%, Cr = 1–2%) will directly transform to τ-phase. Further considerations of the locations of the τ-phase formation near the remnant β(B2)-phases (Ti = 39–41%, Al = 37–38%, Ta = 13–14%, Cr = 8–9%) in the initial material and almost complete transformation of β(B2)-phases during the creep deformation of Ta-rich alloys suggest that the remnant β(B2)-phases phase transforms simultaneously to α2-phase and τ-phase by partitioning of Ta. It has been shown in an earlier study [16] that transformation β(B2)-phases present in colony boundaries to γ-grains bears the general OR of (110)β//(111)γ; [111]β//[110]γ. Hence, it is likely that the transformed γ-phase will have an OR with τ-phase even though τ-phase does not directly transform from γ-phase. It is, therefore, postulated that the evolution of a hexagonal τ-phase could possibly occur through the transformation sequence of β(B2) → α2 + τ. Further micro-chemical analyses in conjunction with the high resolution EBSD of the Ta-rich sample crept at 800 °C/200 MPa illustrate the compositional characteristics of the possible transformation products (i.e., α2, τ), as summarized in Figure 10. It is evident from the IPF and band contrast maps (Figure 10a,b) that the transformed α2, τ-phases are noticed mainly at the recrystallized γ-grain boundaries. While the precipitated τ-phases have a characteristic narrow composition (Ti = 46.1%, Al = 41.5%, Ta = 10.5%, Cr = 2.3%), the α2-phase shows an unusual scatter in composition (Ti = 37–49%, Al = 36–41%, Ta = 7–18%, Cr = 2–8%). It is rather interesting to note that the thin, irregular shaped α2-phases often associated with τ-particles show highly Ta-rich composition (Ti = 40.5%, Al = 40.4%, Ta = 17.3%, Cr = 1.8%), as shown in Figure 10e. On the other hand, course and equiaxed α2-grains as well as the remnant α2-laths have a more consistent composition of Ti = 48–49%, Al = 42–43%, Ta = 6–7%, Cr = 1–2%. Such a unique compositional characteristics of the α2-phases differentiates the transformed products with rather high Ta-rich composition and further corroborates the postulated transformation from the Ta-rich parent β-phase. A careful examination of the transformed regions reveals the frequent presence of very thin peripheral layer of β-phase around the α2 supplementing the proposed transformation path.
ACOM with PED analyses have been further extended to the Ti-45Al-8Nb-2Cr-0.2B alloy sample subjected to creep at 800 °C/150 MPa for comparison. Figure 11 summarizes the key microstructural findings. Compared to the Ta-rich crept samples, the β(B2)-phase of the Nb-rich samples appears to be more stable under the creep deformation conditions. As depicted in Figure 11c, τ-phase and α2-phase precipitation have hardly been observed in the microstructure. Only localized thin layers of α2-phase could be noticed. More importantly, relatively lower and inconsistent strain gradient could be detected near the α2-phase from the KAM map (Figure 11d). It clearly points out that, unlike the case of the precipitation of τ and α2-particles in Ta-rich alloys, the transformed α2-phase has hardly any influence on the creep behavior of the Nb-rich alloy.

4. Conclusions

Compressive creep behavior of two fourth generation γ-TiAl alloys, Ti-45Al-8Nb-2Cr-0.2B and Ti-45Al-8Ta-2Cr-0.2C-0.2B has been evaluated and correlated with microstructure of the alloys. Followings are the major outcome of the present study.
(a)
Compressive creep curves of the alloys studied under a range of deformation conditions (800–850 °C, 125–200 MPa) exhibit typical primary regime followed by a well-defined steady state creep regime. The stress dependence of the steady state creep rates can be described by the Norton–Bailey power-law with stress exponent being in the range 3.6 to 4.5 and apparent activation energy in the range 375 to 398 kJ/mol. The observed values of stress exponent and activation energy suggest that the creep in the alloy is controlled by diffusion which is assisted by dislocation climb.
(b)
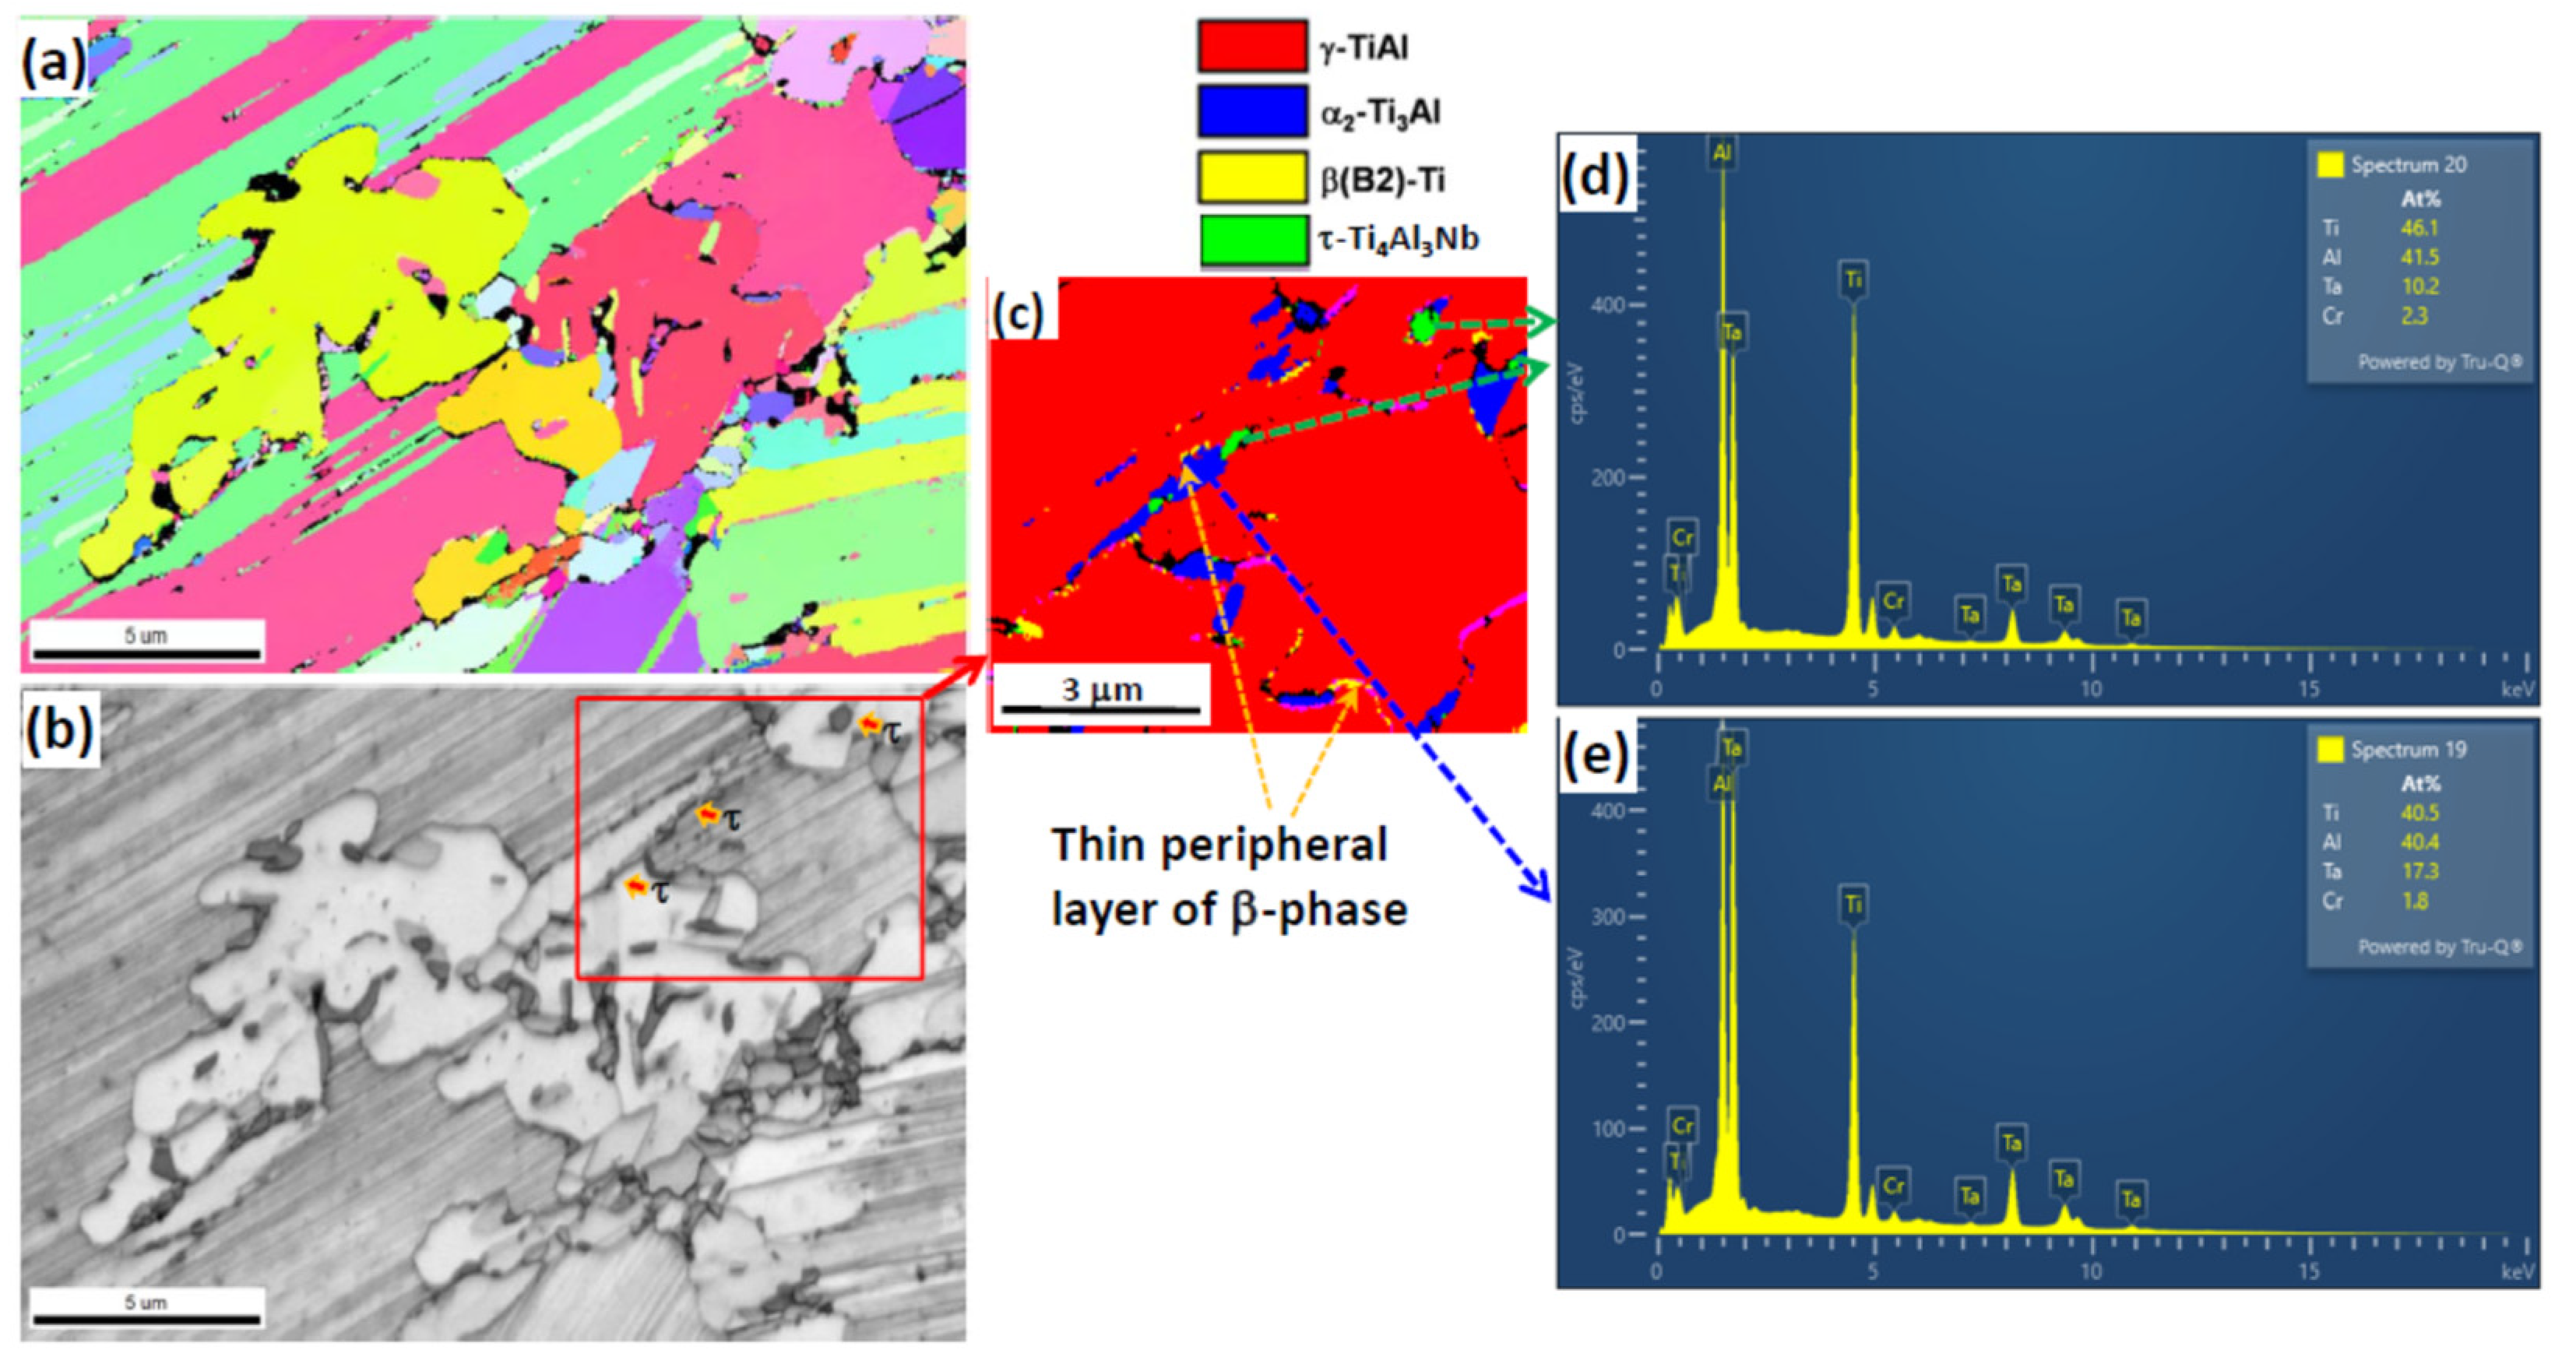
Detailed microstructural comparison of the pre- and post-creep samples reveals that compared to the Nb-rich alloy the Ta-rich alloy exhibit higher tendency of lamellar structure disintegration in terms of γ-lath coarsening and fragmentation of α2-laths in the creep deformation range studied here. Microstructure of the crept Ta-rich alloy is further decorated with precipitation of multiple phases. In addition to the α2-precipitates, τ-phase (Ti4Al3Ta), precipitation occurs during creep along the lath and the colony boundaries. Precipitation of τ-phase (Ti4Al3Nb) corresponding to the Nb-rich alloy is scarce in the crept microstructure.
(c)
It has been observed that a definite OR exists between the precipitated τ-phase and its surrounding matrix γ-phase in the form of 〈111〉γ//〈0001〉τ; 〈110〉γ//〈10–10〉τ. However, no such OR could be found between α2 and τ. This implies that the evolution of a hexagonal τ-phase could possibly occur through the transformation sequence of β(B2) → α2 + τ.
(d)
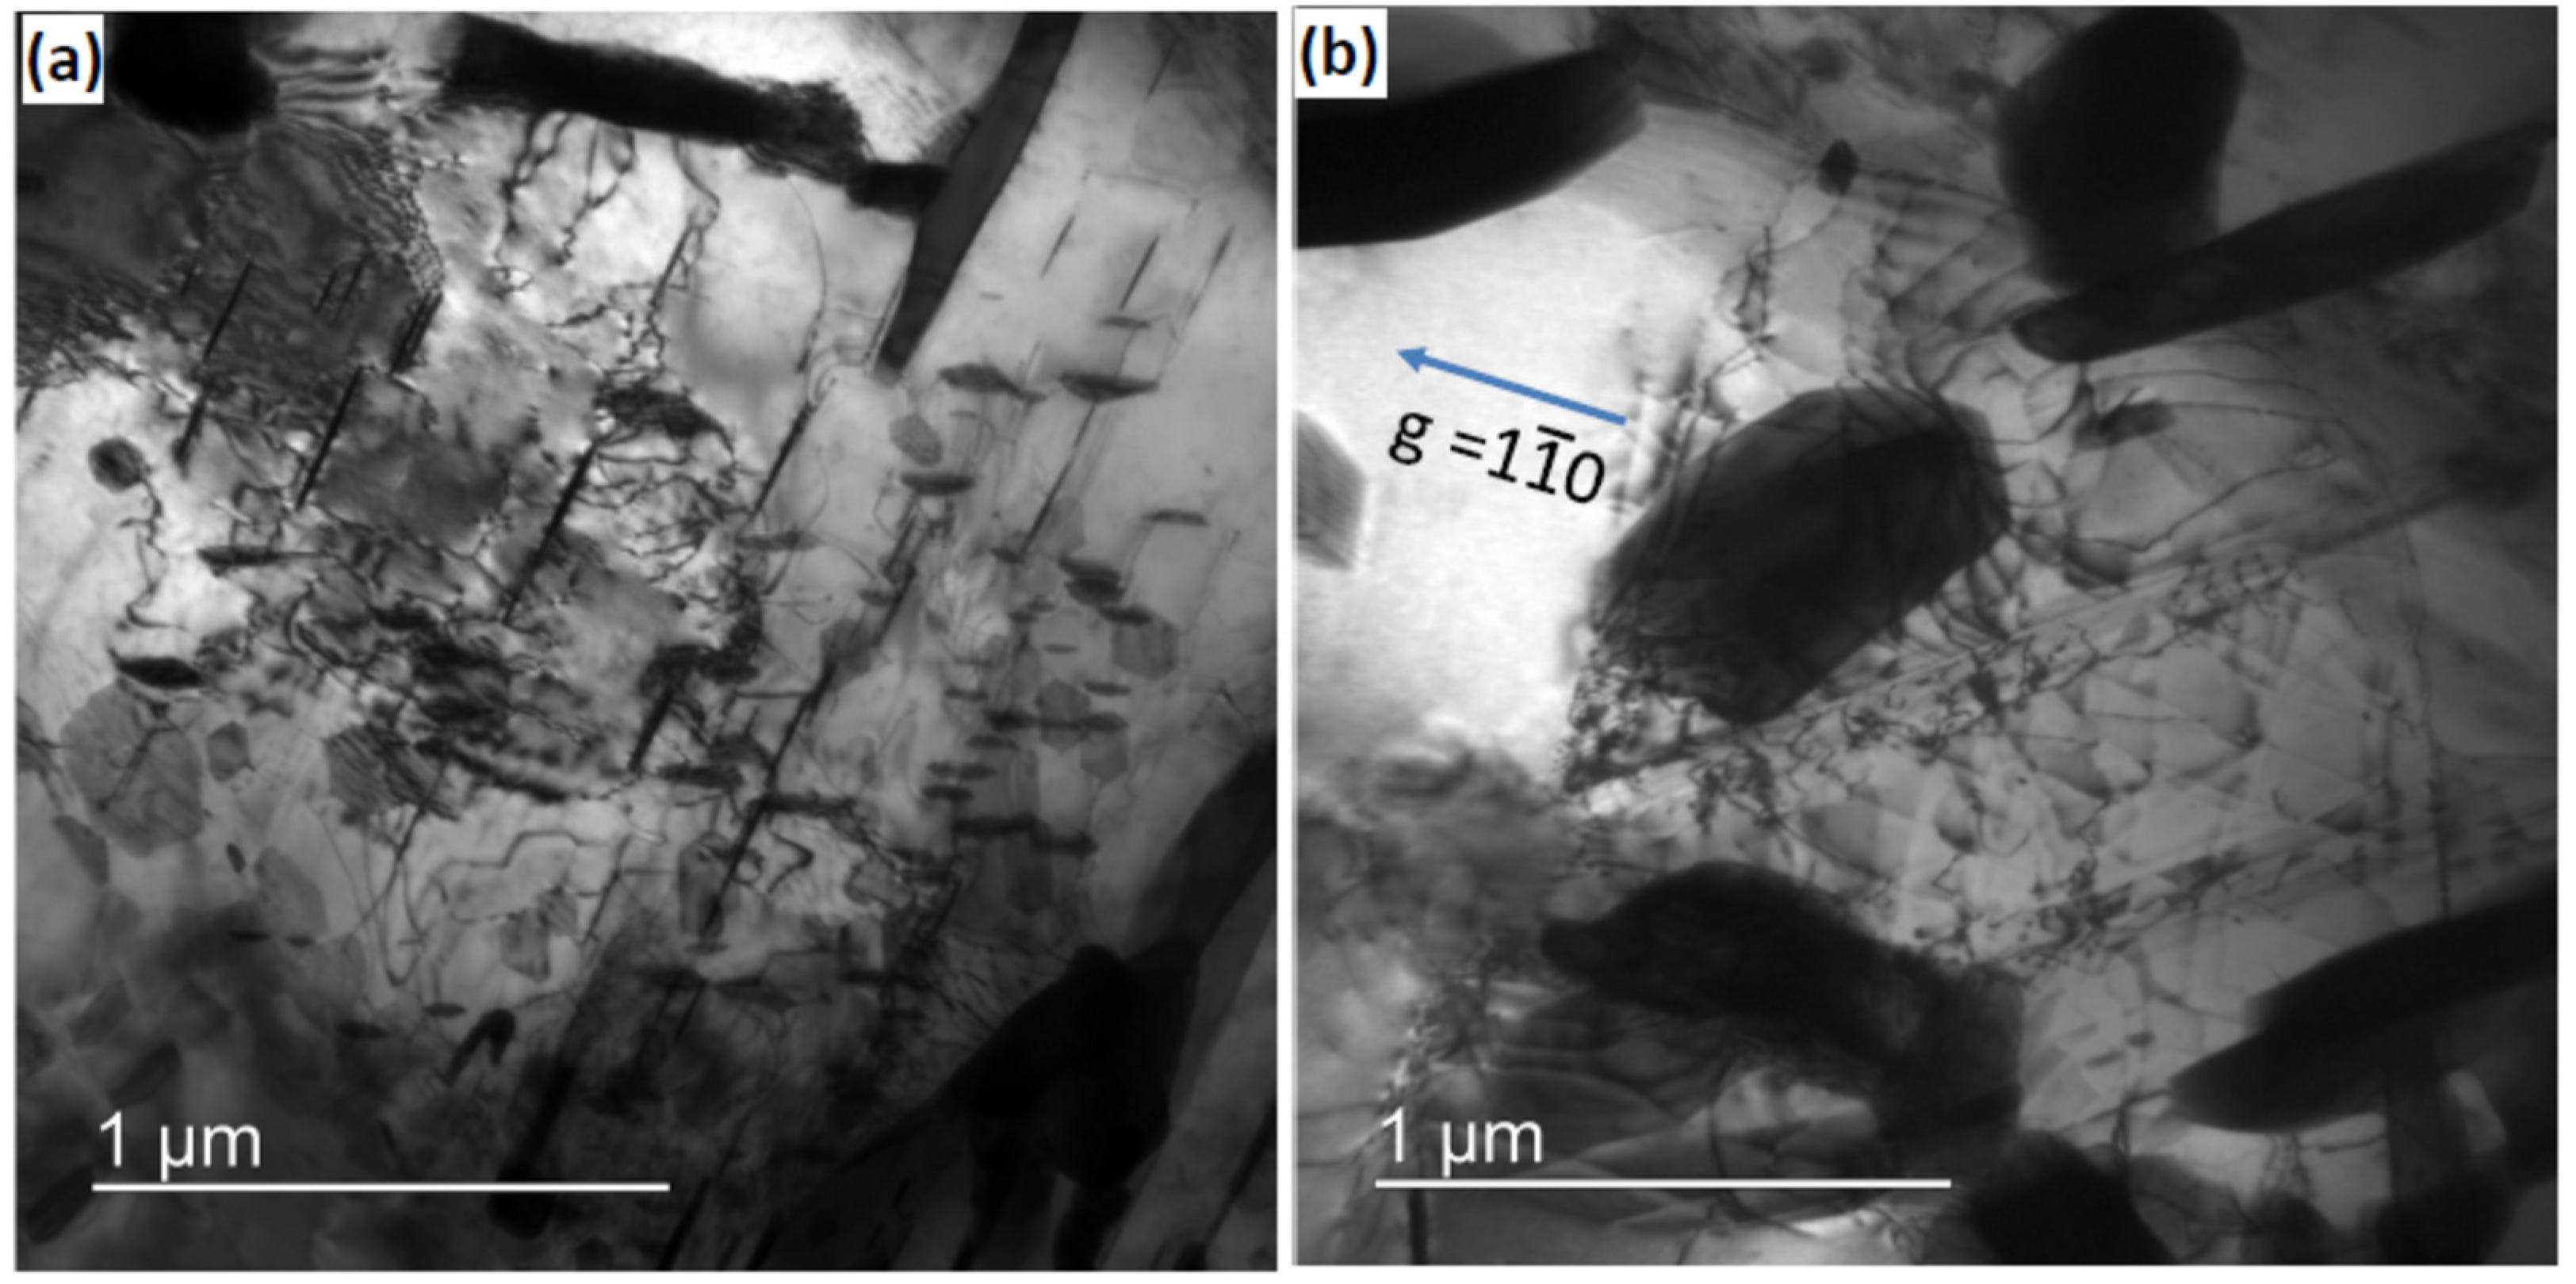
In spite of a tendency for lamellar structure instability of the Ta-rich alloy, the creep resistance of the Ta-rich alloy is superior to that of the Nb-rich alloy. The microstructural attribute to such behavior has been found to be the dislocation pinning of precipitated second phases, in particular the τ-phase (Ti4Al3Ta).

Author Contributions

Conceptualization, C.M.; investigation, methodology, formal analysis, data curation, V.S., C.M., S.R., C.M.O. and R.S.; writing—original draft preparation, V.S. and C.M.; supervision, C.M. and P.G.; funding acquisition, P.G. All authors have read and agreed to the published version of the manuscript.

Funding

This research was funded by Defence Research and Development Organization (DRDO), Government of India.

Data Availability Statement

The data will be made available on reasonable request.

Acknowledgments

The authors are also grateful to Deepak Kumar, Kaling Sahoo, DMRL for help in carrying out experiments.

Conflicts of Interest

The authors declare no conflict of interest. The funders had no role in the design of the study; in the collection, analyses, or interpretation of data; in the writing of the manuscript, or in the decision to publish the results.

References

  1. Appel, F.; Paul, J.D.H.; Oehring, M. Gamma Titanium Aluminide Alloys: Science and Technology; Wiley-VCH Verlag GmbH & Co: Weinheim, Germany, 2011. [Google Scholar]
  2. Kardashova, S.I.; Yu, A.; Razumovskii, L.; Razumovskii, I.M. Diffusion coarsening of the lamellar structure in two-phase Ti-47.5 at.% Al intermetallic alloy. Acta Metall. Mater. 1994, 42, 3341–3348. [Google Scholar] [CrossRef]
  3. Bartholomeusz, M.F.; Wert, J.A. The effect of thermal exposure on microstructural stability and creep resistance of a two-phase TiAl/Ti3Al lamellar alloy. Metall. Mater. Trans. A 1994, 25, 2371–2381. [Google Scholar] [CrossRef]
  4. Huang, S.C. Alloying Consideration in Gamma-Based Alloys, Structural Intermetallics; Darolia, R., Lewandowski, J.J., Liu, C.T., Martin, P.L., Miracle, D.B., Nathal, M.V., Eds.; TMS: Warrendale, PA, USA, 1993; pp. 299–307. [Google Scholar]
  5. Xiang, L.L.; Zhao, L.L.; Wang, Y.L.; Zhang, L.Q.; Lin, J.P. Synergistic effect of Y and Nb on the high temperature oxidation resistance of high Nb containing TiAl alloys. Intermetallics 2012, 27, 6–13. [Google Scholar] [CrossRef]
  6. Sienkiewicz, J.; Kuroda, S.; Murakami, H.; Araki, H.; Gizynski, M.; Kurzydlowski, K.J. Microstructure and Oxidation Performance of TiAl-(Cr,Nb,Ta) Coatings Fabricated by Warm Spray and High-Velocity Oxy-Fuel Spraying. J. Thermal. Spray Tech. 2019, 28, 563–579. [Google Scholar] [CrossRef] [Green Version]
  7. Singh, V.; Kumar, A.; Mondal, C.; Bhattacharjee, P.P.; Ghosal, P. Hot deformation of high-Nb-containing γ-TiAl alloy in the temperature range of 1000–1200 °C: Microstructural attributes to hot workability. SN Appl. Sci. 2019, 1, 366. [Google Scholar] [CrossRef] [Green Version]
  8. Lapin, J.; Pelachová, T.; Dománková, M. Creep behaviour of a new air-hardenable intermetallic Ti-46Al-8Ta alloy. Intermetallics 2011, 19, 814–819. [Google Scholar] [CrossRef]
  9. Clemens, H.; Smarsly, W. Light-weight intermetallic Titanium aluminides-status of research and development. Adv. Mater. Res. 2011, 278, 551–556. [Google Scholar] [CrossRef] [Green Version]
  10. Imayev, V.; Imayev, R.; Khismatullin, T.; Oleneva, T.; Gühter, V.; Fecht, H.-J. Microstructure and processing ability of β-solidifying TNM-based γ-TiAl alloys. Mater. Sci. Forum 2010, 638–642, 235–240. [Google Scholar] [CrossRef]
  11. Wang, J.G.; Nieh, T.G. Creep of a beta phase-containing TiAl alloy. Intermetallics 2000, 8, 737–748. [Google Scholar] [CrossRef]
  12. Gabrisch, H.; Stark, A.; Schimansky, F.-P.; Wang, L.; Schell, N.; Lorenz, U.; Pyczak, F. Investigation of carbides in Ti–45Al–5Nb–xC alloys (0 ≤ x ≤ 1) by transmission electron microscopy and high energy-XRD. Intermetallics 2013, 33, 44–53. [Google Scholar] [CrossRef] [Green Version]
  13. Available online: https://www.ebsd.com/ois-ebsd-system/pseudosymmetry-correction (accessed on 23 November 2021).
  14. Rauch, E.F.; Véron, M.; Portillo, J.; Bultreys, D.; Maniette, Y.; Nicolopoulos, S. Automatic Crystal Orientation and Phase Mapping in TEM by Precession Diffraction. Microsc. Anal. 2008, 22, s5–s8. [Google Scholar]
  15. Singh, V.; Mondal, C.; Bhattacharjee, P.P.; Ghosal, P. Microstructural Characterization by Automated Crystal Orientation and Phase Mapping by Precession Electron Diffraction in TEM: Application to Hot Deformation of a γ-TiAl based Alloy. Microsc. Micanalysis 2019, 25, 1457–1465. [Google Scholar] [CrossRef] [PubMed]
  16. Singh, V.; Mondal, C.; Sarkar, R.; Bhattacharjee, P.P.; Ghosal, P. Compressive creep behavior of a γ-TiAl based Ti–45Al–8Nb–2Cr-0.2B alloy: The role of β(B2)-phase and concurrent phase transformations. Mat. Sci. Eng. A 2020, 774, 138891. [Google Scholar] [CrossRef]
  17. Singh, V.; Sahoo, K.; Mondal, C.; Satyanarayana, D.V.V.; Ghosal, P. High Temperature Compressive Creep Properties of Ti–45Al–8Ta–2Cr-0.2B-0.2C Alloy for Aerospace Applications; DMRL Technical Report, DMRL-EMG-234-2020; DMRL: Hyderabad, India, October 2020. [Google Scholar]
  18. Herzig, C.H.; Przeorski, T.; Mishin, Y. Self-diffusion in γ-TiAl: An experimental study and atomistic calculations. Intermetallics 1999, 7, 389–404. [Google Scholar] [CrossRef]
  19. Lapin, J.; Pelachová, T.; Witusiewicz, V.T.; Dobročka, E. Effect of long-term ageing on microstructure stability and lattice parameters of coexisting phases in intermetallic Ti–46Al–8Ta alloy. Intermetallics 2011, 19, 121–124. [Google Scholar] [CrossRef]
  20. Lapin, J.; Gabalcová, Z.; Pelachová, T.; Bajana, O. Microstructure and mechanical properties of a cast intermetallic Ti-46Al-8Ta alloy. Mater. Sci. Forum 2010, 638–642, 54–60. [Google Scholar] [CrossRef]
  21. Witusiewicz, V.T.; Bondar, A.A.; Hecht, U.; Velikanova, T.Y. The Al–B–Nb–Ti system: IV. Experimental study and thermodynamic re-evaluation of the binary Al–Nb and ternary Al–Nb–Ti systems. J. Alloys Compd. 2009, 472, 133–161. [Google Scholar] [CrossRef]
  22. Bendersky, L.A.; Boettinger, W.J.; Bruton, B.P.; Biancaniello, F.S. The formation of ordered ω-Ordered related phases in alloys of composition Ti4Al3Nb. Acta Metal. Mater. 1990, 38, 931–943. [Google Scholar] [CrossRef]
Figure 1. Backscattered SEM image, EBSD-band contrast image, and corresponding XRD pattern of the as-cast pancakes of (ac) Ti-45Al-8Nb-2Cr-0.2B alloy, and (df) Ti-45Al-8Ta-2Cr-0.2B-0.2C alloy.
Symmetry 14 00399 g001
Figure 2. Typical compressive creep curves at 800 °C, and 850 °C temperatures for different applied stress levels for (a) Ti-45Al-8Nb-2Cr-0.2B alloy, and (b) Ti-45Al-8Ta-2Cr-0.2B-0.2C alloy.
Symmetry 14 00399 g002
Figure 3. (a,c) EBSD band contrast map, and corresponding phase map of the Ti-45Al-8Nb-2Cr-0.2B alloy sample subjected to creep deformation at 800 °C/150 MPa. (b,d) same for the sample subject to creep at 850 °C/125 MPa.
Symmetry 14 00399 g003
Figure 4. (a,c) EBSD band contrast map, and corresponding phase map of the Ti-45Al-8Ta-2Cr-0.2B-0.2C alloy sample subjected to the creep deformation at 800 °C/200 MPa. (b,d) same for the sample subject to creep at 850 °C/150 MPa.
Symmetry 14 00399 g004
Figure 5. Bright field TEM images showing development of microstructures of the Ti-45Al-8Nb-2Cr-0.2B alloy samples crept at (a) 800 °C/150 MPa, and (b) 850 °C/125 MPa. (c,d) Same for the alloy Ti-45Al-8Ta-2Cr-0.2B-0.2C crept at 800 °C/200 MPa, and 850 °C/150 MPa, respectively.
Symmetry 14 00399 g005
Figure 6. (a) Index quality map acquired through ACOM technique of the Ti-45Al-8Ta-2Cr-0.2B-0.2C crept at 800 °C/200 MPa. (bd) Corresponding IPF map, phase map, and KAM map, respectively.
Symmetry 14 00399 g006
Figure 7. (a) Index quality map acquired through ACOM technique of the Ti-45Al-8Ta-2Cr-0.2B-0.2C crept at 850 °C/150 MPa. (bd) Corresponding IPF map, phase map, and KAM map, respectively.
Symmetry 14 00399 g007
Figure 8. Bright field TEM images showing development of dislocation structures of the Ti-45Al-8Ta-2Cr-0.2B-0.2C crept at (a) 800 °C/200 MPa, and (b) 850 °C/150 MPa utilizing a near two-beam imaging condition.
Symmetry 14 00399 g008
Figure 9. Orientation relationship (OR) between the τ-phase and surrounding γ-matrix of the Ti-45Al-8Ta-2Cr-0.2B-0.2C crept at 800 °C/200 MPa.
Symmetry 14 00399 g009
Figure 10. (a) EBSD-IPF map, and (b) BC map of the Ti-45Al-8Ta-2Cr-0.2B-0.2C crept at 800 °C/200 MPa. (c) Selected portion of the phase map (marked region of (b)) shows the coexistence of α2 and τ-particles as transformation products. (d,e) Corresponding EDS patterns of α2 and τ-particles, respectively.
Symmetry 14 00399 g010
Figure 11. (a) Index quality map acquired through ACOM technique of the Ti-45Al-8Nb-2Cr-0.2B crept at 800 °C/150 MPa. (bd) Corresponding IPF map, phase map, and KAM map, respectively.
Symmetry 14 00399 g011
Publisher’s Note: MDPI stays neutral with regard to jurisdictional claims in published maps and institutional affiliations.

