Brief Report

EEG Power Band Asymmetries in Children with and without Classical Ensemble Music Training

1
Centre for Human Brain Health (CHBH), Department of Psychology, University of Birmingham, Birmingham B15 2TT, UK
2
Neuroscience of Cognition, Imagination and Emotion Research (NICER) Laboratory, Carleton University, Ottawa, ON K1S 5B6, Canada
3
Department of Pediatrics, University of Ottawa, Ottawa, ON K1N 6N5, Canada
4
Central Hospital of Eastern Ontario Research Institute, Ottawa, ON K1H 5B2, Canada
5
Movement and Cognition Laboratory, Faculty of Social Welfare and Health Sciences, University of Haifa, Haifa 3498838, Israel
6
Department of Clinical Neurophysiology, Institute of Neurology and Neurosurgery, University of the Medical Sciences of Havana, Havana 11300, Cuba
7
Department of Neuroscience, Carleton University, Ottawa, ON K1S 5B6, Canada
*
Author to whom correspondence should be addressed.
Symmetry 2022, 14(3), 538; https://doi.org/10.3390/sym14030538
Submission received: 21 December 2021 / Revised: 17 February 2022 / Accepted: 2 March 2022 / Published: 7 March 2022
(This article belongs to the Special Issue Neuroscience, Neurophysiology and Asymmetry)

Abstract

:
Much evidence shows that music training influences the development of functional brain organization and cerebral asymmetry in an auditory-motor integrative neural system also associated with language and speech. Such overlap suggests that music training could be used for interventions in disadvantaged populations. Accordingly, we investigated neurofunctional changes associated with the influence of socially based classical ensemble music (CEM) training on executive auditory functions of children from low socioeconomic status (LSES), as compared to untrained counterparts. We conducted a novel ROI-focused reanalysis of stimulus-locked event-related electroencephalographic (EEG) band power data previously recorded from fifteen LSES children (9–10 years), with and without CEM, while performing a series of auditory Go/No-Go trials (involving 1100 Hz or 2000 Hz tones). An analysis of collapsed Alpha2, Beta1, Beta2, Delta, and Theta EEG bands showed significant differences in increased and decreased left asymmetry between the CEM and the Comparison group in key frontal and central electrodes typically associated with learning music. Overall, in Go trials, the CEM group responded more quickly and accurately. Linear regression analyses revealed both positive and negative correlations between left hemispheric asymmetry and behavioral measures of PPVT score, auditory sensitivity, Go accuracy, and reaction times. The pattern of results suggests that tone frequency and EEG asymmetries may be attributable to a shift to left lateralization as a byproduct of CEM. Our findings suggest that left hemispheric laterality associated with ensemble music training may improve the efficiency of productive language processing and, accordingly, may be considered as a supportive intervention for LSES children and youth.

1. Introduction

Playing instrumental music is associated with activity in numerous bilateral brain regions of an anatomically well-characterized auditory-motor integration network [1,2,3]. Much evidence shows that music training can play a role in the development of the functional organization of this network in individuals who experience such learning. Notably, musicians often show volumetric enlargement of specific and relevant cerebral structures [1,4,5,6]. A pivotal early study [6] reported that the corpus callosum—the dense bundle of white matter connecting the right and left hemispheres—tended to be larger in musicians as compared to non-musicians. It was inferred that such a difference was a consequence of intensive and repeated sensorimotor information transfer between the brain’s left and right motor regions, since learning to play a musical instrument necessitates the coordination of activity across right and left side in both hands. However, the difference was only significant if musical training begun prior to 7 years of age.
Since then, much evidence has accumulated confirming that structural and functional hemispheric asymmetry can be brought about by music training [7], but the puzzle is more complex than earlier findings suggested, since task-dependency, type of instrument played, and environmental factors, including social communication, can all be linked to brain asymmetry [5,7,8]. Several studies have implicated specific brain regions that show left lateralization attributed to certain types of music experience. Ellis and colleagues [9] found greater left supramarginal gyrus (SMG) activation, relative to right, in musicians. They further found a correlation between left SMG activation and hours of practice. Herdener et al. [10] also reported similar results, finding that drummers showed higher left SMG activity during a rhythm task while non-musicians did not. That study additionally highlighted that music training-mediated activation differences in SMG may play a role in linguistic processing, implying similarities between language and musical syntax. Beyond SMG, other studies investigating left-lateralized musical differences between musicians and non-musicians have found greater activation of the supplemental motor regions, the left prefrontal regions, and broadly the left hemisphere (in the case of general musical ability) [11,12]. In this context, the findings on the planum temporale, a triangular cortical surface region located caudally relative to the primary auditory cortex of Heschl, stand out. This region supports the integration of the types of auditory stimuli largely processed in Heschl’s gyri. The left planum is typically larger in surface than the right, at least in right-handers [13]. However, this asymmetry is altered by musical training and practice in that musicians show larger left asymmetries compared to non-musicians [6,14], and as demonstrated by the evidence on brain morphology, it is clearly associated with critical developmental periods [15].
Converging evidence also suggests that the observed volumetric enlargements might have implications on cognitive functions [16,17]. Engaging in music lessons and acquiring musical abilities have also been associated with improvements in verbal memory, pitch perception, speech detection, perception, and prosody detection as early as preschool age [18,19,20]. The connection between music and these neurocognitive abilities is important for the optimal development of children living in socioeconomic disadvantage.
Children from low socioeconomic status (LSES) show relatively more challenges in the acquisition of mainstream languages compared to children from higher socioeconomic status (HSES), possibly relating to different working memory developmental trajectory, moderated by environment and social factors [21]. Aspects presumedly related to a differential growth rate of efficient maturation in information processing have also been supported by the most comprehensive research synthesis [22] showing that LSES children and adults are relatively less lateralized than their HSES counterparts. Given the neurofunctional overlaps between music and language, it seems plausible that interventions that aim to enhance musical ability may also strengthen efficiency in language and working memory skills by targeting sound perception.
There is a unique neurofunctional similarity between the literatures of music cognition/perception and SES in that both have been implicated in hemispheric laterality or asymmetry [10,23,24]. Raizada et al. [24] found specifically that the extent of speech-related lateralization in the left inferior frontal gyrus (IFG) is positively correlated with SES. In addition, research has implicated a positive correlation between language development and SES, making the latter a suitable variable of interest when investigating the effect of music training on aspects of language and sound perception [25,26]. Language development or experience is also correlated with lateralized activity due to bilingual exposure [27], inviting the suggestion that left-lateralization patterns may be enhanced because of higher SES and/or linguistic experience and processing or, even yet, music training. Thus far, however, these separate streams of literature pertinent to the development of brain asymmetry have not been fully integrated.
A clear link between music and SES-related laterality is that the planum temporale has been implicated not only to play a crucial role for music training but also for phonological skills, given that both left planar asymmetry and phonological skills increase with SES. That is, the higher the family social status, the larger the left planum temporale asymmetry and, at the same time, the better the phonological skills [22]. The frequent occurrence of musical overlap with other processes of language, phonology, and syntax provides strong justification for using musical training, particularly when working with LSES groups, since their differential efficiency in these processes clearly implies relatively less left-lateralization [10,22]. Accordingly, the aim of our investigation was to clarify whether a particular socially based music training could influence evaluation and responses to sounds, by focusing on the putative asymmetrical nature of the underlying information processing and the corresponding interhemispheric dynamics.
Here, we present an exploratory analysis comparing the EEG band frequency activity recorded from ensemble-music trained and untrained children during an auditory Go/No-Go task—which has been widely used to assess aspects of auditory executive functions (including decision making, working memory, attention, and behavioral inhibition) [28,29,30]. We explored the possibility that different patterns of EEG asymmetry (i.e., lateralization) would be observed by comparing children with classical ensemble music training (CEM) and their untrained counterparts in relation to fronto-centro-temporal sites that are also associated with language and speech perception. As the basis for experimental intervention, we selected a community-based social classical music training program, “Orkidstra” (https://orkidstra.ca/, accessed on 20 December 2021) designed specifically for inner city LSES children and adapted from the El Sistema method, which has shown effects on academic achievement and cognitive development (see review in [31]).
We hypothesized that different patterns of EEG asymmetry would be observed by comparing children with this classical ensemble music (CEM) training and their untrained counterparts in relation to specific electrode-sites of interests. If asymmetry patterns reflect differences in sound perception (i.e., global or local), pitch memory, and inhibitory ability, and language possessing efficiency, the CEM group should show more pronounced relative left EEG activity asymmetries in frontal and central electrodes in No-Go and Go trials during periods of stimulus evaluation and of response planning and execution, as differentiated by the well-established P300 event-related potential (ERP) signature. In contrast, the Comparison group should instead show bilateral or right-lateralized patterns, reflecting the commonly pattern found in the literature [22] of less left-lateralized processing and, thus, a differing efficiency in the corresponding auditory-spatial processes. Therefore, our general guiding hypothesis was that a left-lateralized patterning in LSES children, which is normally associated with higher SES, may be the result of neurological processing changes that are a byproduct of social music training.

2. Materials and Methods

To test our hypotheses, we performed a reanalysis of continuous EEG collected in a previous ERP study [32]; the present results had not been previously reported/published.
Our investigation focused on key cortical nodes in the music auditory–motor integrative network that would correlate with the asymmetrical nature of music training influenced perception. Musical sounds are processed in the auditory cortex, represented as a specific code with its own syntactic features, then transferred to other cortical areas that use this code to perform and anticipate harmonic and melodic changes, as well as feelings, memory, and music reading. The most important cortical areas involved (with approximate electroencephalographical (EEG) electrode mapping) are represented in Figure 1. These EEG electrodes and associated cortical regions of interest (ROI) were targeted in our analysis with a focus on symmetrical electrode pairings, utilized to identify the hypothesized laterality effect.

2.1. Sampling and DATA Selection

Participants included in the original database were recruited from inner city children in Ottawa’s downtown area, and they were involved in a community-based social experimental intervention program targeting children from low SES families (i.e., Orkidstra, https://Orkidstra.ca/, accessed on 20 December 2021). To participate in the program, families need to meet the Statistic’s Canada low income cutoffs (LICOs) [33]. LICOs are income thresholds below which families devote a larger share of income to the necessities of food, shelter, and clothing than the average family would. The approach essentially involves estimating an income threshold at which families are expected to spend 20 percentage points more than the average family on food, shelter, and clothing. These cutoffs are not a fixed poverty line but their estimation rather varies by weighting 7 categories of family sizes and 5 categories of different populations of the area of residence across Canada. To quantify a relatively more precise SES level corresponding to each child’s family, we administered the Adapted Hollingshead Socioeconomic Status Inventory [34] to parents; this inventory is a score derived by an algorithm that creates a weighted average rank on the basis of reported income range, occupation, parental level of education, and neighborhood quality. The ranks are then referenced in relation to the quantile categories of the entire SES distribution (categories I to V). All participating families fell on the lowest bottom quintile, that is, category V.
The program is designed for children between 5 and 18 to create a sense of community for families and to promote the importance of music by creating the opportunity to learn a musical instrument and perform in an orchestra. Children aged 9 to 12 were recruited from Orkidstra’s instrumental streams (henceforth called CEM group), and a Comparison group was also recruited from the same residential areas. The database included 30 families that were initially recruited and 21 children (and parents) who attended the scheduled appointments for the screening session and completed the experimental sessions. The parent/guardian of children in the study signed informed consent forms and children provided verbal assent.
All children underwent developmental screening, including the following test batteries: Depression Anxiety Stress Scale [35]; Edinburgh Handedness Inventory [36]; Music Experience Questionnaire (MEQ) [37]; Peabody Picture Vocabulary Test–IV [38]; Perceived Stress Scale [39]; Ruminative Responses Scale [40]; and, finally, the Strengths and Difficulties Questionnaire [41]. Following match sampling, the final sample obtained from the screened and tested pool comprised 16 children (i.e., CEM trainees of approximately same age (n = 8; 4 females; mean age = 10.2 (SD = 1.3) vs. the Comparison group (n = 8; 4 females; mean age = 9.8 (SD = 0.7)). The results of the battery and other demographic data are presented in Table 1. The threshold for significance was set at p < 0.05, and an FDR Benjamini–Yekutieli Procedure was performed on the resulting p values [42,43].

2.2. Auditory Screening

A pediatric hearing test was performed to assess the normal hearing of the participants using a GS1 61 audiometer (Grason-Stadler, Eden Prairie, MN, USA). This ensured that tones could be heard between −10 dB and 25 dB. At 20 dB sound pressure level, the tones were presented between 500 and 4000 Hz in each of the left and right ears. All participants were found to have hearing in the normal range, with no group-related differences. Children were also assessed for visual acuity using the Snellen chart for distance vision and the Rosenbaum chart for near vision. Color vision was assessed using the Ishihara test for color blindness [44]. All children had normal or corrected-to-normal vision.

2.3. Auditory Go/No-Go Paradigm

The auditory Go No-Go task was carried out with continuous recording with an EEG cap fitted to each participant. Participants were presented with four blocks of practice trials, each with 10 trials per block. The first of the blocks involved a Go trial and the trial simultaneously presented visual feedback of a flashing “GO!” on a screen. Following the first practice block, the remaining blocks (practice and trial) did not contain a visual cue. Participants were invited to focus on a white cross fixed on the screen and to stay as still as they were able. They were asked to respond to the green button a response pad using their dominant hand. For all blocks, the participants were requested to attend to two tones (1100 Hz and 2000 Hz) but only to respond with a button press if the tone matched the predesignated tone at the beginning of the block. If the tone did not match the predesignated tone, they were asked to withhold the button press response (the No-Go task).
The resultant paradigm comprised the presentation of all the following experimental conditions: 1100 Hz stimulus assigned Go, 1100 Hz stimulus assigned No-Go, 2000 Hz assigned Go, and 2000 Hz assigned No-Go. The participants were asked to be as quick and accurate as possible in their responses. Each stimulus tone lasted 100 ms with an interstimulus interval varying between 1000 and 1400 ms. The Go trial was presented 70% of the time, while the No-Go was presented 30% of the time. Four blocks of 100 trials totaling 400 trials were presented with an equal distribution of 1100 Hz and 2000 Hz Go trials throughout the blocks. The order of presentation of Go and No-Go tones was randomly presented across blocks for each participant. The predesignated tone was repeated prior to testing blocks if the participant requested it.

2.4. EEG Acquisition and Processing

The EEG recording utilized a 32-channel Brain Vision actiCHAP cap (acti-CHAP, Brain Vision LLC, Morrisville, NC, USA). Electrodes were inserted into the correct location in the cap using a referential montage and the 10–20 International system. Two drop-down electrodes were placed outer canthus of the eyes, and a ground electrode was placed on the participant’s collarbone (left).
EEG channels were amplified with a gain of 10, range of ±200 μV (400 μV peak to peak), accuracy of 29.80 nV/LSB, low pass filter at 500 Hz using SynAmps RT, and a sampling rate of 1 kHz. For acquisition a Butterworth filter, 6 dB per octave, 3 dB down at 500 Hz, was utilized. All electrodes were referenced to a common average reference. Resting-state EEGs were recorded pre-experiment and postexperiment, with 2 min eyes open and 2 min eyes closed. These were unremarkable in the participants. EEG electrode locations were mapped using Brain Electric Source Analysis (BESA Version 6). Trials with excessive deflection (>100 μV or <−100 μV) (non-ocular) were excluded from averaging.
Eye-movement calibration was carried out prior to task blocks. Ocular correction utilizing Principal Component Analysis and BESA Surrogate Model (BR_Brain Regions_LR.bsa) was performed. Artificial corrections were performed for eye blinks, horizontal and vertical eye movement, and interpolation of EEG raw data with excessive noise. These corrections were performed based on the 32-channel configuration, with a fit threshold of artifact classification to a BESA model of R2 ≥ 0.80. The rejected trials made up less than 10% after artifact correction and rejection. Post-data acquisition average signals from electrodes were amplified with filter settings at 0.15 Hz high pass and 100 Hz low pass. Eye movements (horizontal) were recorded with electrodes from a split bipolar electrode on the outer canthi at HEOG. Impendence remained under 5 kΩ.
Due to missing and excessive background noise, data collected from one child in the CEM group had to be excluded. (Notice that Table 1 is based on the reduced sample).
Fast Fourier transform (FFT) was applied to the 1000 Hz data to measure the event-related band power (ERBP) for epochs of 1000 ms from stimulus presentation (which defined the 0 ms mark and onset of each epoch). FFT was achieved using the power-in-bands function as implemented in BESA (BESA v.5.4.28; http://www.besa.de/, accessed on 20 December 2021). The resulting band frequencies were defined as follows: Delta (0.5–3.5 Hz), Theta (3.6–6.5 Hz), Alpha1 (6.6–8.5 Hz), Alpha2 (8.6–12.5 Hz), Beta1 (12.6–16.5 Hz), Beta2 (16.6–29.5 Hz), and Gamma (29.5–40 Hz). For all bands, all measured averaged values were expressed as µV2. Band frequency extraction was locked on two time intervals: 300–500 ms and 500–1000 ms. These two time intervals corresponded to two critical waveform windows, respectively, for P300 and post-P300 identified in the same subjects in the grand ERP averages analyzed in our previous studies [32,45].

2.5. Data Analysis

Statistical analyses of both behavioral and pre-processed EEG data were carried out using IBM SPSS Software (Version 27). All statistical analysis followed a blinded preset pipeline detailed in Section 2.6.1, Section 2.6.2, Section 2.6.3, Section 2.6.4 and Section 2.6.5, with groups identified by arbitrary numerical codes. Group categories and variables were all set at onset and did not change after the initial coding of the data. The investigators conducting the analysis did not have any knowledge of which group corresponded to which code until the pipeline was completed and outputs of the results were produced.

2.6. Statistical Analysis Pipeline

Statistical analysis took a staged approach. Initially, behavioral data were analyzed (Section 2.6.1). Then, ROI pairs were all analyzed in a large-scale diagnostic approach, while not considering task and stimulus conditions (Section 2.6.2). Pairs that were found to be significant were then carried through to a targeted analysis that focused on experimental conditions within the ROI (Section 2.6.3). Subsequently, a follow-up analysis was carried out on single electrodes that differed between groups but did not yield significant differences among ROI pairs (Section 2.6.4). Lastly, stepwise multiple linear regression analysis was performed on behavioral and EEG data (Section 2.6.5).

2.6.1. Behavioral Analysis

The behavioral data and accuracy for Go trials (Go accuracy) and RTs were analyzed using two independent sample tests: either t-tests or Mann–Whitney U tests, where appropriate (depending on whether the normality assumption was satisfied or not). Pearson’s correlations were also used. For these analyses, we adapted the FDR correction assuming α = 0.10 on 3 comparisons; the resulting significance threshold was p = 0.066.

2.6.2. Diagnostic Preliminary EEG Analysis

A diagnostic General Linear Model (GLM) Repeated Measure (RM) analysis was conducted to compare effects amongst all EEG bands (Repeated factor: band frequency; independent factor: Group, CEM vs. Comparison). Alpha1 band data was excluded from our analysis due insufficient or missing data in most participants. In addition, the analysis revealed high multicollinearity and no interactions between group and frequency bands and no main effects of band frequency surviving FDR correction (for all runs, F(5,65) ≤ 3.812, all p’s were above FDR-p = 0.003). Therefore, in the subsequent stage, GML-RM models were run with EEG bands collapsed in one blocked variable in the following order: Delta, Theta, Alpha2, Beta1, Beta2, and Gamma.

2.6.3. Targeted EEG Analysis on ROI Pairs

Following our hypotheses, we conducted pairwise General Linear Model (GLM) Repeated Measures (RM) models contrasting the ROI pairs as identified in Figure 1. Consequently, we ran GLM-RM models including, as a repeated measure, the blocked EEG bands (2 levels: 1100 Hz and 2000 Hz) and as a between-subject factor the groups (2 levels: CEM vs. Comparison). Four distinct sets of five GLM-RM models were run: one for the P300 interval, the other for post-P300, and for Go and No-Go conditions, respectively. Because this was an exploratory study, we adopted a balanced non-overly conservative approach to correct for multiple testing (since there were 20 comparisons). Assuming a significance threshold of p = 0.10, the corrected threshold was derived from the average familywise False Discovery Rate (FDR) [46] was p = 0.052; therefore, we any p < 0.05 was considered significant.

2.6.4. Follow-Up Analysis on Single Electrodes in Left Hemisphere

Follow-up exploratory analyses examined single electrodes in the left hemisphere for which the pairwise contrasts did not yield significant results. For the latter analyses and to analyze accuracy rates and reaction times, we used parametric or non-parametric 2-independent samples tests. For these, we adapted the FDR correction assuming again that p = 0.10 on 3 comparisons; the resulting significance threshold was p = 0.066.

2.6.5. Behavioral-EEG Analysis

Multiple linear regression analyses were run using behavioral data and EEG data, with stepwise entry method, inclusion criteria of p < 0.05, and exclusion criteria of p > 0.10. Specifically, these models were run regressing EEG lateralization difference power values onto combined RTs, Go accuracy scores, PPVT scores, and auditory sensitivity across the groups, respectively. Again, given 20 comparisons and assuming a significance threshold of p = 0.10, any p < 0.05 was considered significant, as per FDR correction.

3. Results

3.1. Behavioral Results

3.1.1. Reaction Times and Accuracy in Go Trials

Mean accuracy in the Go trials was higher in the CEM group (89.80% SD = 18.38) than in the Comparison group (83.93%, SD = 18.99), but this difference was not significant. Reaction times revealed that the CEM group was consistently faster than the Comparison, which was significant for Go trials with the 2000 Hz tone (t(13) = 2.150; p = 0.052; d = 1.113) but not for those with the 1100 Hs tone (t(13) = 1.325, p = 0.210, d = 0.686). Moreover, importantly, this RT difference was marginally significant for the mean performance collapsed across trials for both tones (t(13) = 1.938; p = 0.076; d = 1.003) (see Figure 2).

3.1.2. Intercorrelations between Behavioral and Screening Measures

Accuracy in the Go trials was inversely related to RTs for the 1100 Hz tone (r(15) = −0.713, p = 0.003, d = 2.016) and also inversely correlated with collapsed RTs (r(15) = −0.511, p = 0.051, d = 1.189), indicating that faster response generally corresponded to more accurate performance (indeed to confirm this, when RTs for both 1100 and 2000 Hz were regressed as a block-combined variable onto Go accuracy, this multiple regression model confirmed a strong predictive effect of speed on accuracy (Adjusted R2 = 0.573, F(2,12) = 10.385; p = 0.002, d = 0.757).
Because they could potentially provide additional insight into the patterns of results, we also ran correlations between Go Accuracy and then combined RTs and the scores from two relevant screening behavioral measures, PVVT (measuring receptive vocabulary and semantic lexical memory) and auditory sensitivity (collapsed across all hearing screening trials and tone stimuli, i.e., 500, 1000, 2000, and 4000 Hz). While PPVT scores were not correlated with Go Accuracy (r(15) = 0.362, p = 0.204, d = 0.776) or combined RTs (r(15) = −0.337, p = 0.238, d = −0.814), auditory sensitivity was strongly correlated with Go Accuracy (r(15) = 0.668, p = 0.005, d = 1.795) and marginally with combined RTs (r(15) = −0.428, p = 0.111, d = 0.947). These results offer a first insight that performance in the Go/No-Go task was related to auditory sensory and attention processes rather than semantic and lexical aspects of language.

3.2. EEG Results

3.2.1. Contrasts Comparing ROI Pairs

As hypothesized, we found a left-lateralization effect between groups for the contrast FC1 vs. FC2 in the No-Go trials at the post-P300 window (see Top Panel of Figure 3). The CEM group showed significant mean left asymmetry (expressed as mean difference EEG power values in Figure 3) as opposed to the opposite mean right asymmetry in the Comparison group (F(1,13) = 5.307, p = 0.038, d = 1.281). For the C3 vs. C4 contrast, we found an interaction in the Go trials at the P300 window (see Bottom Panel of Figure 3) between Group and tone frequency (F(1,13) = 7.629, p = 0.016, d = 1.536), showing that mean EEG responses were left-lateralized in the CEM group for both tone frequencies, whereas left-lateralization was apparent in the Comparison group only in relation to 2000 Hz tones.
Additionally, for the post-P300 No-Go trials, we found a reduction in mean EEG power in the left Centroparietal pair for 1100 Hz tones in the CEM group relative to Comparison (2.535 vs. 3.734; F(1,13) = 5.844, p = 0.031, d = 1.344).
No other electrode pairs contrasts yielded significant effects.

3.2.2. Follow up Focused Contrasts on Single Electrodes

The follow-up exploratory single-electrode analysis for T7, in both Go and No-Go trials at the P300 window, revealed lower left mean EEG power in the CEM group again as opposed to the Comparison group in response to both tones (1.925 vs. 2.435; F(1,13) = 4.985, p = 0.044, d = 1.241). A Mann–Whitney U test revealed that, during No-Go, at the P300 window, the CEM group showed higher left Theta power in F3 than the Comparison group for both stimulus tones (10.45 vs. 6.90; Z = 2.043; p = 0.041, d = 1.242).

3.3. Behavioral-EEG Results

Stepwise regression models of lateralization difference scores of EEG power revealed distinctive patterns of relationships between EEG lateralization and different behavioural and screening outcomes, i.e., Go accuracy, combined RTs, PPVT, and auditory sensitivity. Table 2 shows the results of all significant or marginally significant and valid (non-null) stepwise multiple regression models (relative to FDR significance threshold) including non-redundant, contributing frequency bands. In particular, the table reports unstandardized β coefficients (in parenthesis, next to corresponding frequency band) that indicate the direction of lateralization difference (again as above computed as Left–Right), whereby, a positive regression coefficient indicates a left lateralization effect while a negative one indicates a right lateralization effect.
Results showed mixed patterns of right and left lateralization effects in different bands for RTs and accuracy in C3 for the Go trials within the P300 window. Importantly, however, they also showed a clear differential pattern for PPVT and auditory sensitivity, as the latter showed significant and marginally significant associations with left-lateralization for EEG bands usually linked to attention (theta and beta 1) at C3 in the P300 window. In contrast, PPVT scores were associated with right-lateralization difference scores at FC in the post-P300 window. In the latter condition and window, auditory sensitivity showed an association with right-lateralized slow waves (delta).

4. Discussion

Table 3 summarizes the most salient findings of the present study.
In summary, while performing a Go/No-Go task, children participating in a socially based classical ensemble music training experimental intervention program showed, overall, a more prominent left EEG power lateralization in most of the electrodes corresponding to the critical nodes of a hypothesized auditory–motor music network. This corresponded with CEM children being, overall, faster and more accurate than the Comparison group in responding to stimulus tones in the Go trials. Furthermore, while auditory sensitivity correlated with more left EEG power lateralization in the central electrodes during stimulus evaluation in Go trials (i.e., within the P300 window), semantic receptive language skills as measured by PPVT correlated with more right EEG power lateralization during the inhibition of response in the No-Go trials (i.e., within the post-P300 window). In other words, our results indicate a nuanced complex pattern whereby an increase in left EEG power lateralization seems to be associated with auditory and sound perception processes in concomitance with stimulus evaluation, as reflected by the P300 ERP signature. In contrast, a mixed increase in left and right EEG power lateralization, with varying combinations of band frequencies, was associated with the post-P300 interval of response inhibition, reflecting linguistic semantic processing (see Table 3).
The findings suggest that LSES children who engaged in ensemble music training showed a left lateralization shift in key nodes of the motor-auditory music neural network, compared to the less lateralized comparison counterparts and LSES individuals in the general population. It is well known that the neural network in question caters to several overlapping neurocognitive functions, especially some aspects of language. Consequently, we suggest that this shift in left hemispheric asymmetry function may benefit the processing efficiency of language and speech-related skills; therefore, it might be considered for supportive interventions in disadvantaged subpopulations of children and youth.
The pattern of our findings could be interpreted as converging evidence that the left-lateralized EEGs recorded in the CEM group at the FC1/FC2 pair (Top Figure 3) may reflect differing neural activity of the presupplementary motor complex (pre-SMA), implicating the left-lateralized resting state of the pre-SMA as described by Lou et al. [23] (see also Sharp et al. [47]). The left lateralization pattern observed in the CEM group at the C3/C4 pairing (Bottom Figure 3) may represent differing sound perception relating to non-speech element processing differences between the two groups. That is, left lateralization in the CEM group may reflect auditory and perceptual processing of music-related aspects including timbre, duration, and dynamic, while right-lateralization in the Comparison group may reflect non-speech engagement and tone-frequency processing such as pitch comparison [23]. This interpretation is supported by a study Black et al. [48], who found that a “global” interpretation of stimuli differs in laterality from more “local” interpretation. Black et al. [48] proposed that local processing, that is, processing that involves a more detail-oriented mode of sound perception, is more left-lateralized as compared to the right lateralized global wholistic mode. Our results are compatible with the possible interpretation that the CEM group might engage in a more local approach to the perception of Go stimuli (i.e., precise discrimination of the pitch itself), while the Comparison group might prefer a global approach (i.e., the comparison of more global features such as Go and No-Go, high vs. low pitch). If this interpretation is correct, then left lateralization in the CEM group may reflect auditory and sensory-perceptual features of stimulus processing. Supporting this conclusion, a key finding in the present study was the correlation between auditory sensitivity and left lateralization in the central electrodes.
Left-lateralized language-associated regions in children typically include the superior temporal cortex and the inferior frontal cortex [32], which we associated with electrode T7. We found significantly higher left lateralization activity in the Comparison group, which may indicate activation of the left supramarginal gyrus (SMG) [49]. The association of SMG to pitch memory in non-musicians was shown by Schaal et al. [50], demonstrating that the use of the left SMG in non-musicians is important for pitch memory. Higher activity of the left SMG has also been found in musicians in several studies, and in some cases, it has been related to speech processing and productive language ability [9,10]. The observed differences in asymmetry between CEM and Comparison groups, therefore, suggest evidence of differing neural processes, specifically in productive language processing [5,7,8]. These asymmetries might provide, in the future, unique targets or markers for predicting cognitive development, vulnerabilities/disorder risks, or intervention/treatment choices. Asymmetrical differences have been reported in other studies measuring asymmetry changes after treatment for depression and utilizing asymmetry as a method to monitor language development [51,52].
Indeed, LSES is known to be associated with systemic factors that impact aspects of productive language ability through pathways of non-mainstream linguistic environment, stress, and non-normative differences in self-regulation [53]. Our finding that the CEM group had higher EEG asymmetry in FC1/FC2 electrodes than their Comparison counterpart seems similar to the finding of increased IFG activity asymmetry to the left inferior frontal gyrus (IFG) in higher SES children reported in the functional resonance imaging study (fMRI) of Raizada et al. [24]. Assuming the plausibility of our FC1/FC2 electrode pair mapping to (bilateral) IFG, this functional asymmetry may represent more efficient productive linguistic processing in the CEM group. Moreover, crucially, because LSES children typically show less left lateralization [5,7,8], it suggests the idea that although musical training may boost plastic development of these areas in all children, it could still be particularly beneficial for LSES children’s positive development, as suggested in the literature [54,55].
Importantly, part of the present findings replicated findings by Bartha-Doering et al. [56] who found that, in fact, less lateralization is associated with better semantic and receptive language performance and verbal memory—which involve receptive vocabulary (again, as measured by our PPVT screening measure). Specifically, we found negative (right lateralized) correlations between PPVT and FC lateralization. These results agree with the findings from the literature reporting that left or even right lateralization is associated with better performance on semantic linguistic and/or receptive vocabulary tasks. Other studies have addressed the contradicting results of lateralization in musicians, reporting a range of patterns from left-lateralization to bilaterality [10,57,58]. The inconsistencies might be dependent on the variety of methods, the interventions considered, the neuroimaging techniques, and the ROIs as well as task conditions used in the studies.
In the context of the present study, there is no contradiction because we found evidence supporting the conclusion that the association between right lateralization and semantic receptive vocabulary, at the post-P300 window, reflected different linguistic components than those implicated by the correlation between the left lateralization and auditory sensitivity at the P300 window. The two distinct sets of findings not only occurred at different stages and time intervals but also in different electrodes and for different EEG frequency band patterns. Thus, our results could simply be showing that different patterns of lateralization, as measured with the superior time resolution of EEG, reflect different types of linguistic functions. This interpretation is supported by research demonstrating changes in bidirectional connectivity between hemispheres during different stages of language processing in children aged 9–15 [57,59]. Consistent with this latter literature, we therefore conclude that certain task states may very well involve activity-laterality bidirectionally, but they still occur at specified spatial and temporal points. Particularly in the P300 window, increased lateralized EEG power to the left in central and frontal electrodes may likely reflect refined or more efficient language processes that have to do with production, speech, and auditory analysis of the low-level, bottom-up features of stimuli sounds such as the tones we used in our Go/No-Go task.
The present findings should be considered as preliminary given our small sample size (i.e., low statistical power) and the limited spatial resolution of EEG. Future replication investigations should strive for larger sample sizes and combined fMRI and EEG measurements to further validate localization. It must be noted, however, that notwithstanding our low statistical power, the effect sizes associated with the significant group differences we found were medium to very strong. Specifically, the range of Cohen d in our significant findings was between 1.003 and 1.536. In terms of common language effect size (CLES, see [60]), this means that we found that a score sampled from the CEM group distribution would be different than a score sampled from the Comparison distribution between 76.09% and 86.13% of the times. The effects corresponding to the presence of lateralization vs. null effect, irrespective of group differences, were even stronger (see Table 3; Cohen d range: 1.096 to 3.856; CLES range: 78.08% to 99.68%). These considerations strongly suggest that larger replication studies would obtain similar or stronger evidence with perhaps more refined differences (i.e., differences amongst band frequencies, rather than blocked effects across frequency bands, which we were not able to disambiguate). In the context of other EEG studies, our recorded power differences are of similar magnitude as other studies that also analyzed the asymmetry of neural function and found practically or clinically meaningful results [61].
An aspect of future research that could be improved is specifying the role of social interaction in mediating the influence of ensemble music training on brain activity changes. In the present study, the social effects and the cognitive/perceptive effects were completely confounded, and so we could not pinpoint exactly what it is about learning to play in an orchestra, using the particular pedagogical approach of the intervention studied here, i.e., El Sistema, that might function as vehicle for neurofunctional plastic changes in children. Survey studies and studies using other methods have pointed at the role of socioemotional self-regulation [17]. Alternatively, however, in the context of emerging research trends in music psychology and education, the confounded factor present in our study would not be considered as a limitation but as an “ecological constraint” or necessity and, ultimately, as a point for further investigation. In particular, from the new emerging perspective of the sensorimotor theory of auditory perception [62], learning to play in ensemble music settings involves a particular type of “listening” (to each other, to the music, etc.) not only because it generates a social stream of communication across peers or between teachers and students but also because it allows the development of a type of cognition guided by audition, which promotes motor adaptations to auditory and sound events as well as mental auditory imagery [63] and, as proposed very recently, this can be considered as a form of “embodied language” (interactive communicative processes) [64]. Considering this perspective, the challenge will be for future neurophysiological and neuroimaging research to flesh out in detail what in vivo neural patterns correspond to these complex forms of socially based cognitive activities in children learning ensemble music, and what might be the specific link with brain activity asymmetries we have uncovered.

5. Conclusions

Despite its limitations, the present study showed evidence suggesting that socially based music training offered to low socioeconomic status children changed the processes associated with sound perception at the neural level. LSES children who engaged in the ensemble music training showed left lateralization shifts in key nodes of the motor-auditory music neural network relative to LSES peers in the Comparison group and in the general population. The pattern of results suggested evidence of improved sound perception, different group approaches to task processing, and electrophysiological correlates of putatively more efficient language-related auditory processing. The present study contributes evidence which suggests the use of EEG activity asymmetries as a possible assessment tool for developmental interventions. Further, it highlights socially based ensemble music training as a potential candidate for ameliorative supportive interventions in LSES children.

Author Contributions

Conceptualization, A.D. and K.S.; methodology, K.S. and A.D.; software, A.D. and G.B.; validation, G.B., K.S., A.D., G.L. and G.G.; formal analysis, G.B.; data collection, K.S.; resources, A.D.; data curation, K.S., A.D. and G.B.; writing—original draft preparation, G.B. and A.D.; writing—review and editing, A.D., G.L. and G.G.; visualization, A.D.; supervision, A.D.; project administration, A.D.; funding acquisition, A.D. All authors have read and agreed to the published version of the manuscript.

Funding

This research was funded by a grant from Carleton University Faculty of Science to A.D.

Institutional Review Board Statement

The study was conducted according to the guidelines of the Declaration of Helsinki and approved by the Institutional Review Board of Carleton University, human subjects research section, protocol code 12-029 (29 May 2012).

Informed Consent Statement

Informed consent was obtained from all subjects involved in the study.

Data Availability Statement

Data are available upon request from A.D. provided the purpose of the request is used in accordance with international intellectual property and copyright regulations.

Acknowledgments

We thank Tina Fedeski and support from the Leading Note Foundation and all children and parents who made this study possible. We thank the excellent contribution of three anonymous reviewers in helping us improve the paper substantially.

Conflicts of Interest

The authors declare no conflict of interest.

References

  1. Gaser, C.; Schlaug, G. Brain Structures Differ between Musicians and Non-Musicians. J. Neurosci. 2003, 23, 9240–9245. [Google Scholar] [CrossRef] [PubMed] [Green Version]
  2. Koelsch, S.; Fritz, T.; Schulze, K.; Alsop, D.; Schlaug, G. Adults and children processing music: An fMRI study. Neuroimage 2005, 25, 1068–1076. [Google Scholar] [CrossRef] [PubMed]
  3. Koelsch, S.; Siebel, W.A. Towards a neural basis of music perception. Trends Cogn. Sci. 2005, 9, 578–584. [Google Scholar] [CrossRef] [PubMed] [Green Version]
  4. Hutchinson, S.; Lee, L.; Gaab, N.; Schlaug, G. Cerebellar volume in musicians. Cereb. Cortex 2003, 13, 943–949. [Google Scholar] [CrossRef] [Green Version]
  5. Schlaug, G.; Jäncke, L.; Huang, Y.; Steinmetz, H. In vivo evidence of structural brain asymmetry in musicians. Science 1995, 267, 699–701. [Google Scholar] [CrossRef] [Green Version]
  6. Schlaug, G.; Jäncke, L.; Huang, Y.; Staiger, J.F.; Steinmetz, H. Increased corpus callosum size in musicians. Neuropsychologia 1995, 33, 1047–1055. [Google Scholar] [CrossRef] [Green Version]
  7. Hirnstein, M.; Hugdahl, K.; Hausmann, M. How brain asymmetry relates to performance—A large-scale dichotic listening study. Front. Psychol. 2014, 4, 997. [Google Scholar] [CrossRef] [Green Version]
  8. Brancucci, A.; Lucci, G.; Mazzatenta, A.; Tommasi, L. Asymmetries of the human social brain in the visual, auditory and chemical modalities. Philos. Trans. R. Soc. B Biol. Sci. 2009, 364, 895–914. [Google Scholar] [CrossRef] [Green Version]
  9. Ellis, R.J.; Bruijn, B.; Norton, A.C.; Winner, E.; Schlaug, G. Training-mediated leftward asymmetries during music processing: A cross-sectional and longitudinal fMRI analysis. Neuroimage 2013, 75, 97–107. [Google Scholar] [CrossRef] [Green Version]
  10. Herdener, M.; Humbel, T.; Esposito, F.; Habermeyer, B.; Cattapan-Ludewig, K.; Seifritz, E. Jazz Drummers Recruit Language-Specific Areas for the Processing of Rhythmic Structure. Cereb. Cortex 2014, 24, 836–843. [Google Scholar] [CrossRef] [Green Version]
  11. De Aquino, M.P.B.; Verdejo-Román, J.; Pérez-García, M.; Pérez-García, P. Different role of the supplementary motor area and the insula between musicians and non-musicians in a controlled musical creativity task. Sci. Rep. 2019, 9, 13006. [Google Scholar] [CrossRef] [Green Version]
  12. Brandler, S.; Rammsayer, T.H. Differences in Mental Abilities between Musicians and Non-Musicians. Psychol. Music 2003, 31, 123–138. [Google Scholar] [CrossRef]
  13. Witelson, S.F.; Kigar, D.L. Sylvian fissure morphology and asymmetry in men and women: Bilateral differences in relation to handedness in men. J. Comp. Neurol. 1992, 323, 326–340. [Google Scholar] [CrossRef]
  14. Zatorre, R.J.; Belin, P.; Penhune, V.B. Structure and function of auditory cortex: Music and speech. Trends Cogn. Sci. 2002, 6, 37–46. [Google Scholar] [CrossRef]
  15. Leisman, G.; Melillo, R.; Mualem, R.; Machado, C. The effect of music training and production on functional brain organization and cerebral asymmetry. In Art, Science and Technology; Domus Argenia: Milano, Italy, 2012; pp. 133–139. [Google Scholar]
  16. Chan, A.S.; Ho, Y.-C.; Cheung, M.-C. Music training improves verbal memory. Nature 1998, 396, 128. [Google Scholar] [CrossRef]
  17. Ho, Y.-C.; Cheung, M.-C.; Chan, A.S. Music training improves verbal but not visual memory: Cross-sectional and longitudinal explorations in children. Neuropsychology 2003, 17, 439–450. [Google Scholar] [CrossRef] [Green Version]
  18. Gelding, R.W.; Thompson, W.F.; Johnson, B.W. Musical imagery depends upon coordination of auditory and sensorimotor brain activity. Sci. Rep. 2019, 9, 16823. [Google Scholar] [CrossRef]
  19. Talamini, F.; Altoè, G.; Carretti, B.; Grassi, M. Musicians have better memory than nonmusicians: A meta-analysis. PLoS ONE 2017, 12, e0186773. [Google Scholar] [CrossRef]
  20. Zhang, Y.; Chen, G.; Wen, H.; Lu, K.-H.; Liu, Z. Musical Imagery Involves Wernicke’s Area in Bilateral and Anti-Correlated Network Interactions in Musicians. Sci. Rep. 2017, 7, 17066. [Google Scholar] [CrossRef] [Green Version]
  21. Leonard, J.A.; Mackey, A.P.; Finn, A.S.; Gabrieli, J.D.E. Differential effects of socioeconomic status on working and procedural memory systems. Front. Hum. Neurosci. 2015, 9, 554. [Google Scholar] [CrossRef] [Green Version]
  22. Boles, D.B. Socioeconomic status, a forgotten variable in lateralization development. Brain Cogn. 2011, 76, 52–57. [Google Scholar] [CrossRef]
  23. Lou, W.; Peck, K.K.; Brennan, N.; Mallela, A.; Holodny, A. Left-lateralization of resting state functional connectivity between the presupplementary motor area and primary language areas. Neuroreport 2017, 28, 545–550. [Google Scholar] [CrossRef]
  24. Raizada, R.D.S.; Richards, T.L.; Meltzoff, A.; Kuhl, P.K. Socioeconomic status predicts hemispheric specialisation of the left inferior frontal gyrus in young children. Neuroimage 2008, 40, 1392–1401. [Google Scholar] [CrossRef] [Green Version]
  25. Demir-Lira, Ö.E.; Asaridou, S.S.; Nolte, C.; Small, S.L.; Goldin-Meadow, S. Parent Language Input Prior to School Forecasts Change in Children’s Language-Related Cortical Structures During Mid-Adolescence. Front. Hum. Neurosci. 2021, 15, 15. [Google Scholar] [CrossRef]
  26. Romeo, R.R. Socioeconomic and experiential influences on the neurobiology of language development. Perspect. ASHA Spec. Interest Groups 2019, 4, 1229–1238. [Google Scholar] [CrossRef]
  27. Arredondo, M.M.; Hu, X.-S.; Seifert, E.; Satterfield, T.; Kovelman, I. Bilingual exposure enhances left IFG specialization for language in children. Biling. Lang. Cogn. 2019, 22, 783–801. [Google Scholar] [CrossRef]
  28. Gomez, P.; Ratcliff, R.; Perea, M. A Model of the Go/No-Go Task. J. Exp. Psychol. Gen. 2007, 136, 389–413. [Google Scholar] [CrossRef]
  29. Schulz, K.P.; Fan, J.; Magidina, O.; Marks, D.J.; Hahn, B.; Halperin, J.M. Does the emotional go/no-go task really measure behavioral inhibition? Convergence with measures on a non-emotional analog. Arch. Clin. Neuropsychol. 2007, 22, 151–160. [Google Scholar] [CrossRef] [Green Version]
  30. Xiao, R.; Shida-Tokeshi, J.; Vanderbilt, D.L.; Smith, B.A. Electroencephalography power and coherence changes with age and motor skill development across the first half year of life. PLoS ONE 2018, 13, e0190276. [Google Scholar] [CrossRef] [Green Version]
  31. Bolden, B.; Corcoran, S.; Butler, A. A scoping review of research that examines El Sistema and Sistema-inspired music education programmes. Rev. Educ. 2021, 9, e3267. [Google Scholar] [CrossRef]
  32. Hedayati, N.; Schibli, K.; D’Angiulli, A. El Sistema-inspired ensemble music training is associated with changes in children’s neurocognitive functional integration: Preliminary ERP evidence. Neurocase 2016, 22, 538–547. [Google Scholar] [CrossRef] [PubMed]
  33. Statistics Canada. Table 11-10-0195-01 Low Income Cut-Offs (LICOs) before and after Tax by Community Size and Family Size, in Constant Dollars. 2021. Available online: https://www150.statcan.gc.ca/t1/tbl1/en/tv.action?pid=1110019501 (accessed on 20 December 2021). [CrossRef]
  34. Bornstein, M.; Hahn, C.; Suwalsky, J.; Haynes, O. Socioeconomic status, parenting, and child development: The hollingshead four-factor index of social status and the socioeconomic index of occupations. In Socioeconomic Status, Parenting, and Child Development; Bornstein, M.H., Bradley, R.H., Eds.; Lawrence Erlbaum Associates: Mahwah, NJ, USA, 2003. [Google Scholar]
  35. Lovibond, P.F.; Lovibond, S.H. The structure of negative emotional states: Comparison of the Depression Anxiety Stress Scales (DASS) with the Beck Depression and Anxiety Inventories. Behav. Res. Ther. 1995, 33, 335–343. [Google Scholar] [CrossRef]
  36. Oldfield, R.C. The assessment and analysis of handedness: The Edinburgh inventory. Neuropsychologia 1971, 9, 97–113. [Google Scholar] [CrossRef]
  37. Werner, P.D.; Swope, A.J.; Heide, F.J. The music experience questionnaire: Development and correlates. J. Psychol. 2006, 140, 329–345. [Google Scholar] [CrossRef]
  38. Dunn, L.M.; Dunn, D.M. PPVT-4: Peabody Picture Vocabulary Test; Pearson Assessments: Minneapolis, MN, USA, 2007. [Google Scholar]
  39. Cohen, S.; Kamarck, T.; Mermelstein, R. A Global Measure of Perceived Stress. J. Health Soc. Behav. 1983, 24, 385–396. [Google Scholar] [CrossRef]
  40. Nolen-Hoeksema, S. Responses to depression and their effects on the duration of depressive episodes. J. Abnorm. Psychol. 1991, 100, 569–582. [Google Scholar] [CrossRef]
  41. Goodman, R. The Strengths and Difficulties Questionnaire: A Research Note. J. Child Psychol. Psychiatry 1997, 38, 581–586. [Google Scholar] [CrossRef]
  42. Benjamini, Y.; Yekutieli, D. The Control of the False Discovery Rate in Multiple Testing under Dependency. Ann. Stat. 2001, 29, 1165–1188. [Google Scholar] [CrossRef]
  43. Fachada, N.; Rosa, A. micompm: A MATLAB/Octave toolbox for multivariate independent comparison of observations. J. Open Source Softw. 2018, 3, 3. [Google Scholar] [CrossRef]
  44. Ishihara, S. Ishihara’s Tests for Colour Blindness Concise Edition; Kanehara & Co. Ltd.: Tokyo, Japan, 1983. [Google Scholar]
  45. Hedayati, N.; Schibli, K.; D’Angiulli, A. Effects of socially based ensemble music training on children’s executive functions: ERP evidence. Can. J. Exp. Psychol.-Rev. Can. Psychol. Expérimentale 2016, 70, 379. [Google Scholar]
  46. Benjamini, Y.; Hochberg, Y. Controlling the False Discovery Rate: A Practical and Powerful Approach to Multiple Testing. J. R. Stat. Soc. Ser. B 1995, 57, 289–300. [Google Scholar] [CrossRef]
  47. Sharp, D.J.; Bonnelle, V.; De Boissezon, X.; Beckmann, C.F.; James, S.G.; Patel, M.C.; Mehta, M.A. Distinct frontal systems for response inhibition, attentional capture, and error processing. Proc. Natl. Acad. Sci. USA 2010, 107, 6106–6111. [Google Scholar] [CrossRef] [Green Version]
  48. Black, E.; Stevenson, J.L.; Bish, J.P. The Role of Musical Experience in Hemispheric Lateralization of Global and Local Auditory Processing. Perception 2017, 46, 956–975. [Google Scholar] [CrossRef]
  49. Papagno, C.; Comi, A.; Riva, M.; Bizzi, A.; Vernice, M.; Casarotti, A.; Fava, E.; Bello, L. Mapping the brain network of the phonological loop. Hum. Brain Mapp. 2017, 38, 3011–3024. [Google Scholar] [CrossRef] [Green Version]
  50. Schaal, N.K.; Kretschmer, M.; Keitel, A.; Krause, V.; Pfeifer, J.; Pollok, B. The significance of the right dorsolateral prefrontal cortex for pitch memory in non-musicians depends on baseline pitch memory abilities. Front. Neurosci. 2017, 11, 677. [Google Scholar] [CrossRef] [Green Version]
  51. O’Muircheartaigh, J.; Dean, D.C.; Dirks, H.; Waskiewicz, N.; Lehman, K.; Jerskey, B.A.; Deoni, S.C.L. Interactions between White Matter Asymmetry and Language during Neurodevelopment. J. Neurosci. 2013, 33, 16170–16177. [Google Scholar] [CrossRef] [Green Version]
  52. Gollan, J.K.; Hoxha, D.; Chihade, D.; Pflieger, M.E.; Rosebrock, L.; Cacioppo, J. Frontal alpha EEG asymmetry before and after behavioral activation treatment for depression. Biol. Psychol. 2014, 99, 198–208. [Google Scholar] [CrossRef] [Green Version]
  53. Schibli, K.; Wong, K.; Hedayati, N.; D’angiulli, A. Attending, learning, and socioeconomic disadvantage: Developmental cognitive and social neuroscience of resilience and vulnerability. Ann. N. Y. Acad. Sci. 2017, 1396, 19–38. [Google Scholar] [CrossRef]
  54. Schibli, K.; Hobbs, H.; Sheik-Ahmed, A.; Hedayati, N.; D’Angiulli, A. ISDN2014_0311: Cognition and language development in different socioeconomic and environmental settings: A review from Developmental Cognitive Neuroscience. Int. J. Dev. Neurosci. 2015, 47, 94–95. [Google Scholar] [CrossRef]
  55. Moreno, S.; Marques, C.; Santos, A.; Santos, M.; Castro, S.L.; Besson, M. Musical Training Influences Linguistic Abilities in 8-Year-Old Children: More Evidence for Brain Plasticity. Cereb. Cortex 2009, 19, 712–723. [Google Scholar] [CrossRef] [Green Version]
  56. Bartha-Doering, L.; Kollndorfer, K.; Kasprian, G.; Novak, A.; Schuler, A.-L.; Fischmeister, F.P.S.; Alexopoulos, J.; Gaillard, W.D.; Prayer, D.; Seidl, R.; et al. Weaker semantic language lateralization associated with better semantic language performance in healthy right-handed children. Brain Behav. 2018, 8, e01072. [Google Scholar] [CrossRef]
  57. Ono, K.; Nakamura, A.; Yoshiyama, K.; Kinkori, T.; Bundo, M.; Kato, T.; Ito, K. The effect of musical experience on hemispheric lateralization in musical feature processing. Neurosci. Lett. 2011, 496, 141–145. [Google Scholar] [CrossRef]
  58. Trujillo-Pozo, I.; Martín-Monzón, I.; Rodríguez-Romero, R. Brain lateralization and neural plasticity for musical and cognitive abilities in an epileptic musician. Front. Hum. Neurosci. 2013, 7, 7. [Google Scholar] [CrossRef] [Green Version]
  59. Bitan, T.; Lifshitz, A.; Breznitz, Z.; Booth, J.R. Bidirectional connectivity between hemispheres occurs at multiple levels in language processing but depends on sex. J. Neurosci. 2010, 30, 11576–11585. [Google Scholar] [CrossRef] [Green Version]
  60. McGraw, K.O.; Wong, S.P. A common language effect size statistic. Psychol. Bull. 1992, 111, 361–365. [Google Scholar] [CrossRef]
  61. Zhao, G.; Zhang, Y.; Ge, Y. Frontal EEG Asymmetry and Middle Line Power Difference in Discrete Emotions. Front. Behav. Neurosci. 2018, 12, 225. [Google Scholar] [CrossRef] [Green Version]
  62. Froese, T.; Gonzalez-Grandon, X. How passive is passive listening? Toward a sensorimotor theory of auditory perception. Phenomenol. Cogn. Sci. 2020, 19, 619–651. [Google Scholar] [CrossRef]
  63. Schiavio, A.; Küssner, M.B.; Williamon, A. Music Teachers’ Perspectives and Experiences of Ensemble and Learning Skills. Front. Psychol. 2020, 11, 291. [Google Scholar] [CrossRef] [Green Version]
  64. Dell’Anna, A.; Leman, M.; Berti, A. Musical Interaction Reveals Music as Embodied Language. Front. Neurosci. 2021, 15, 15. [Google Scholar] [CrossRef]
Figure 1. Electrodes labelled include FC1, FC2, C3, C4, CP5, CP6, F3, F4, T7, and T8. Blue regions highlight pre-SMA regions on the left and right, respectively, associated with FC1/FC2 electrodes. Red regions highlight Inferior Frontal Gyri (left and right respectively) and the proposed association with FC1/FC2. Left hemisphere is on left side, and the anterior end of brain is in the up direction. Note: Greyed electrodes were associated with nonsignificant results in the analyses.
Symmetry 14 00538 g001
Figure 2. Mean RTs with ±1 Standard Errors for CEM and Comparison groups in response to the two tones (1100 and 2000 Hz) used in the Go trials. (Comparison: n = 8, CEM: n = 7).
Symmetry 14 00538 g002
Figure 3. (Top Panel): Mean difference EEG power of CEM and Comparison groups at FC1/FC2 electrodes at post-P300 time point during inhibitory (No-Go) task at 1100 Hz and 2000 Hz tone frequency. Data presented combined delta, theta, alpha2, beta1, beta2, and gamma bands. Mean power analysis shows significant FC2 left lateralization in the Comparison group compared to an FC1 lateralization CEM for both stimulus tones. * (CEM: n = 7; Comparison: n = 8. GLM-RM, F(1,13) = 5.307, p = 0.038, d = 1.281). (Bottom Panel): Mean power lateralization of CEM and Comparison groups of C3 and C4 electrode for combined delta, theta, alpha 2, beta1, beta2, and gamma bands during an auditory Go task at P300 for 1100 Hz and 2000 Hz tone frequencies showing lower left lateralization for the Comparison group at 1100 Hz tone. ** (CEM: n = 7; Comparison n = 8. GLM-RM, F(1,13) = 7.629, p = 0.016, d = 1.536).
Symmetry 14 00538 g003
Table 1. Demographic data for Classical Ensemble Music (CEM) group and Comparison Group. Z corresponds to Mann–Whitney U and Chi square comparison statistics, CEM (n = 7) vs. Comparison (n = 8).
MeasureGroup aZFDR-p b
CEMComparison
Child Age11.201 ± 0.311 (11.36)9.759 ± 0.657 (5.06)2.7240.234
Parent/
Guardian Age
43.83 ± 1.014 (7.17)43.00 ± 1.746 (6.86)0.1441.000
SES39.000 ± 5.520 (4.33)54.570 ± 4.908 (9.29)2.2920.322
EHI54.000 ± 27.049 (7.75)45.000 ± 24.694 (6.36)0.6451.000
PPVT175.00 ± 3.885 (7.14)170.14 ± 10.958 (7.86)0.3201.000
PSS14.50 ± 1.668 (8.58)10.86 ± 2.187 (5.64)1.3681.000
RRS36.67 ± 5.044 (7.75)31.43 ± 2.680 (6.36)0.6441.000
SDQ-I3.142 ± 1.388 (6.71)4.285 ± 1.539 (8.29)0.7101.000
SDQ-E3.286 ± 1.459 (6.29)5.571 ± 1.325 (8.71)1.1041.000
SDQ-Total7.50 ± 3.085 (6.00)9.86 ± 1.908 (7.58)0.8581.000
DASS-D7.00 ± 4.058 (7.42)2.86 ± 1.370 (6.64)0.3781.000
DASS-A7.33 ± 4.310 (7.50)2.57 ± 1.288 (6.57)0.4581.000
DASS-S8.00 ± 3.425 (6.92)9.14 ± 2.988 (7.07)0.0721.000
Music Experience (child)7 Yes3 Yes2.2800.322
Music Experience (parent/ guardian)5 Yes1 Yes2.3920.322
Child Gender2 Female4 Female0.8161.000
Bilingualism4 Monolingual3 Monolingual0.7601.000
Note. SES: Adapted Hollingshead Socioeconomic Status Inventory [34], EHI: Edinburgh Handedness Inventory [36], PPVT: Peabody Picture Vocabulary Test–IV [38], PSS: Perceived Stress Scale [39], RSS: Ruminative Response Scale [40], SDQ-I: Internalizing Score for the Strengths and Difficulties Questionnaire [41], SDQ-E: Externalizing Score for the Strengths and Difficulties Questionnaire [41], SDQ-Total: Total score for the Strengths and Difficulties Questionnaire [41], DASS: Depressions Anxiety Stress Scale [35], DASS-D: Depression Anxiety Stress Scale–Depression Subscale [35], DASS-A: Depression Anxiety Stress Scale–Anxiety Subscale [35], DASS-S: Depression Anxiety Stress Scale-Stress Subscale [35]. a After exclusion of one participant. b p values were corrected using the FDR Benjamini–Yekutieli Procedure [42,43].
Table 2. Results of stepwise models regressing lateralization difference scores for Power EEG frequency bands (Delta, Theta, Alpha 2, Beta 1, Beta 2, and Gamma) onto behavioral and screening tests outcomes.
Behavioral/Screening Measures
ConditionsPPVTGo AccuracyReaction Time, Combined AverageAuditory Sensitivity, RightAuditory
Sensitivity,
Left
C3, 1100 Hz, Go,
P300
Beta2 (47.855)
Beta1 (8.878)
Alpha2 (−9.077)
Theta (2.044)
R2 = 0.695
F= 8.979 (d = 3.019)
p = 0.011 *
Beta1 (−3.890)
R2 = 0.141
F = 3.305 (d = 0.810)
p = 0.098
-
C3, 2000 Hz,
Go,
P300
Alpha2 (3.238)
R2 = 0.134
F = 3.174 (d = 0.787)
p = 0.098
Beta2 (−360.313)
Beta1 (101.222)
Alpha2 (−21.501)
Theta (20.375)
R2 = 0.788
F = 13.987 (d = 3.856)
p = 0.001 *
Beta1 (10.613)
R2 = 0.304
F = 7.111 (d = 1.322)
p = 0.042 *
-
FC1, 1100 Hz,
No-Go,
post-P300
Gamma (7.451)
Theta (1.159)
R2 = 0.305
F = 4.067 (d = 1.325)
p = 0.071 **
Theta (0.980)
R2 = 0.231
F = 5.210 (d = 1.096)
p = 0.071 **
FC1, 2000 Hz, No-Go, post-P300Beta1 (−52.204)
Beta2 (−7.165)
Theta (−34.122)
R2 = 0.601
F = 7.526 (d = 2.455)
p = 0.016 *
Delta (94.667)
R2 = 0.143
F = 3.339 (d = 0.817)
p = 0.098
Delta (−8.107)
R2 = 0.146
F = 3.384 (d = 0.827)
p = 0.098
Delta (−1.221)
R2 = 0.453
F = 12.610 (d = 1.820)
p = 0.015 *
-
Note. Values in parentheses represent unstandardized beta coefficients (β) of univariate regressions composing the stepwise multiple regression model (shown next to corresponding frequency band). The signs of the β’s indicate the direction of lateralization difference (as computed as Left–Right), whereby a positive regression coefficient indicates left lateralization effect while a negative one indicates a right lateralization effect. R squared values are adjusted. Degrees of freedom for the F ratios ranged from 1 to 3 for the numerator error term, and from 9 to 13 for the residual error term. Stepwise model criteria were p < 0.10 for entry and p > 0.15 for exclusion. Sequence of variable entry yielded no differential effects. Empty cells indicate that no significant models were found. p values were adjusted using the Hochberg–Benjamini FDR procedure; “**” asterisks indicate significant findings surviving FDR correction; “*” indicates marginal significance.
Table 3. Summary table of behavioral and EEG results.
AnalysisResult
BehavioralGo trial (2000 Hz) reaction time was faster in CEM than in the Comparison group
Go trial (combined) reaction time was faster in CEM than in the Comparison group.
Go trial accuracy is inversely correlated with Go trial (1100 Hz) and Go trial (combined) reaction times.
Go trial accuracy positively correlated with auditory sensitivity and Go trial (combined) reaction time.
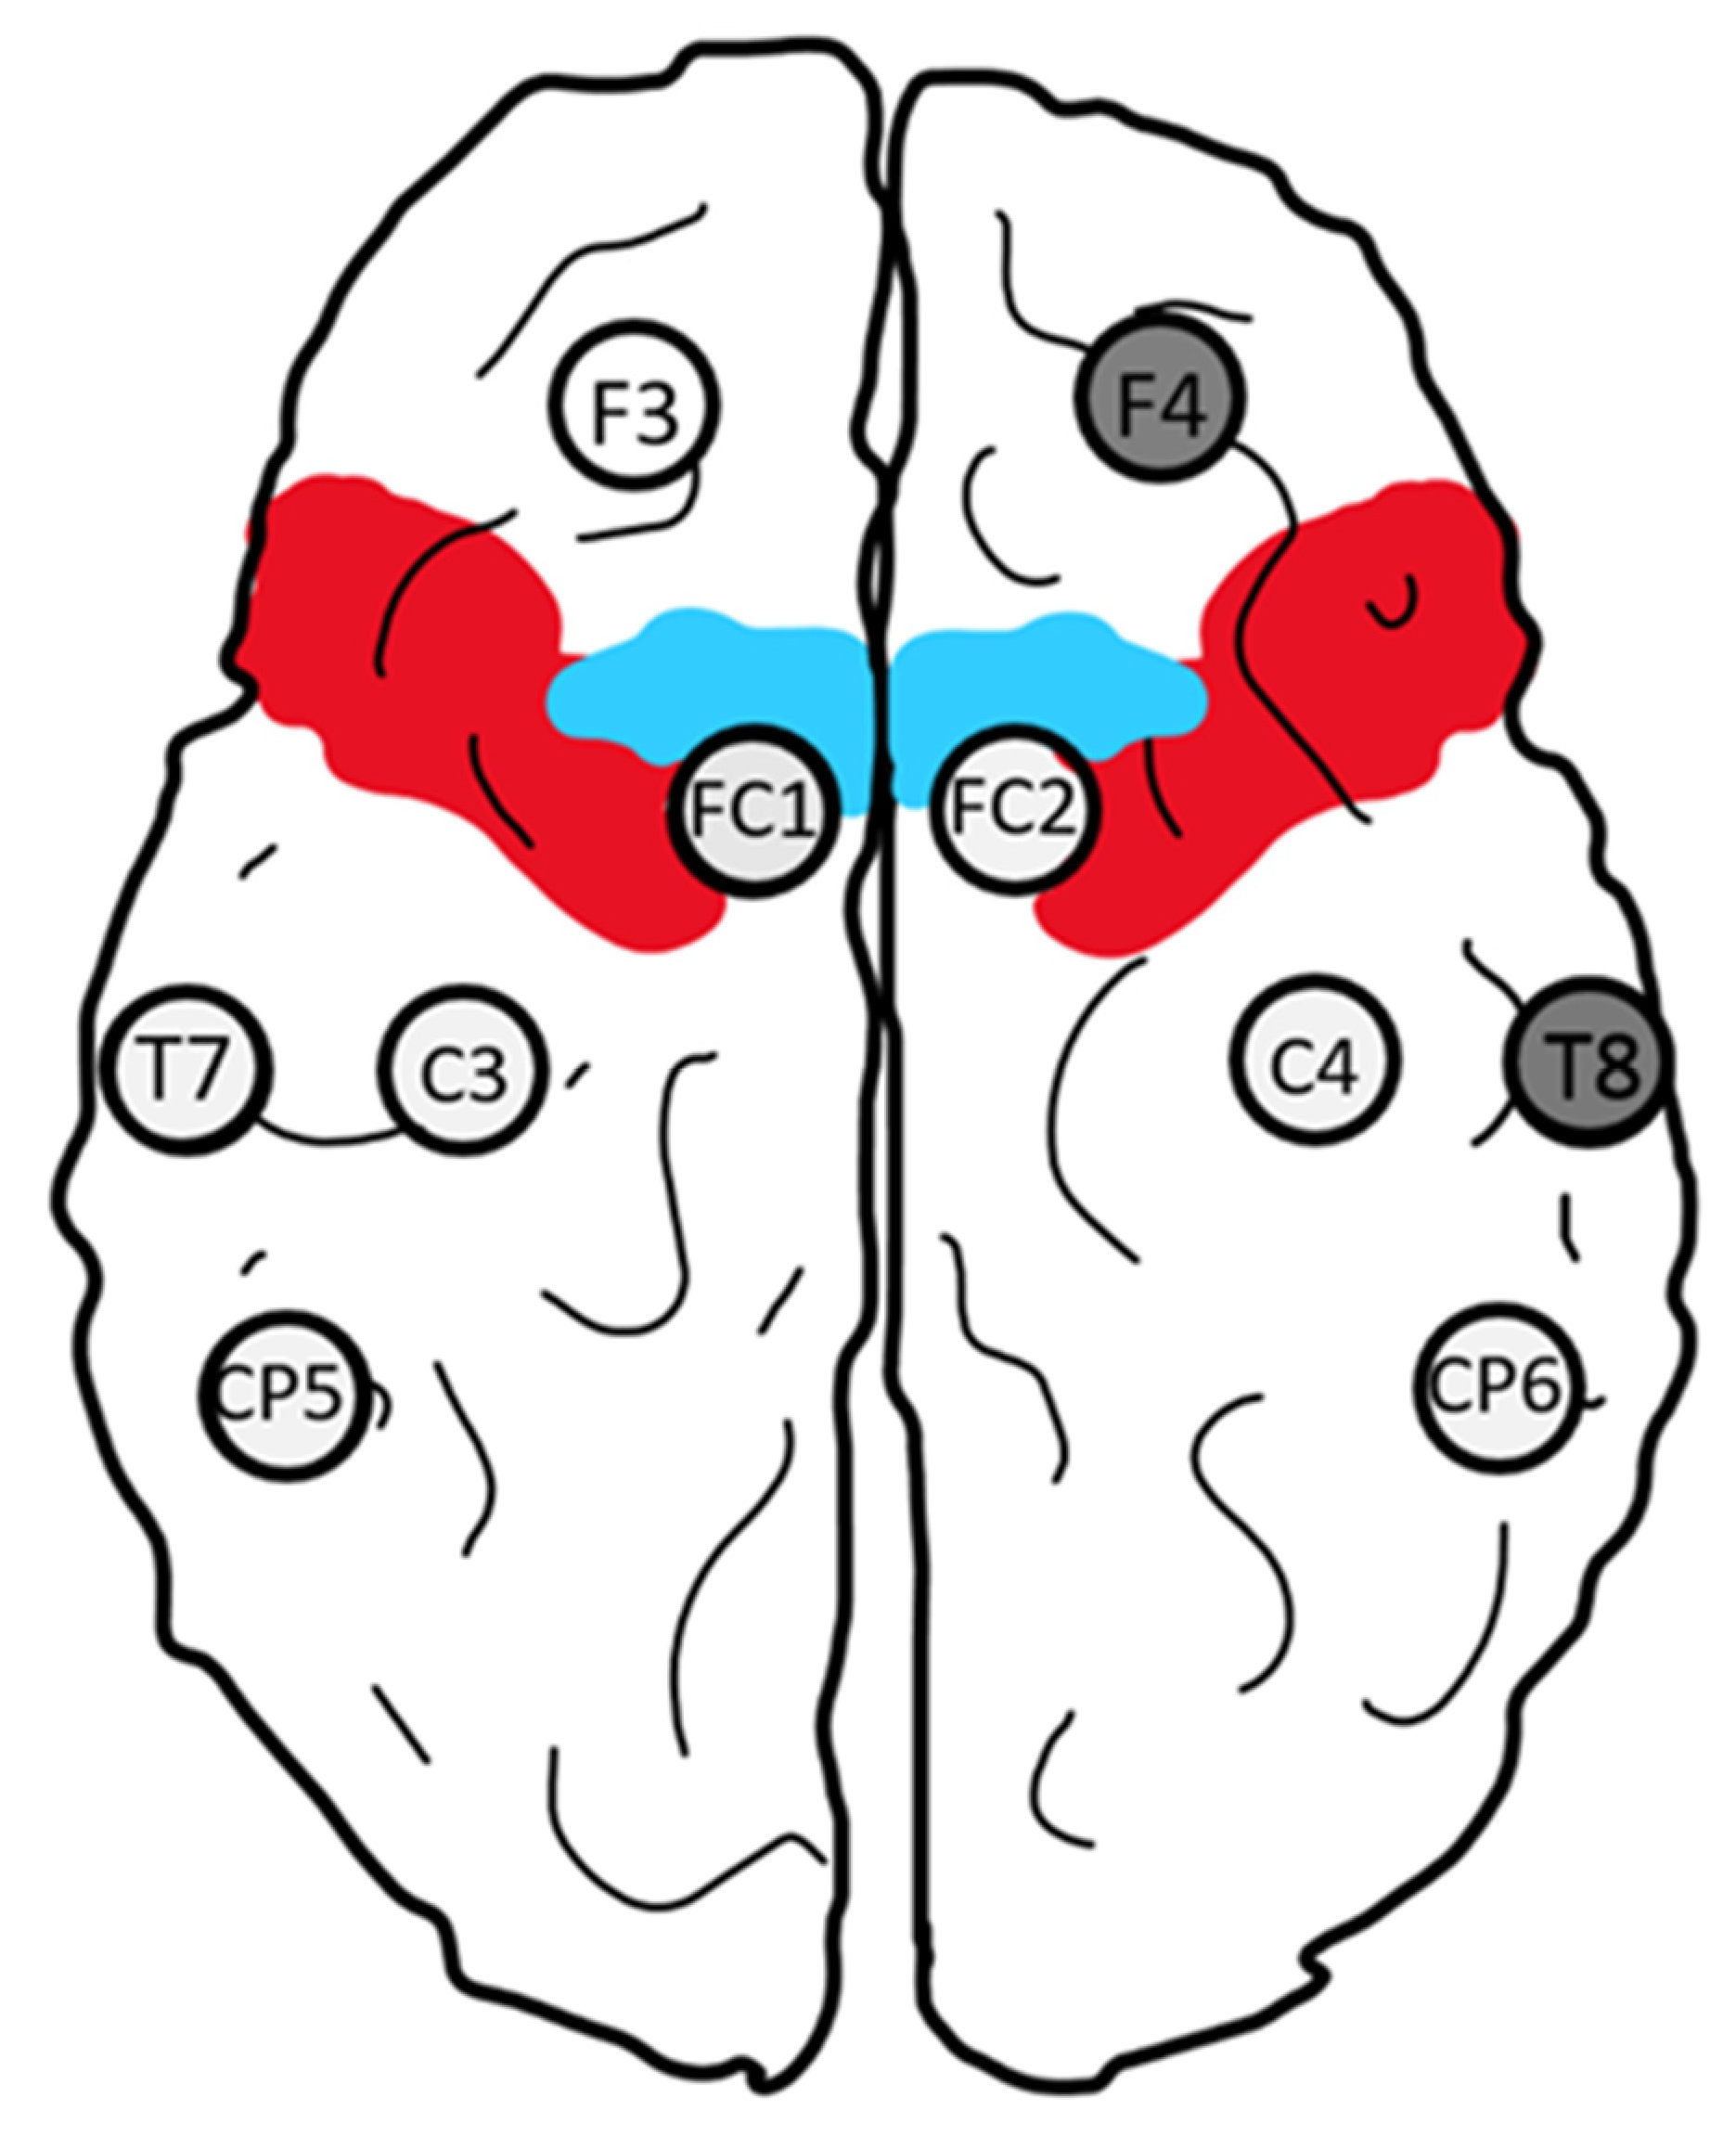
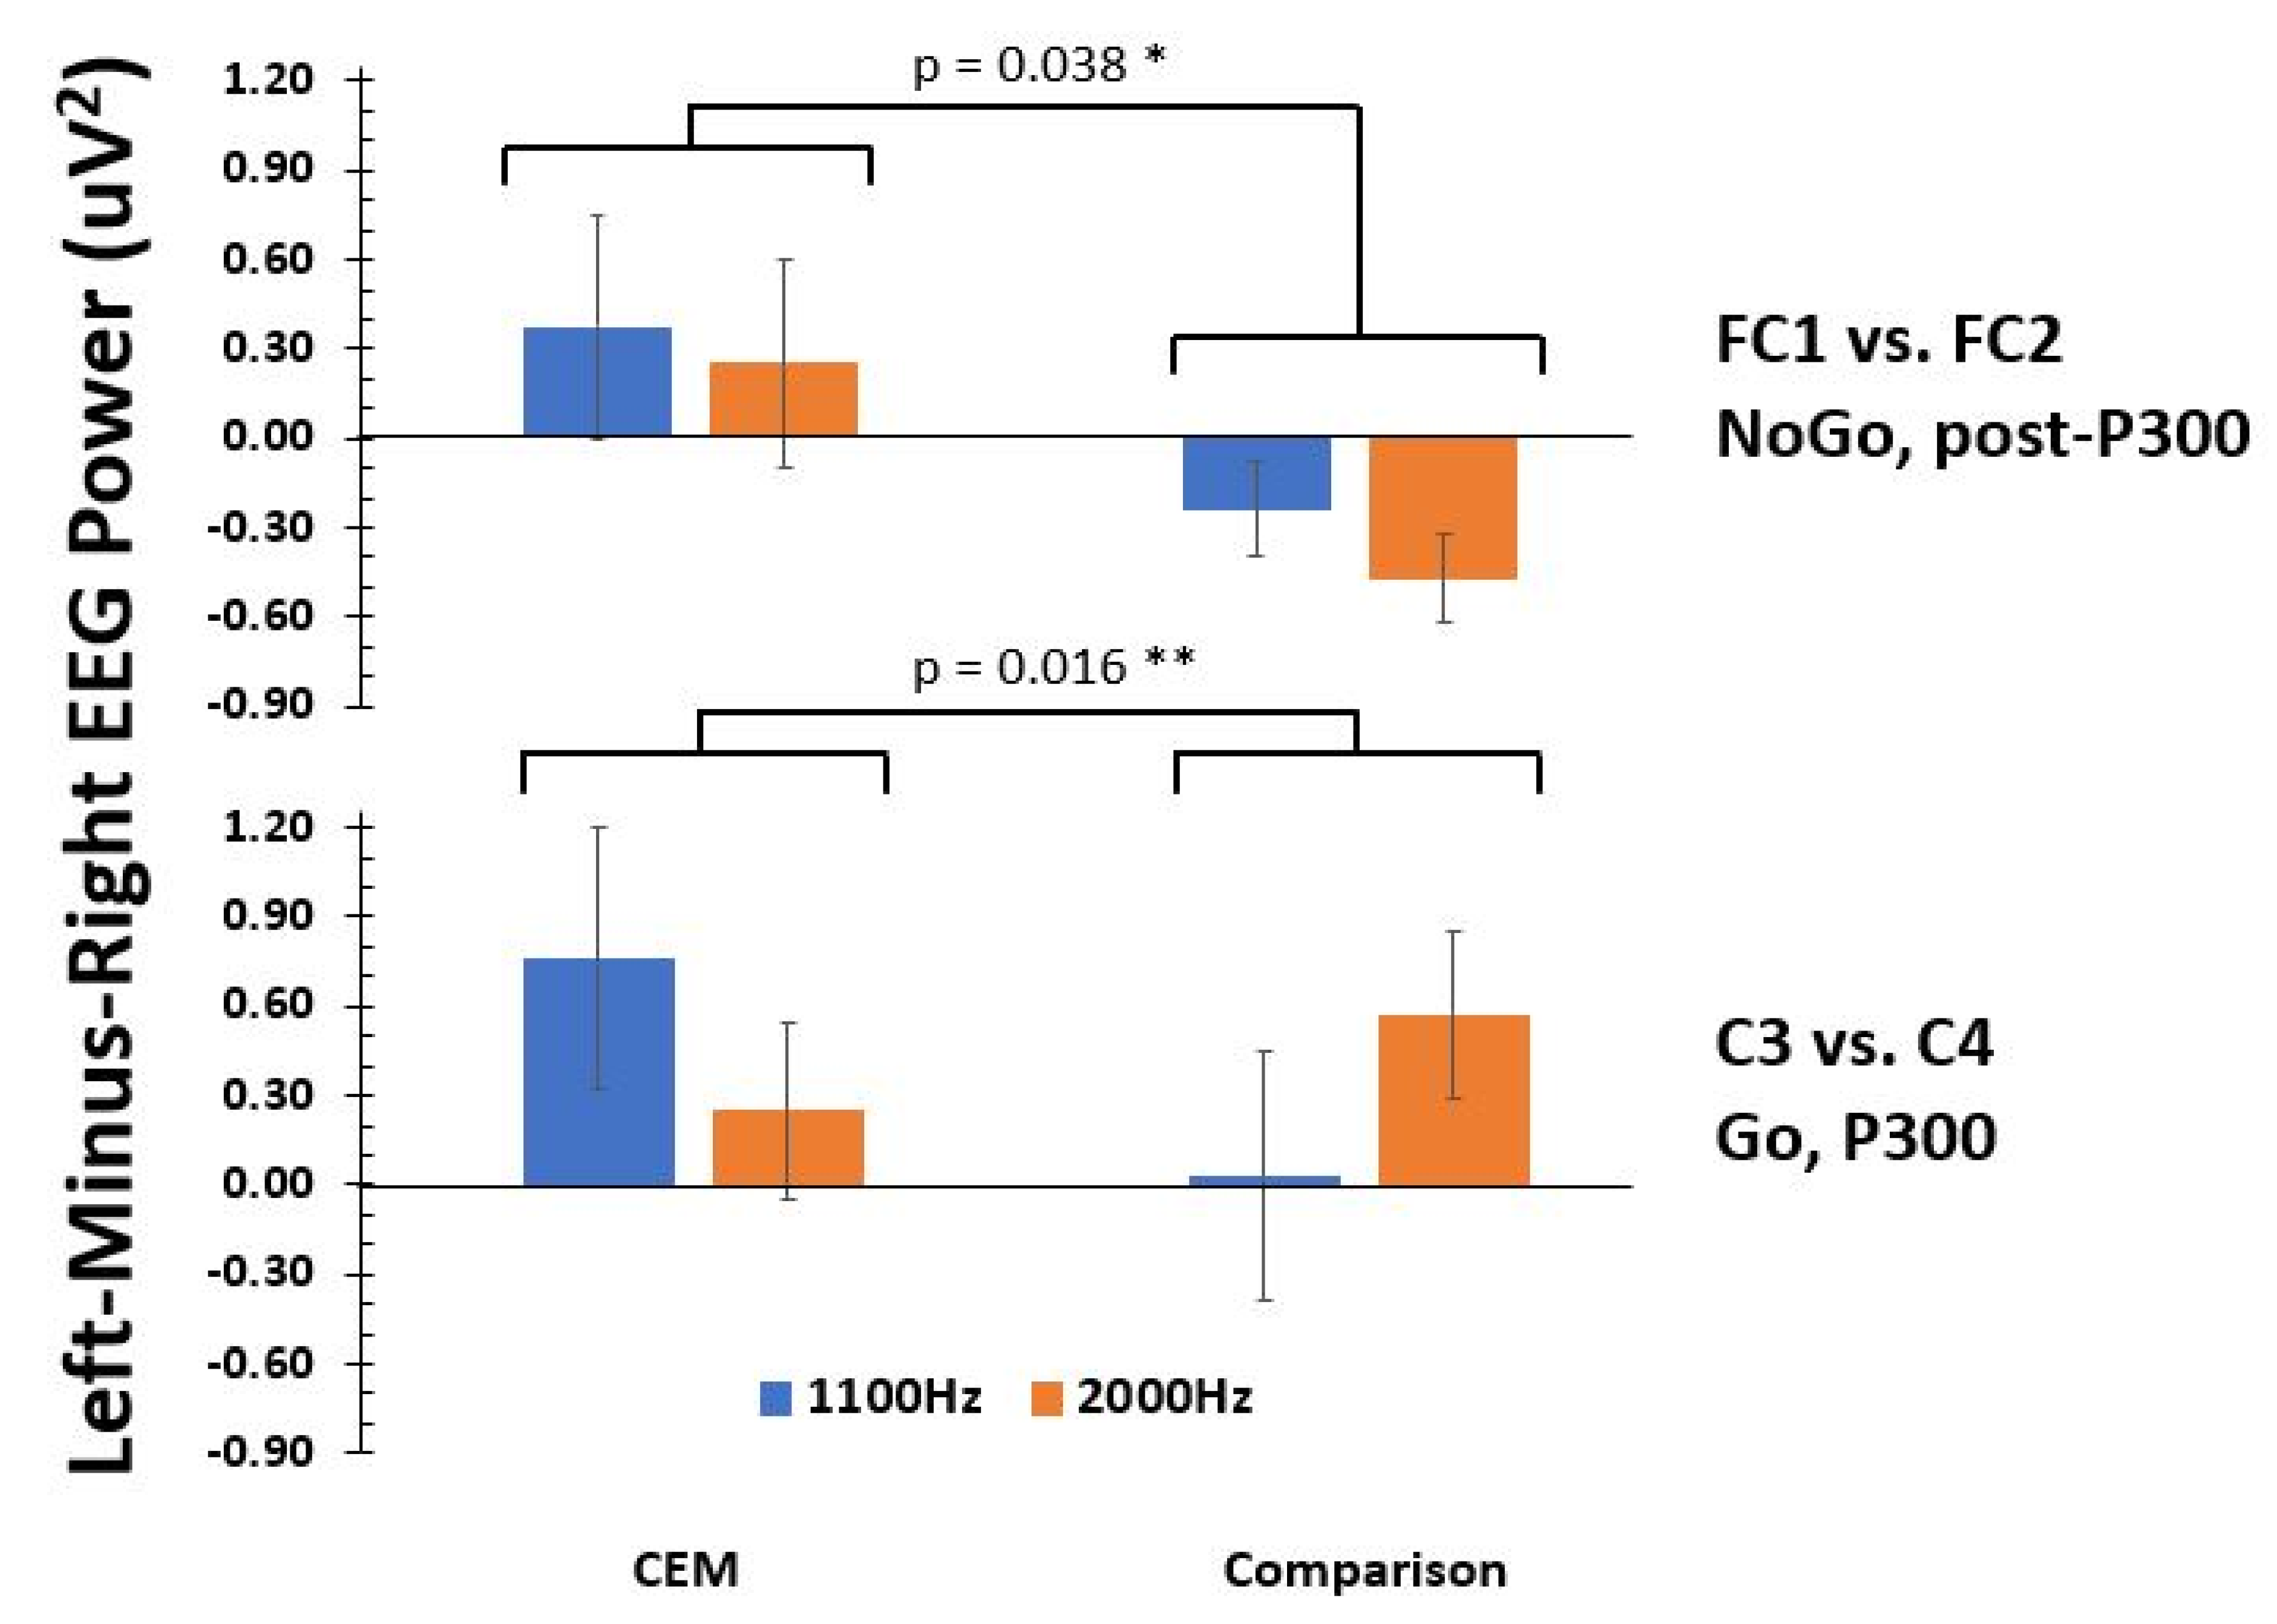
EEGLeft lateralization (FC1) in the CEM group compared to right lateralization (FC2) in the Comparison group (post-P300, No-Go trial).
Left lateralization (C3) in the CEM group (both tone frequencies) compared to left lateralization (C3) in the Comparison group (2000 Hz only) (P300, Go trial).
Reduced left lateralization (CP5) in CEM compared to Comparison group (1100 Hz only) (post-P300, No-Go trial).
Higher mean power in T7 electrode in CEM group compared to the Comparison group (combined 1100 Hz and 2000 Hz) (P300, combined Go and No-Go trial).
Higher power in F3 electrode in CEM compared to the Comparison group (combined 1100 Hz and 2000 Hz) (P300, No-Go trial).
Behavioural-EEGC3/C4 electrode pair (P300, Go trial) showed both right and left lateralization effects associated with Go accuracy and right auditory sensitivity.
FC1/FC2 electrode pairs (post-P300, No-Go trial) right lateralization was associated with PPVT score and right and left auditory sensitivity.
Publisher’s Note: MDPI stays neutral with regard to jurisdictional claims in published maps and institutional affiliations.

