1. Introduction
The combustion of thermite mixtures is an important technological process in the welding industry, for the production of high-energy materials, and is being introduced into the electronics industry [
1,
2,
3]. Thermites are used as components of gas-generating mixtures and pyrotechnics. Energetic nanocomposites, such as nano-thermites, are attracting more attention for their high reaction enthalpy and environmentally benign products compared to explosives containing carbon, hydrogen, nitrogen, and oxygen [
4,
5,
6,
7,
8]. Thermite mixtures based on aluminum nano-powder, in particular in mixtures with iron oxide nano-Al + Fe
2O
3 and nano-Al + Fe
3O
4, are widely used [
9].
The combustion of thermite mixtures proceeds with a large temperature gradient [
9], which corresponds to a significant change in the brightness of the glow during combustion. The use of traditional means of high-speed imaging with passive filtering makes it possible to observe the flame of a burning material, but does not allow one to examine the surface of the sample itself, which remains shielded by the bright glow of the flame. In this regard, the problem of “peering through the flame” in the study of high-temperature combustion processes is topical [
10,
11,
12,
13]. Promising optical visualization methods are laser illumination [
10,
11,
12] and laser monitoring [
12,
13]. The use of an amplifying medium, based on copper bromide vapor in a laser monitor, seems to be more promising due to a number of advantages compared to a high-temperature medium based on copper vapors. It has a lower operating temperature, higher optimal and maximal pulse repetition rates [
14], and the possibility of a significant reduction in radiation power when implementing the concept of independent control of temperature parameters [
15].
For the first time, the surface of a burning nano-Al + Fe
2O
3 thermite mixture was observed by us in [
16], using a laser monitor. In [
17], the possibility of studying the surface of a metal nano-powder in situ during laser initiation was demonstrated. The laser monitor allows not only the visualization of the surface, but also the evaluation of the optical properties of the surface, for example, the change in the reflection coefficient. In [
18], we observed a significant (up to 2.5 times) change in the intensity of the images formed by the laser monitor due to a change in the reflection coefficient of the surface of the aluminum nano-powder during combustion. This feature of changing the surface can impose restrictions on the dynamic range of the high-speed cameras used. In addition, the question of choosing between monochrome and color cameras when they work as part of a laser monitor remains open. Black and white monochrome cameras have a higher sensitivity than color ones. The laser monitor images are also monochrome at a gain wavelength of 510.6 nm.
In our previous works, for example in [
19], we used an additional USB camera for flame registration, while it was not synchronized with a brightness amplifier and a high-speed camera. Therefore, the images of the sample surface and the flame were asynchronous. In this regard, the purpose of this work was to develop a scheme for synchronous, high-speed registration of images of the surface of a burning material and flame images in real time, and to test the developed imaging system in the study of the combustion of an ultrafine mixture. In addition, the task of the work was to study the change in the optical properties of the surface of a thermite mixture based on aluminum nano-powder and iron oxide as one of the most widely used fuel materials.
2. Experimental Details
During the experiments, we visualized the combustion of a thermite mixture of nano-Al + Fe3O4. The mixture contained 60% aluminum nano-powder and 40% iron oxide. The particle size distribution was near lognormal with a maximum of 180 nm for aluminum nano-powder and 10 μm for Fe3O4. The particle size distribution was measured using a Shimadzu nanoparticle size distribution analyzer (SALD-7101) in isopropanol medium (99.99%). A powder sample that forms a rectangular elongated shape was placed on an aluminum substrate of 4-mm thickness. The samples were prepared using a 20 × 5 × 3-mm3 mold to provide the shape, whose burning time would be convenient for measurements. The ignition was provided by a semiconductor laser with a power of 2 W in a continuous mode with a wavelength of 660 nm. The laser had an external trigger for controlling the radiation power; the duration of laser action was 0.2 s for guaranteed ignition.
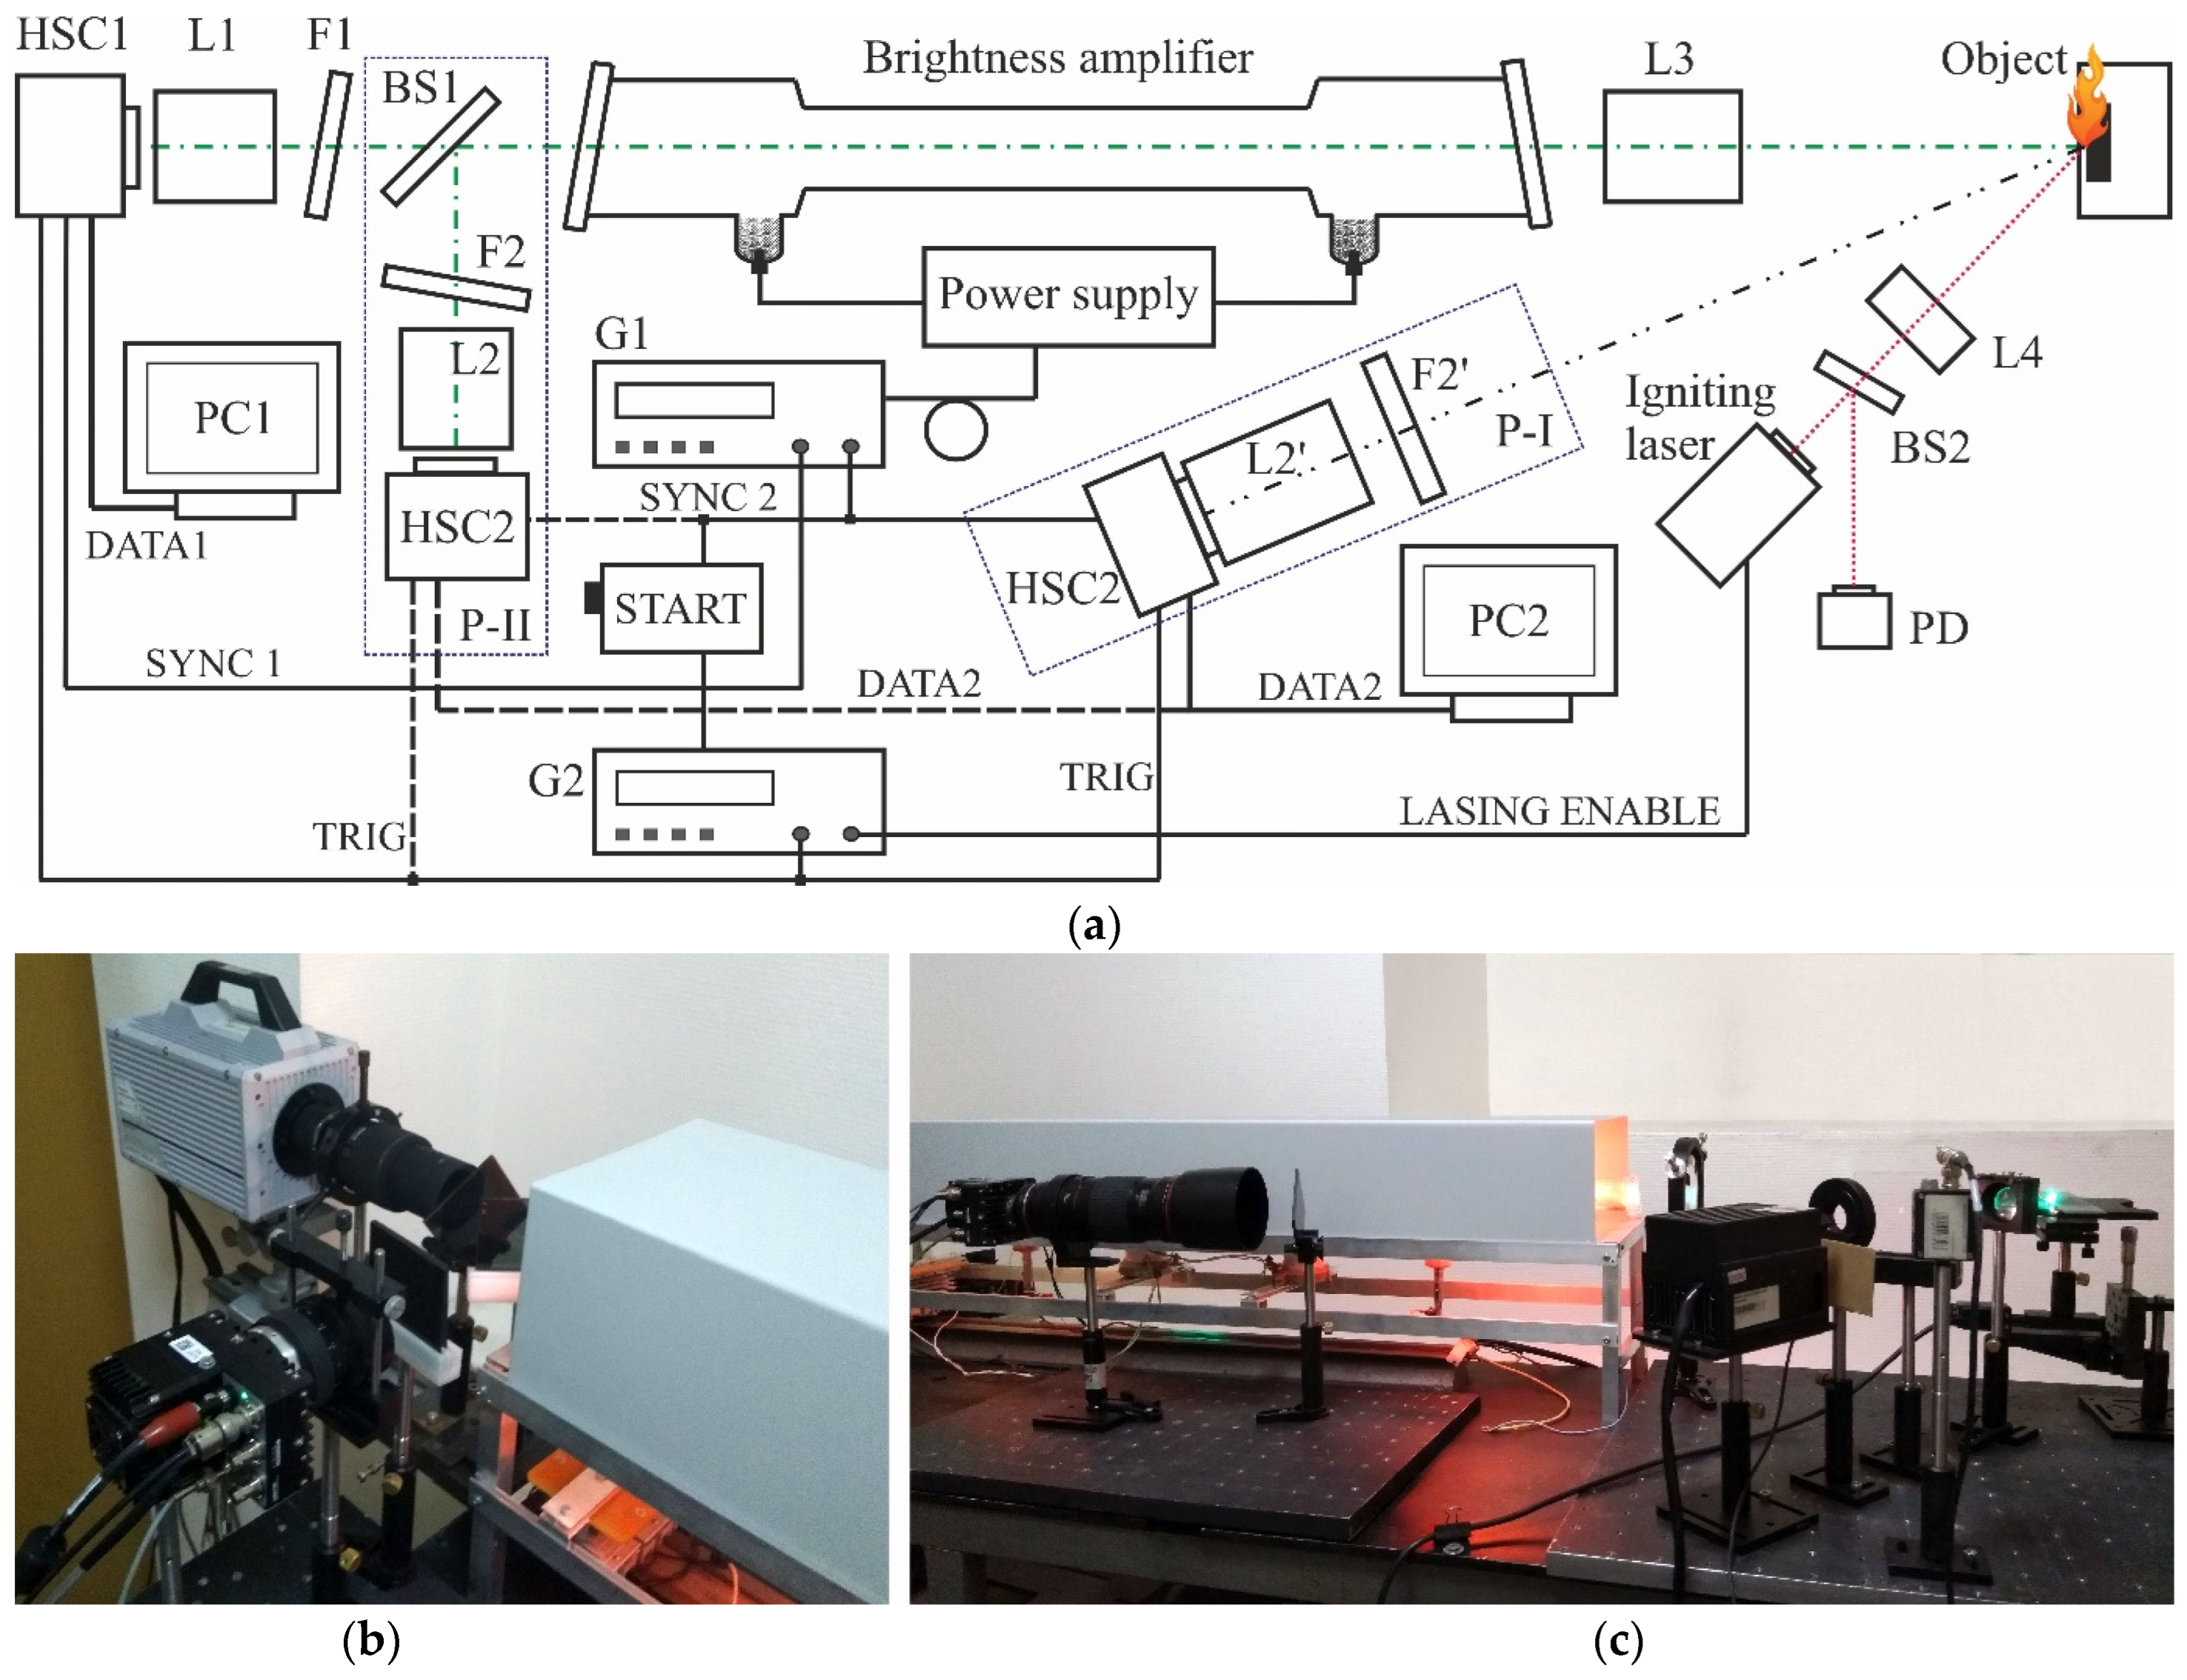
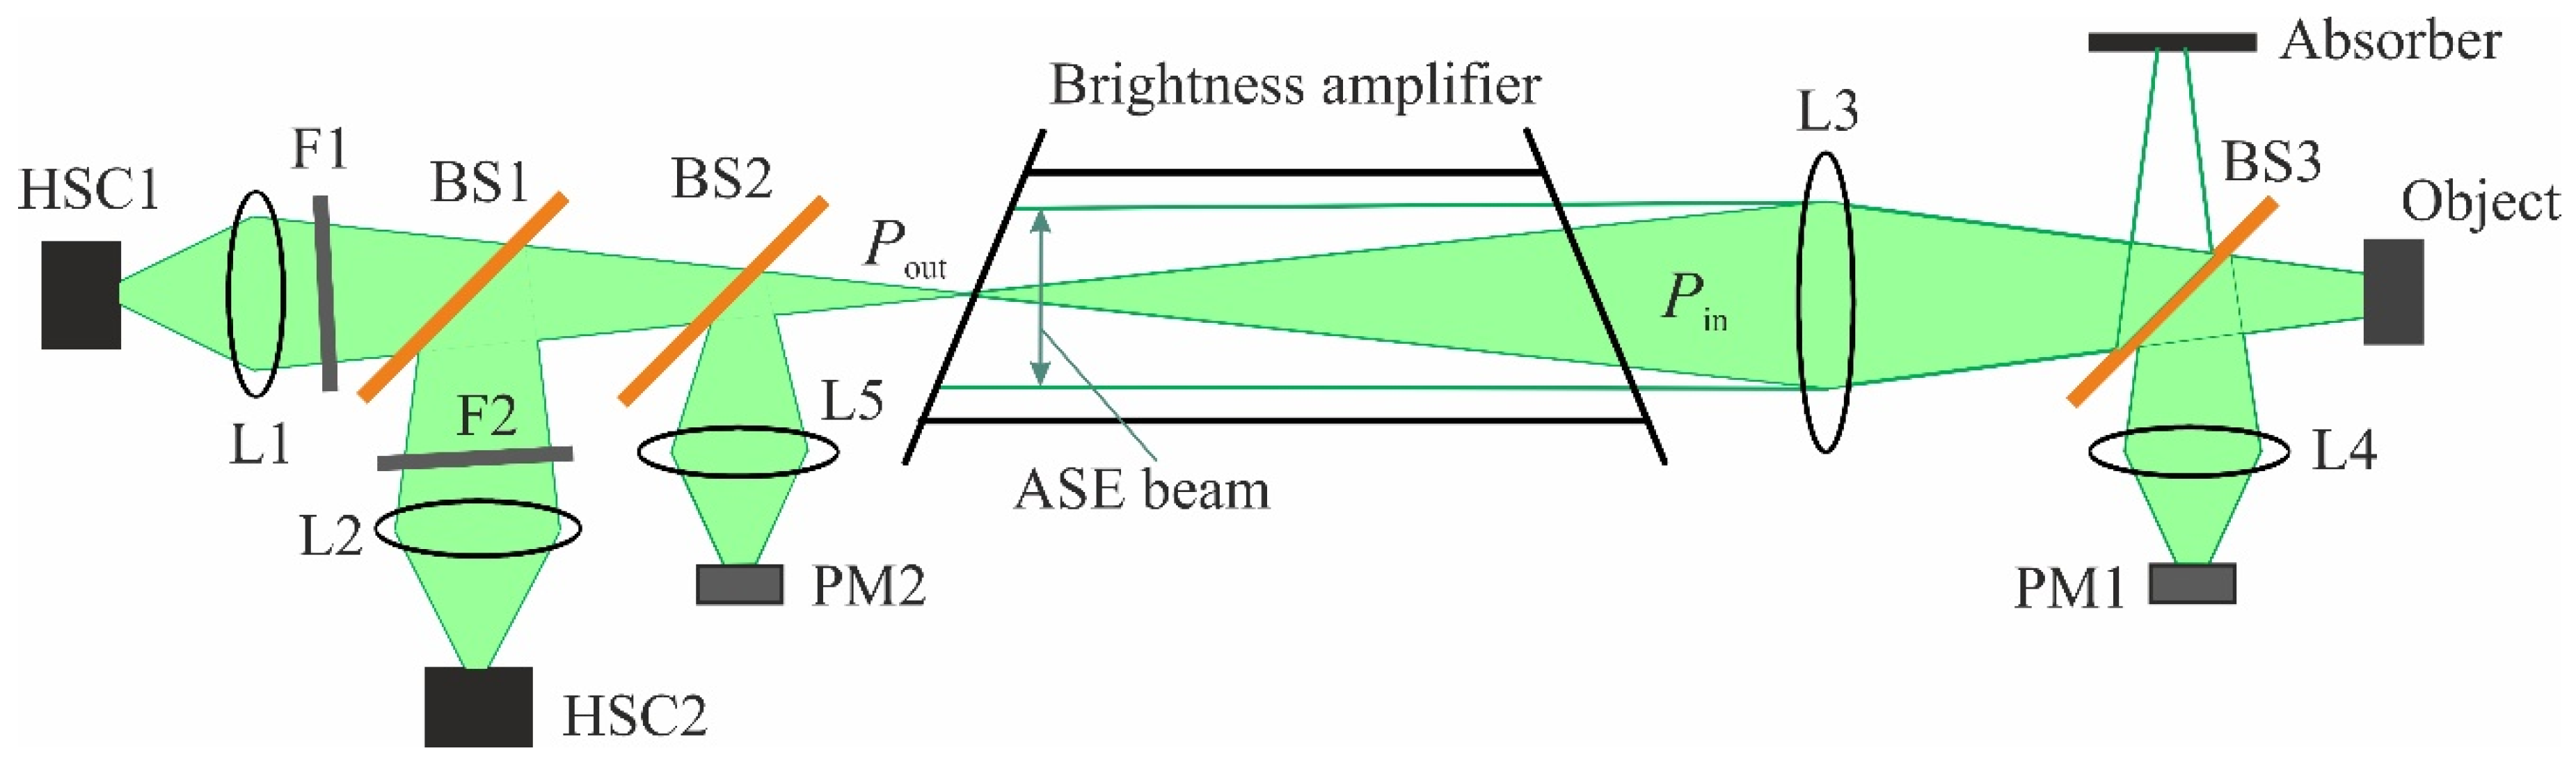
The experimental setup is presented in
Figure 1. The scheme had two configurations. In the basic configuration, the surface of the sample was visualized simultaneously with a laser monitor with a high-speed camera HSC1 and the flame of a burning sample by direct video recording with a high-speed camera HSC2 (located in position P-I). A lens with a focal length of 50 cm (L3) formed the laser monitor images. The maximum monitored area was 6 mm in diameter with a spatial resolution of 12.5 µm. The actual area of view was determined by the active resolution of the camera matrix and was 4.5 × 4.5 mm
2 at a resolution of 1024 × 1024 pixels and 2.25 × 2.25 mm
2 at a resolution of 512 × 512 pixels. The output lasing of the brightness amplifier was focused on the matrix of the high-speed monochrome camera Photron FASTCAM SA1 (HSC1) with a matching Sigma EX DG Macro 105 mm camera lens (L1). A high-speed color camera Phantom Miro C110 (HSC2) with a Canon Macro Lens EF 180 mm lens (L2’) provided direct observation of the combustion. A gray filter (F2’) with a transmission of 45% was installed to suppress partially the brightness of the combusting materials.
The difference in the second configuration of the scheme was the simultaneous registration of the same image of the laser monitor by two different cameras with the same recording speed (the HSC2 camera was set to the P-II position). In this case, the same radiation pulse of the brightness amplifier formed the images of both cameras. In this configuration, the timing of the circuitry was adjusted to allow comparison of laser monitor images taken from cameras with different light sensitivity and color modes: monochrome Photron FASTCAM SA1 (HSC1) with a light sensitivity of 10,000 and color Phantom Miro C110 (HSC2) with a light sensitivity of 640 (ISO12232 SAT standard) [
20,
21]. The frame rate of both cameras was set to 900 fps at a resolution of 1024 × 1024 pixels and an exposure of 5 μs (HSC2) and 4 µs (HSC1).
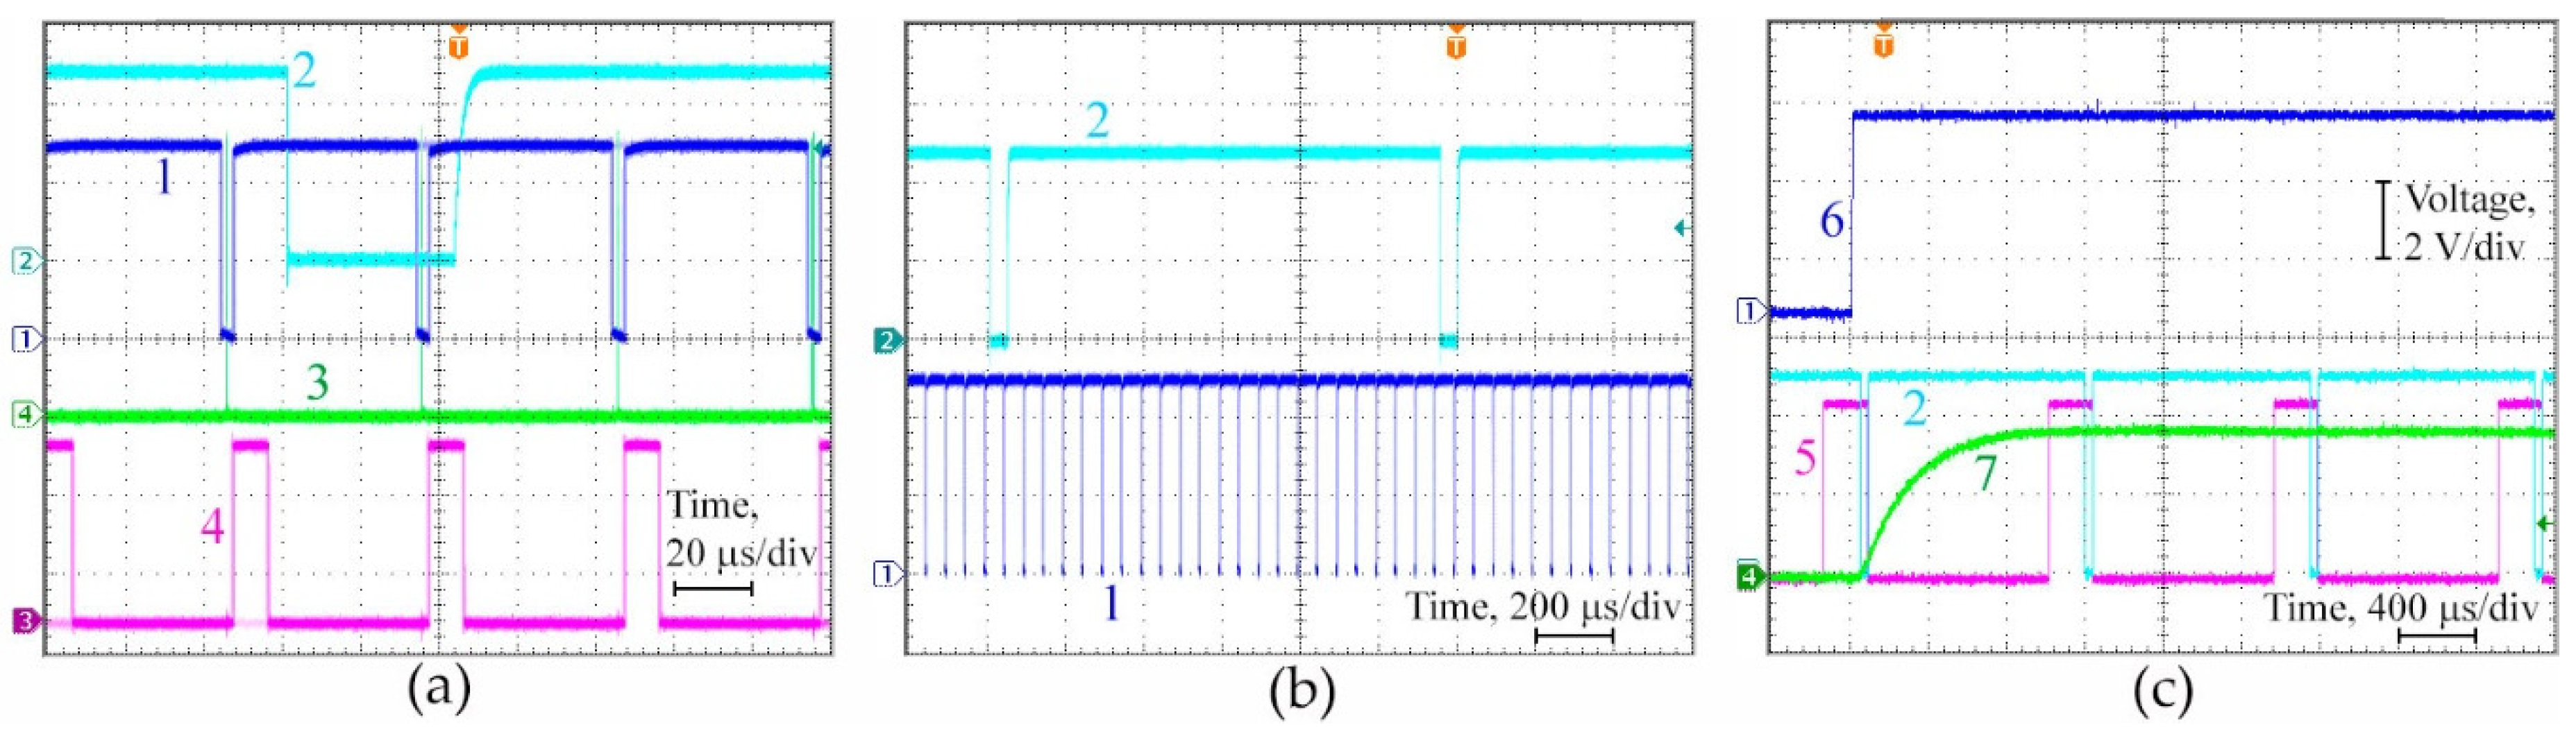
Figure 2 presents the oscillograms of the operation of the experimental setup. The frame rate of the camera HSC1 was 20,000 fps and provided a recording time of 1.1 s. The camera had 512 × 512-pixel resolution at this frame rate. The camera exposition was set to 4 µs. The real exposure was equal to the brightness amplifier emission pulse of 30 ns. The frame rate of the camera HSC1 was 900 fps with a recording time of 5.6 s. The camera had 1280 × 1024-pixel resolution at this frame rate. The exposition of the camera HSC2 was set to 40 µs.
In this work, we used a laboratory-made copper bromide brightness amplifier previously applied in [
13,
15,
19]. The gas-discharge tube of the brightness amplifier had an aperture of 3 cm and an active area length of 60 cm. Highly stable (±1 °C) independent heating of the active area and containers with copper bromide provided the temperature parameters of the tube operation. The active medium was pumped by a thyratron pulsed power supply with a pulse repetition frequency of 20 kHz. Operational conditions were optimized to provide a uniform beam profile of an amplified spontaneous emission (ASE) and a relatively low ASE average power of 24 mW at 510.6-nm wavelength (measured at the site of the object) and ~0 mW at 578.2-nm wavelength. We used this mode of operation of the active element in [
15].
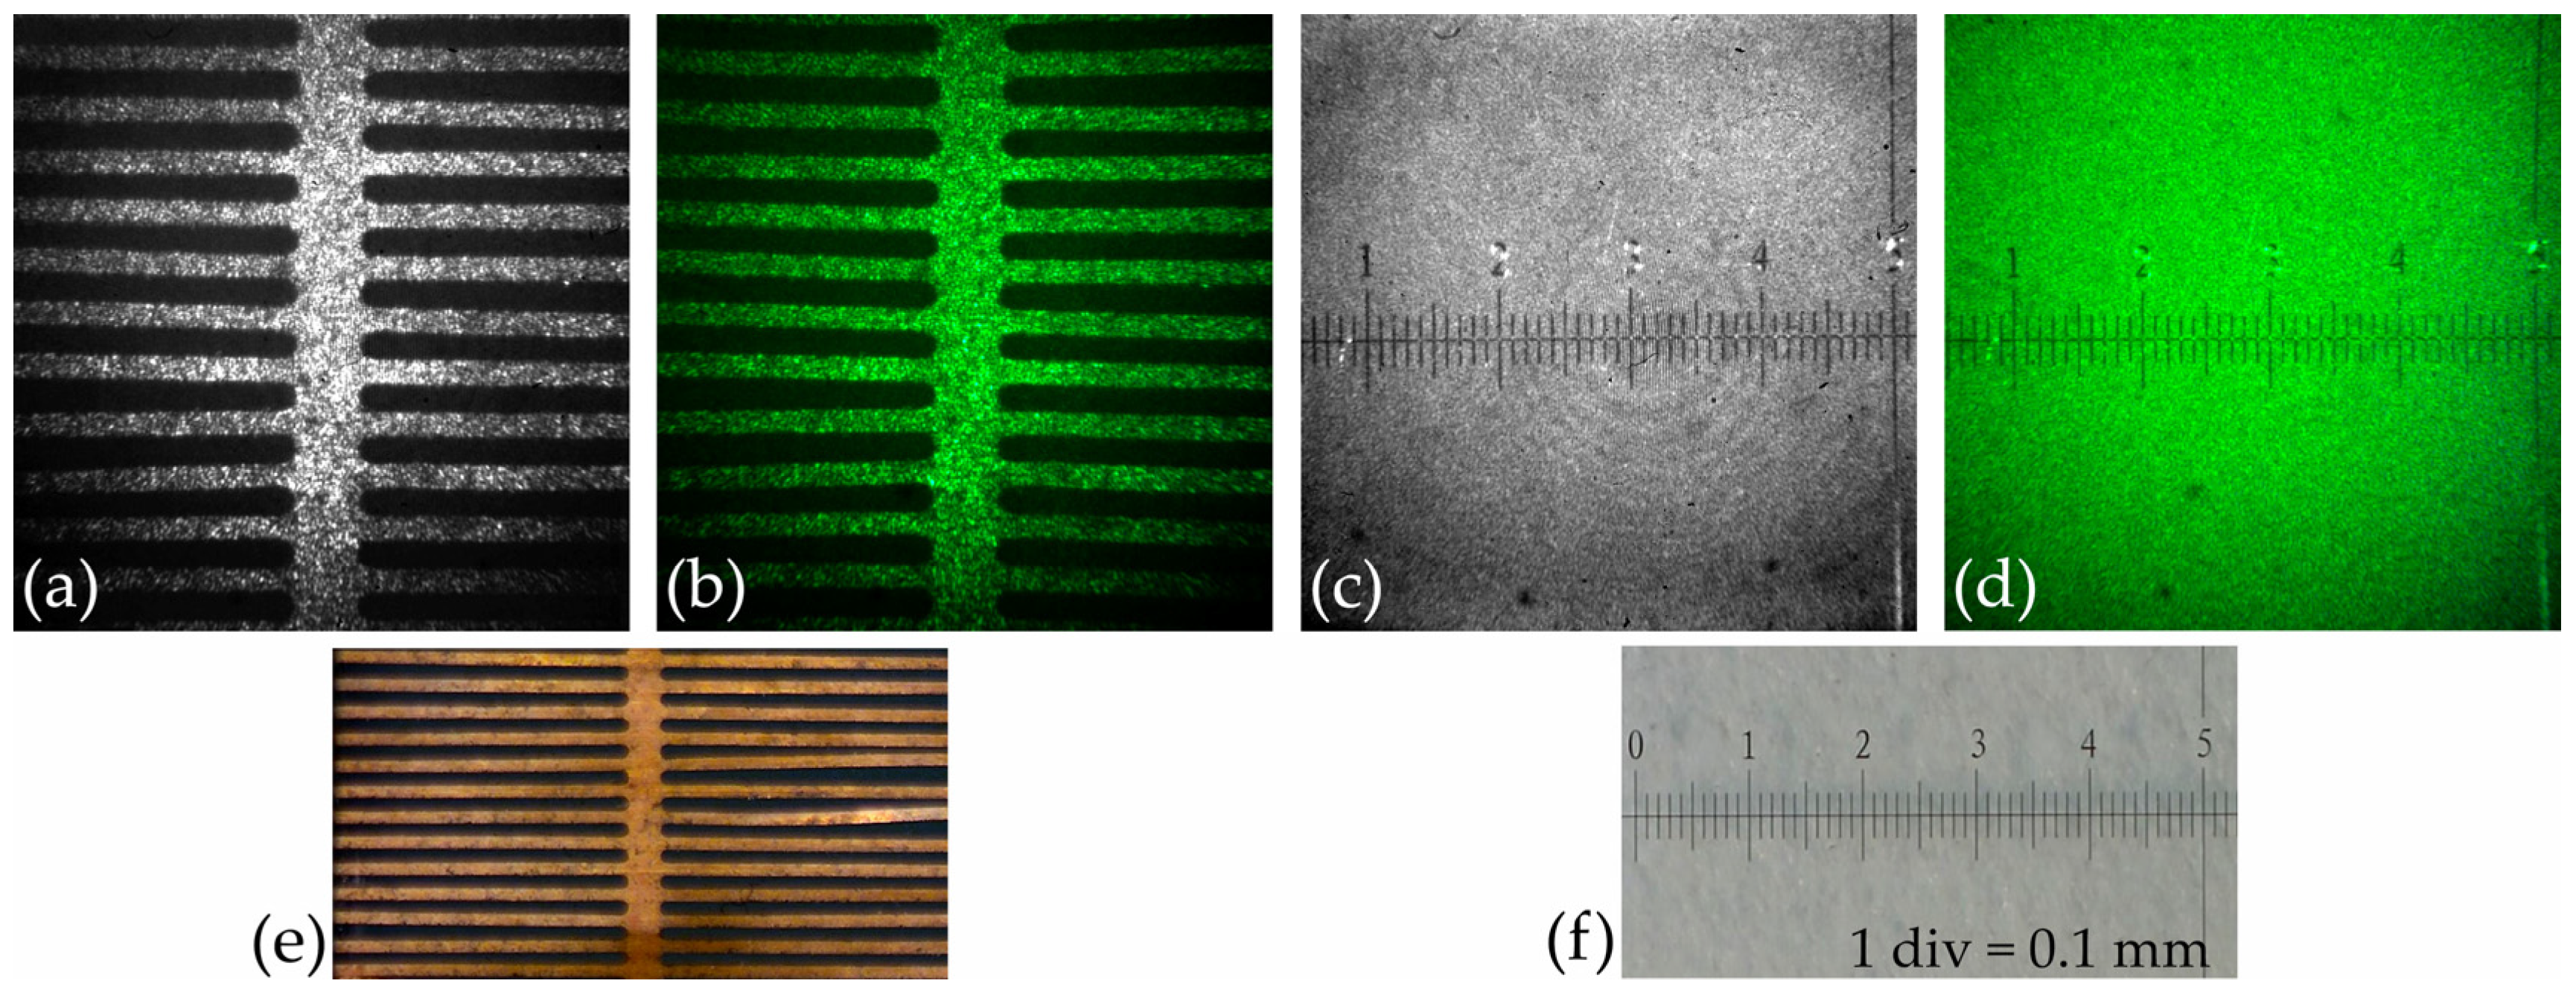
Figure 3 presents images of test objects (an aged copper grid and a glass microscopic ruler) recorded simultaneously with both cameras in position P-II (
Figure 1b). When recording an image of a laser monitor with two cameras, the image is formed by the same radiation pulse of the brightness amplifier. At the same time, the brightness of the images is visually different. Due to the higher sensitivity of the Photron FASTCAM SA1 camera, the inhomogeneity of the background radiation of the brightness amplifier is visible when visualizing the glass ruler (c). On the other hand, the image of the copper grid in the center is brighter (a), compared to the image of the same grid surface (b) when visualized with the camera Phantom Miro C110.
3. Results and Discussion
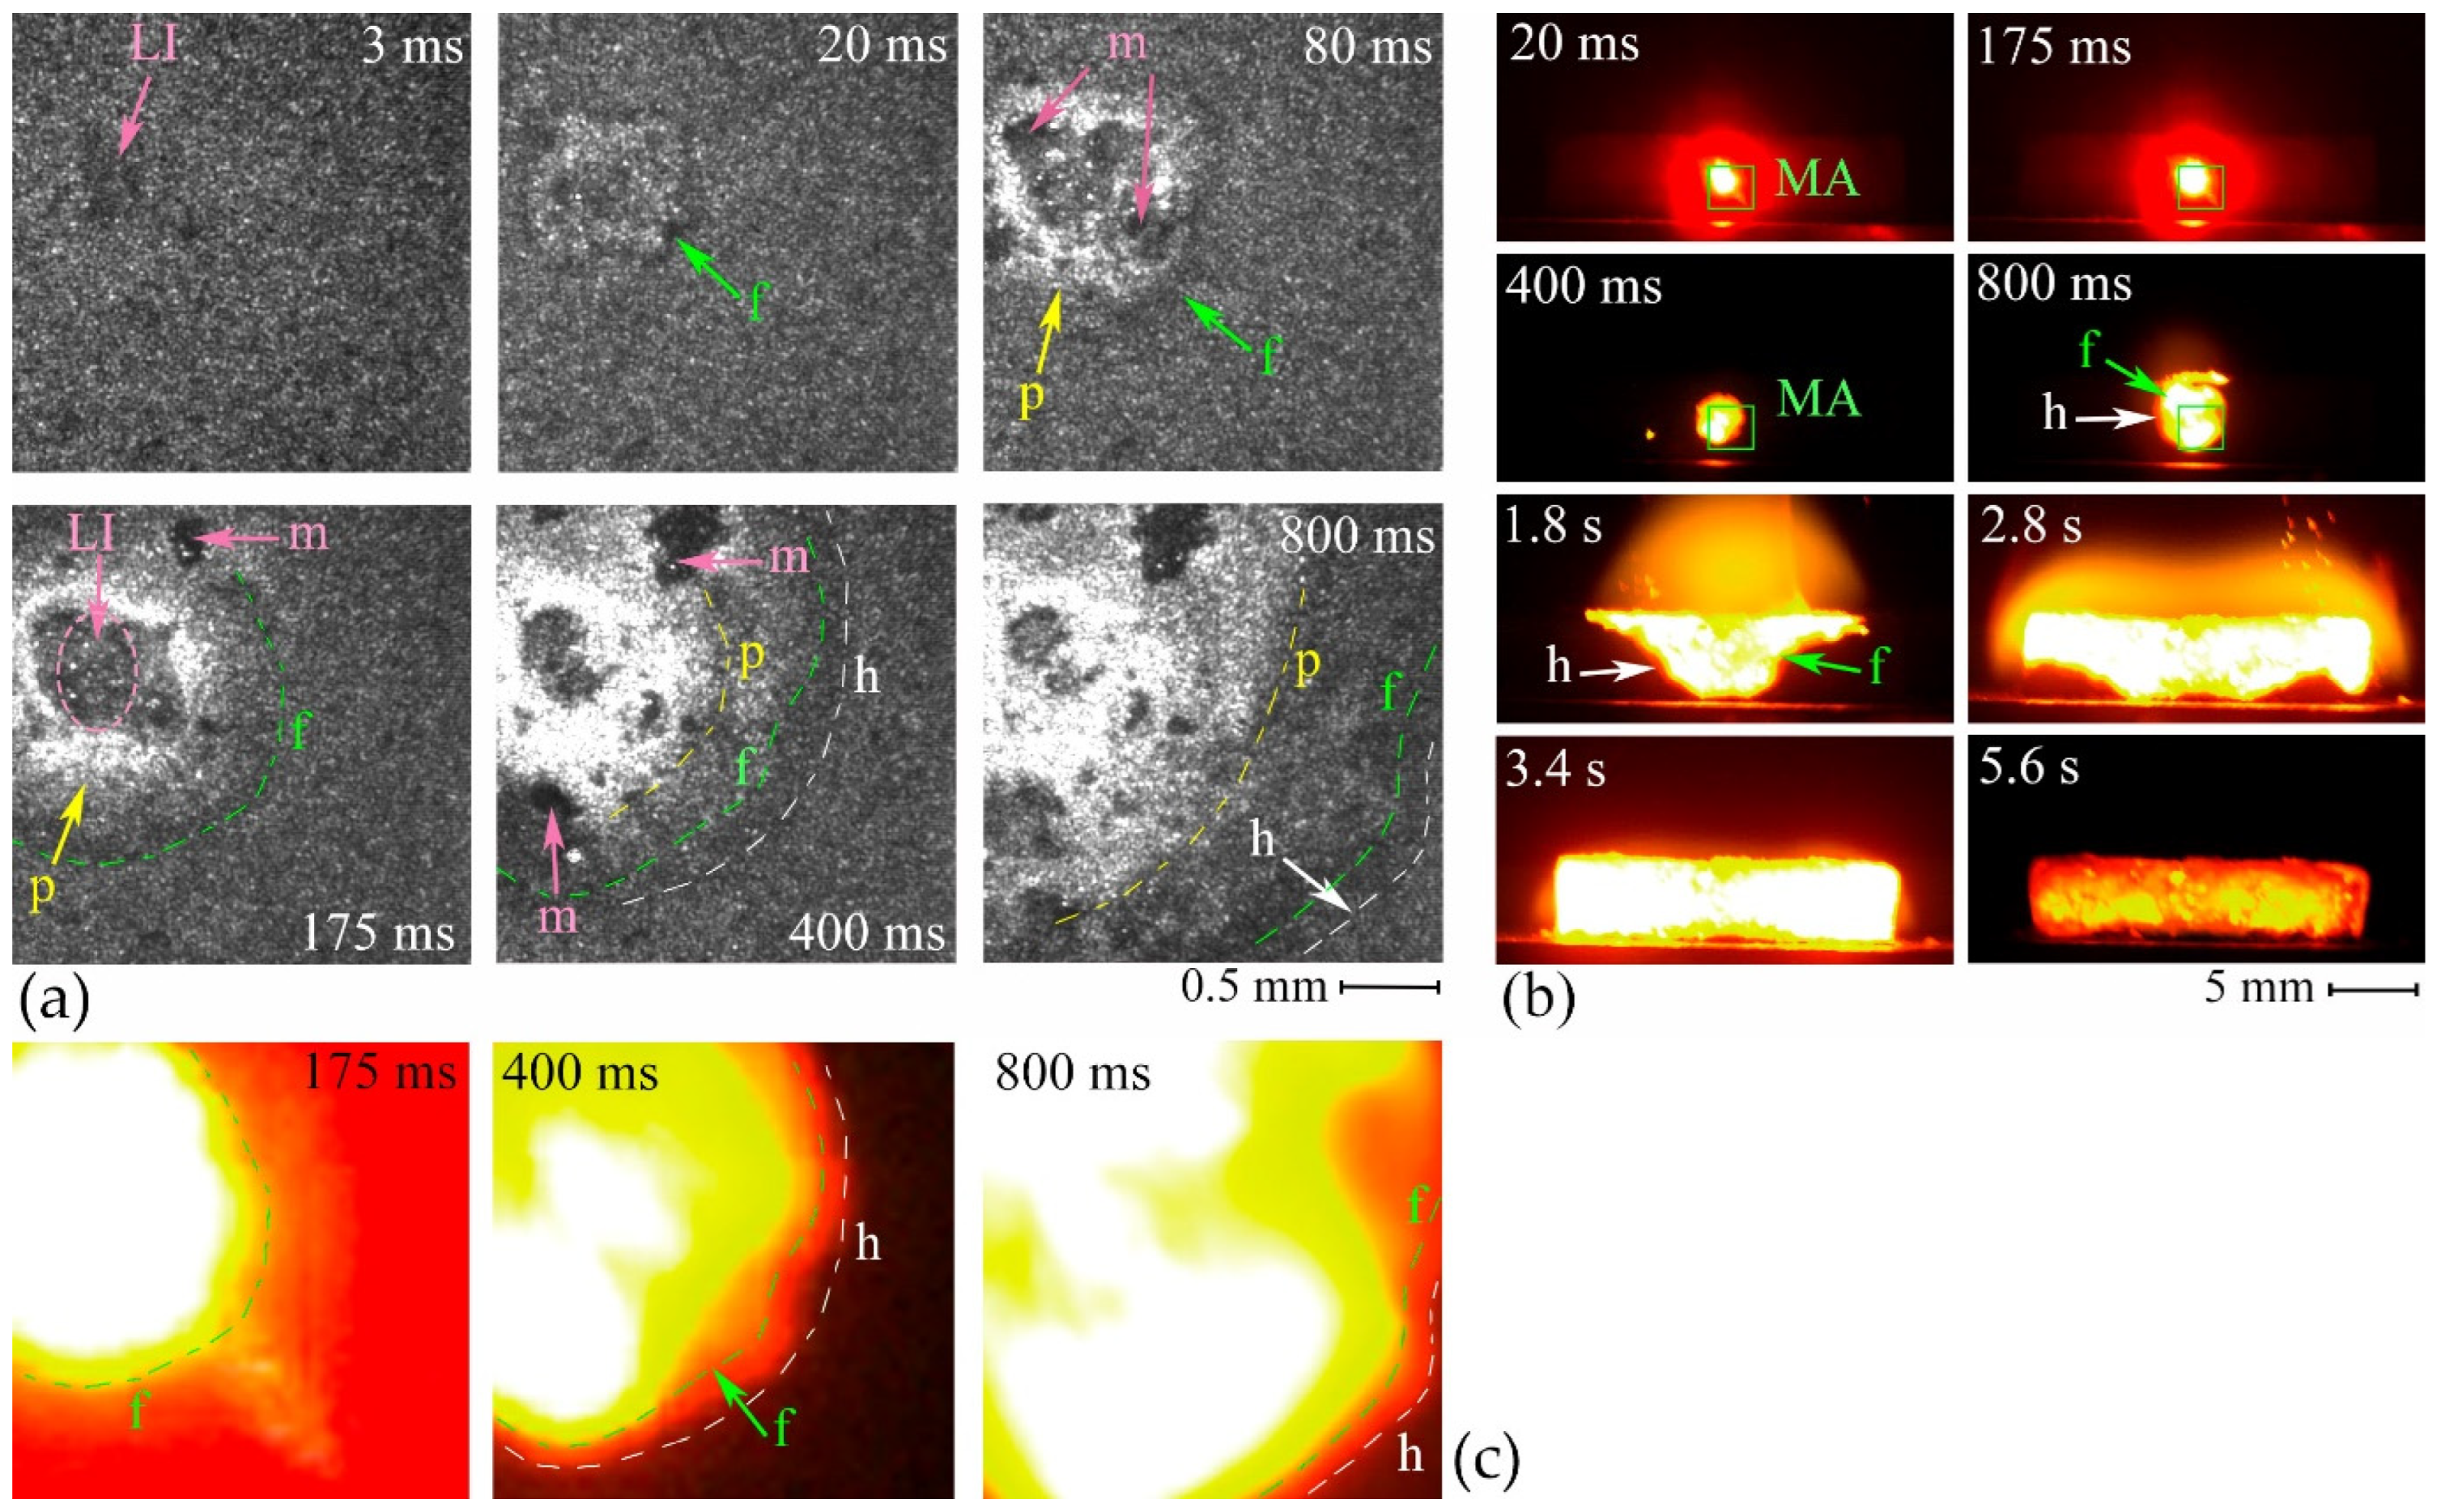
The results of simultaneous visualization of the flame of the burning sample and the surface of the nano-Al + Fe
3O
4 mixture using the scheme in
Figure 1 with the location of the HSC2 camera in position P-I are shown in
Figure 4. Imaging with HSC2 (
Figure 4b) provides information about the propagation of a flame with different brightness of the glow (different temperatures) through the sample. A brighter part with greater emissivity is distinguished, corresponding to the propagation of the combustion wave front (f), and a less bright part with less emissivity, corresponding to the heating wave (h). For this thermite mixture, the propagation velocities of the combustion wave and the heating wave along the sample practically coincide and amount to 1.3–1.8 mm/s, while the width of the heating region varies from 0.1 to 0.8 mm in the time period from 0.4 to 2.8 s (for six samples). In all cases, the propagation proceeds almost symmetrically from the point of initiation, first in the form of a circle, then in the form of stripes to the edges of the sample.
The propagation of the combustion wave over the surface of the sample (laser monitor images in
Figure 4a), in general, coincides with the propagation of the flame front (
Figure 4c).
Figure 4c with dotted lines overlays the borders visualized in
Figure 4a. In the heating area, the reflection coefficient slightly decreases; the image of the laser monitor darkens. In this case, the combustion wave front propagating over the surface consists of two visually distinguishable components. The first component is relatively dark, which immediately follows the combustion front (highlighted by the green dotted line). The second component, which is lighter (highlighted by the yellow dotted line), probably represents aluminum-containing combustion products, as well as sintered aluminum nano-powder. Due to the bright glow, its borders are not visible during direct high-speed video recording.
The area of laser ignition is difficult to visualize directly due to the illumination created by both the flame and the radiation of the initiating laser. When visualized in its own glow (
Figure 4b), the surface of the sample is overexposed, and the details of the surface are almost indistinguishable. Using a laser monitor, we see small liquid droplets at the focus of the initiating laser beam (highlighted by a dotted ellipse) during its action (up to 200 ms). After the end of exposure, a hollow then forms at the site of initiation, which partially flattens over time.
According to the laser monitoring data, in the area of laser initiation in the range of 0.08 to 0.8 s, the propagation velocity of the combustion wave front was 2.4 to 4.7 mm/s, that is, higher than in the sample as a whole. The propagation velocity is likely higher in the initiation region due to overdriving the reaction. The formation of combustion products on the surface is also symmetrical (
Figure 4a), as is the spread of the flame. We see the character of the formation of the structure in the form of stripes as combustion spreads (shown by dotted lines). In contrast to the surface character of the change in the surface during the combustion of aluminum nano-powder [
18,
19], when the surface remains practically unchanged during the first low temperature combustion stage, in the case of the nano-Al + Fe
3O
4 thermite mixture, products with a low relative reflection coefficient are formed behind the heating wave front. At this moment, the formation of the AlFe intermetallic compound probably occurs. Marked strips are present during the propagation of the heating wave and smooth out during the high-temperature combustion wave. Thus, laser monitoring makes it possible to study the processes behind the combustion front, providing objective experimental information on the characteristics of the ignition and combustion processes, which is in demand for a deeper understanding of the combustion processes of ultrafine materials and substantiation of theoretical combustion models [
22].
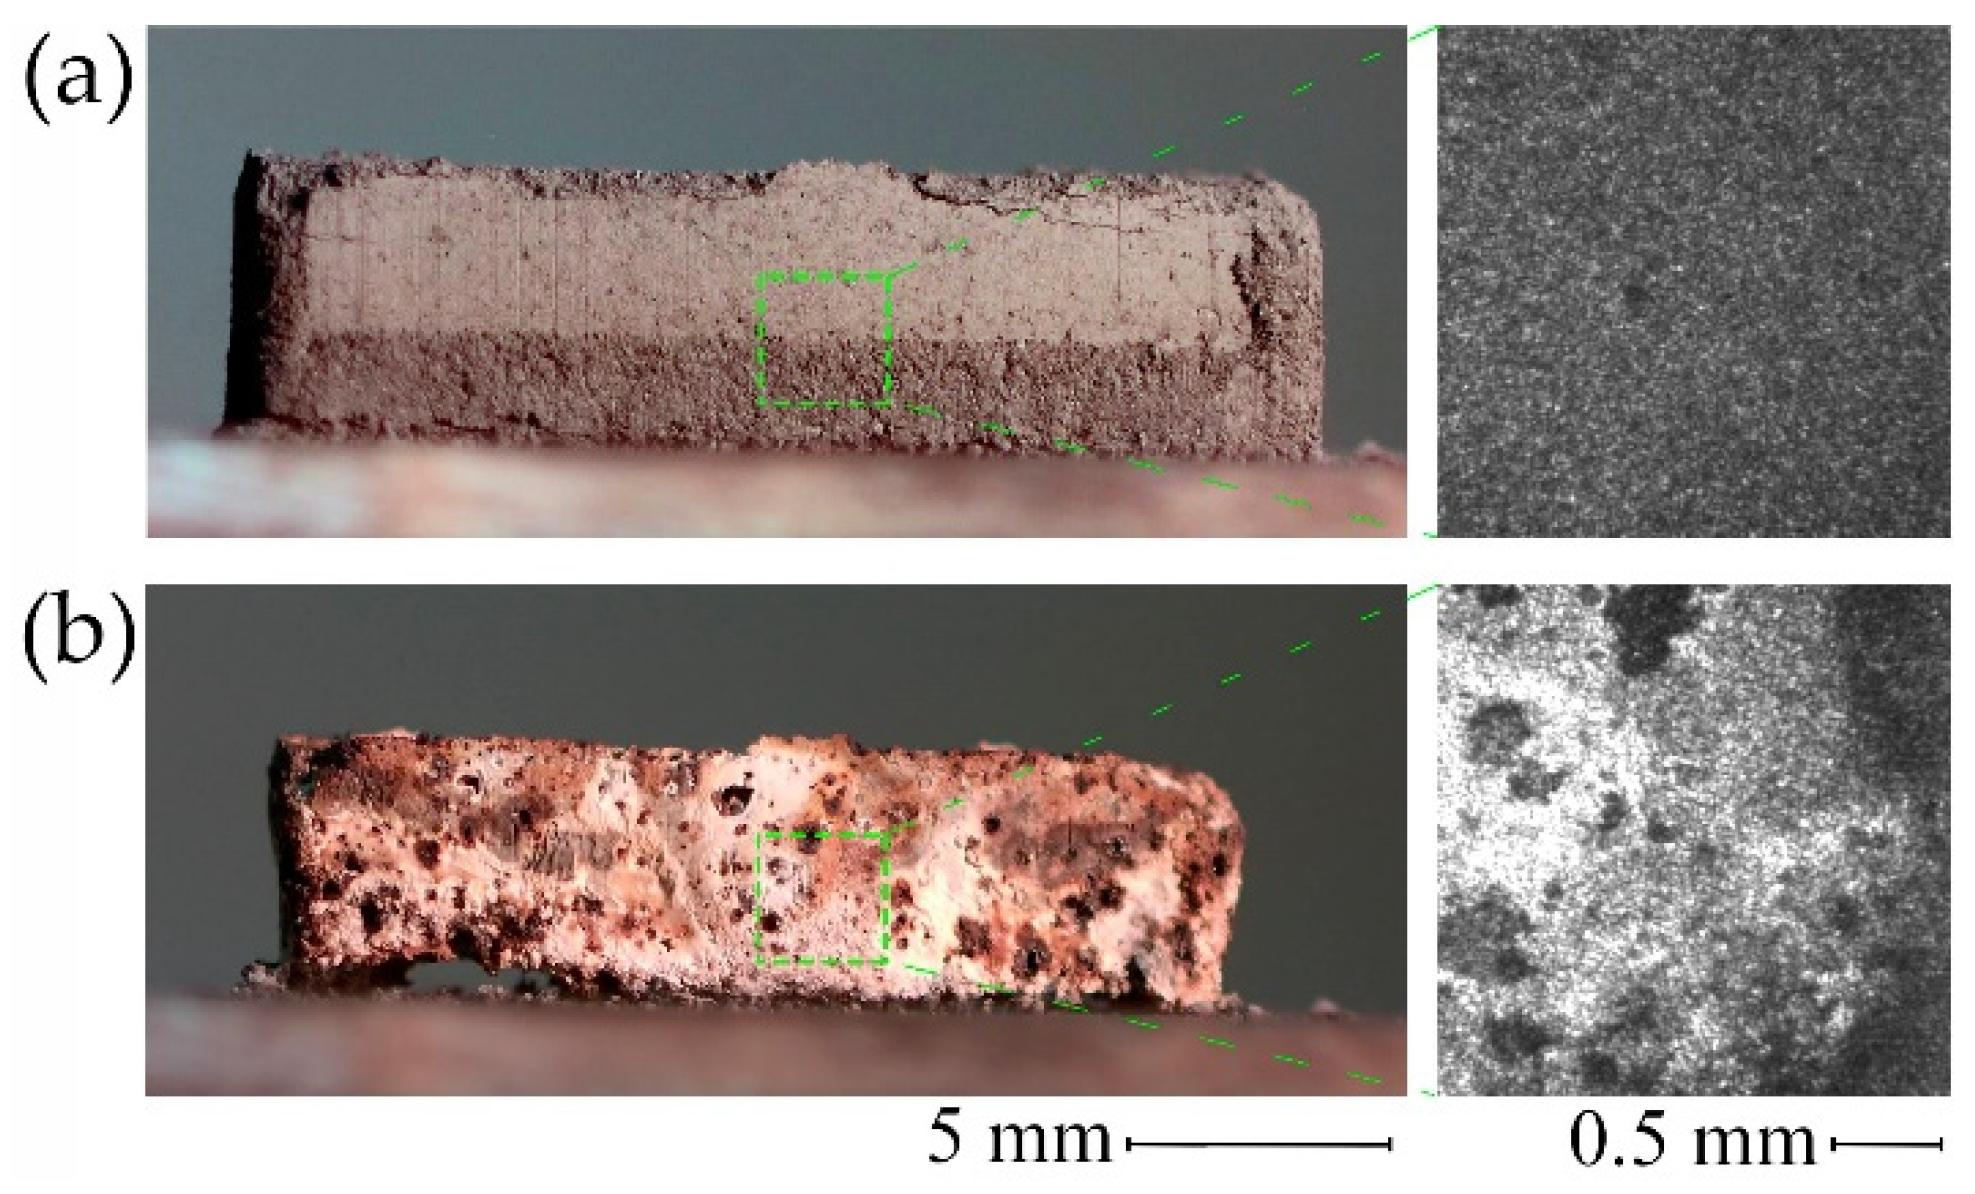
At the high temperature wave front (the brighter boundary f in
Figure 4a), the sample acquires a lighter color due to the formation of agglomerated aluminum-containing products: aluminum nitride, oxide, and oxynitride (AlN, Al
2O
3, Al
3O
3N). The color can change from not only the chemistry change, but also the morphology change. Nano-Al is very dark because it is of nano-scale (
Figure 5). As it reacts and the particles melt/sinter and lose many nano-scale surface features, they will become lighter in color.
In addition, this time interval is characterized by the occurrence of micro-explosions, which are visible in the form of flying particles in the direct video recording. On the surface of the sample, micro-explosions are accompanied by the formation of a liquid melt (
Figure 4a), which, when cooled, leaves hollows on the surface (
Figure 5). Ultimately, the sample acquires a patchy inhomogeneous structure. X-ray phase analysis results are given in
Table 1 obtained with the XRD-7000 Shimadzu diffractometer.
In a laser monitor, the surface of the object of study serves as a feedback element of a quantum amplifier [
14,
23]. Therefore, the reflectance of the object’s surface determines the input signal of the quantum amplifier and its output power, which is recorded by the camera’s matrix as the brightness of the image. The greater the reflectance of the surface of the object, the higher the brightness of the images. The formation of aluminum-containing products and nano-powder sintering during the combustion of a thermite mixture based on aluminum nano-powder leads to an increase in the surface reflectance [
18,
19]. As a result, the amplified image of the products is brighter than the amplified image of the raw material. This is also confirmed by the results of measuring the reflection coefficient of the surface of the nano-Al + Fe
3O
4 mixture before and after combustion, performed in the scheme in
Figure 1 by installing a beam splitter to measure the reflected radiation power (
Figure 6). The reflection coefficient was calculated as
where
P1 is the average power measured by a power meter (Ophir PD300) at the position PM1;
P0 is the ASE power measured at the object site;
KBS3 is the reflection coefficient of the beam splitter BS3;
KL4 is the lens L1 transmission;
P2 is the average power measured at the position PM2;
Pin is the brightness amplifier input power;
Pout is the amplified beam power,
Pin~
P1,
Pout~
P2.
In contrast to the use of a spectrophotometer [
24], the proposed approach to measuring the reflection coefficient estimates only the radiation reflected from a diffuse surface, which is amplified by the laser medium and recorded by a high-speed camera. In fact, this is the ASE of the brightness amplifier reflected from the surface in a spatial angle of ~1.25 msr. The results of measurements and calculations are given in
Table 2 (eight measurements each for the initial mixture and products). We see that when the reflectance increases by 2.7 times, the output power of the brightness amplifier increases by 2.2 times, and the brightness of the images increases by 1.47 (HSC1) and 1.42 (HSC2) times.
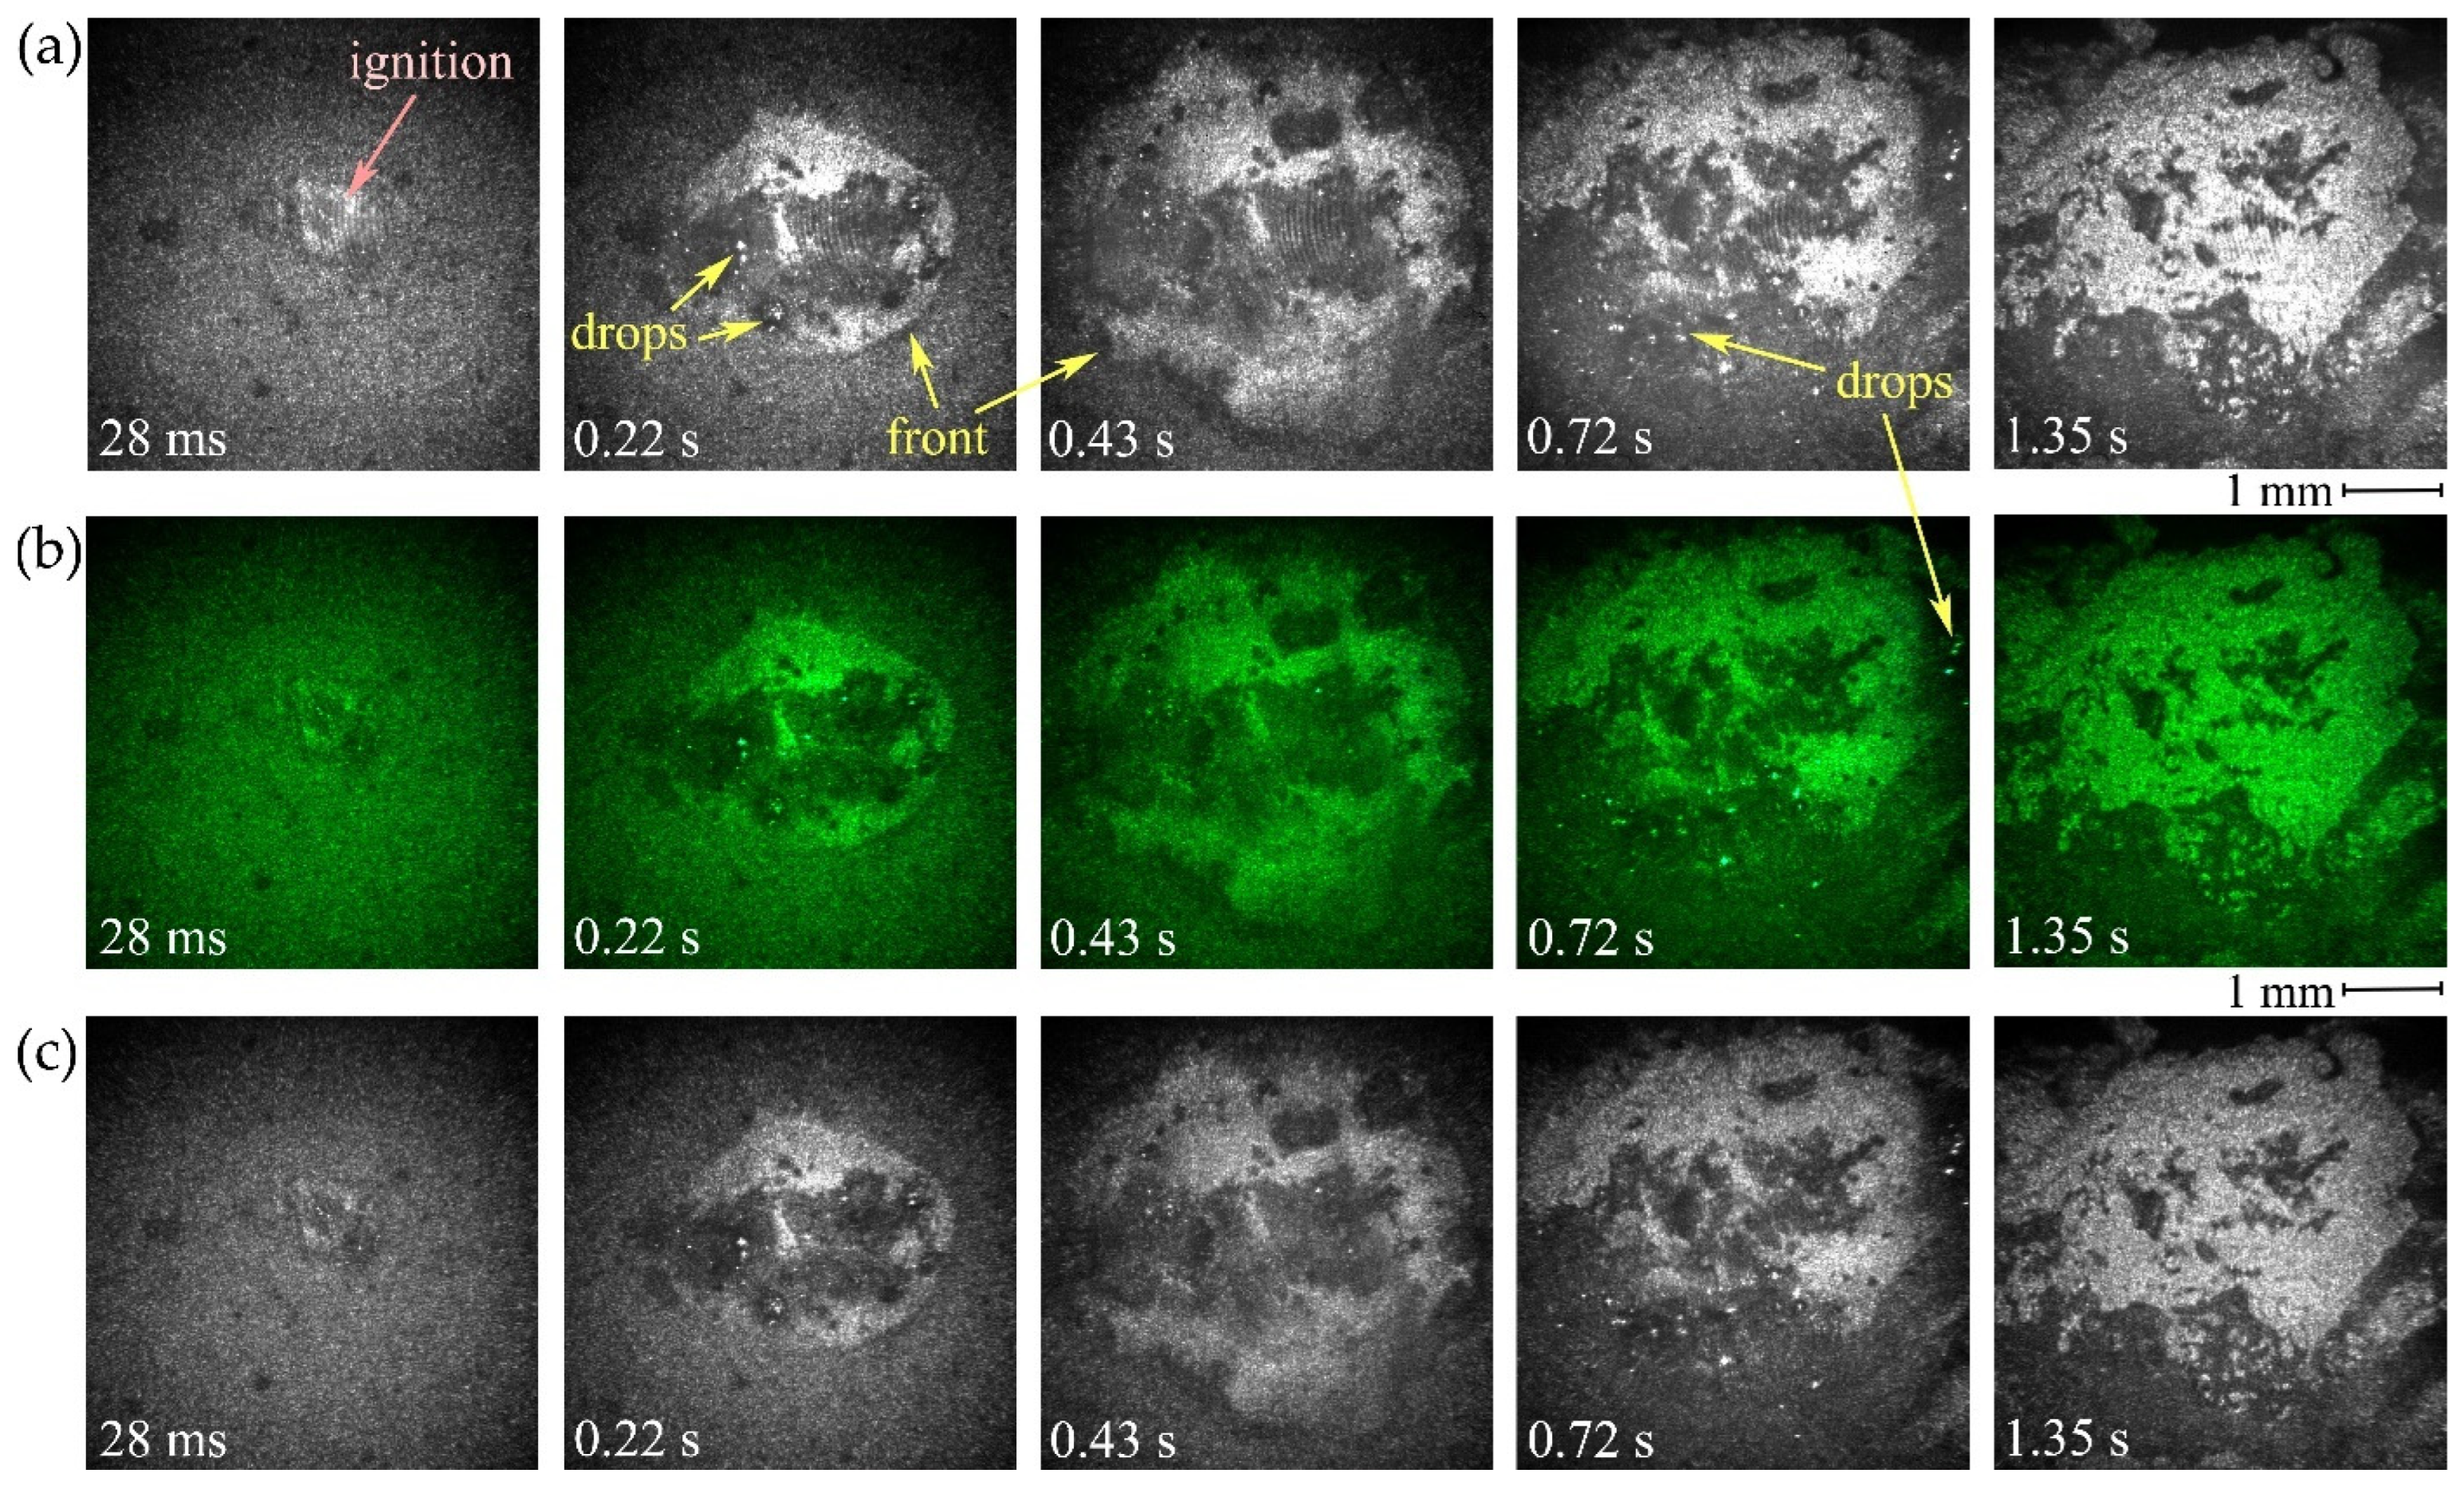
Figure 7 presents sequences of surface images recorded using a laser monitor and two high-speed cameras in the P-II position. The sequences shown in the figure correspond to the same time points in the combustion process, which indicates the accuracy of synchronization of high-speed cameras and the brightness amplifier. Filters F1 and F2 (
Figure 1a) were selected to provide a visually bright images of the surface of the initial nano-powder. Simultaneous visualization of the burning material surface by two cameras showed that visually the brightness of the images recorded by the Photron FASTCAM SA1 camera is higher than the brightness of the images recorded by the Phantom Miro C110 camera. In the first case (a), there are overexposed fragments, which are the result of a significant local change in the surface reflectance of the samples during combustion. Overexposed fragments of images lose information in highlights and are not suitable for digital processing. In the second case, there are no overexposed fragments either in the original images (b), or in those converted to grayscale (c).
Higher resolution of high-speed cameras and a larger area of observation compared to
Figure 4a allows us to more clearly observe the nature of the propagation of the combustion wave over the surface. The object of study is a mixture of spherical nano-Al particles and Fe
3O
4 micro-powder. If in the process of mixing the powders there was a uniform distribution of nano-Al and Fe
3O
4 particles in the volume, the resulting medium will be homogeneous in its properties. This fact is confirmed by the results of observation. During laser initiation, the combustion wave front propagates in the form of an almost even ring with a radius increasing from the point of laser initiation. This is a consequence of the symmetry of the properties of the system under study at the micro level due to the symmetry and homogeneity of the particles, and at the macro level due to the uniform distribution of particles in the sample volume.
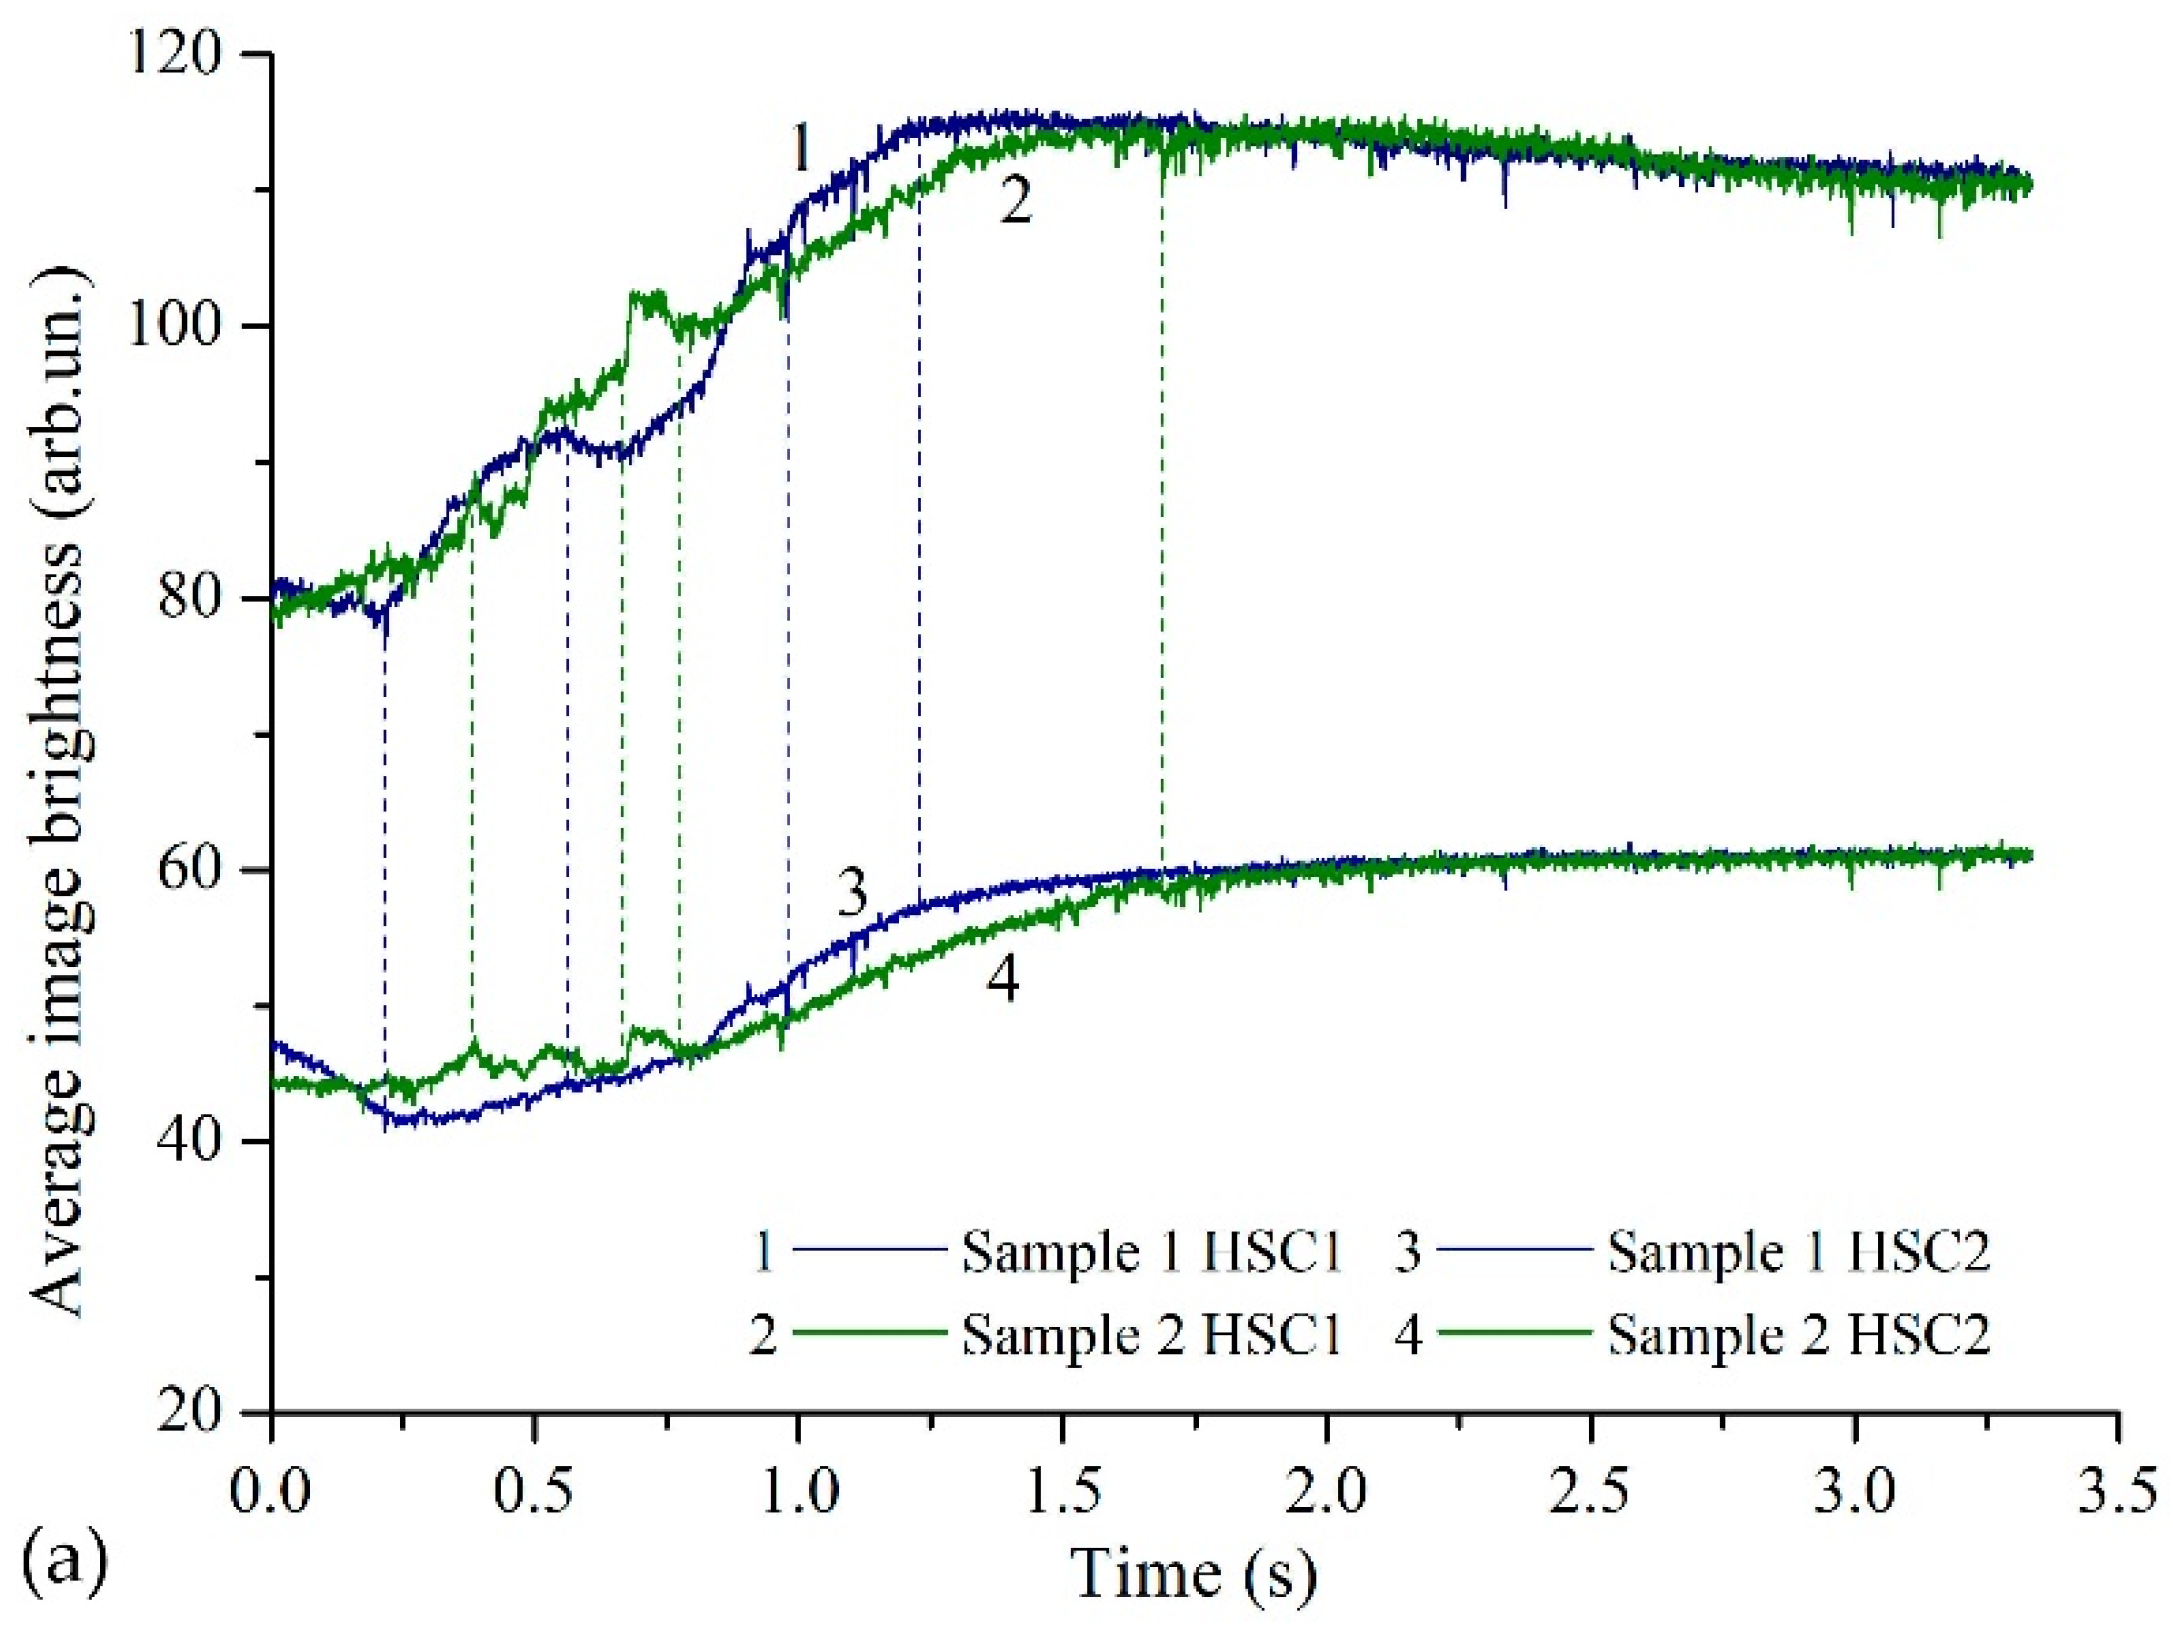
Figure 8a presents the average brightness curves of the surface images during combustion amplified in brightness and recorded by both cameras (HSC1, HSC2). The average brightness is calculated by averaging the brightness of the pixels. Two samples of the nano-Al + Fe
3O
4 mixture were visualized. For sample 1, the difference between the minimum and maximum values with respect to the minimum value is 51.3 and 52.0%, respectively, for the cameras HSC1 and HSC2. For sample 2, the values are 48.3 and 47.4%. Thus, the range of intensity in relation to the maximum value is almost the same. The curves reveal characteristic changes in the combustion process, which are shown by dotted lines. Thus, both cameras provide similar relative information about the change in the reflectance of the surface during combustion. In this case, the shape of the curves obtained from the HSC1 images differs from the shape of the curves obtained from the HSC2 images. We suppose that with a significant dynamic range of image brightness, the use of a high-speed camera with high sensitivity can lead to information loss, due to the high brightness of the radiation that carries the surface image.
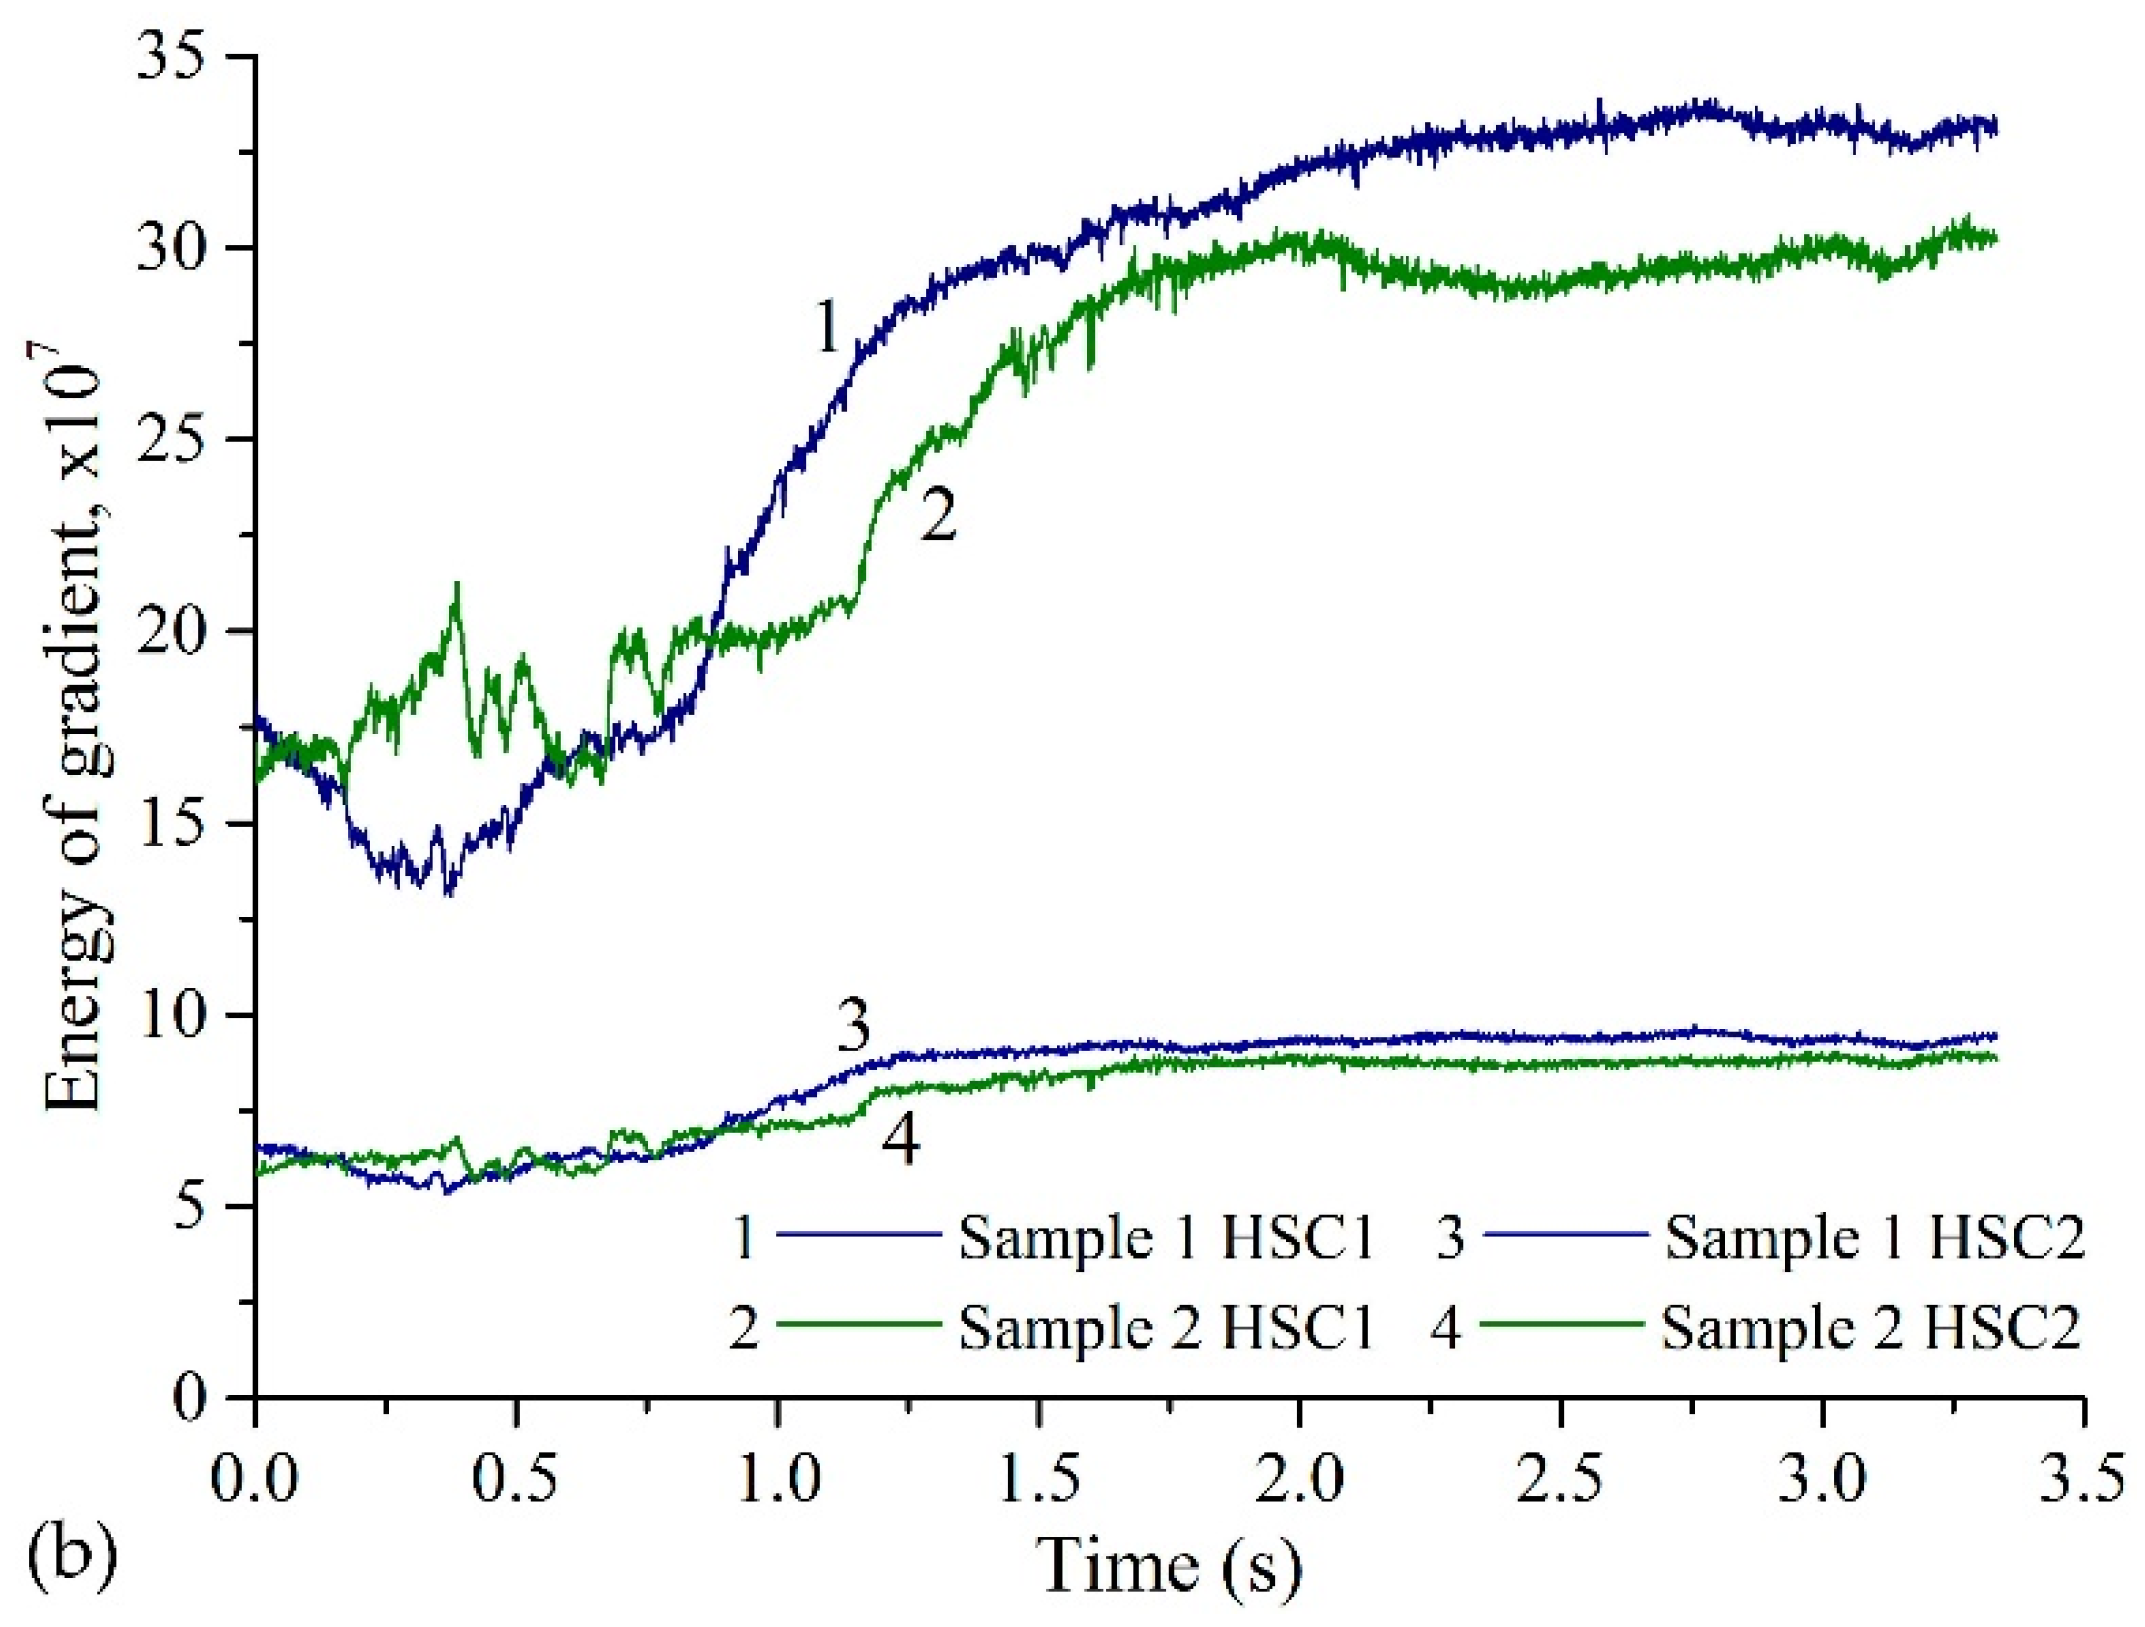
Sharpness is an essential indicator for evaluating the performance of the imaging system. The sharpness of the images can be compared by calculating the image gradient. In order to determine the sharpness of the laser monitor images when studying the nano-powder combustion with different cameras, the energy of image gradient (EOG) can be used as evaluation factor. EOG evaluates the contrast of the smallest details of the image by calculating the gradient between adjacent pixels [
25]. The EOG value is obtained by accumulating the gradients of adjacent pixels by Equation 1:
where
x and
y are the position of the pixel;
f(
x + 1,
y) −
f(
x,
y) and
f(
x,
y + 1) −
f(
x,
y) represent the horizontal and vertical gradients. The images of the laser monitor are monochrome at an amplification wavelength of 510.6 nm, so the color images of the Phantom Miro C110 camera were converted to grayscale. The results of the EOG calculation are presented in
Figure 8b. The figures demonstrate both higher absolute EOG values (three–four times higher for the Photron FASTCAM SA1 camera) and more significant relative changes in image sharpness during combustion. Thus, a camera with a higher sensitivity produces a sharper image. Therefore, if there is a slight change in the reflectance of the surface, which does not lead to overexposed images, the use of cameras with a higher sensitivity is preferable.
Due to the monochromatic images of the laser monitor, for visualizing the surface “through the flame” it does not fundamentally matter whether a color or black and white camera is used. At the same time, the advantage of using a color camera can be the ability to identify the image overexposure created by the initiating laser. During this work, the influence of the initiating laser was not observed, but we did not exclude the possibility that this may occur when using a more powerful initiating laser. The initiating radiation reflected from the object, if it is intense enough, being in the field of view of the optics of the laser monitor, will create glare on the image. When using a color camera, this glare will be clearly distinguishable due to it being a different color. This fact is not a limitation of the use of laser monitoring and is easily eliminated by installing an additional bandpass filter in front of the high-speed camera [
19].
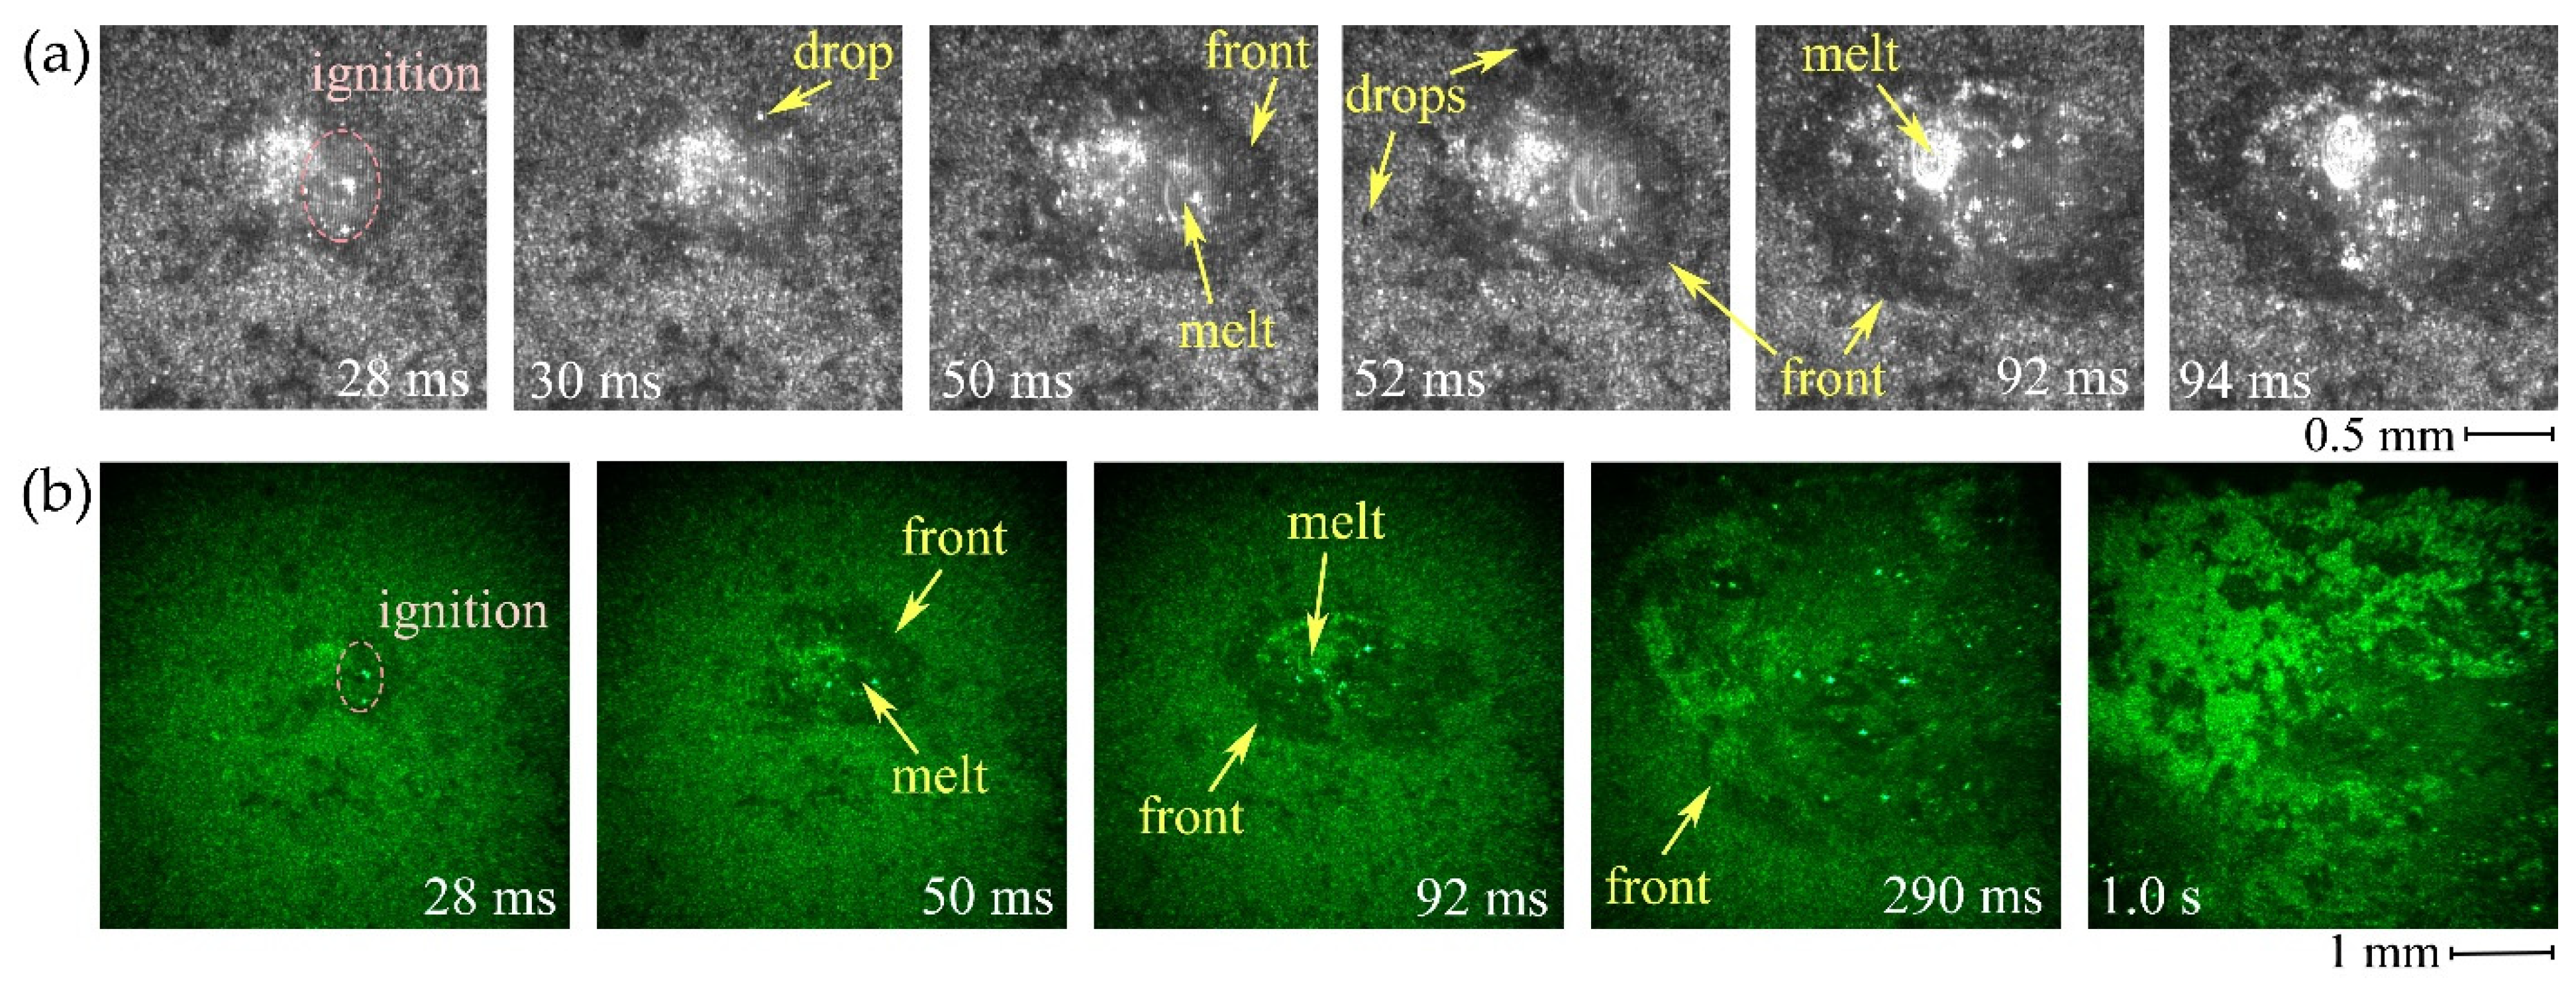
During the energetic material combustion, the speed of the various stages of the process can differ significantly. In particular, this concerns the processes of initiation and stationary combustion. Therefore, the use of two cameras can be useful when it is necessary to visualize the same area with different frame rates. In this case, the frame resolution is determined by the active number of pixels of the high-speed camera corresponding to the recording frame rate, and may be different for different cameras.
Figure 9 presents sequences of frames corresponding to the same time points, recorded at 20,000 fps with a camera resolution of 512 × 512 pixels and at 900 fps with a camera resolution of 1024 × 1024 pixels. Recording at a higher speed gives an advantage in examining the area of laser exposure, while recording at a higher resolution and at a slower speed makes it possible to visualize a larger area for a longer time.
4. Conclusions
The paper presents the results of using a two-channel synchronized imaging system to study laser initiation and combustion of a nano-Al + Fe3O4 homogeneous powder system. The designed laboratory setup based on a laser projection system with brightness amplification and two high-speed cameras makes it possible to simultaneously study the material surface in situ through bright lighting in the ignition area and flame propagation along the sample. Laser monitoring is a beneficial facility in addition to the traditional technique of high-speed imaging using digital high-speed cameras in the study of the combustion of powder energetic systems. It makes it possible to explore the surface “through the flame” in real time, photograph the details of processes that would otherwise be completely hidden by background lighting, and determine the moments of time when processes occur that lead to the formation of combustion products.
Laser monitoring makes it possible to study the processes behind the combustion wave front, providing objective experimental information about the nature of the ignition of nano-energetic materials and the propagation of the combustion wave along the sample. Synchronized high-speed recording of flame glow images and images of the surface of the sample through the flame made it possible to establish a relationship between the propagation of the flame glow and the change in the surface of the nano-Al + Fe3O4 thermite mixture sample during combustion. In particular, changes in the morphology of the powder, changes in the surface in the area of laser exposure, and changes in the heating zone, including visualization of the formation and expansion of the liquid phase, were visualized. It was found that the propagation of the combustion wave and the heating region occurs almost symmetrically away from the point of laser initiation.
In this work, two cameras recorded the same image of a laser monitor simultaneously. Adjusting the optical scheme allows us to project an image of the same area of the object onto the matrices of two high-speed cameras. Simultaneous high-speed recording of a laser monitor image by two cameras at different frame rates makes it possible to study the initial stage of combustion and the entire combustion process with different temporal and spatial resolutions. This technique allows the studying of processes that have different time parameters, for example, processes occurring under the influence of laser radiation and the propagation of a combustion wave along the sample.
The paper presents the results of a study of the relative change in the reflectance of the surface of the nano-Al + Fe3O4 thermite mixture during combustion based on an analysis of the average brightness of the laser monitor images. The change in the average brightness of the surface images obtained by a laser monitor during the combustion of this mixture was 47–52% with respect to the minimum value, allowing for a quantitative analysis of the process. The curves of the average brightness of the images reflect the characteristic changes in the combustion process, observed visually and using a high-speed camera. A significant range of changes in the brightness of laser monitor images can impose restrictions on the dynamic range of the high-speed cameras used. The issue of choosing between monochrome and color cameras when they work as part of a laser monitor is a compromise. On the one hand, a monochrome camera gives greater image sharpness due to its higher sensitivity; on the other hand, it is easily overexposed by the amplified image of a laser monitor. The color camera is less sensitive to glare that occurs during the visualization of the liquid phase and makes it possible to control the absence of the influence of spurious radiation at other wavelengths in the visible region of the spectrum.


