Article

A Novel Model Developed for Frictional Characteristics Analysis of Axial Symmetric Parts

1
Key Laboratory of Advanced Forging & Stamping Technology and Science, Ministry of Education of China, Yanshan University, Qinhuangdao 066004, China
2
Yancheng Institute of Technology, College of Mechanical Engineering, Yancheng 224051, China
*
Authors to whom correspondence should be addressed.
Symmetry 2022, 14(5), 842; https://doi.org/10.3390/sym14050842
Submission received: 16 March 2022 / Revised: 12 April 2022 / Accepted: 15 April 2022 / Published: 19 April 2022
(This article belongs to the Section Engineering and Materials)

Abstract

:
Friction during contact between metals can be very complex under dynamic conditions. In this study, friction between 304 stainless steel and SKD11 steel with boundary lubrication was studied experimentally using a friction testing machine (MPX-2000). The friction coefficients at different sliding speeds and interface loads were determined, and a new friction coefficient model was established based on the experimental data. The sample surfaces were analyzed using a laser-scanning microscope, and it was found that the friction mechanism under boundary lubrication (where 0.1 < μ < 0.3) was mainly abrasive wear accompanied by slight adhesive wear. The new friction coefficient model developed was applied for a simulation of Axial Symmetric U-Bend parts using finite element methods, and the results were compared with stamping experiments. The prediction errors in the results of thickness and the springback angle showed that the new friction model had a good agreement of the thickness distribution to the experiments with less than 10% error, and the springback angles between the new friction model and the measurements with the errors of 6.86% and 5.13%. The experimental results show that the friction coefficient decreases with the rise of speed when the sliding speed is between 30 mm/s–50 mm/s; the friction coefficient decreases with the increase in interface load. A decreasing trend of friction coefficient gradually slows down when the interface load is between 2.0 MPa–4.0 MPa. This also agrees with the simulations using the new model.

1. Introduction

At present, metal stamping products are widely used in automobiles, mechanical equipment, and daily life because of their efficiency and effectiveness in production [1,2,3,4]. However, the tribological behaviors of sheet metal informing are complex. Numerical simulations have been commonly used in the optimal design due to their outstanding performance in shortening the cycle of product design [1]. In the simulations, Coulomb’s law is commonly used to describe friction characteristics [2]. Coulomb’s law treats the friction coefficient constantly over a range of loading stress, where the friction is linearly proportional to the load pressure [3]. Theoretically, it is effective only when the interfacial load is less than the yield limit of the sheet metal deformed elastically. Metal forming is a complex plastic deformation process, so using a constant coefficient is inconsistent. Therefore, a variable friction coefficient based on complex conditions must be further optimized, improving the accuracy of numerical simulations.
Recently, many researchers have studied the friction models of metal forming to improve the accuracy of numerical simulations. Dong et al. [4] analyzed the friction mechanism in metal forming and proposed that speed and interface load were the major factors affecting friction coefficient. Maziar [5] experimentally studied the effects of tool roughness of high-strength steel (DP600) and aluminum alloy (1100). They found the same effects on the sliding speed and interface load. Wang et al. [6] studied the friction characteristics of alloyed steel plates with a sliding friction test. They concluded that the friction coefficient decreased with interfacial load and velocity. Han et al. [7] studied the relationship between the factors and friction coefficient, including normal pressure and sliding speed. Through experiments, they found that the friction coefficient decreased when the increase of normal pressure and sliding speed decreased. Zhou et al. [8] studied the influence of blank holder force and speed to obtain a reasonable range of process parameters. Through experiments, Hashimoto et al. [9] proved that the nonlinear friction model based on pressure and sliding stroke has higher accuracy than the traditional Coulomb’s law. Based on experiments, Dohda et al. [10] analyzed the effects of contact pressure, speed, and sliding length and established a new friction coefficient model. Through the high load experiment, Marzouki et al. [11] concluded that the friction coefficient decreases when the load and surface roughness increase. Through the friction experiment between aluminum disk and die steel, Dou et al. [12] found that within a certain speed and load range, the friction coefficient decreases with the increase of sliding speed and load, and also found adhesion and plowing during the friction process. The research on the sheet-metal-forming friction model mainly focuses on high-strength steel, aluminum alloy, and galvanized sheet materials, and the friction models used are constant models based on a single factor. Because the friction in sheet metal forming can vary with the sliding speed and the load, it is necessary to develop a friction model considering the influences of sliding speed and the load. M.A Hassan et al. [13] developed a new punch friction test to measure and evaluate the friction coefficient online. Seshacharyulu et al. [14] summarized friction laws—different tests to measure the coefficient of friction and different friction models in sheet metal forming. Tomasz Trzepiecinski et al. [15] believed that adhesion and plowing phenomena exist in the metal-forming process.
Previous studies rarely studied the friction characteristics of 304 stainless steel under different working conditions and did not analyze various factors and establish a multi-factor friction model. This study focused on the friction between 304 stainless steel and SKD11 steel. The influences of interface load and sliding speeds on the friction coefficient were studied experimentally using a pin-disk friction tester. A new friction coefficient model was developed based on the experiments. The new model was applied for simulations of axial symmetric U-shaped stamping of 304 stainless steel using ABAQUS software to verify its accuracy. The thickness distribution and springback predictions between the constant friction coefficient and the new friction model were compared to verify the effectiveness.

2. Materials and Methods

2.1. Materials

304 stainless steel is used in the experiment (produced by Taiyuan Iron and steel (Group) Co., Ltd., Taiyuan, China), with a yield strength of 320 MPa, a tensile strength of 630 MPa, an elongation of 30% for a diameter of 5 mm per sample, and the friction pair is SKD11 steel (produced by Taiyuan Iron and Steel Co., Ltd., Taiyuan, China), with chemical composition reference shown in Table 1.
The friction pair samples were polished with 240-, 800-, and 1000-grit sandpapers to obtain the same final surface finish, and the contact surface roughness Ra of the stainless steel and the tool steel were 0.8–1.3 μm and 0.02–0.05 μm, respectively. To prevent the surface of the sample from being polluted, the samples were immersed in acetone solution for storage, then cleaned with an ultrasonic cleaning machine, dry, and sealed [16].

2.2. Friction Equipment

Under boundary lubrication conditions, the pin–disc friction tester MPX-2000 (Xuanhua-Kehua testing machine manufacturing company, Zhangjiakou, China) was used to measure the friction coefficients based on different speeds and loads. Because the hardness of the SKD11 die steel is higher than the 304 stainless steel, to avoid measurement data distortion caused by furrow failure of the disk sample, the pin is 304 stainless steel, and the plate is SKD11 steel. The high-hardness disk was processed by wire cutting from a whole plate. The tester machine is shown in Figure 1a; the working principle is shown in Figure 1b. Before the experiment, the disk sample was quenched with HRC62; the pin working surface was treated to accurately simulate the contact state in actual metal forming.
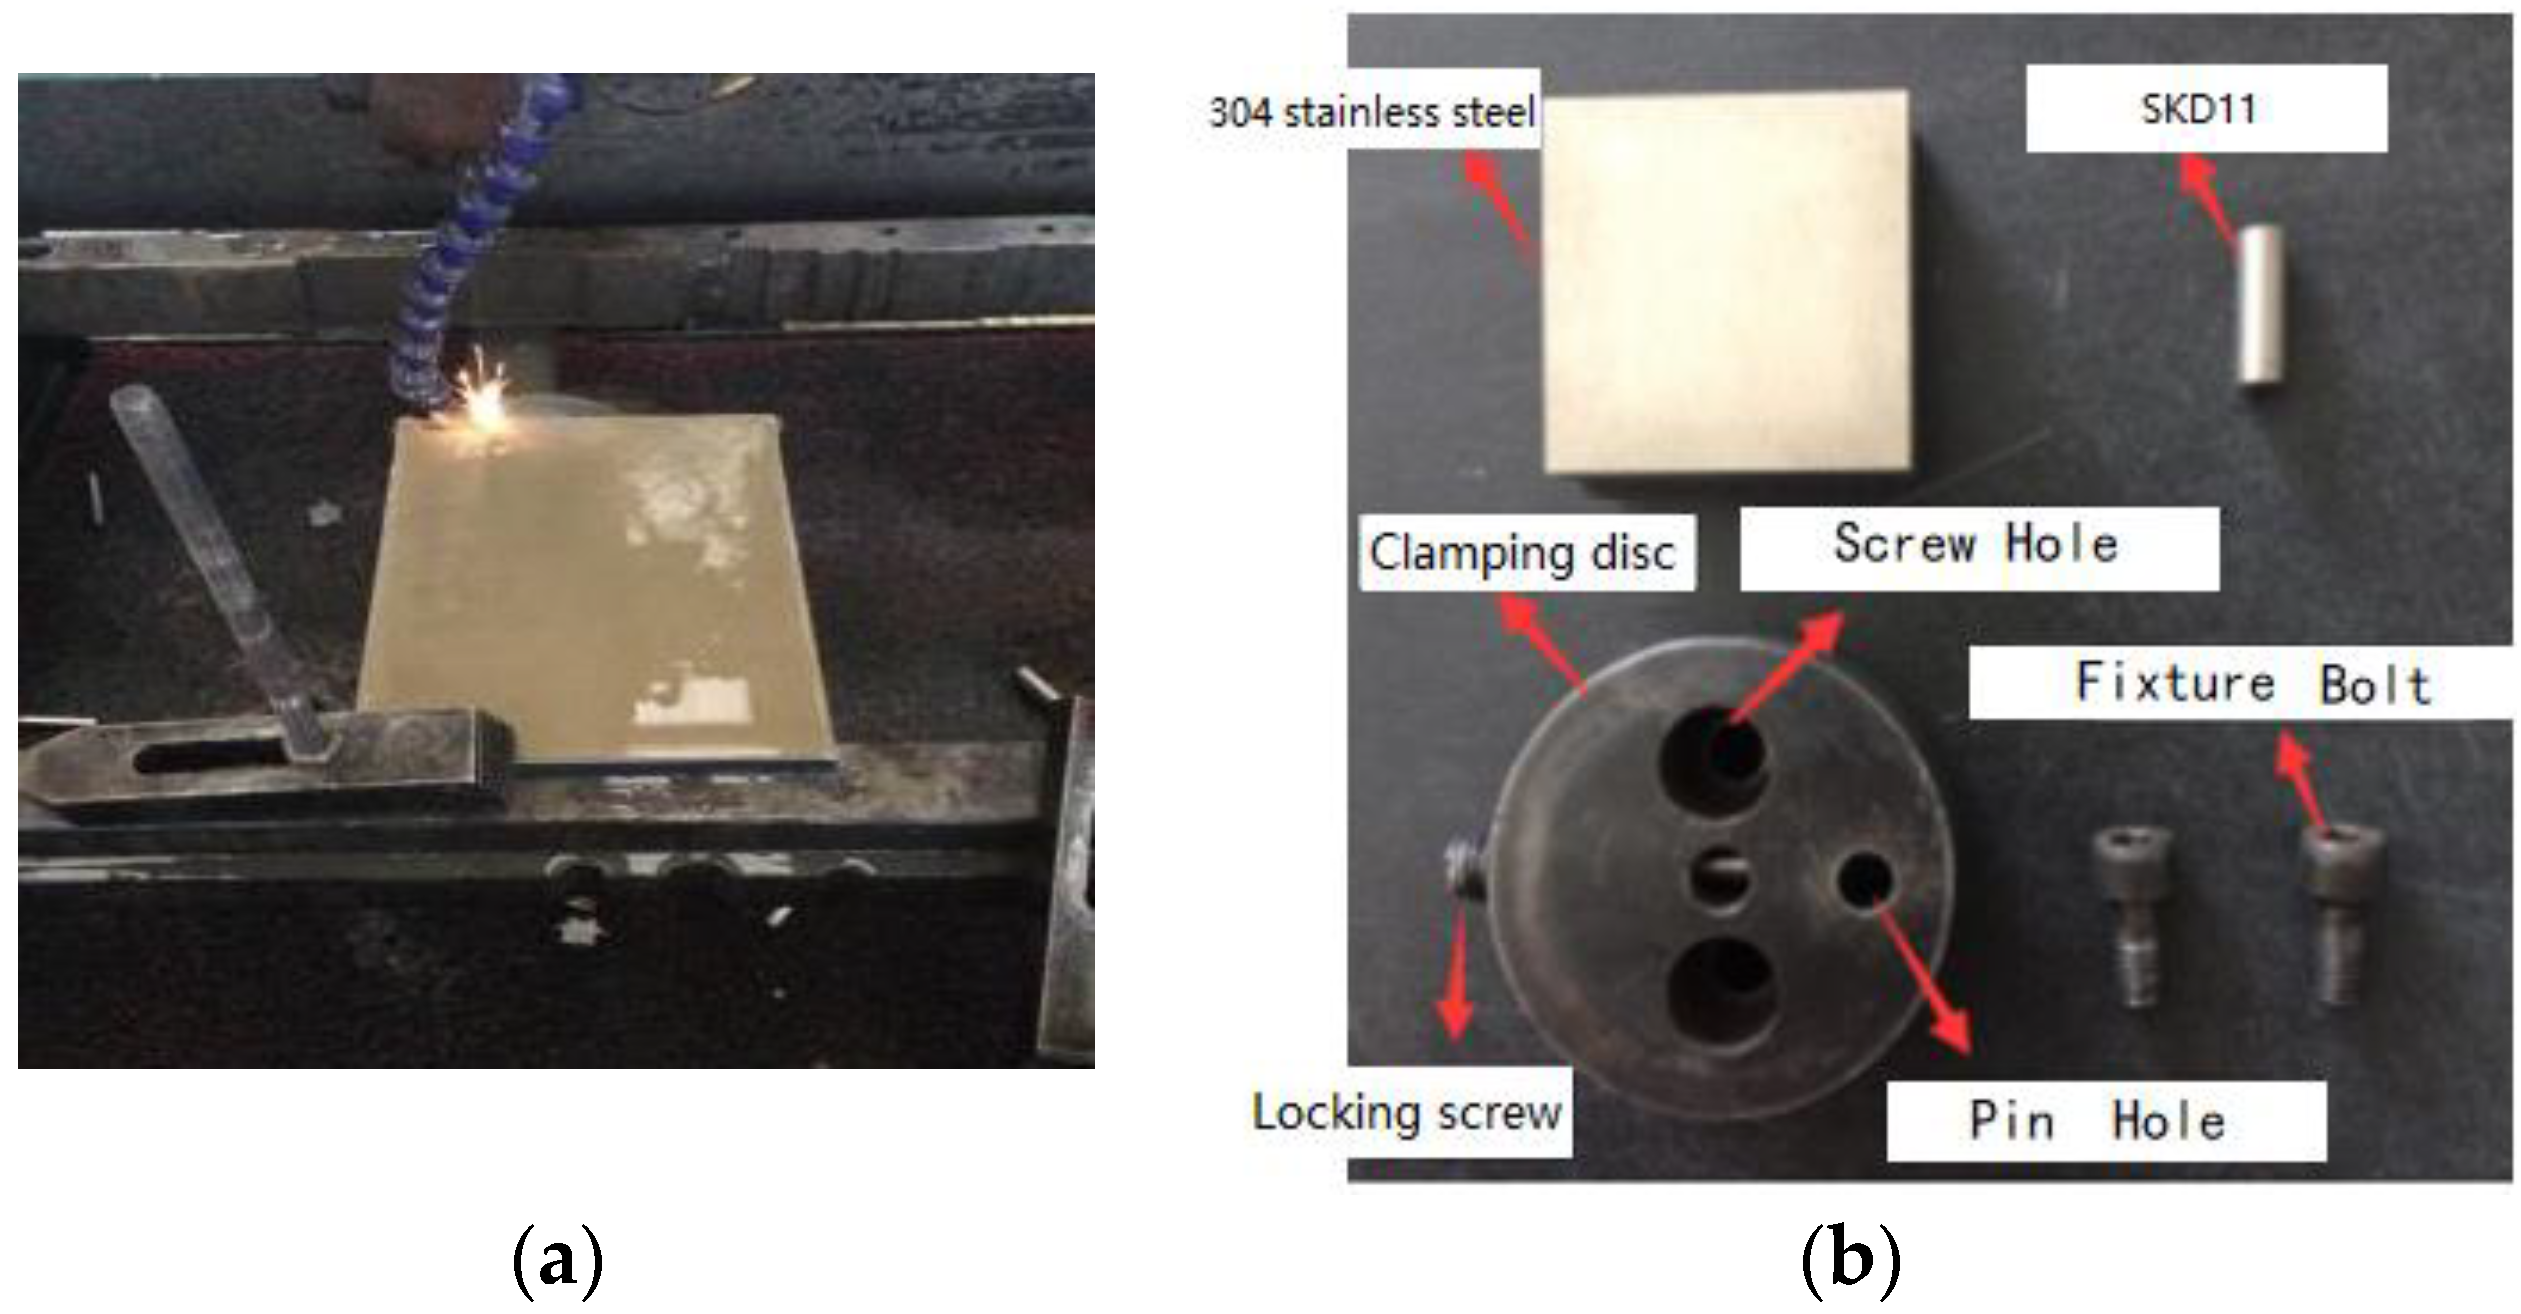
The rotational speed of the spindle is controlled by a variable frequency speed regulating motor, ranging from 0 to 5600 rpm, which can be converted into sliding speed. The experimental parameters were determined by referring to relevant literature [17], which is consistent with the actual stamping condition. Five groups of normal load stresses (2.0 MPa, 2.5 MPa, 3.0 MPa, 3.5 MPa, and 4.0 MPa) and five groups of sliding speeds (30 mm/s, 35 mm/s, 40 mm/s, 45 mm/s, and 50 mm/s) were used in the experiments. The pin radius was 13 mm, and the test duration was 10 s. The lubricant was water-based stamping oil of Total Martol EP 180 (Total Lubricants, Co., Ltd., Tianjin, China). Before the experiment, the sample was cleaned with acetone and dried; then, the lubricant was evenly sprayed on the SKD11 plate sample using a professional nozzle at a cover rate of 60–70 g/m2 to ensure boundary lubrication conditions (0.1 < μ < 0.3) [18]. The disk-cutting is shown in Figure 2a; the friction test parts are shown in Figure 2b.
The friction coefficient μ is given by Coulomb’s equation [19] using the normal load F n and the tangential force f d recorded on the force sensor in real-time using data logging to the computer.
μ = f d F n

2.3. Experimental Arrangement

Because the friction mechanism of 304 stainless in the metal-forming process is complex, there are many influencing factors, including speed and load, etc. The experiment was set up under normal temperature and boundary load conditions to record the friction coefficient under different normal loads and sliding speeds. The boundary lubrication was controlled by spraying the stamping lubricating oil (Total martial EP 180, Total Tianjin industry Co., Ltd., Tianjin city, China) evenly on the workpiece surface to form a thin oil film [20].

3. Results and Discussion

3.1. Friction Coefficients

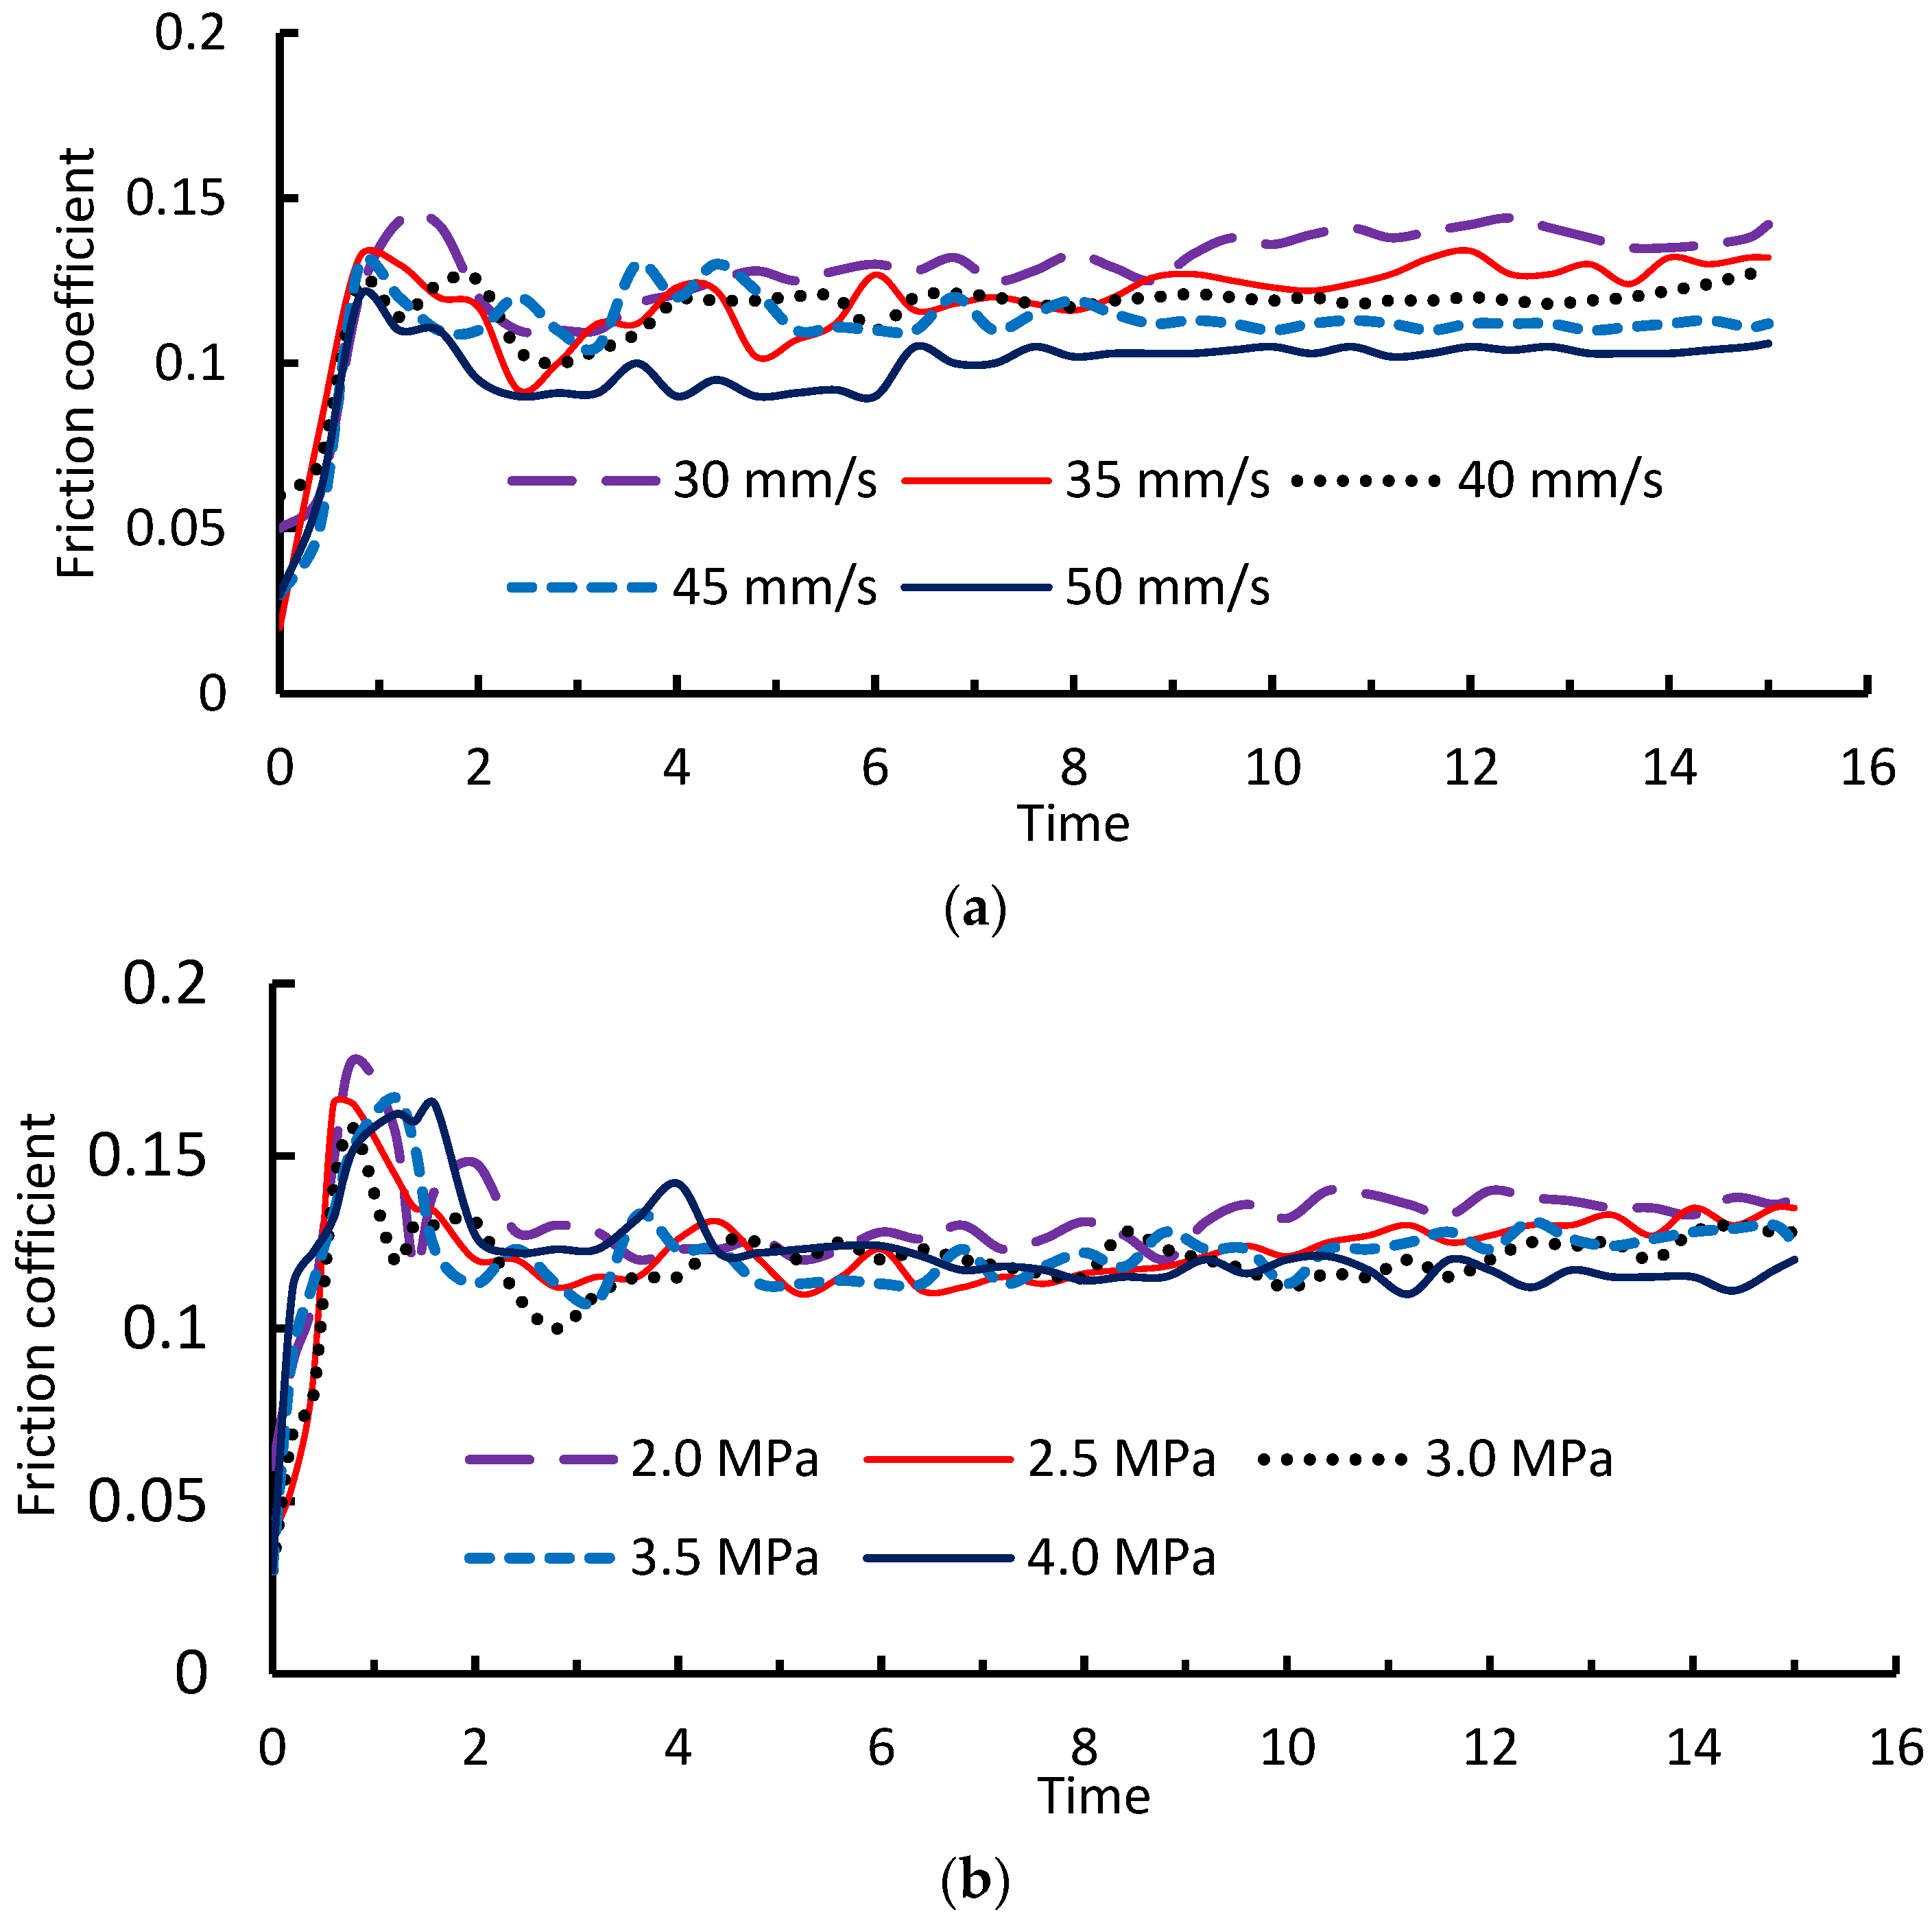
Under the boundary lubrication, the friction coefficients between the 304 stainless steel and the tool were measured. The value of speed and load was determined by the relevant literature [21] and combined with the actual stamping situation. According to the stamping time, the measurement time of the friction coefficient is the first 15 s. The experimental data were repeated five times to take the average value. When the load was 2.0 MPa, the relationship was measured between the load and friction coefficient under the action of five groups of different speeds, as shown in Figure 3a. When the sliding speed was 30 mm/s, the relationship was measured between load and friction coefficient under five groups of different loads, as shown in Figure 3b. As can be seen from the figure, the friction coefficient first rose sharply, then decreased and then rose, and finally fluctuated up and down near an equilibrium value. The friction coefficient decreased with the increase in speed and load.

3.2. Influences of Sliding Speeds

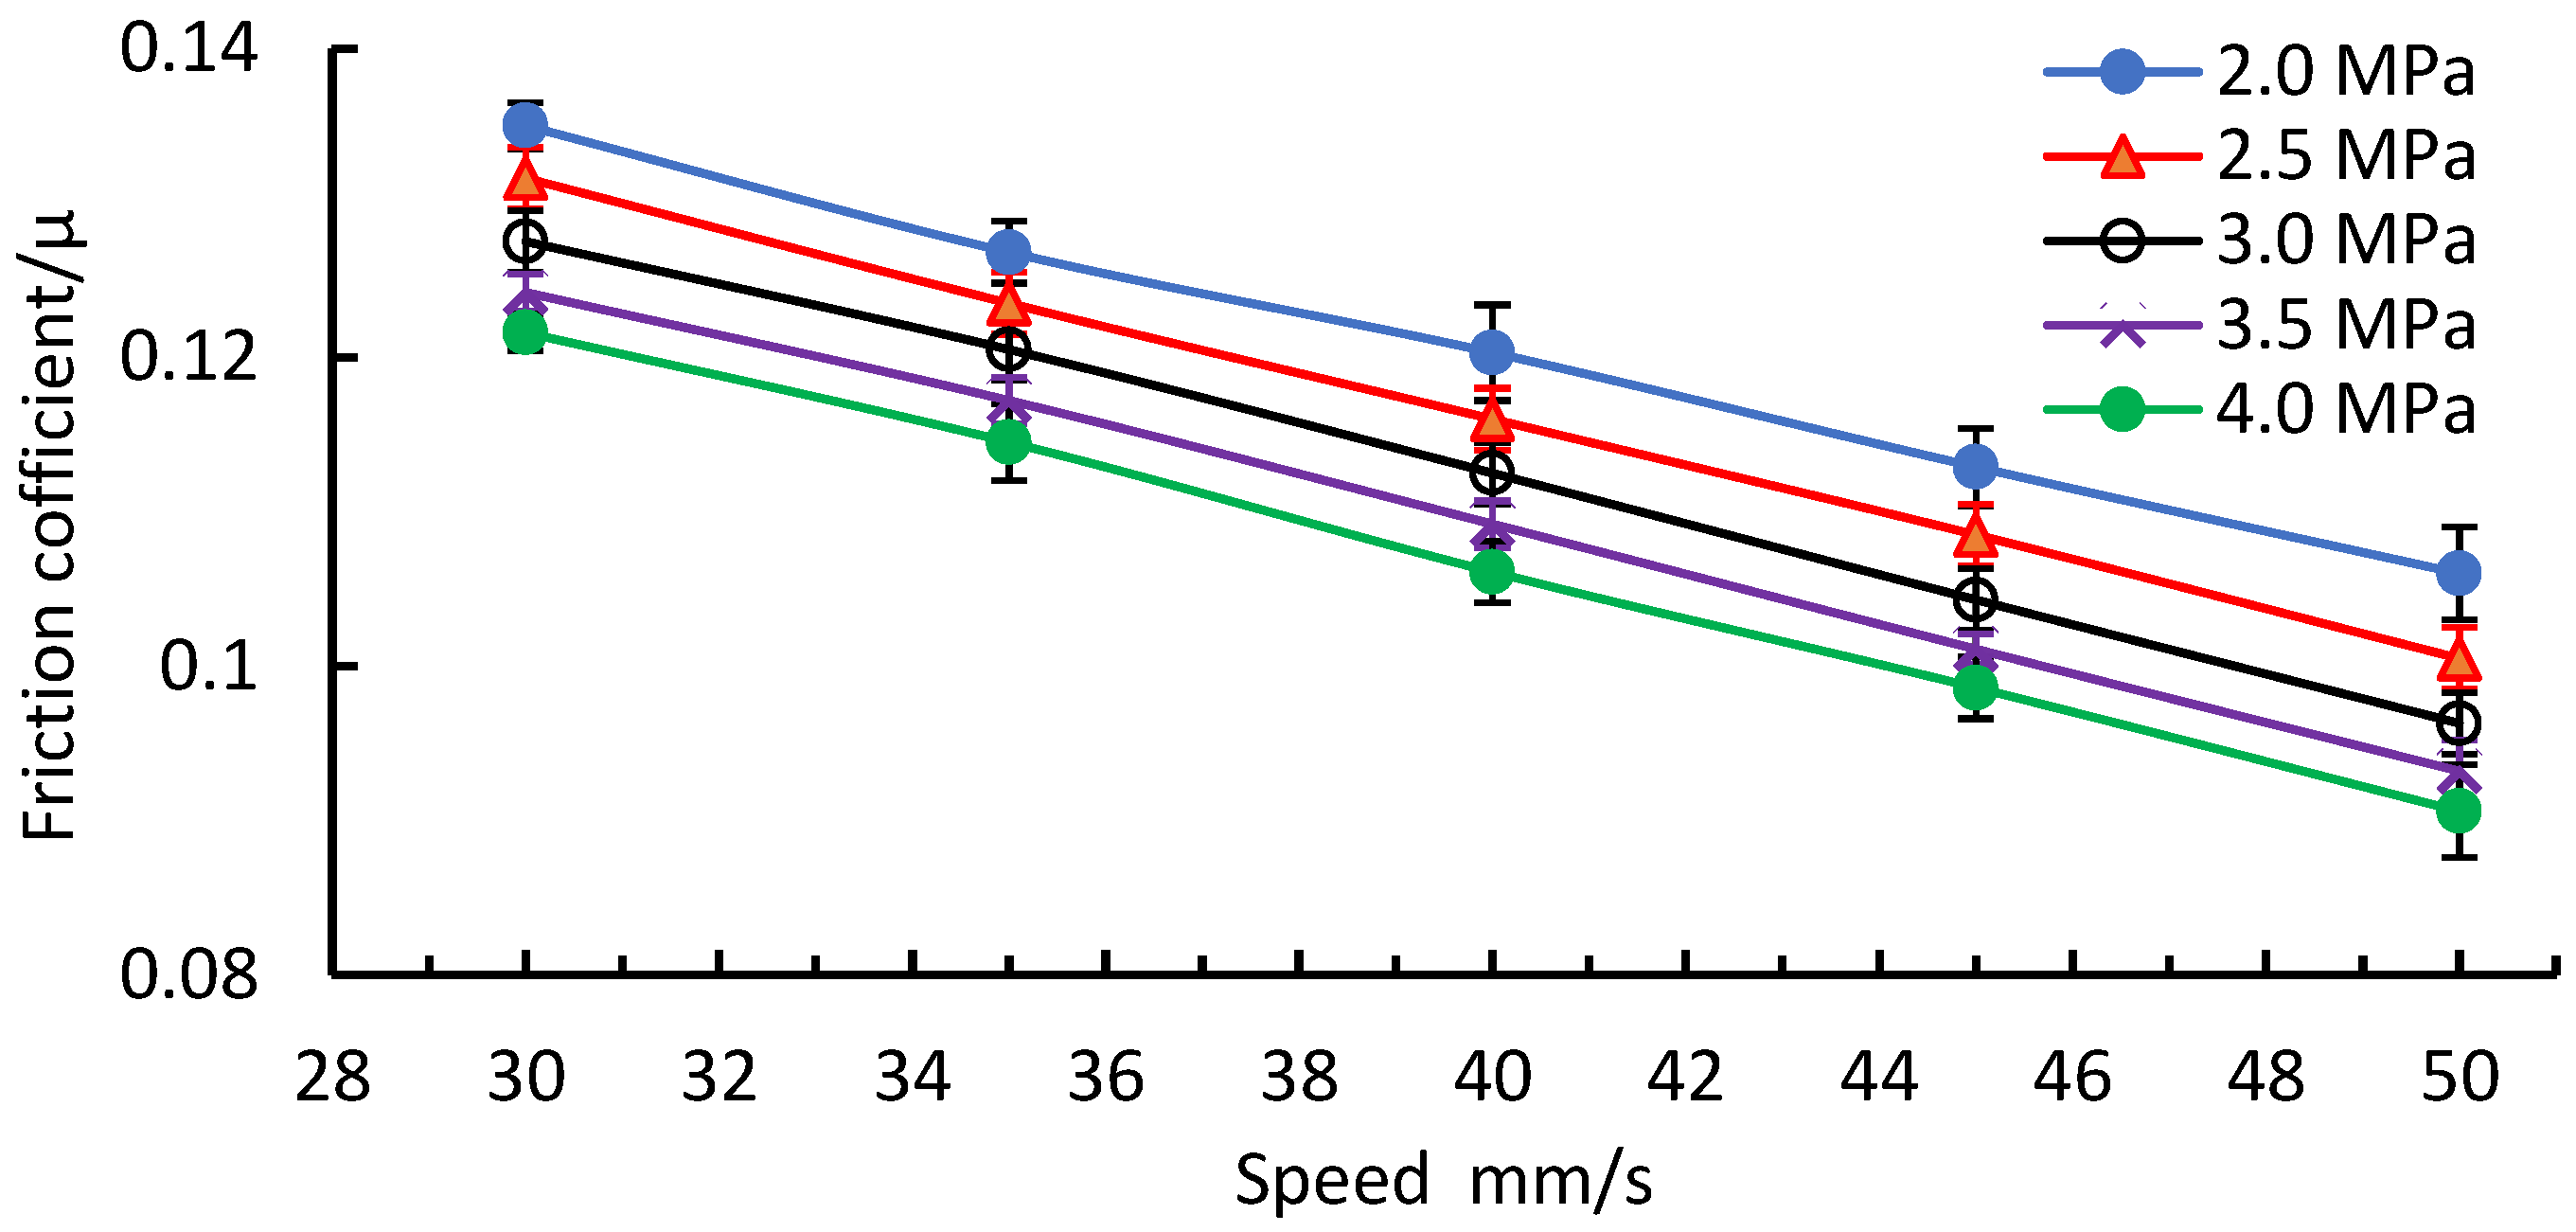
The influence of sliding speeds on the friction coefficient is shown in Figure 4. It shows when the sliding speed went up from 30 mm/s to 50 mm/s; the friction coefficient decreased with increased sliding speed. In tribology, under boundary lubrication, the friction coefficient can be described as two components [22]: a fluid friction coefficient fL and a solid friction coefficient fS. The fluid coefficient fL was caused by the shearing flow of the lubricant and was equal to η(du/dz), where η was the viscosity of the lubricant and du/dz was the velocity gradient across the film. Since the lubricant fluid and the pressure remain constant, the Sommerfeld number was proportional to the sliding speed. Since the lubricant and positive pressure remained unchanged, the Sommerfeld number in the Stribeck function was directly proportional to the sliding speed [22], which means that the frictional area gradually decreased with the increased velocity and resulted in the decrease of the solid friction coefficient fS. The local heating effect generated at the peak reduced the lubricant viscosity and the fluid friction coefficient fL. Thus, the friction coefficient decreased with the sliding speed, which was also shown in Wang et al.’s work [23].
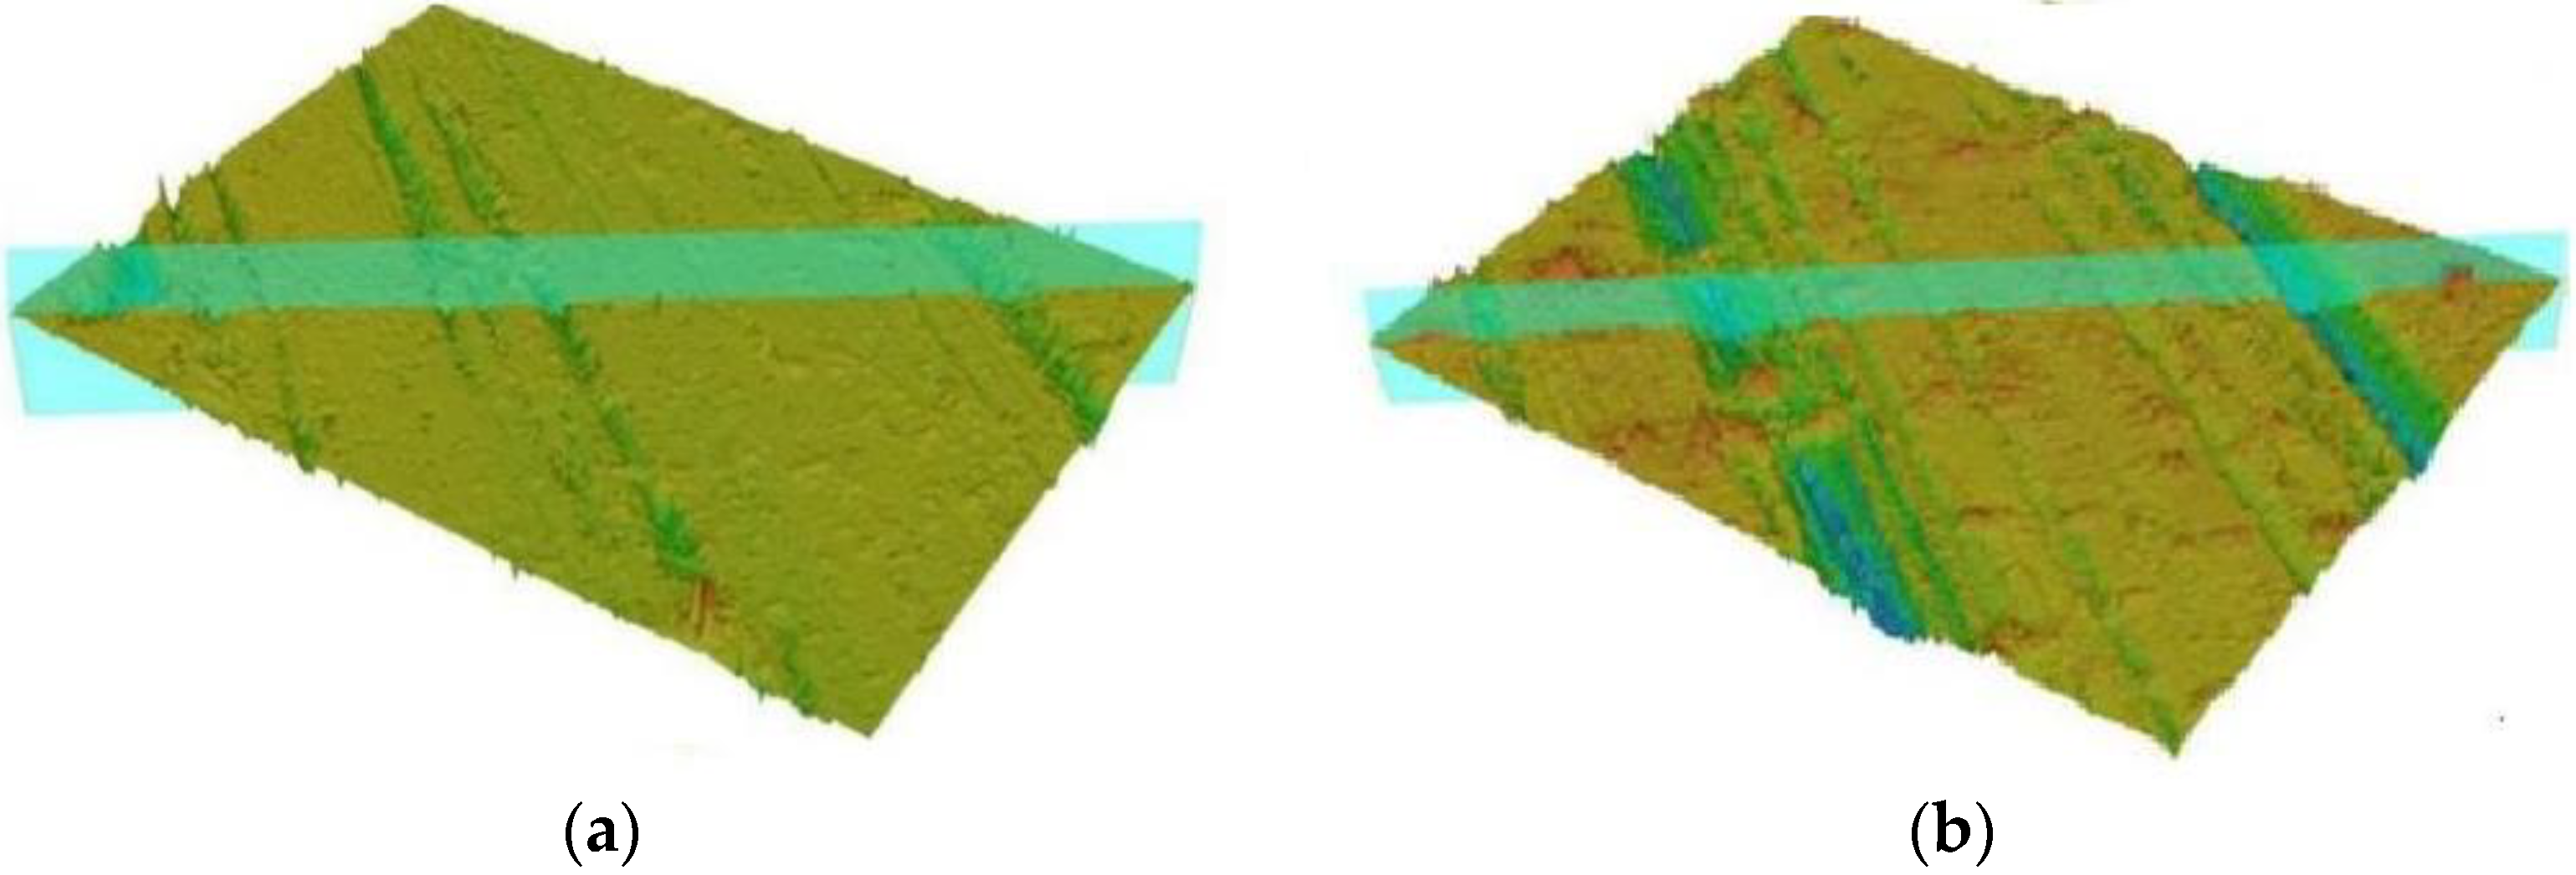
The surface morphologies of the 304 stainless steel after friction under different sliding speeds were analyzed with a laser scanning microscope (KEARNS VK-X100, Kean Corporation, Osaka, Japan). When the load was 2.0 MPa with the sliding speeds of 30 mm/s and 40 mm/s, the surface topographies of stainless are shown in Figure 5. When the speed was 30 mm/s, the maximum height difference was 9.3 µm, and there were many surface scratches. When the speed was 50 m/s, the maximum height difference on the surface was 6.8 µm. A comparison showed that the surface scratches from high speeds were smooth. The reason is the contact area increased and the lubricating oil increased—this may be the reason for the reduction of friction coefficient.

3.3. Influences of Interface Load

With boundary lubrication and constant speed, the influence of interface load on the friction coefficient is shown in Figure 6. When the interface load increased from 2.0 MPa to 4.0 MPa, the friction coefficient slightly dropped, and the trends gradually became constant. According to the adhesion theory, when the load is small, the two dual surfaces are in elastic contact; when the load is large, the contact surface is in an elastic–plastic contact state.
The surfaces of the workpiece after friction under different loads were analyzed. With the sliding speed of 40 mm/s, the surface topographies of 304 stainless steel for interface loads of 2.0 MPa and 4.0 MPa are shown in Figure 7. When the load was 2.0 MPa, the maximum height difference was 7.8 µm, and there were many surface scratches. When the load was 4.0 MPa, the maximum height difference on the surface was 9.8 µm. A comparison showed that when the height difference of the surface morphology from a high load became large, the scratches on the surface increased, and there were minor peeling marks. This is mainly caused by wear. As the lubricating oil flowed into the groove, it may have improved the lubrication effect.

3.4. A Novel Friction Coefficient Model

As shown in Figure 3 and Figure 5, the sliding speed and interfacial load affected the friction behavior of the 304 stainless steel and SKD11. Therefore, the traditional simulation analysis using the constant friction coefficient is inconsistent with the actual working condition and resulted in more errors. A new friction coefficient model was developed by considering sliding speed and interface load effects. According to Filzek’s research [6] on variations of friction coefficient with pressure, a friction model with varied interfacial load can be expressed as follows:
μ p = μ 0 ( P P 0 ) i
where P 0 is the reference load, usually selected at the minimum value; μ 0 is corresponding friction coefficient of P 0 ; i is a constant between 0 and 1; μ p is the friction coefficient corresponding to the current interface load P; μ 0 , P 0 and i are constants.
According to the research results of Keum et al. [24], the friction coefficient model regarding sliding speed can be deduced from the following equation:
μ v = d 0 + d 1 v
where d 0 and d 1 are constants; μ v is the friction coefficient corresponding to the sliding speed v . Combining Equations (2) and (3), the friction model related to sliding speed and interface load can be obtained as:
μ = i P j ( 1 + k v )
where i , j , and k are constants and determined experimentally; μ is the corresponding friction coefficient under the conditions of load P and sliding speed v .
With the experimental data, the values of i , j , and k are determined as 0.235668, −0.162, and −0.0114, respectively, using the least square method. Thus, Equation (4) can be expressed as:
μ = 0.235668 P 0.162 ( 1 0.0114 v )

3.5. Model Validation in Simulations

(1)
A U-shaped bending
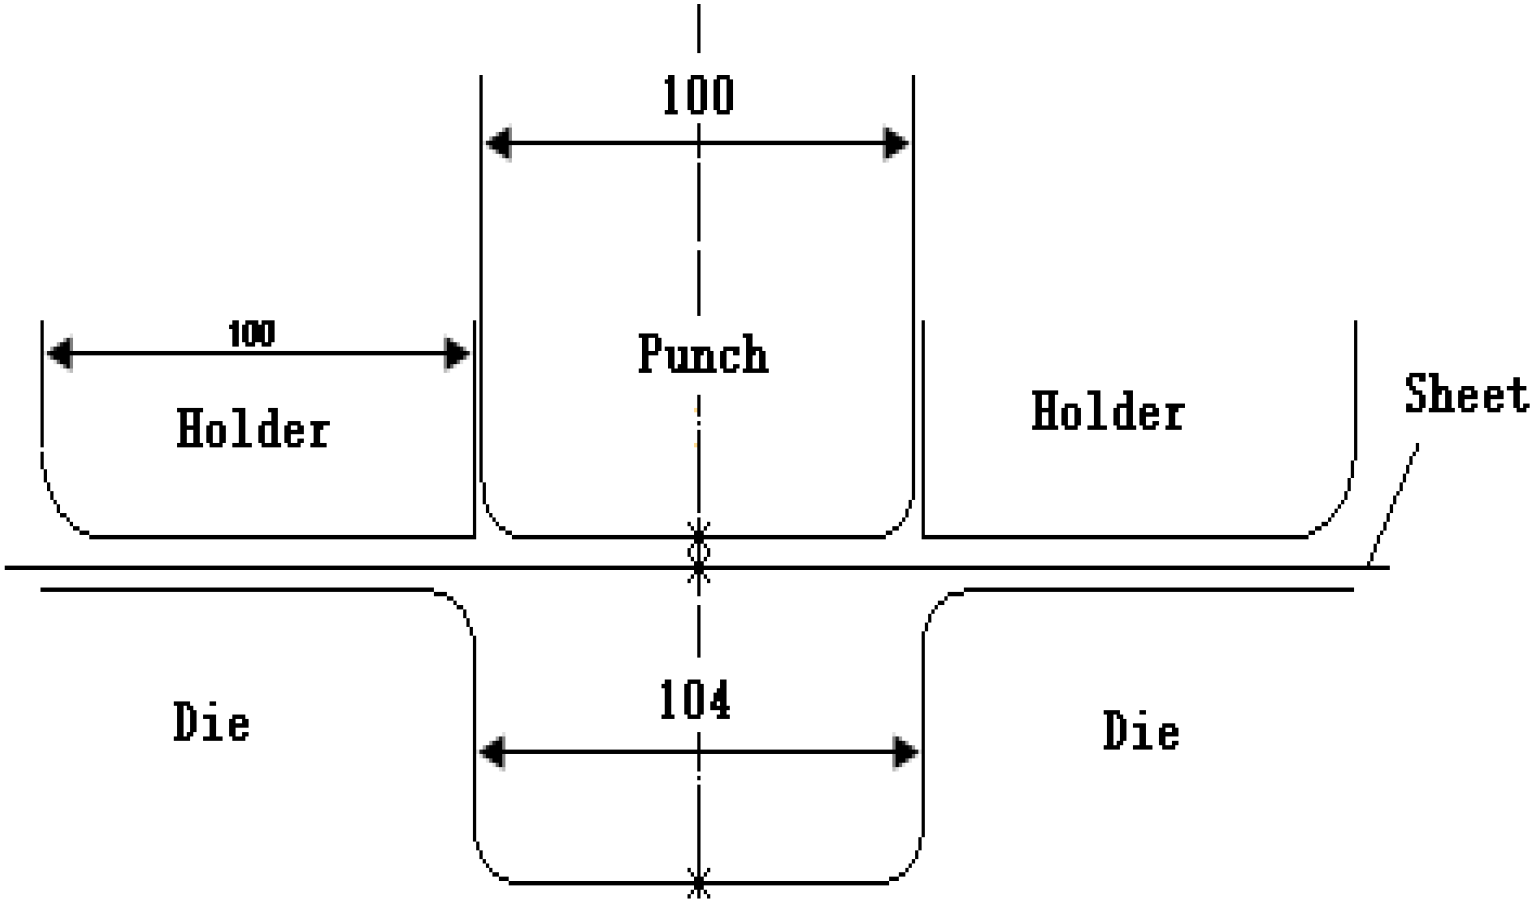
An axial symmetric U-shaped bending was carried out on a stamping machine to verify the new friction model: the thickness distribution and springback of the actual stamping parts. The stamping structural diagram is shown in Figure 8. The sheet thickness was 2 mm. A sample was cut by wire cutting with a length of 300 mm and a width of 30 mm. The stamping speed was 30 mm/s, the blank holder force was 12 kN, the punch and die fillet radius was rp = rd = 10 mm, and the die clearance was c = 2 mm. Before the test, the sheet was cleaned with propanone, dried, and quantitatively sprayed with lubricant, and the punching depth was 50 mm with a bottom width of 100 mm.
(2)
Simulation of thickness distribution
The numerical simulation analysis with ABAQUS software mainly includes the following steps:
(a)
Modeling
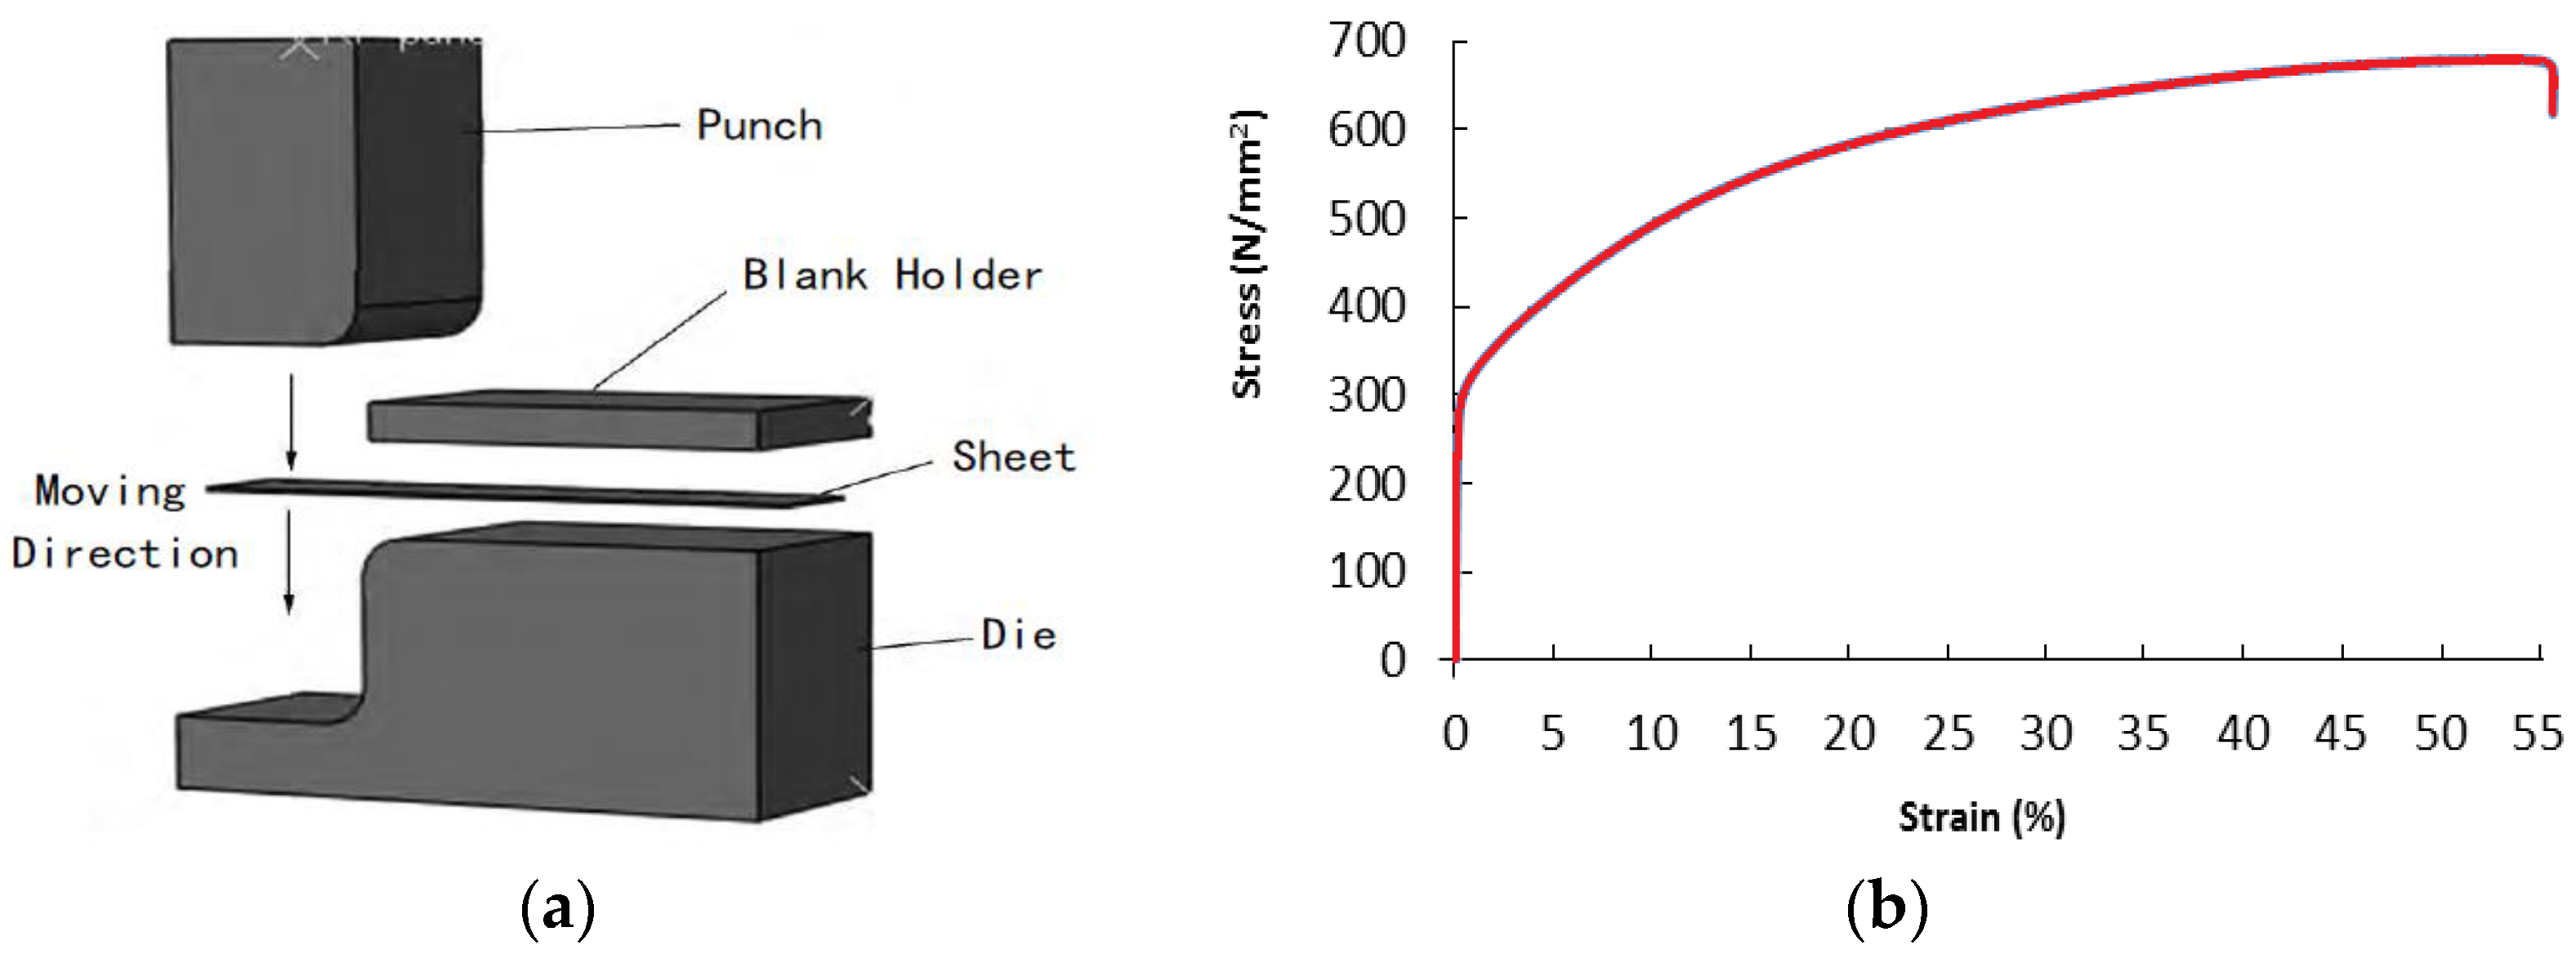
To verify the effectiveness of the friction model, use a 3D modeling software (NX 12.0, Siemens Industrial Software, Plano, TX, USA) to create a U-bend model (Figure 9a) and then import it into the incremental finite element simulation software (ABAQUS 6.14, Dassault SIMULIA, Paris, France). Then, set the punch, die and blank holder as discrete rigid bodies and stainless steel as a deformable body.
Then, set the properties of the material with the 304 stainless steel; the density is 7.93 g/cm3; the Young’s Modulus is 207 GPa; Poisson’s ratio is 0.28; the stress–strain data refers to Figure 9b.
(b)
Define analysis steps
There are two steps in the analysis. In the first step (forming analysis step), select the dynamic display algorithm, define the analysis step time t1 = 1.5 s, and accept the default settings to create an analysis step. Next, the second analysis step (die opening analysis step), defines the analysis step time t2 = 0.001 s.
(c)
Defining surfaces and interactions
The contact setting between the contact parts of the model needs to be set as a friction coefficient model with load and sliding speed, and the friction coefficient varying with sliding speed and normal load are brought into the setting of the contact model. Through the friction subroutine of “VFRIC”, the new friction coefficient model with pressure and sliding speed is defined and input into ABAQUS 6.14 software (Dassault SIMULIA, Paris, France) [25].
(d)
Define boundary conditions
The die and blank holder remain stationary, and the punch drives the sheet to move downward. All degrees of freedom of the die and blank holder are constrained. The sheet metal shall avoid sliding under the condition of blank holder force and punch tension. The punch keeps constant speed, enter the stroke value “−40”, and enter the blank holder force “−10,000”.
(e)
Meshing
The punch, die, and blank holders are treated as rigid body structures of R3D4, and the sheet metal is a deformable shell element of S4R during the simulation. The mesh shape is quadrilateral with structured mesh generation technology. The mold mesh grid size is 4 and the sheet metal mesh size is 2. The meshing results are shown in Figure 10.
Four experiments are designed and compared, including constant friction coefficients (0.05, 0.1, 0.15) and the new friction model.
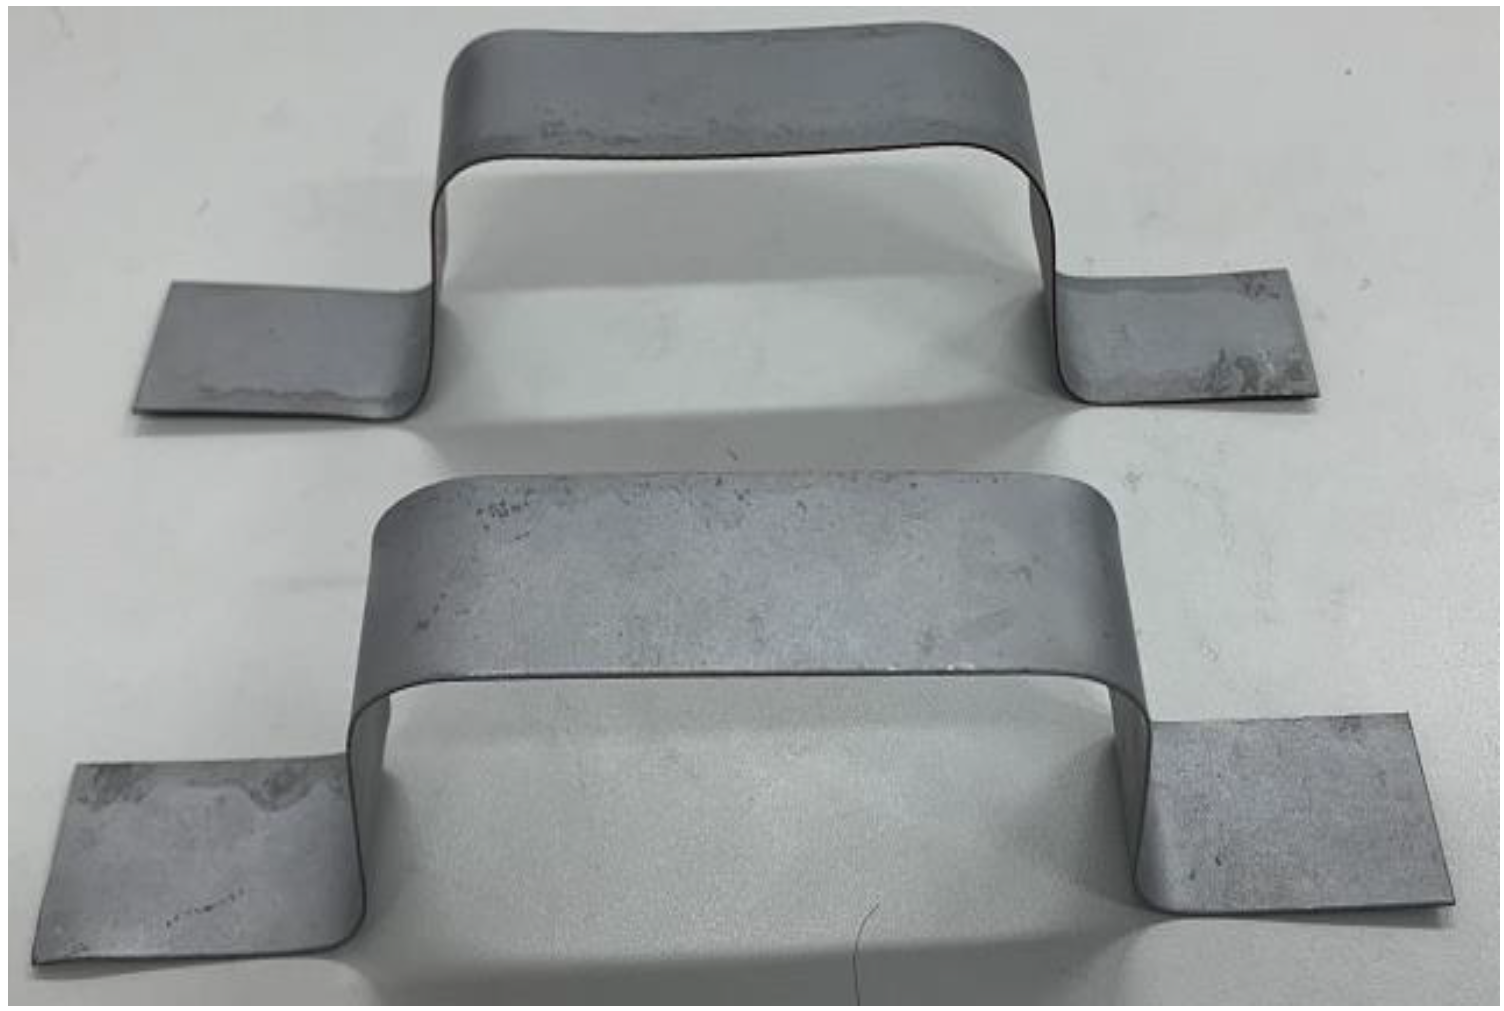
Firstly, the U-shaped part was formed using a stamping forming machine, and the metal parts after forming are shown in Figure 11. The lubrication conditions were the same as the friction test. The stamping speed was 40 mm/s, and the punch pressure was 2.0 MPa. The thickness was measured with an ultrasonic thickness gauge three times to give an average value.
The thickness distributions with different friction coefficients can be different [26], as shown in Figure 12. The results showed that the thinning mainly occurred in the die straight wall area, consistent with the actual measurement results. To determine the thickness distribution, the 12 representative positions were measured (shown in Figure 13a). The calculated thickness using constant friction coefficients and the new friction model at the 12 nodes are compared to the actual values in Figure 13b. It was found that the thickness of point 7 is the minimum value, where is the risk of fracture failure during the forming process, and the new friction model thickness was the closest to the actual value, with less than 10% error.
(3)
Springback analysis of U-Bend
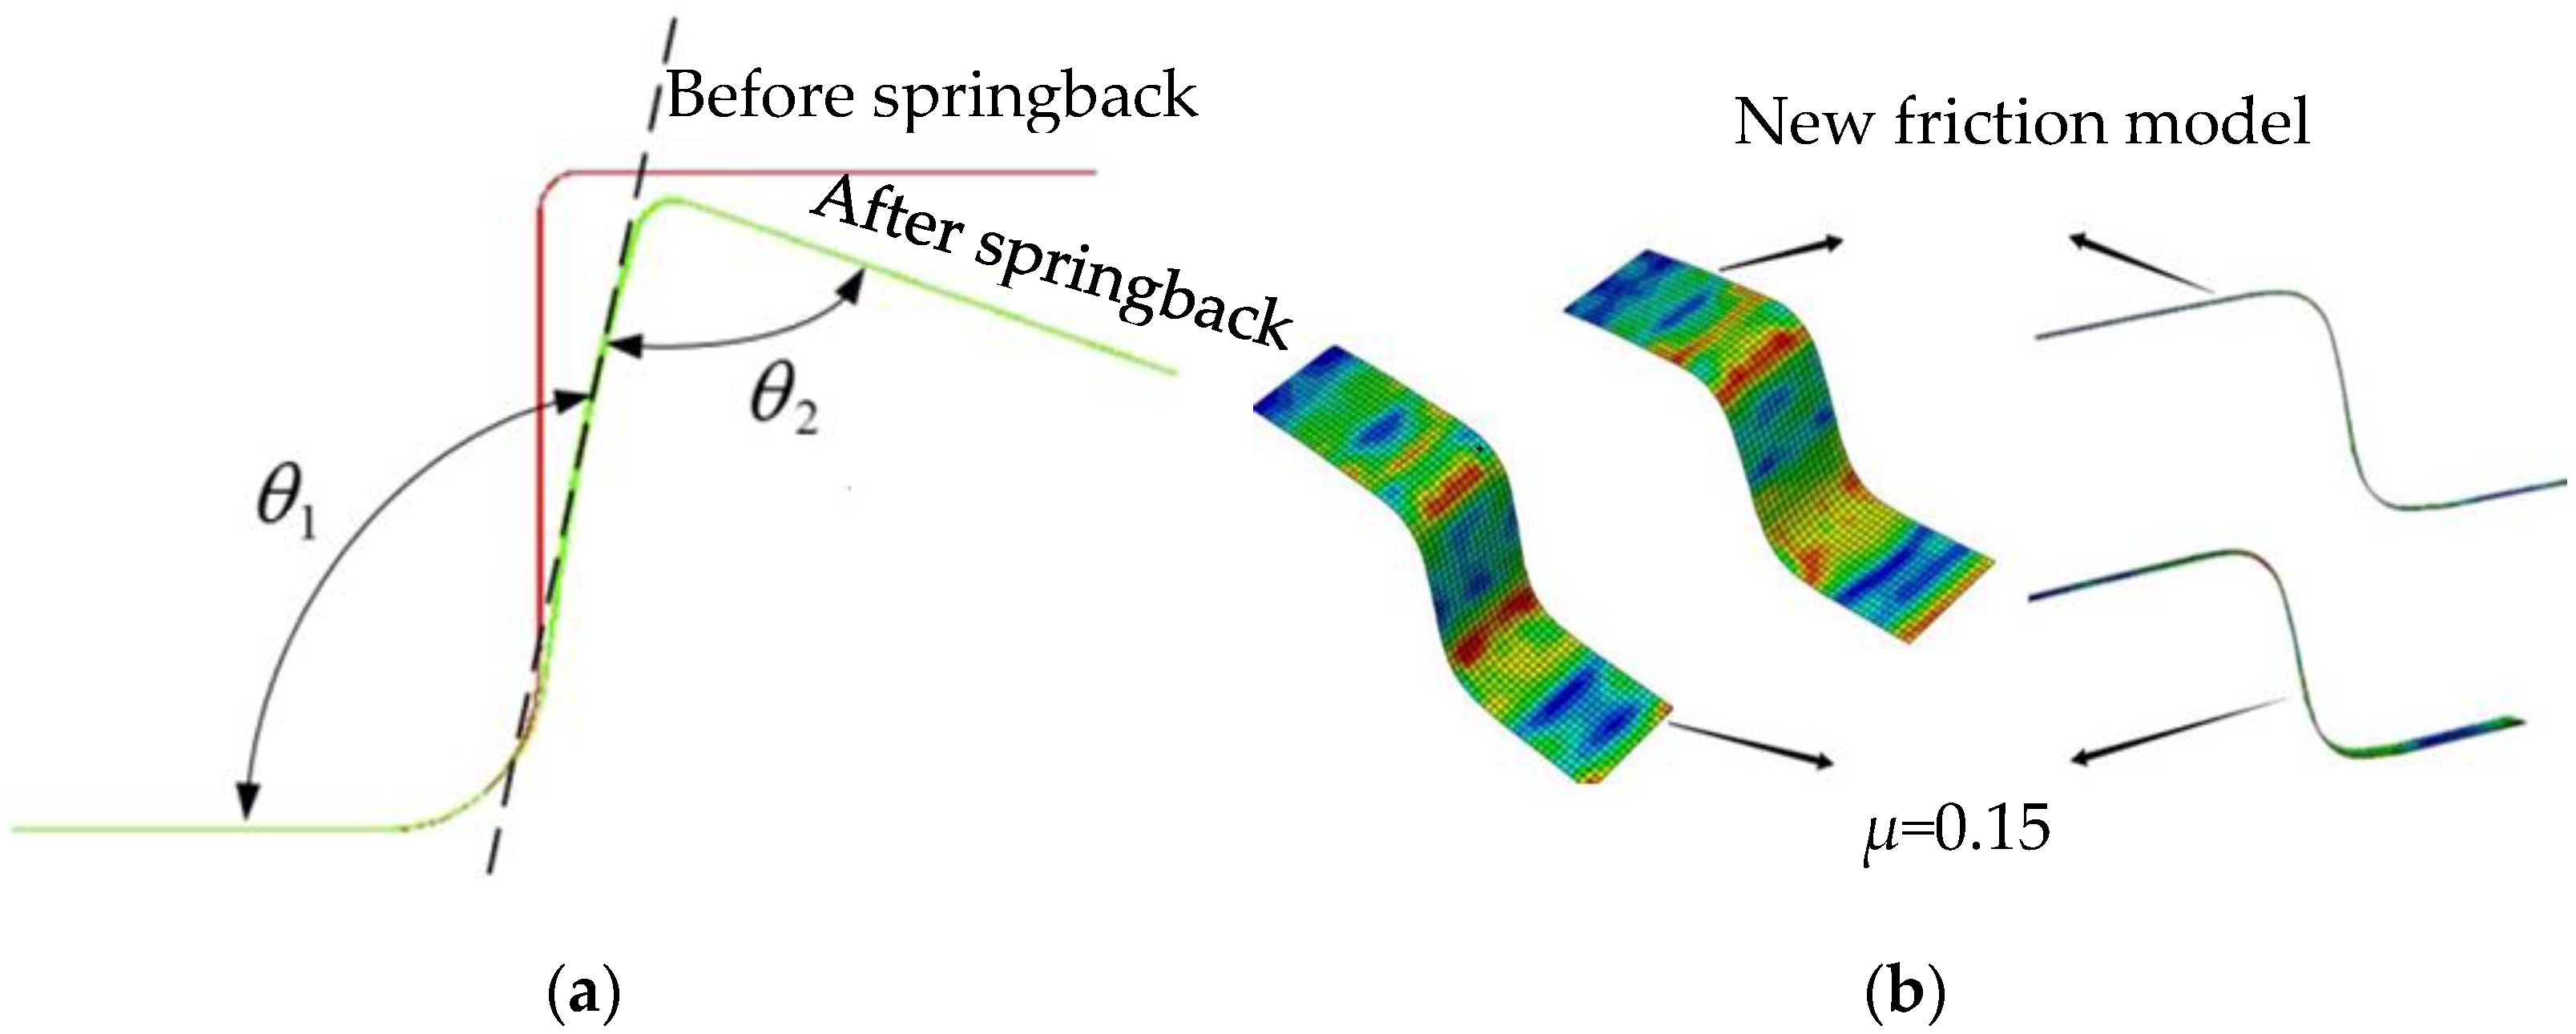
The springback simulation with the constant friction coefficient and the new friction model were carried out using the thickness distributions. Figure 14 shows the springback angle definition ( a = θ 1 90 and   b = 90 θ 2 ), representing the error between the theoretical and actual values. The larger the angle, the greater the accuracy error. In the stamping test, the springback angles were a = 10.2° and b = 7.8° measured. When μ1 = 0.05, the springback angles were a1 = 13.2° and b1 = 9.8° calculated; and the errors are 29.41% and 25.64%, respectively. When μ2 = 0.1, the springback angles were a1 = 12.5° and b1 = 9.3° calculated; and the errors are −23.53% and −21.37%, respectively. When μ3 = 0.15, the springback angles were a1 = 7.8° and b1 = 6.5° calculated; the errors are −23.53% and −21.37%, respectively. With the new friction model, the springback angles were a2 = 10.9° and b2 = 8.2° calculated; the errors were 6.86% and 5.13%, respectively. Figure 14 shows the prediction comparison of springback angles with different friction coefficient models. Table 2 shows the prediction results and the actual measured values. The error of the new friction model and the actual value was the smallest.
As shown in Table 2, the new friction model gives a higher prediction accuracy in sheet metal stamping compared to the constant friction coefficients. Figure 15 shows the stress distribution cloud diagram. At the die fillet, the inner surfaces (contact surface between sheet metal and punch and die fillet) are always in the compression state, while the outer surfaces (the other surface) are always in the tensile state. The compressive stress and tensile stress of the inner and outer surfaces in the stamping process are the fundamental reasons for the springback. Friction can effectively change the stress distribution and reduce the springback phenomenon [27]. The stress analyzed by the simulation with the constant friction coefficients was lower, the springback angle was small, and the prediction error was high. The output friction of the friction model was slight, so the stress distribution was concentrated; when the stress of simulation analysis was high, the springback angle was larger, and the prediction error was small.

4. Conclusions

In this paper, a new friction coefficient model based on different speeds and loads was established, analyzed, compared, and validated by finite element analysis software (ABAQUS) and real stamping of axial symmetric operation. The micromorphology of the samples after the friction test was analyzed. The results are concluded as follows:
(1)
Under the boundary lubrication condition, the friction coefficient between the 304 stainless steel and SKD11 steel gradually decreases with the increase of sliding speed from 30 mm/s to 50 mm/s and falls with the rise of interface load from 2.0 MPa to 4.0 MPa.
(2)
The surface scratches from high speed are smooth, the contact area increases, and the lubricating oil increases, reducing the friction coefficient. Under a low load, a small number of scratches appeared on the surface. With a high load, the scratches on the surface increased, the depth increased, and there were minor peeling marks.
(3)
From the thickness distribution curve of the U-bend part, the error between the prediction results of the variable friction coefficient model was less than 10%. This shows that the new friction coefficient model can accurately describe the friction behavior between 304 stainless steel and SKD11 die steel.
(4)
Through the actual springback analysis and thickness analysis, it is concluded that the errors of the new friction model are 6.86% and 5.13%, which is higher than that of the constant friction coefficient.
These results show that the new friction coefficient model based on friction experiments can effectively improve the accuracy of prediction and simulation of 304 stainless steel and SKD11 steel. At the same time, this method can also be extended to establish friction models of other materials.

Author Contributions

Conceptualization, J.X. and S.D.; methodology, J.X.; software, S.D.; validation, J.X.; formal analysis, J.X.; investigation, J.X.; resources, J.X.; data curation, S.D.; writing—original draft preparation, J.X.; writing—review and editing, J.X.; visualization, J.X.; supervision, J.Z. project administration, J.Z.; funding acquisition, J.Z. All authors have read and agreed to the published version of the manuscript.

Funding

China’s National Natural Science Foundation [51505408 and 51975509].

Institutional Review Board Statement

Not applicable.

Informed Consent Statement

Not applicable.

Data Availability Statement

Not applicable.

Conflicts of Interest

The authors declare no conflict of interest.

References

  1. Klocke, F.; Trauth, D.; Shirobokov, A.; Mattfeld, P. FE-analysis and in situ visualization of pressure, slip-rate, and temperature-dependent coefficient of friction for advanced sheet metal forming: Development of a novel coupled user subroutine for shell and continuum discretization. Int. J. Adv. Manuf. Technol. 2015, 49, 1446–1451. [Google Scholar] [CrossRef]
  2. Hol, J.; Alfaro, M.C.; de Rooij, M.B.; Meinders, T. Advanced friction modeling for sheet metal forming. Wear 2011, 286, 66–78. [Google Scholar]
  3. Mendiguren, J.; de Argandona, E.S.; Galdos, L. Hot stamping of AA7075 aluminum sheets. In IOP Conference Series: Materials Science and Engineering; IOP Publishing: Bristol, UK, 2016; Volume 159, p. 012026. [Google Scholar]
  4. Dong, Y.C.; Zheng, K.L.; Fernandez, J.; Li, X.Y.; Dong, H.S.; Lin, J.G. Experimental investigations on hot forming of AA6082 using advanced plasma nitrocarburized and CAPVD WC: C coated tools. J. Mater. Process. Technol. 2017, 240, 190–199. [Google Scholar] [CrossRef]
  5. Marziar, R.; Thomas, N.; Timotius, P. Characterization of friction behavior of AZ80 and ZE10 magnesium alloys under lubricated contact condition by strip draw and bend test. Int. J. Mach. Tools Manuf. 2014, 85, 70–78. [Google Scholar]
  6. Wang, W.R.; Zhao, Y.Z.; Wang, Z.M.; Hua, M.; Wei, X.C. A study on variable friction model in sheet metal forming with advanced high strength steels. Tribol. Int. 2016, 93, 17–28. [Google Scholar] [CrossRef]
  7. Han, S. The influence of tool geometry on friction behavior in sheet metal forming. J. Mater. Process. Technol. 1997, 63, 129–133. [Google Scholar] [CrossRef]
  8. Zhou, G.Z.; Lou, R.P.; Dong, X.P. A friction model considering lubrication thickness and sliding speed for sheet metal forming. Forg. Stamp. Technol. 2016, 41, 98–102. [Google Scholar]
  9. Hashimoto, K.; Isogai, E.; Yoshida, T.; Kuriyama, Y.; Ito, K. Finite element analysis of sheet metal forming taking account of nonlinear friction model-assessment of sheet formability by nonlinear friction model III. J. Jpn. Soc. Technol. Plast. 2008, 49, 995–999. [Google Scholar] [CrossRef] [Green Version]
  10. Dohda, K.; Boher, C.; Rezai-Aria, F.; Mahayotsanun, N. Tribology in metal forming at elevated temperatures. Friction 2015, 3, 1–27. [Google Scholar] [CrossRef] [Green Version]
  11. Marzouki, M.; Kowandy, C.; Richard, C. Experimental simulation of tool/product interface during hot drawing. Wear 2007, 262, 235–241. [Google Scholar] [CrossRef]
  12. Dou, S.S.; Xia, J.S. Analysis of Sheet Metal Forming (Stamping Process): A Study of the Variable Friction Coefficient on 5052 Aluminum Alloy. Metals 2019, 9, 853. [Google Scholar] [CrossRef] [Green Version]
  13. Hassan, M.; Tan, C.J.; Yamaguchi, K. A developed friction test for sheet metal stretch forming processes. Int. J. Surf. Sci. Eng. 2013, 7, 152–170. [Google Scholar] [CrossRef]
  14. Seshacharyulu, K.; Bandhavi, C.; Naik, B.B.; Rao, S.S.; Singh, S. Understanding Friction in sheet metal forming-A review. Mater. Today Proc. 2018, 5, 18238–18244. [Google Scholar] [CrossRef]
  15. Trzepiecinski, T.; Lemu, H.G. Recent developments and trends in the friction testing for conventional sheet metal forming and incremental sheet forming. Metals 2019, 10, 47. [Google Scholar] [CrossRef] [Green Version]
  16. Dou, S.S.; Wang, X.P. Analysis of Sheet Metal Forming (Warm Stamping Process): A Study of the Variable Friction Coefficient on 6111 Aluminum Alloy. Metals 2020, 10, 1189. [Google Scholar] [CrossRef]
  17. Gil, I.; Mendiguren, J.; Galdos, L.; Mugarra, E.; de Argandoña, E.S. Influence of the pressure-dependent coefficient of friction on deep drawing springback predictions. Tribol. Int. 2016, 103, 266–273. [Google Scholar] [CrossRef]
  18. Figueiredo, L.; Ramalho, A.; Oliveira, M.C.; Menezes, L.F. Experimental study of friction in sheet metal forming. Wear 2011, 271, 1651–1657. [Google Scholar] [CrossRef]
  19. Hildenbrand, A.; Bretault, N.; Hashimoto, K. Non-linear friction laws friction coefficient as a function of contact parameters. In Proceedings of the SAE 2006 World Congress & Exhibition, Detroit, MI, USA, 3–6 April 2006. [Google Scholar]
  20. Hsu, S.; Gates, R. Boundary lubricating films: Formation and lubrication mechanism. Tribol. Int. 2005, 38, 305–312. [Google Scholar] [CrossRef]
  21. Xia, J.S.; Zhao, J.; Dou, S.S. Friction Characteristics Analysis of Symmetric Aluminum Alloy Parts in Warm Forming Process. Symmetry 2022, 14, 166. [Google Scholar] [CrossRef]
  22. Wen, S.; Huang, P. Principles of Tribology; John Wiley & Sons: Hoboken, NJ, USA, 2012; p. 536. [Google Scholar]
  23. Wang, L.G.; Zhou, J.F.; Xu, Y.T. Study on friction characteristics of galvanized sheet by strip drawing test. J. Plast. Eng. 2016, 23, 87–91. [Google Scholar]
  24. Keum, Y.T.; Wagoner, R.H.; Lee, J.K. Friction model for FEM simulation of sheet metal forming operations. In AIP Conference Proceedings; American Institute of Physics: College Park, MD, USA, 2004; Volume 712, pp. 989–994. [Google Scholar]
  25. Tamai, Y.; Inazumi, T.; Manabe, K.I. FE forming analysis with nonlinear friction coefficient model considering contact pressure, sliding velocity and sliding length. J. Mater. Process. Technol. 2016, 227, 161–168. [Google Scholar] [CrossRef]
  26. Silvestre, E.; Mendiguren, J.; Galdos, L.; de Argandoña, E.S. Comparison of the hardening behaviour of different steel families: From mild and stainless steel to advanced high strength steels. Tribol. Int. 2016, 103, 266–273. [Google Scholar] [CrossRef]
  27. Trzepieciński, T.; Bazan, A.; Lemu, H.G. Frictional characteristics of steel sheets used in automotive industry. Int. J. Autom. Technol. 2015, 16, 849–863. [Google Scholar] [CrossRef]
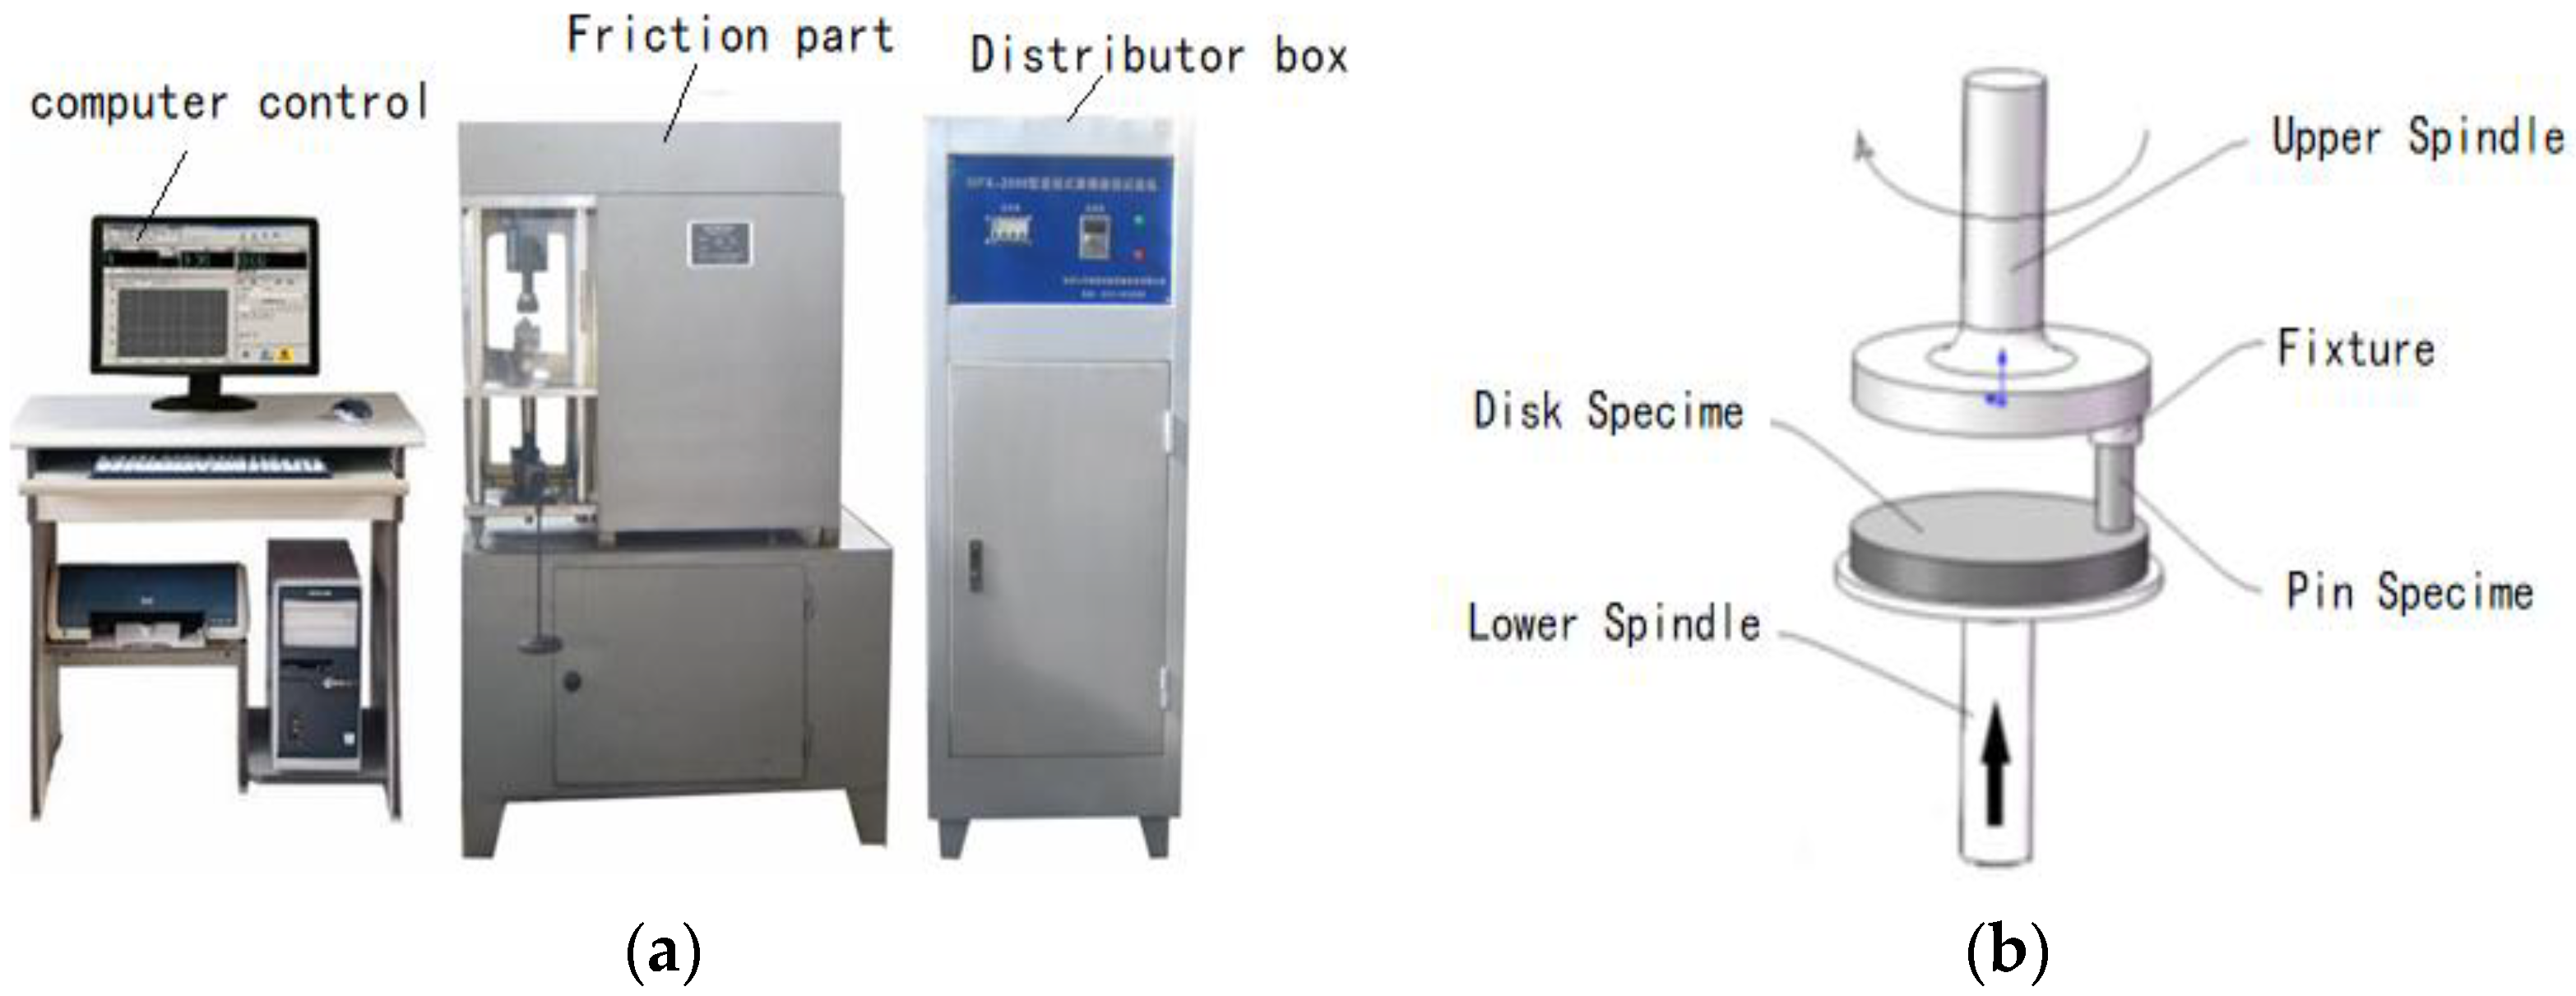
Figure 1. MPX-2000 friction tester. (a) Friction test picture; (b) friction test principle.
Symmetry 14 00842 g001
Figure 2. Sheet metal cutting and friction test parts. (a) Cutting sheet metal; (b) friction parts.
Symmetry 14 00842 g002
Figure 3. Friction coefficient curves with time. (a) With different speeds, (b) with different loads.
Symmetry 14 00842 g003
Figure 4. Friction coefficient curves with sliding speed.
Symmetry 14 00842 g004
Figure 5. Surface profiles at: (a) 2.0 MPa and 30 mm/s, (b) 2.0 MPa and 50 mm/s.
Symmetry 14 00842 g005
Figure 6. Friction coefficient curves with load.
Symmetry 14 00842 g006
Figure 7. Surface morphology with different loading conditions: (a) 40 mm/s and 2.0 MPa, (b) 40 mm/s and 4.0 MPa.
Symmetry 14 00842 g007
Figure 8. Two-dimensional drawing of U-shaped stamping.
Symmetry 14 00842 g008
Figure 9. Model and material properties. (a) Three-dimensional model; (b) stress–strain curve.
Symmetry 14 00842 g009
Figure 10. Meshing result.
Symmetry 14 00842 g010
Figure 11. Actual U-bend part.
Symmetry 14 00842 g011
Figure 12. Diagram of thickness distribution. (a) μ = 0.05; (b) μ = 0.1; (c) μ = 0.15; (d) New friction model.
Symmetry 14 00842 g012aSymmetry 14 00842 g012b
Figure 13. Thickness measurement. (a) Measurement points; (b) thickness distribution curves with different friction coefficients.
Symmetry 14 00842 g013
Figure 14. Springback analysis; (a) springback angle definition; (b) springback results of finite element analysis.
Symmetry 14 00842 g014
Figure 15. Stress distribution (a) Constant friction coefficient (μ = 0.15); (b) new friction model.
Symmetry 14 00842 g015
Table 1. Chemical composition of 304 stainless steel and SKD11 steel (%, mass fraction).
NameMnCCrSiNiPSCrMoVFe
304 stainless0.790.5017.920.568.770. 290.009---Bal.
SKD110.500. 4012.00. 40---12.01. 00. 30Bal.
Table 2. Springback angle comparison.
Springback Angle (°)a (°)b (°)
Actual value10.27.8
μ = 0.0513.2 (Error: 29.41%)9.8 (Error: 25.64%)
μ = 0.157.8 (Error: −23.53%)6.5 (Error: −21.37%)
μ = 0.112.5 (Error: 22.55%)9.3 (Error: 19.23%)
New friction model10.9 (Error: 6.86%)8.2 (Error: 5.13%)
Publisher’s Note: MDPI stays neutral with regard to jurisdictional claims in published maps and institutional affiliations.