1. Introduction
Chirality determination in science and technology is one of the largest fundamental molecular challenges in existence today [
1]. This is because the enantiomers that arise from chiral centers have almost identical physical and chemical properties, but biological processes often produce, need, or use one enantiomer in large preference to another. Synthetic processes, though, often end in a mixture of enantiomeric products, even when the chemistry utilized is selectively targeted to result in specific stereochemistry. Therefore, it is of large importance to be able to detect and quantify these mixtures quickly and accurately, especially when trying to produce these chemicals on a large scale, as is often the case in the pharmaceuticals industry.
In 2013, it was demonstrated that chiral gas molecules could be distinguished via a microwave three-wave mixing (M3WM) experiment [
2]. Later, this experiment was extended to a modified CP-FTMW-type experiment [
3]. No matter the setup, M3WM involves exciting, in succession, a pair of linked rotational transitions of different types (
a-,
b-, or
c-type) and then listening to/collecting the free induction decay (FID) from a third type of transition, completing a transition loop [
4]. Transitions in microwave rotational spectroscopy occur through a coupling of a molecule’s electric dipole moment to an imposed electric field. Transition types arise from a specific component of that electric dipole moment with a nonzero magnitude. M3WM loops are allowed, then, because chiral species, by definition, possess electric dipole moments where all three components are nonzero in magnitude. Moreover, by definition, each enantiomer possesses one dipole moment component that is the same in magnitude but completely opposite in sign. It is this difference that is leveraged in the M3WM experiment and results in FIDs of each enantiomer being exactly 180° out-of-phase with one another, allowing absolute geometry determination and providing a pathway for the quantitative analysis of mixtures.
For this to be achieved, the experimental setup must contain two crucial components. The first is that the experimental setup consists of antennae optimally oriented to propagate/detect electric fields in each of the three dimensions. The second is that two of those antennae deliver a specialized pulsing scheme consisting of a π/2 pulse followed by a π pulse, where π/2 and π are the Rabi flip angles. However, in practice, not all rotational transitions can achieve the full π/2 condition because the transition moments for the various angular momentum projections on a space-fixed axis are dependent on the projection quantum number,
MJ [
3,
5]. Therefore, π/2 and π have become terminology for the microwave pulse duration needed for maximum coherence and double maximum coherence (resulting in no traditional rotational signal), respectively. In previous works, it was also shown that in order to maximize the probability of enantiomeric separation signal with M3WM and minimize spatial degeneracy influences, it is best to follow an
RQP-branch (i.e., Δ
J = 1, 0, −1) loop rather than
QQQ or
PQR cycle and to minimize loop
J-states [
6,
7]. Lastly, because the chiral signal is proportional to the population difference and the transition dipole moment, but there is generally sufficient microwave power available, it is best to follow a scheme that starts with the largest frequency difference on the weakest dipole moment component and ends with monitoring a transition corresponding to the strongest dipole moment component also at a high-frequency difference [
3].
Since the discovery of M3WM, there have been many subsequent experimental and theoretical works showing how such approaches can be utilized to distinguish between enantiomers [
8,
9,
10,
11,
12,
13,
14], provide enantiomeric excess (
ee) information inclusive of mixtures [
15], and demonstrate or suggest methodologies which may be carried out in order to selectively choose or build up the population in one chiral species over another (chiral quantum coherent control) [
16,
17,
18,
19,
20]. In all known M3WM experimental setups using arbitrary waveform generators (AWGs), however, no setup has utilized multiple AWG sources. Multiple AWGs or very fast digital-to-analog converted channels on a single AWG will most likely be needed to pursue chiral quantum coherent control techniques as the microwave pulse schemes are generally complex or involve synchronous pulses. Furthermore, due to the spatial degeneracy influences, microwave powering costs, and required pulse schemes mentioned above, M3WM experiments typically consist of at least one excitation/listening component in the radiofrequency region (i.e., <~3 GHz). In this work, therefore, we present the construction and demonstration of the first known M3WM experiment utilizing multiple, synchronized AWG sources entirely operable in the 6–18 GHz region of the electromagnetic spectrum.
2. Materials and Methods
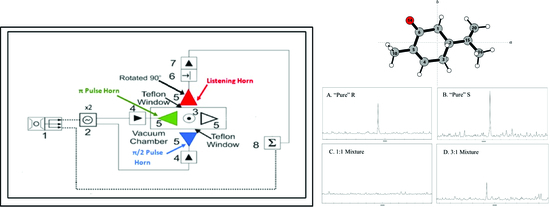
M3WM experiments were carried out using a modified chirped pulse, Fourier transform microwave (CP-FTMW) spectrometer with multi-antenna detection, which was described elsewhere [
21]. A diagram of the instrument setup is presented in
Figure 1, with pertinent differences between that and the MAD-CP-FTMW experiment being described here. As described in reference [
21], the MAD-CP-FTMW instrument consists of four antennae arranged in a cross pattern exactly facing each other with the supersonic expansion source centered above, pointing at the throat of a diffusion pump. Two of these antennae are located inside the vacuum chamber, and two are located outside. The two external antennae have Teflon windows allowing the microwaves to pass into the chamber where they are broadcast onto the molecular sample. Using the inside or the outside antennae in traditional CP-FTMW experiments showed no observable difference in line centers. For M3WM instruments, three orthogonal microwave fields are required to maximize enantioseparation efficiency. With our single polarized antennae (Steatite
® QWH-SL-2-18-S-HG-R), this can be achieved by rotating one of the exterior antennae by 90°. The exterior antennae are mounted in such a fashion that they may be rotated up to 270°. The resulting arrangement is similar to that of Lobsinger et al. [
3], where three antennae (colored blue, green, and red in
Figure 1) are used for the M3WM experiments, and the fourth antennae may be accessed to quickly shift back to traditional CP-FTMW spectroscopy if desired.
As shown in
Figure 1, two antennae (blue and green) are used for excitation, and one antenna (red) is used for detecting the resultant free induction decay (FID) of the molecular response to the excitation. This is different from traditional CP-FTMW spectroscopy, where only one excitation source is generally utilized. In order to provide the experiment with adequate microwave power, a 1 W microwave power amplifier (Avantek
® APT-18649) and a 40 W microwave power amplifier (Microsemi
® model L0618-46-T680) were employed for excitation. On the detection antenna, an SPST switch (ATM
® PNR S1517D) and a low noise amplifier (RF-Lambda
® RLNA06G18G45) are used to block out all signals except for those resulting from the FID, which requires amplification in order to be interpreted by the oscilloscope (Tekronix
® DPO 72304DX Digital Phosphor Oscilloscope).
As mentioned previously, M3WM experiments require microwave pulses occurring in a π/2-π coherence scheme. In previous M3WM designs, this was achieved multiple ways, from using a switch on a singular AWG [
3], using multi-channel AWGs [
14,
22], invoking a dual-polarized antenna [
19], and switching electric fields [
2,
11,
13,
15]. The difference between these designs to the design presented in this work is the implementation of two synchronized AWGs to generate the microwave coherence pulses needed for the experiment simultaneously. This provides a specific advantage not possessed by the other approaches in that now the user may have control over the type of pulse (or pulse profile) while also not being limited to one pulse having to finish before another pulse begins. This arrangement allows for future experiments involving the excitation pulse schemes with greater flexibility as the waveforms are written with code instead of manipulated via hardware. The AWGs are synchronized using a synchronization hub (AWGSYNC01) with one AWG acting as the primary unit and the others acting as secondary units. Up to four units may be controlled by the synchronization hub at any given time (see
Figure 2 for a picture of the setup), but the M3WM experiments performed here only consist of two synchronized AWGs.
Another unique aspect of the experimental setup is that the entire instrument operates in the 6–18 GHz region of the electromagnetic spectrum. This is not because of the AWGs, but because this is the optimal region for the antennae and power amplifiers.
In total, four M3WM experiments on enantiomeric mixtures of carvone were carried out. These included (A) 5 mL of pure R-carvone, (B) 5 mL of pure S-carvone, (C) 1:1 mixture of R-Carvone (2.5 mL) and S-carvone (2.5 mL), and finally (D) 3:1 mixture of R-carvone (3 mL) and S-carvone (1 mL). The enantiomers of carvone are presented in
Figure 3. The R-carvone (Product No.: A13900, Purity: 98%) and S-carvone (Product No.: L07130, Purity 96%) samples were manufactured by Alfa Aesar
® and obtained through Thermo Fisher Scientific
® (Alpha Aesar, Tewksbury, MA, USA 01876). No further purification was performed on the samples after purchase. Quality documentation for the two enantiomers can be found in the
Supplementary Materials.
Each of the four liquid carvone samples was placed into a heated nozzle reservoir and warmed to 95 °C to promote vaporization [
23]. Argon was used as a backing gas, and the sample was introduced at 50 psig. A Parker Hannifin
® (Otsego, MI, USA) Series 9 supersonic nozzle pulsed sample into the chamber at a rate of 3 Hz with 3 FIDs per gas pulse. In total, 500,000 FIDs, each FID being 20 µs in length, were averaged together for each experimental run.
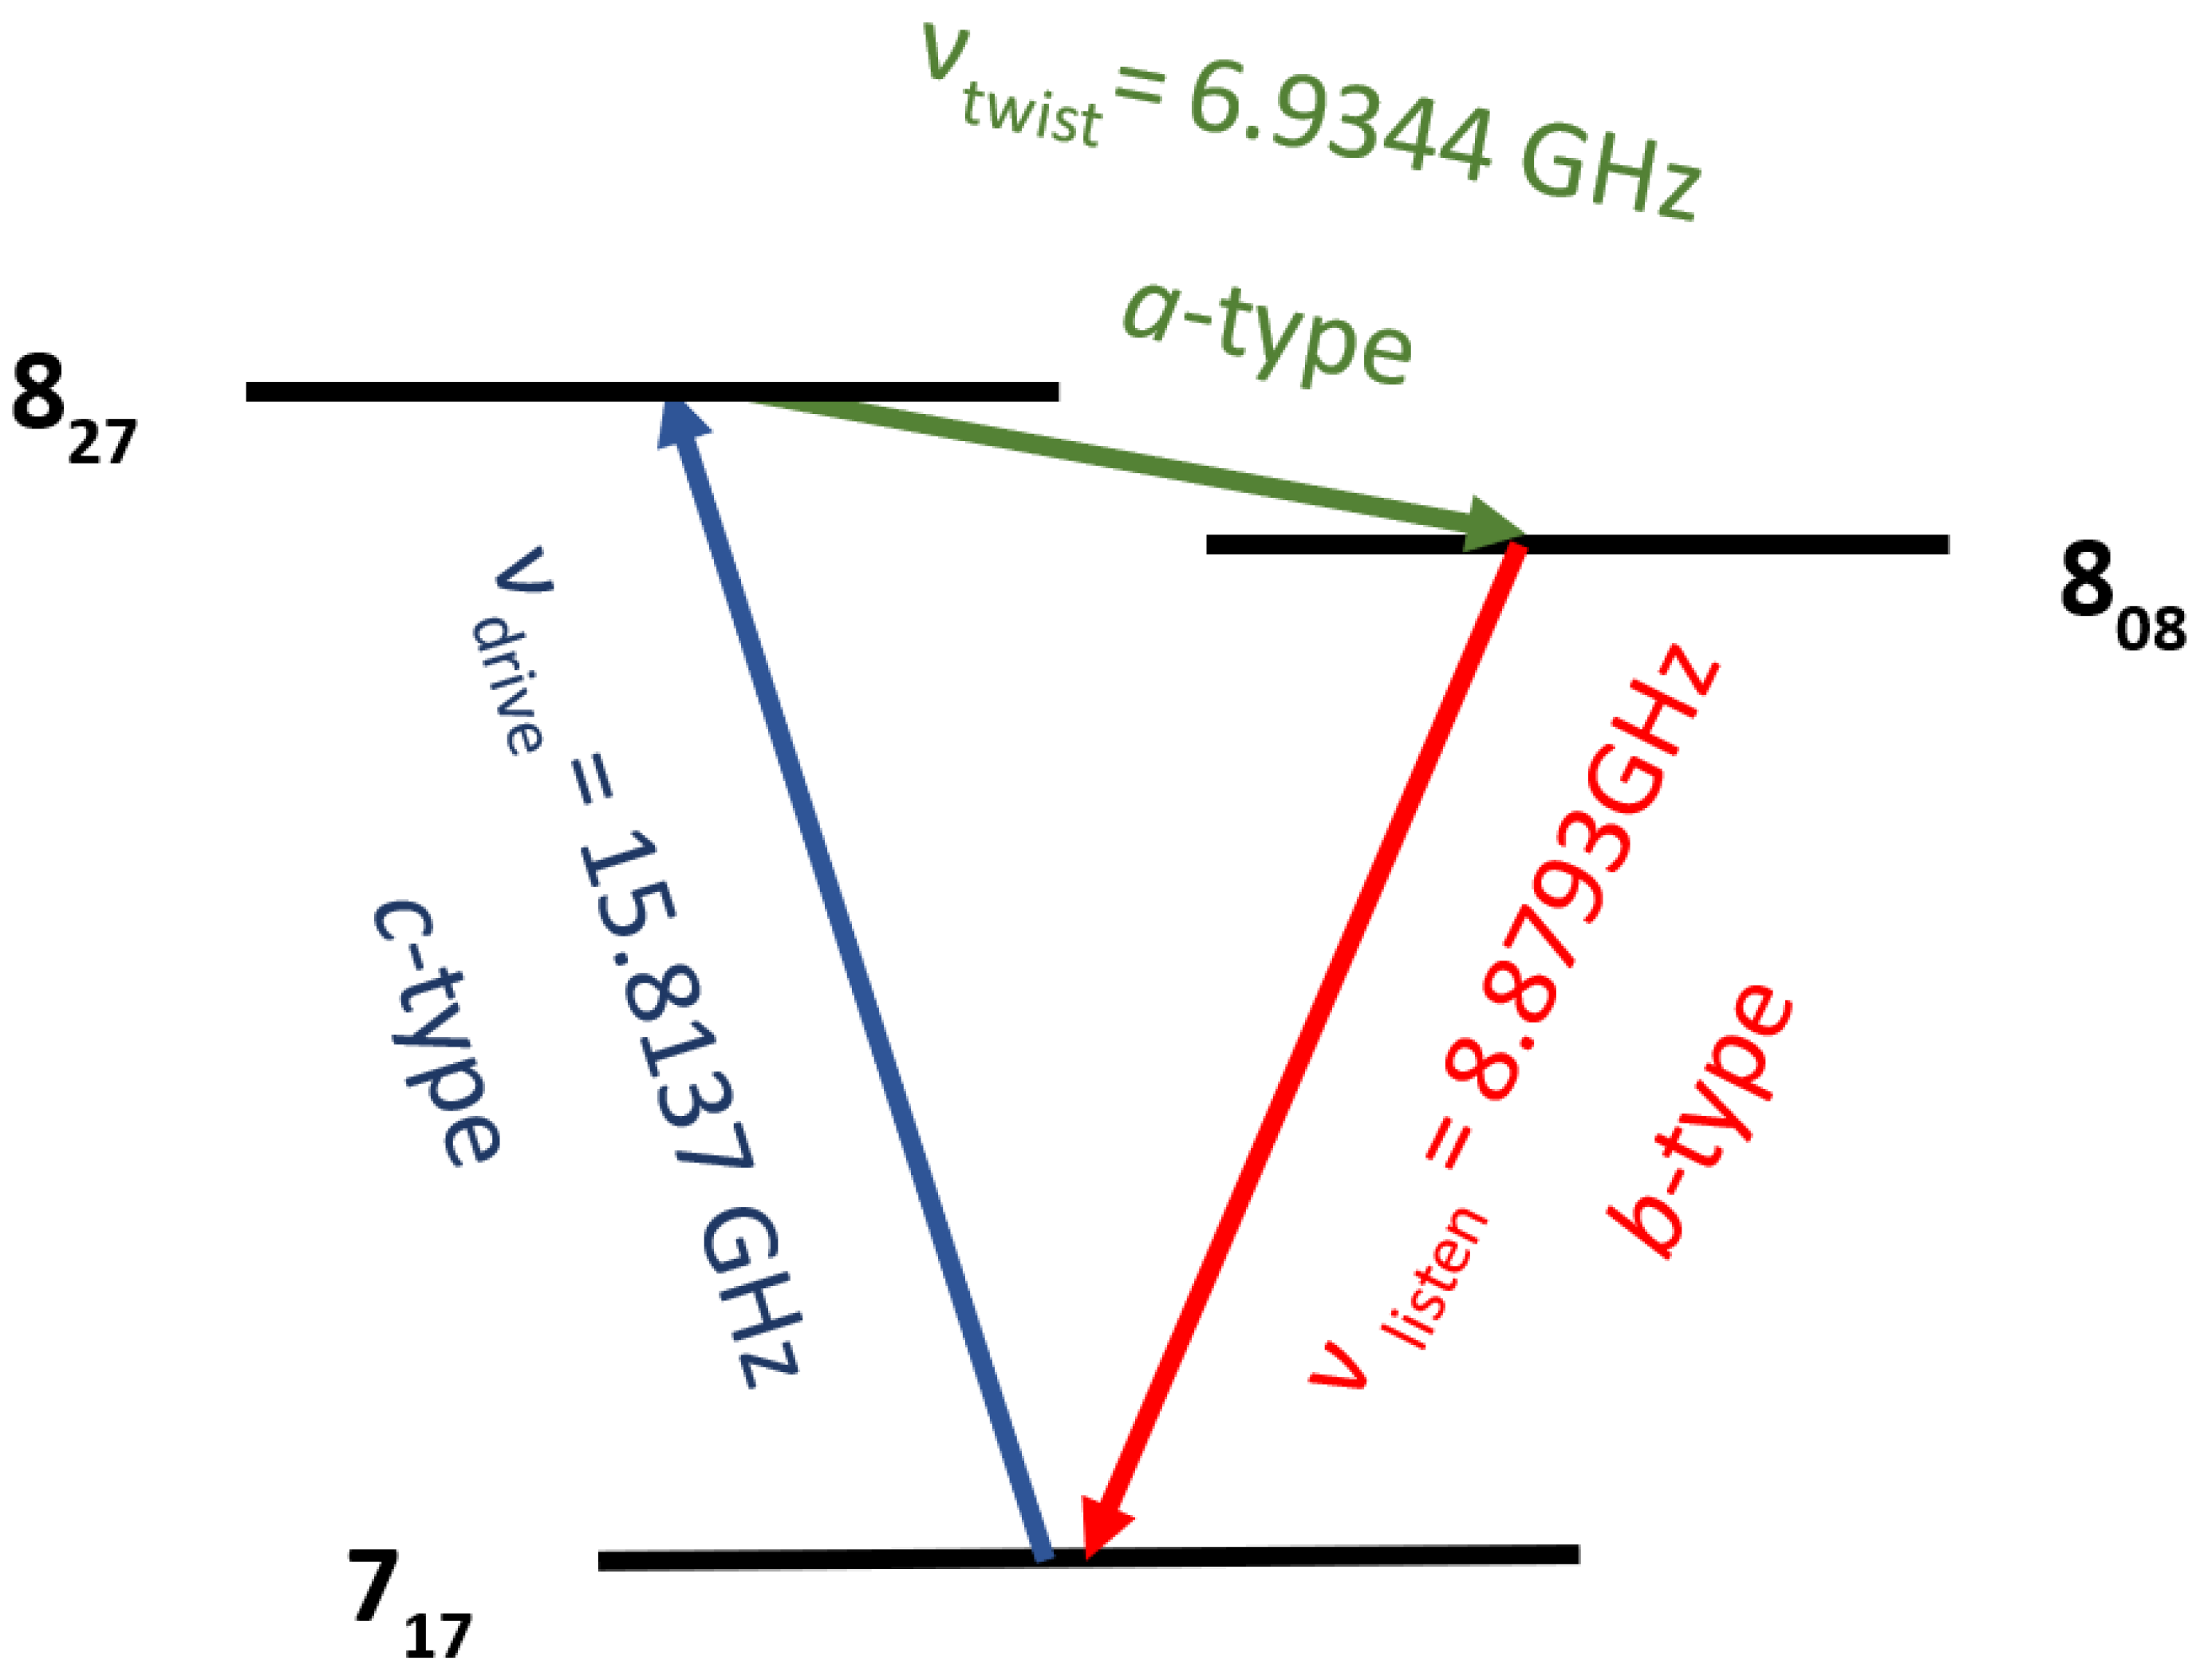
The mixing scheme chosen for all four mixtures is presented in
Figure 4. Transitions were selected based on the previous rotational study of carvone by Moreno et al. [
24]. This study started by determining, theoretically, the three most stable structures of carvone. These structures are labeled EQ1, EQ2, and EQ3. For another to be submitted work on this molecule, we performed optimization calculations of these conformers at the B3LYP/6-311G++(d,p) level using Gaussian09 [
25], and these structures are presented in
Figure 5. Of these conformers, EQ2 was determined to be the most stable conformer, with the strongest of these transitions being
b-type as the dipole moment component ordering is
μb >
μa >
μc. As a result, it was decided that the optimal mixing scheme would consist of a
c-type π/2 “drive” transition, an
a-type π “twist” transition, and a
b-type “listen” transition with antennae colored blue, green, and red corresponding to the transition color scheme in
Figure 4. Candidate transition loops fitting this scheme were then determined by utilizing the fitted spectral constants in the Moreno work in SPCAT to predict transition frequencies and quantum numbers.
The best transition loop for these experiments consisted of a drive pulse centered at 15.8137 GHz, a twist pulse centered at 6.9344 GHz, and a listen transition at 8.8793 GHz. The drive pulse was amplified by a 1 W amplifier for a duration of 7.45 µs and broadcast into the chamber via the external horn (again, colored blue) seen in
Figure 1. Secondly, the twisting pulse at 6.9344 GHz was amplified with a 40 W power amplifier and broadcast from the antenna labeled green in
Figure 1 for a duration of 300 ns. The resultant listening frequency of 8.8793 GHz was received by the red-colored antenna in the schematic in
Figure 1, low noise was amplified, and the subsequential FID was recorded. Timings for the drive and twist pulse were achieved by maximizing the coherence signal in a traditional CP-FTMW experiment utilizing the power amplifiers that would be employed in the M3WM experiment. Since maximizing the coherence pulse is assumed to be the π/2 condition, this timing was used directly for the drive pulse and doubled for the twist pulse.
4. Discussion
The results of experiments A, B, and C follow precisely what was observed in previous M3WM experiments, as the “pure” R- and S-carvone are almost identical in SNR, and no signal is observed in the racemic mixture after 500,000 averages. The only difference between the two values may be attributed to the fact that 98% and 96% are minimum purities. To validate this further, we obtained a Certificate of Analysis of the samples from the supplier (found in the
Supplementary Materials). The R-carvone sample was determined to be 99.3% pure, while the S-carvone sample was 98.9% pure. This slight difference in purity can easily explain the small difference in SNR (21:1 vs. 20:1) between the two samples.
To explain the results of Experiment D, we must first try to understand the specific SNR expected in a 3:1 mixture and then check if these results match with what would be expected. In order to achieve this, we first present some well-understood principles regarding the enantiomeric excess (ee) of a mixture.
The
ee of a mixture is defined by the following:
where
R and
S are masses (or volumes) of the R and S enantiomers. Defined for optical rotation, this value is given as:
Equation (2) comes from the observation that when an absolute racemic mixture is present, the optical rotation of the light is 0°. Similarly, it was shown that M3WM experiments exhibit no signal for a racemic mixture because the FID signals deconstructively interfere due to being 180° out-of-phase with one another. By taking this similarity into account, then, the same equation may be used to determine the
ee of a mixture using SNR:
However, we should note that our “pure” samples are not pure but 99.3% and 98.9% for R- and S-carvone, respectively, resulting in slight differences in our observed pure SNRs. A 3:1 mixture of R-to-S taking the purities into account, should then give a 50.2% ee of R-carvone (50% just assuming absolutely pure). By using Equation (3) for the 3:1 mixture and using the results of Experiments A and B, disregarding the small discrepancies in purities give % ee of 39% and 37%, respectively.
At first, this result would seem very concerning as the values are almost 25% off from the accepted certificate of analysis. However, the results of experiments A, B, and C, along with some of the literature results, provide the basis for the conclusion that the instrument, as constructed, is fully operational. The first is that the uncertainty in
ee in previous studies was shown to be approximately ±5% across 10 experiments [
22]. Our experiment falls easily within the 3 s, 95% confidence interval of this work being 11% and 13% off, respectively. Furthermore, the SNR signals of 7.8:1 and 21:1 or 20:1 are lower, to begin with, and it was also shown that chirality determination is greatly increased when signals are above 50:1 in SNR.
However, this result on its own is not satisfactory, so we investigated the FID and FFT information more to understand these results. The first item undertaken was to look at the real and imaginary FFT portions of the pure R- and S-carvone species. They are presented in
Figure 7. If the FID signals are more than 90° out-of-phase, they will be opposite in sign in the imaginary part of the FFT. This is exactly the case; however, there are dispersion signals in the real part of the FIDs, indicating that the signals may not be 180° out-of-phase with one another. The raw FID data, however, contains many manmade signals that overwhelm the traditional microwave signals, even in a common CP-FTMW arrangement. In order to understand the signal, we were only interested in the listen transition at 8.8793 GHz. Thus, we put the signal through a Fourier bandpass filtering process of only allowing ±0.5 MHz around the real and imaginary signal at 8.8793 GHz while blanking the rest of the spectrum. From there, an inverse FFT was employed to reconstruct the time domain FID signal in which we were interested. Those FIDs are presented in
Figure 8.
The full FIDs of
Figure 8, however, do not provide the resolution to see the oscillations of the 8.8793 GHz signal. Therefore, a representative “zoom-in” of each FID is presented in
Figure 9, along with an overlay of the two signals. From the overlay, it is apparent that the signals are not, in fact, 180° out-of-phase as our Real and Imaginary FT data implied. In order to show that this spectrometer is fundamentally equivalent to previous M3WM experiments, we need to show that this signal can be shown to give more accurate
ee measurements than those from the magnitude spectrum alone.
The first determination, then, is to understand how the
ee measurement depends on the phase in an M3WM experiment. For this, Shubert et al. provide the proportionality [
10]:
where
ΦMW and
ΦRF are the phases of the microwave and radiofrequency pulses typically used for the drive and twist pulses, respectively. This leads to an observed phase of the enantiomers,
, at the start of the FID,
tr, as [
10]:
However, if the drive and twist phases are out-of-phase, then the ±π of Equation (6) will readjust to the observed phase of the enantiomers. Using Equations (5) and (6) into Equation (4), we can arrive at a new proportionality:
where
ΦOBS1−ΦOBS2 is the phase difference between the enantiomers.
Using sine function mathematical fitting tools on the pure R- and S-carvone FIDs, we determined the
ΦOBS1−ΦOBS2 to be 136.6° out-of-phase. The sine fitting tool utilizes a specific number of points (128 in our experiments) of the Fourier-filtered FID and fits them to the function
, where
a is the amplitude of the FID,
b is the frequency of the signal, and
c is the phase. The fitting tool utilizes a Marquart–Levenberg algorithm using the sum of the least-squares deviations as the maximum-likelihood criterion. It should be noted here that all fits had an R
2 value > 0.99999. The mathematically derived 136.6° was in excellent agreement with a much less rigorous Lissajous plot method employed (135.1°). Previous experience with FID averaging in the CP-FTMW experiment shows that there is an uncertainty of ±0.5 ps in the time domain. By using this, we can now establish a calibration phase discrepancy of 136.6 ± 0.3° for the determination of any resultant SNR mixtures. This means we need to adjust Equation (3) to:
Using Equation (8), then, for the 3:1 mixture and using the results of Experiments A and B give %
ee of 53.7 ± 0.3% and 50.9 ± 0.2%, respectively. These values are in much better agreement with the exact value of 50.2%
ee given earlier using the certified values and certainly agree with the reported 5%
ee uncertainty in an M3WM experiment (using S-carvone SNR values, we are <1% off the accepted) [
22].
The last question that requires addressing is how is the relatively large twist frequency possible? Patterson and Doyle explain that the twist frequency,
νtwist ≤
c/4
L, where
c is the speed of light and
L is the characteristic length of the sample [
26]. The solenoid valve employed for the supersonic beam is 0.8 mm in diameter. Moreover, it was shown that multiple nozzle beams interact when placed within 20.5 cm of each other. This gives 0.08 cm ≤
L ≤ 20.5 cm for a scenario with one beam. This beam is not skimmed or columnated in any way. Using
c = 3.0 × 10
10 cm/s, 0.366 GHz ≤
νtwist ≤ 93.75 GHz. However, it was shown that the 180° signal persists up to 4 GHz, as has been shown by both Schnell [
10] and Pate [
3], but starts to become considerably out-of-phase with our value of 6.9344 GHz, perhaps starting to show that the characteristic length of the sample with one supersonic nozzle in the interaction zone is on the order of 10 cm or less. This, along with the tracking of the explicit phase of the pure signals using a calibrant, really allows for any twist frequency to be used as long as the phase discrepancies are tracked, as it is well documented that
[
27].
We conclude, therefore, that this instrument, although different in multiple ways from previous M3WM experiments, was fully developed and demonstrated to be comparable to or better than other known M3WM techniques when Fourier-filtering techniques are leveraged.


