Abstract
The Fe(III) complexes of branched asymmetric dendrimers were obtained by a one-step reaction as the second-generation architectures. Mesomorphic behavior was found for complexes with PF6− and BF4− counter-ions. To obtain knowledge about the existence of HS and LS fractions of iron(III) ion and their evolution with temperature, EPR methods were used. It was demonstrated that compounds contain one low-spin (LS, S = 1/2) and two HS-spin (HS, S = 5/2) of Fe(III) centers and are packed into two magnetic sub-lattices. A floating layers of Fe(III) complexes and Langmuir–Blodgett films on their base were formed and investigated in the presence of a magnetic field.
1. Introduction
Advances in coordination chemistry are to a large extent associated with the construction of new types of ligand systems. Schiff bases (SB, azomethines) and their structural analogues are the most studied ligands in coordination chemistry [1].
The nature of substituents in azomethine ligand systems can be modified in a wide range and it is possible to prepare mononuclear metal chelates exhibiting various physicochemical properties and containing coordination units with different geometry [2]. One interesting class of coordination compounds is complexes of metal ions in macromolecular molecules with branch structure (dendrimers), which has attracted some interest in recent years [3,4,5,6].
One of the interesting characteristics of a dendrimer is the shell effect [7], by which the branches become denser with increasing distance from the core as a feature of the geometrical structure [8]. Yamamoto and co-authors [8] showed that in high-generation dendrimers, highly dense branches near the outer surface can function as a wall to restrict the transfer between into and out of the structure. Dendrimers functionalized with mesogenic units bearing one terminal alkyl chain generally give rise to smectic phases due to their tendency to adopt an elongated overall shape. In the case where mesogenic units with two or three terminal alkoxy chains are used, the formation of columnar phases is favored due to the tendency of the dendrimers to adopt a disc-like configuration [9].
Metallochelates of azomethine ligands [10,11] are widely known as a sample of metallomesogens. Due to a wide multiplicity of their structures and as they are easily chemically modified by metals, such complexes containing transition metal ions are used in various areas [12,13,14,15].
Our aim was synthesis of branched dendrimeric iron(III) complexes with several fragments of long alkyl chains on the periphery. Some results obtained on structural characteristics and phase behavior are presented. Due to the fact that some compounds exhibit liquid crystalline properties, it was interesting to obtain the monolayers of these compounds on the water surface with the formation of films with an ordered structure.
2. Materials and Methods
2.1. Materials
All commercially available reagents were of chemically pure grade and were used without further purification. All solvents, which were used for synthesis, such as benzene, ethanol, and methylene chloride, are available from Merck. Anhydrous iron(III) chloride, iron(III) nitrate, and other inorganic compounds were obtained commercially from Fluka and Merck and used without further purification.
2.2. Physical Measurements
FT-IR spectra were recorded on a Bruker Vertex 80 V device in KBr and CsBr pellets. The Bruker Vertex 80 V provides spectral resolution that is better than 0.07 cm−1, number of scans was 32. A peak resolution of better than 0.06 cm−1 is available for advanced low temperature work. 1H NMR (500.17 MHz) spectral studies were performed on a Bruker Avance-500 device using CDCl3. The elemental analysis (C,H,N) was carried out using a FlashEA 1112 analyzer. Gel exclusion chromatography was performed on a Shimadzu 10A liquid chromatographer, eluent–tetrahydrofuran. Photos of mesophase was done by polarizing microscope Altami Polar 3 equipped with a hot stage (Mettler Toledo, HS 82) with a scan rate from 2 and 10 K/min using temperature controller (Mettler Toledo, HS1). DSC 204 F1 Phoenix differential scanning calorimeter (NETZSCH), a scanning rate was 2 and 10 K/min. The TG analysis was carried out with a rate of 10 K/min to a terminal temperature of 973 K under Ar flow on a NETZCH TG 209 F1 analyzer. EPR experiments (4.2–340 K) were carried out on the powder sample using the X band (9.41 GHz) CW-EPR EMXplus Bruker spectrometer equipped with the helium ER 4112HV and digital ER 4131VT temperature control systems.
2.3. Langmuir–Blodgett Technology
The formation of monolayers and multilayer films was carried out using a Langmuir–Blodgett (LB) trough of individual design [16] in the presence of magnetic field with an induction of 0.05 T directed along the water surface and perpendicular to trough length. The studied compounds were spread over a bidistilled water surface from a chloroform solution with a concentration of 0.25–0.35 mg/mL. The transfer of floating monolayers to a solid substrate was carried out by horizontal touching (Schaefer method or horizontal lift). A collodion film on a support grid was used as substrates for the electronographic experiment.
Structural-phase transformations in floating layers were studied on the basis of surface pressure dependences on the area per molecule (P–A isotherms). The spatial characteristics of the molecules required for the analysis of P–A isotherms were determined by molecular modeling (software package Gaussian 09) [17], using the PBE functional and the cc-pvdz basis [18,19]. The electronographic study of the structure of LB films was performed on electron microscope EMV-100L working in electron-diffraction mode with accelerating voltage 50 kV.
3. Results
3.1. Synthesis and Characterization
Design and spectral characteristics of 3, 5-di[3,4,5-tris(tetradecyloxy)benzoyloxy]benzoyl-4-oxy-2-hydroxybenzaldehyde as ligand precursor was described in [20]. By the differential scanning calorimetry and polarized optical microscopy, it was established that characteristic texture mesophase of aldehyde was not observed under first heating and liquid crystalline properties was detected only upon reheating. Anisotropy appears in the sample after 20–30 min following cooling cycle [20].
The target coordination compounds (Scheme 1) were obtained as the brown fine powders via the complexation reaction of metal salt and the ligand in the molar ratio 1:2 as described earlier [21].
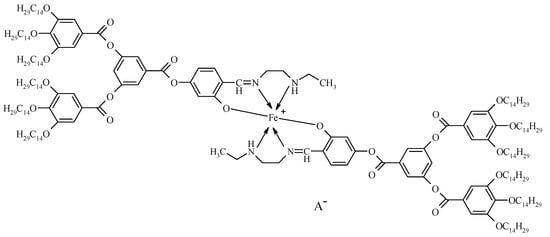
Scheme 1.
Schematic representation of coordination compounds 1–5; A− = NO3− (1), PF6− (2), Cl− (3), ClO4− (4), BF4− (5).
Synthesis of azomethine was carried out directly in a mixture of benzene/ethanol in the presence of KOH, which is the catalyst for the process. All the compounds were characterized by 1H NMR, IR spectroscopy, Figures S1–S11, elemental analysis, and gel permeation chromatography. Table 1 presents the physical data of complexes of the second generation.

Table 1.
The physical data and yields of the complexes 1–5.
1H NMR spectra of complexes recorded in CDCl3 demonstrate the paramagnetic nature of the samples [22] due to the presence of two series of broadened signals in weak and strong fields. All 1H NMR spectra are presented in the Supporting Information.
Chromatographic analysis relative to 1,2-dichlorobenzene as a standard showed the content of an insignificant fraction of low molecular weight impurities in the samples, Figure 1.
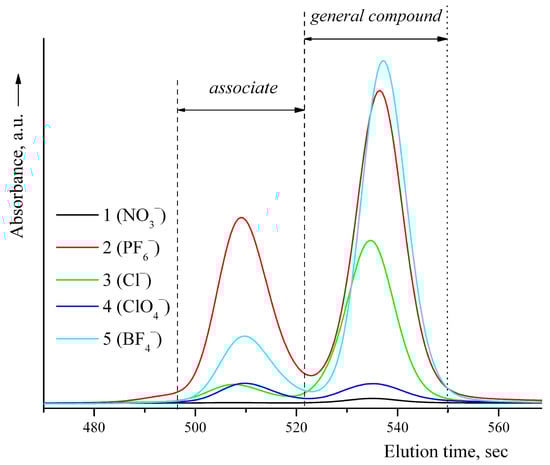
Figure 1.
Chromatograms of the complexes 1–5.
Data of IR spectra recorded in the range 7500–370 cm−1 (KBr pellets) [23,24] and 670–190 cm−1 (CsBr pellets) [25,26,27] are presented in Table 2.
Table 2.
Data of FT-IR and Far-IR spectra of complexes 1–5.
3.2. Thermal Analysis
3.2.1. Phase Transitions in Complex with NO3− Counter-Ion 1
When the sample 1 is heated, a solid-solid type transition extended in time is observed followed by complete melting at T = 146.6 °C, ΔH = 4.58 kJ/mol. In the cooling cycle, primary crystallization of the sample occurs (Tcr1 = 114.2 °C, ΔH = −6.28 kJ/mol) accompanied by a solid-phase transition (re-crystallization) at a temperature of 17.8 °C (ΔH = −187.82 kJ/mol). Thermomicroscopy data confirm the existence of crystals in an isotropic liquid under displacement.
3.2.2. Phase Transitions in Complex with PF6− Counter-Ion 2
The data of DSC and thermal polarization microscopy for complex 2 allow us to conclude that there is a solid-state transition at T = 24.5 °C (ΔH = 151.38 kJ/mol) with the subsequent existence of the compound in the mesomorphic state and its transition to the isotrope (Tiso = 132.4 °C, ΔH = 2.85 kJ/mol). Upon cooling, a mesophase is formed from an isotropic liquid at Tmes = 109.7 °C (ΔH = −3.62 kJ/mol) and the sample begins to crystallize at Tcr = 19.2 °C, ΔH = −177.89 kJ/mol (Figure 2).
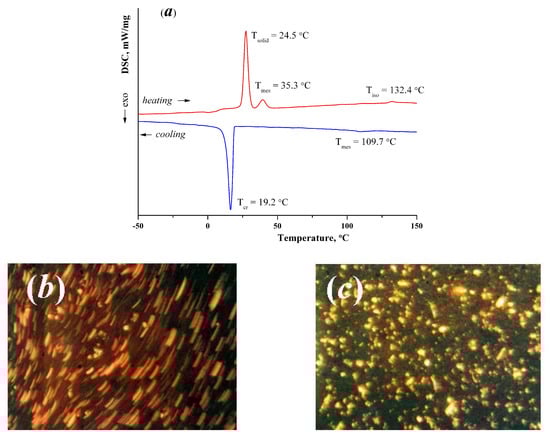
Figure 2.
(a) DSC curves of the complex 2; (b) Linear defects that appear when the sample is shifted (mesophase), heating cycle, T = 85 °C, crossed nicols, magnification 200×; (c) Point and rod-shaped defects of the sample (crystals + mesophase), cooling cycle, T = 19 °C, crossed nicols, magnification 200×.
3.2.3. Phase Transitions in Complex with Cl− Counter-Ion 3
Complex 3 melts in the heating cycle at Tiso = 42.6 °C (ΔH = 357.19 kJ/mol). Upon cooling, anisotropic glass (T = 17.6 °C, ΔH = −206.91 kJ/mol) was observed, which on the DSC curve has the form of an exothermic solid-phase transition similar to the process of crystallization of a substance in terms of energy.
3.2.4. Phase Transitions in Complex with ClO4− Counter-Ion 4
For complex 4, two solid-state transitions were found in the heating cycle at Tsolid1 = 0.8 °C (ΔH = 25.97 kJ/mol) and Tsolid2 = 41.2 °C (ΔH = 51.19 kJ/mol) and melting at Tiso = 138.7 °C (ΔH = 3.19 kJ/mol). In the cooling cycle, a transition from an isotrope to a crystalline form at T = 109.4 °C (ΔH = −5.80 kJ/mol) and a “solid-solid” transition at T = 13.47 °C (ΔH = −72.69 kJ/mol) are observed. According to thermopolarization microscopy, when the sample is cooled to T = 25 °C, crystallites appear, which are visible in the form of agglomerates and bright dots.
3.2.5. Phase Transitions in Complex with BF4− Counter-Ion 5
According to the DSC method, a solid-state transition (Tsolid = 23.8–29.5 °C, ΔH = 113.71 kJ/mol) was recorded in the heating cycle followed by crystallization in the temperature range 32–37 °C (ΔH = −68.71 kJ/mol) for sample 5 (Figure 3a). The subsequent endothermic transition at T = 41.2–45.5 °C (ΔH = 115.23 kJ/mol) indicates the formation of mesophase spherulites which is confirmed by POM (Figure 3b). With further heating in the field of view of the microscope the mesophase texture transforms into an anisotropic field at temperatures above 130 °C (Figure 3c).
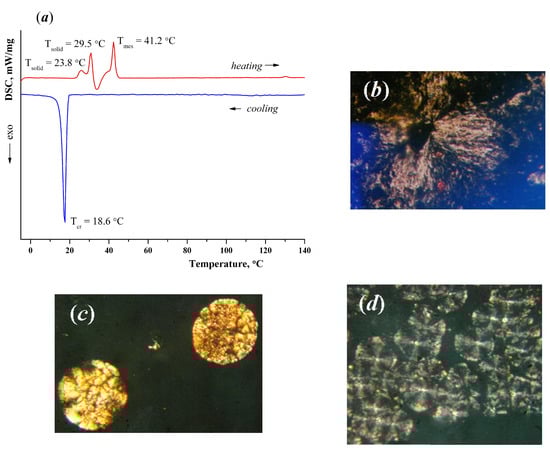
Figure 3.
(a) DSC curves of the complex 5; (b) Individual mesophase spherulite, heating cycle, T = 42 °C, crossed nicols, magnification 200×; (c) Texture of sample in the heating cycle, mesophase drops, crossed nicols, T = 128 °C, magnification 200×; (d) The spherulites show transverse hatching, which is characteristic of smectic E mesophase, cooling cycle, T = 20 °C, crossed nicols, magnification 200×.
Upon cooling and prolonged standing (about 2 h), large spherulites of the mesophase appear. Long exposure at room temperature leads to the formation of a mesophase texture on the surface in the form of spherulites (Figure 3d) with transverse hatching. At a temperature of 18.6 °C (ΔH = −202.16 kJ/mol), the sample crystallizes.
From the analysis of the data obtained, we can conclude that the presence of one or another counter-ion affects not only the existence of a phase transition, but also its character.
3.3. Electron Paramagnetic Resonance Measurements
The X-band EPR spectra (hυ = 0.3 cm−1) for the iron(III) dendrimeric complexes with PF6− (2), Cl− (3), and ClO4− (4) were measured in the region of 4.2–300 K and described in detail in [18,21].
It was established that the system 2 [21] consists of one S = 1/2 low-spin (LS) and two S = 5/2 high-spin (HS) centers. EPR has shown that the compound is magnetically heterogeneous and contains two magnetic sublattices, exhibiting a partial spin crossover (S = 5/2 ↔ 1/2) at 160 K–300 K. HS (S = 5/2) Fe(III) centers with slightly distorted octahedral environment most likely form chains in layers. LS centers and HS centers with strongly distorted octahedral environment most probably form dimeric molecules, were between the layers and participated in the spin transition. EPR has shown the presence of antiferromagnetic (AF) dynamical spin clusters in the temperature above 70 K, which are visible in the short time scale (10−10 s).
EPR data show that compound 3 contains about 98% of high-spin and 2% of low-spin Fe(III) centers [18]. The broad EPR line at g ≈ 2 can be interpreted as HS Fe(III) centers. The integrated intensity of this line passes through a wide maximum at Tmax ≈ 100 K and signals the formation of short-range correlation effects. The reason for the atypical broadening of the EPR signal at low temperatures in complex 3 is probably the quasi-two-dimensional antiferromagnetic nature of magnetism. A model for the packing of cationic Fe(III) complexes into ionic bilayers consisting of chains is proposed. It was shown that the exchange interactions within the chains completely abolish the spin crossover.
The study of the EPR spectra for compound 4 showed that it consists of 77% LS and 23% of HS Fe(III) centers at TN = 10.2 K. At a temperature below 10.2 K, AF ordering is observed, and at high temperatures (150 K–300 K), a partial spin transition (S = 1/2 ↔ 5/2) occurs. In this compound, iron(III) ions are linked into dimers. Thus, short-range interactions between Fe(III) cationic compounds, which determine the magnetic structure, can appear or be suppressed as a result of the influence of the counterion. However, exchange interactions within the chain can abolish the spin crossover.
The remaining two complexes of this series with NO3− (1) and BF4− (5) counter-ions will be discussed below. EPR spectra demonstrate the presence of two types of HS and one LS signals (Figure 4 and Figure 5).
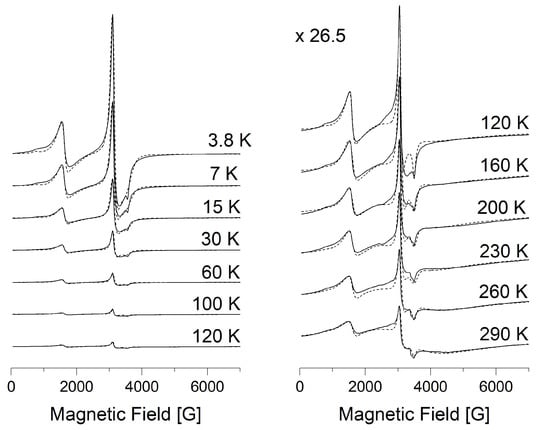
Figure 4.
X-band EPR spectra of compound 1 in the temperature range 3.8–120 K and 120–290 K. The dashed line is the result of modeling by EasySpin Matlab.
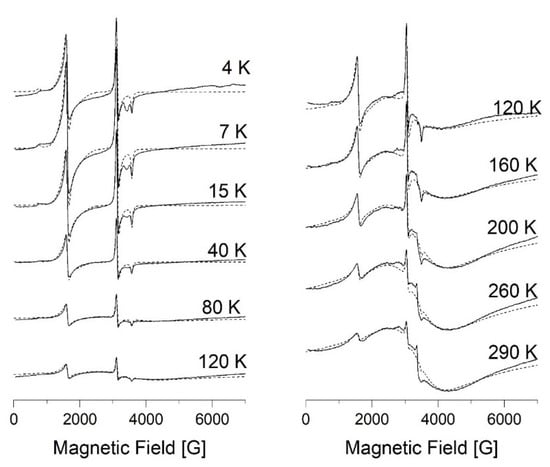
Figure 5.
X-band EPR spectra of compound 5 in the temperature range 4–120 K and 120–290 K. The dashed line is the result of modeling by EasySpin Matlab.
Low-field signal with effective geff = 4.2, whose intensity decreases with increasing temperature, belongs to high-spin Fe(III) centers (S = 5/2). It is characterized by fine structure parameters (D >> hν = 0.3 cm−1, E/D = 1/3) and strong rhombic distortion of crystal field (I-type of HS centers). A broad line (geff = 2) appears at temperatures above 50 K and corresponds to HS Fe(III) ions with weakly distorted (D << = 0.3 cm−1, E = 0) crystal field (II-type of HS centers). LS centers are characterized by following parameters: gx = 2.21, gy = 2.19, gz = 1.935 for 1; gx = 2.2, gy = 2.22, gz = 1.935 for 5.
Modeling was carried out using EasySpin Matlab software and simulation spectra are presented by dashed lines in Figure 4 and Figure 5. The following magnetic parameters provide the best agreement between the experimental spectra and the theoretical ones: g = 1.97, D = 0.42 cm−1, E = 0.105 cm−1 for HS centers of the I-type; g = 2, D = 0.013 cm−1, E = 0 cm−1 for HS centers of the II-type; gx = 2.21, gy = 2.19, gz = 1.935 for LS iron(III) centers of complex 1; gx = 2.2, gy = 2.22, gz = 1.935 for LS iron(III) centers of complex 5. The individual Lorentzian line shape was used for the simulation.
The temperature dependence of the EPR lines integrated intensity (I) is one of the sources of information about the spin transition. The magnetic behavior presented by the temperature dependence of I, I × T, and 1/T is shown in Figure 6 and Figure 7.
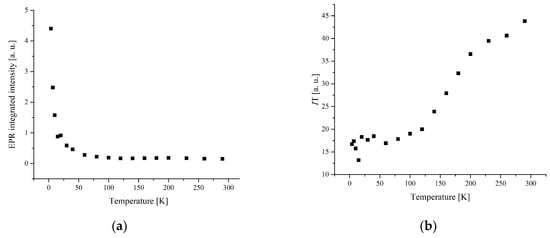
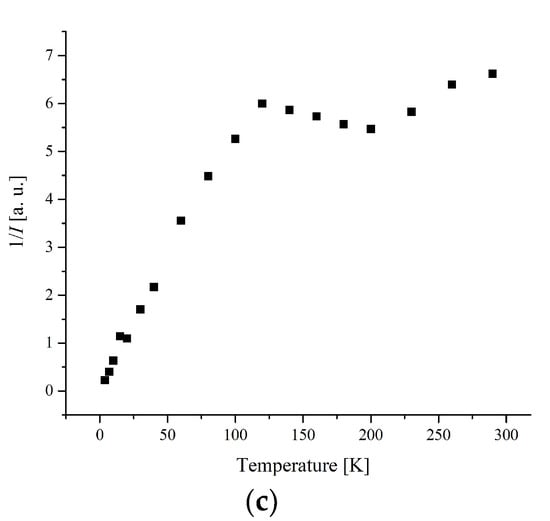
Figure 6.
(a) The temperature dependences of the EPR lines integrated intensities; (b) IT; (c) 1/I, for compound 1.
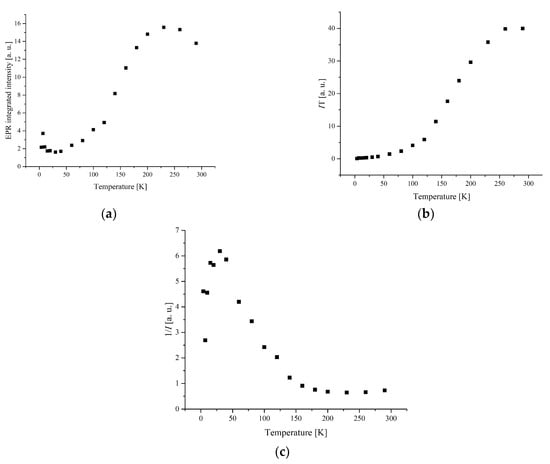
Figure 7.
(a) The temperature dependences of the EPR lines integrated intensities; (b) IT; (c) 1/I, for compound 5.
The width and position of the signal of LS and I-type HS centers remain the same with temperature changes for complex 1. The temperature dependence of I for the LS and I-type HS centers follows the Curie–Weiss law with θ = −0.42 K (Figure 8 and Figure 9). A negative Weiss constant (θ) indicates antiferromagnetic exchange interactions between iron ions.
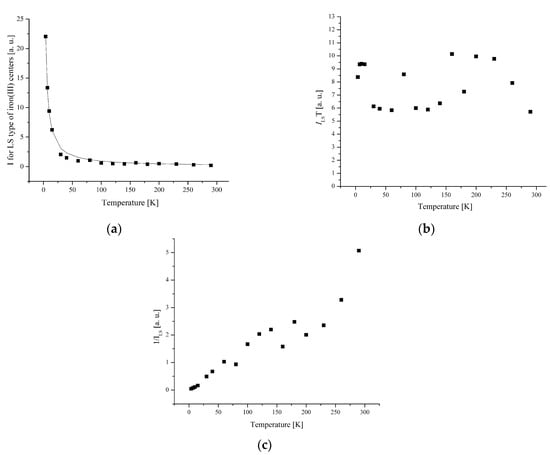
Figure 8.
(a) The temperature dependences of the EPR lines integrated intensities; (b) IT; (c) 1/I of LS Fe(III) centers for complex 1.
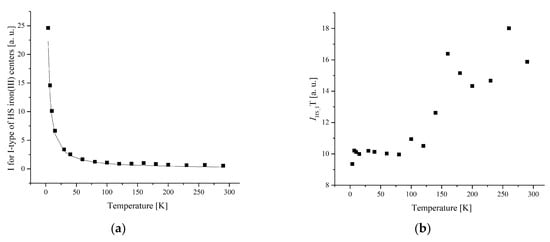
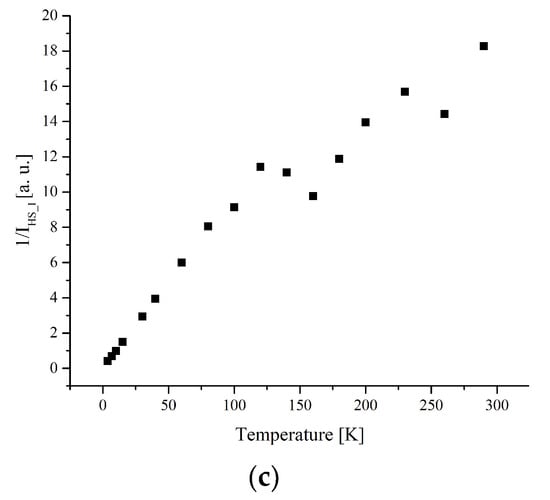
Figure 9.
(a) The temperature dependences of the EPR lines integrated intensities; (b) IT; (c) 1/I of I-type HS Fe(III) centers for complex 1.
For complex 5, the temperature dependence of the integral intensity of LS and I-type HS centers demonstrates a maximum at TN = 10 K, and above TN, it corresponds to the Curie–Weiss law with θ = −23 K and θ = −13 K (Figure 10 and Figure 11), respectively.
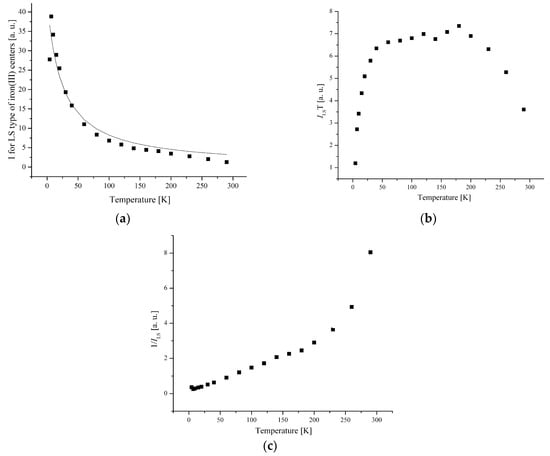
Figure 10.
(a) The temperature dependences of the EPR lines integrated intensities; (b) IT; (c) 1/I of LS Fe(III) centers for complex 5.
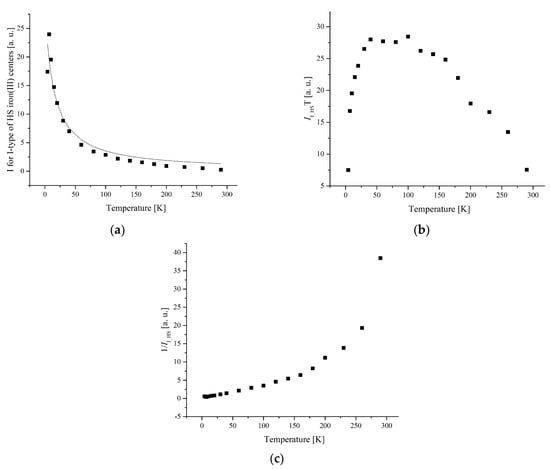
Figure 11.
(a) The temperature dependences of the EPR lines integrated intensities; (b) IT; (c) 1/I (c) of I-type HS Fe(III) centers for complex 5.
More complex temperature behavior is observed for lines belonging to II-type centers. The line narrows and shifts to the weak fields as the temperature decreases. The temperature dependence of integrated intensity exhibits a broad peak at Tmax = 260 K for complex 1 (Figure 12) and at Tmax = 225 K for complex 5 (Figure 13).
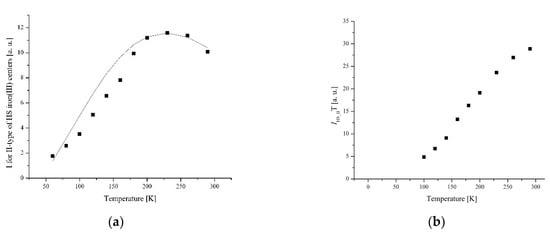
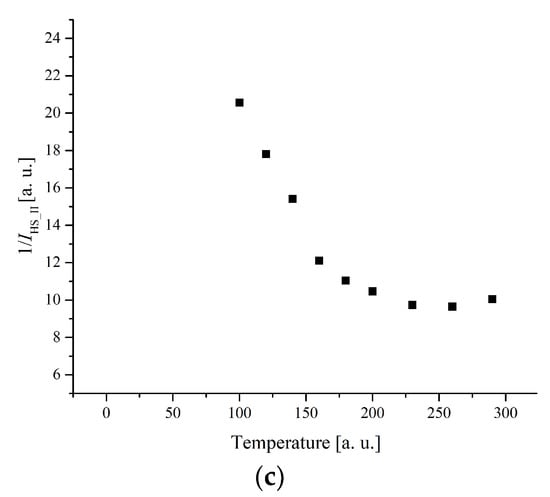
Figure 12.
(a) The temperature dependences of the EPR lines integrated intensities; (b) IT; (c) 1/I of II-type HS Fe(III) centers for complex 1.
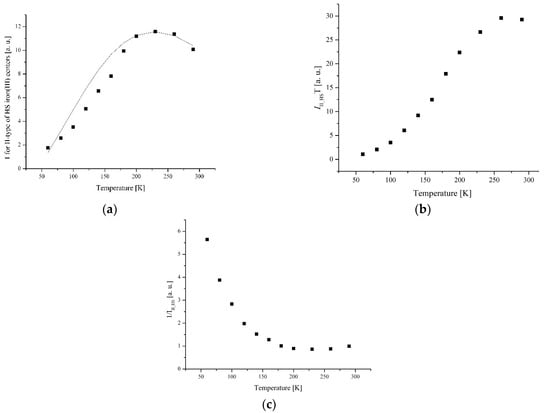
Figure 13.
(a) The temperature dependences of the EPR lines integrated intensities; (b) IT; (c) 1/I (c) of II-type HS Fe(III) centers for complex 5.
Previously, a shift of the maximum was observed depending on the type of counter-ion for complexes of this series: Tmax = 259 K for complex 2 [21], Tmax = 100 K for complex 3 [18], and absence of II-type centers for complex 4 [18]. A broad maximum on the temperature dependence can be interpreted as an exchange line from Heisenberg’s chains. The values of exchanges were determined by the Fisher model for infinite chains: J2 = 218 cm−1 (1), J2 = 190 cm−1 (5). A positive exchange value corresponds to the antiferromagnetic interaction.
Thus, the EPR method shows the effect of counter-ions on the structural organization of compounds. The considered magnetic systems are inhomogeneous and consist of two magnetic sub-lattices.
HS Fe(III) centers with a slightly distorted octahedral environment form layers of chains. HS Fe(III) centers with a strongly distorted octahedral environment and LS centers form dimers located between the layers. Recently, the scheme of formation a network of hydrogen bonds with the amine groups of the ligands and counterions can, thus, produce a bilayered packing with a chain structure of ionic bilayers was shown by Domracheva and co-authors [18].
3.4. Structural-Phase Transformations in Floating Layers and Langmuir–Blodgett Films
The Langmuir–Blodgett methodology offers the possibility to obtain highly ordered and controlled mono/multilayers and realizes the construction of ultimate molecular architectures, which allows the study of physical phenomenon on a molecular level [28,29]. Biaxial films, which can be obtained by setting the macroscopic orientation of molecules in a Langmuir monolayer, for example, using a magnetic field [16,30], have certain advantages over monaxial films in some cases. To solve such a problem, liquid-crystal iron complexes with magnetic properties may turn out to be promising. In our case, bischelate complexes with PF6− (2) and BF4− (5) counter-ions exhibited mesomorphic behavior, and it seemed interesting to obtain monolayers of these compounds on the water surface with the formation of films with an ordered structure under a magnetic field.
The P–A isotherms of the forward and reverse directions of floating layers of studied complexes are shown in Figure 14.
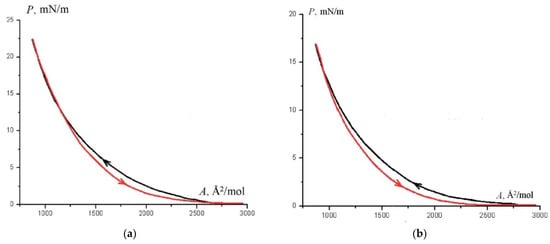
Figure 14.
(a) P–A isotherms of floating layers of complex 5; (b) P–A isotherms of floating layers of complex 2; k = 0.45.
Hysteresis indicates the formation of molecular aggregates when obtaining floating layers. The cause of aggregation may be hydrogen bonds between the molecules of compounds. On isotherms of monolayers, phase transformations are not clearly expressed. This is probably due to the fact that the layers are locally inhomogeneous and phase transitions do not occur synchronously in different areas. The representation of isotherms in Volmer coordinates made it possible to establish the inflection points that determine the boundaries of the phase states in monolayer. It has been found that under compression (pressure range from 0 to 20—30 mN/m), the floating layers remain monolayers during all phase transitions. Comparison of the areas per molecule in various phase states with the areas calculated from simulated models (Table 3) made it possible to identify the types of phase states that monolayers undergo during compression and to determine the nature of changes in the molecular conformation. Monolayers can be in liquid-expanded and condensed phases. One or two of the condensed phases may be liquid crystal (LC).
Table 3.
Geometric parameters of the molecules of iron(III) complexes 2 and 5.
During the formation of monolayers in the presence of a magnetic field, changes in the course of P–A isotherms are observed compared to the situation without a field, see Figure 15.
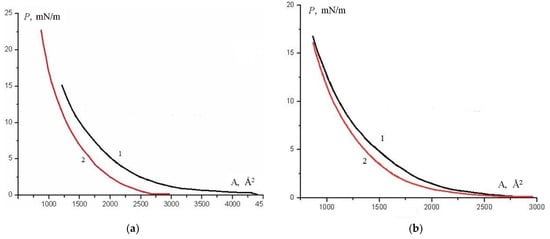
Figure 15.
(a) P–A isotherms of floating layers of complex 5; (b) P–A isotherms of floating layers of complex 2. 1—without magnetic field, 2—in the presence of the field, k = 0.45.
The shift of the isotherm towards smaller areas indicates the densification of the monolayer, as was observed earlier in the case of lanthanide complexes [16]. The effect of the counter-ion on the degree of monolayer densification in the presence of a magnetic field is noticeable. The effect is stronger for monolayers of complex 5 with BF4− counter-ion, see Figure 15a. In the case of complex 2, the difference in the course of isotherms when the magnetic field is on and off begins to be observed only in the LC phase, which indicates the formation of a denser layer due to orientation (Fredericks effect), see Figure 15b.
A biaxial LB film can be obtained from oriented monolayers, provided that their orientation is preserved when transferred to the substrate. The presence of orientation can be determined by the texture electron-diffraction pattern, if it is obtained with a normal incidence of the electron beam on the plane of the film. In the electron diffraction study of LB films assembled from monolayers oriented by a magnetic field, in the case of complex 5, it was possible to obtain a texture electron diffraction pattern showing the presence of a planar orientation in the film, see Figure 16. At the same time, the electron diffraction pattern of the films of complex 2 contains ring diffraction maxima, which indicate the absence of orientation.
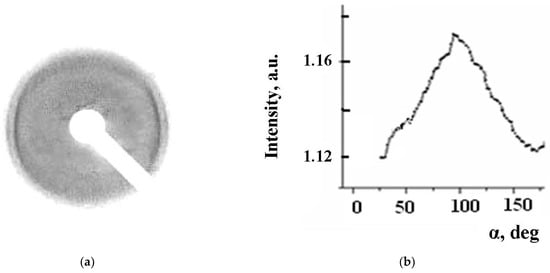
Figure 16.
(a) Electron-diffraction patterns of complex 5 Langmuir–Blodgett film; (b) Azimuthal intensity distribution in crescent-shaped maximum with a period of 4.18 Ǻ.
The structural parameters calculated from the angular positions of the maxima on the electronograms are given in Table 4.
Table 4.
Bragg’s periods of LB-films of complexes according to electronography data.
The small value of the interplanar distances indicates that the long axes of the molecules should be located either normally to the substrate plane or at a large angle to it. This fact makes it possible to explain what happens to molecules in a monolayer when it is transferred to a substrate. The degree of orientation of molecules in the LB film of complex 5 was determined (similar to [31,32]) from the azimuthal smearing of the maximum in the texture electron diffraction pattern with a period of 4.18 Å and turned out to be quite high, 0.69.
4. Conclusions
The phase behavior of a series of branched iron(III) complexes was studied by means of the DSC and POM methods. At the same time the similarity of the cation structure made it possible to assume mesomorphism for the entire series of compounds. However, from the analysis of the data obtained, it can be concluded that the presence of one or another counter-ion affects not only the existence of a phase transition, but also its character. Thus, mesomorphic behavior was confirmed only for complexes with PF6− and BF4− counter-ions. Probably, its nature is explained by two reasons: the formation of dimeric structures due to the hydrogen bonding of the cation and anion, which is also confirmed by the data of the EPR method, as well as the processes of microsegregation of alkyl chains at the periphery of dendrimer. For other complexes (with NO3−, Cl−, ClO4− counter-ions), only solid-state transitions are observed with subsequent melting of the samples. Due to the liquid crystal properties revealed for the two complexes, it seemed interesting to obtain monolayers of these compounds on the water surface with the formation of films using the Langmuir–Blodgett technology. A biaxial LB film can be obtained from oriented monolayers, provided that their orientation is preserved when transferred to the substrate. In the electron diffraction study of LB films assembled from monolayers oriented by a magnetic field, in the case of complex 5, it was possible to obtain a texture electron diffraction pattern showing the presence of a planar orientation in the film. In this case, the degree of orientation of molecules in the LB film of complex 5 turned out to be quite high (0.69). At the same time, the electron diffraction pattern of the films of complex 2 contains ring diffraction maxima, which indicate the absence of orientation. It was shown by EPR spectroscopy that the compounds contains three types of Fe(III) centers—one low-spin (LS, S = 5/2) and two high-spin (HS, S = 5/2) Fe(III) centers. We presume that HS Fe(III) centers with a slightly distorted octahedral environment form layers of chains, while HS Fe(III) centers with a strongly distorted octahedral environment and LS centers form dimers located between the layers.
Supplementary Materials
The following supporting information can be downloaded at: https://www.mdpi.com/article/10.3390/sym14061140/s1, Figure S1: 1H NMR spectrum of the complex 1; Figure S2: FT-IR spectrum of the complex 1 in KBr pellets; Figure S3: 1H NMR spectrum of the complex 2; Figure S4: FT-IR spectrum of the complex 2 in KBr pellets; Figure S5: 1H NMR spectrum of the complex 3; Figure S6: FT-IR spectrum of the complex 3 in KBr pellets; Figure S7: 1H NMR spectrum of the complex 4; Figure S8: FT-IR spectrum of the complex 4 in KBr pellets; Figure S9: 1H NMR spectrum of the complex 5; Figure S10: FT-IR spectrum of the complex 5 in KBr pellets; Figure S11: FT-IR spectra of the complexes 1–5 in CsBr pellets.
Author Contributions
Conceptualization, M.G. and U.C.; methodology, M.G., U.C. and V.V.; validation, M.G., U.C. and V.V.; formal analysis, M.G.; investigation, M.G., U.C. and V.V.; data curation, M.G. and V.V.; writing—original draft preparation, U.C. and V.V.; writing—review and editing, M.G.; visualization, U.C.; supervision, M.G.; project administration, M.G. All authors have read and agreed to the published version of the manuscript.
Funding
This research was partly funded by the state assignment AAAA-A21-121011490059-5 (synthesis, characterization, phase behavior) and by the financial support from the government assignment for FRC Kazan Scientific Center of RAS (EPR measurements).
Institutional Review Board Statement
Not applicable.
Informed Consent Statement
Not applicable.
Data Availability Statement
Not applicable.
Acknowledgments
Spectral and DSC research has been conducted on the equipment of the Upper Volga region center of physicochemical research.
Conflicts of Interest
The authors declare no conflict of interest.
References
- Garnovskii, A.D.; Vasil’chenko, I.S. Rational design of metal coordination compounds with azomethine ligands. Russ. Chem. Rev. 2002, 71, 943–968. [Google Scholar] [CrossRef]
- Collinson, S.R.; Fenton, D.E. Metal complexes of bibracchial Schiff base macrocycles. Coord. Chem. Rev. 1996, 148, 19–40. [Google Scholar] [CrossRef]
- Newkome, G.; Moorefield, C.; Vogtle, F. Dendrimers and Dendrons: Concepts, Syntheses, Applications; Wiley-VCH: Weinheim, Germany, 2001. [Google Scholar]
- Frechet, J.; Tomalia, D. Dendrimers and Other Dendritic Polymers; Wiley: Chichester, UK, 2002. [Google Scholar]
- Vogtle, F.; Gestermann, S.; Hesse, R.; Schwierz, H.; Windisch, B. Functional dendrimers. Prog. Polym. Sci. 2000, 25, 987–1041. [Google Scholar] [CrossRef]
- Newkome, G.R.; Shreiner, C.D. Poly(amidoamine), polypropylenimine, and related dendrimers and dendrons possessing different 1 → 2 branching motifs: An overview of the divergent procedures. Polymer 2008, 49, 1–173. [Google Scholar] [CrossRef]
- Maraval, V.; Laurent, R.; Donnadieu, B.; Mauzac, M.; Caminade, A.-M.; Majoral, J.-P. Rapid synthesis of phosphorus-containing dendrimers with controlled molecular architectures: First example of surface-block, layer-block, and segment-block dendrimers issued from the same dendron. J. Am. Chem. Soc. 2000, 122, 2499–2511. [Google Scholar] [CrossRef]
- Yamamoto, K.; Takanashi, K. Synthesis and functionality of dendrimer with finely controlled metal assembly. Polymer 2008, 49, 4033–4041. [Google Scholar] [CrossRef][Green Version]
- Cruz, C.; Figueirinhas, J.; Sebastiao, P. NMR of Liquid Crystal Dendrimers; Pan Stanford Publishing: Singapore, 2017. [Google Scholar]
- Holm, R.H.; Everett, G.W., Jr.; Chakravorty, A. Metal complexes of Schiff bases and β-ketoamines. In Progress in Inorganic Chemistry; Cotton, F.A., Ed.; John Wiley and Sons, Inc.: New York, NY, USA, 1966; Volume 7, pp. 83–214. [Google Scholar]
- Holm, R.H.; O’Connor, M.J. The Stereochemistry of Bis-chelate Metal(II) Complexes. In Progress in Inorganic Chemistry; Lippard, S.J., Ed.; John Wiley and Sons, Inc.: New York, NY, USA, 1971; Volume 14, pp. 241–401. [Google Scholar]
- Zoubi, W.A.; Ko, Y.G. Schiff base complexes and their versatile applications as catalysts in oxidation of organic compounds: Part I. Appl. Organomet. Chem. 2017, 31, e3574. [Google Scholar] [CrossRef]
- Liu, X.; Manzur, C.; Novoa, N.; Celedon, S.; Carrillo, D.; Hamon, J.-R. Multidentate unsymmetrically-substituted Schiff bases and their metal complexes: Synthesis, functional materials properties, and applications to catalysis. Coord. Chem. Rev. 2018, 357, 144–172. [Google Scholar] [CrossRef]
- Zoubi, W.A.; Al-Hamdani, A.A.S.; Ahmed, S.D.; Ko, Y.G. Synthesis, characterization, and biological activity of Schiff bases metal complexes. J. Phys. Org. Chem. 2018, 31, e3752. [Google Scholar] [CrossRef]
- Harding, D.J.; Harding, P.; Phonsri, W. Spin crossover in iron(III) complexes. Coord. Chem. Rev. 2016, 313, 38–61. [Google Scholar] [CrossRef]
- Alexandrov, A.I.; Krasnov, A.V.; Pashkova, T.V. Magnetic field effect in floating layers and Langmuir-Blodgett films of mesogenic complexes of lanthanides. Synth. Met. 2004, 147, 205–208. [Google Scholar] [CrossRef]
- Frisch, M.J.; Trucks, G.W.; Schlegel, H.B.; Scuseria, G.E.; Robb, M.A.; Cheeseman, J.R.; Scalmani, G.; Barone, V.; Mennucci, B.; Petersson, G.A.; et al. Gaussian 09, Revision D.01; Gaussian, Inc.: Wallingford, UK, 2013. [Google Scholar]
- Domracheva, N.E.; Vorobeva, V.E.; Ovcharenko, V.I.; Bogomyakov, A.S.; Zueva, E.M.; Gruzdev, M.S.; Chervonova, U.V.; Kolker, A.M. Counterion effect on the spin-transition properties of the second generation iron(III) dendrimeric complexes. Inorg. Chim. Acta. 2017, 459, 131–142. [Google Scholar] [CrossRef]
- Gruzdev, M.S.; Chervonova, U.V.; Ksenofontov, A.A.; Krestianinov, M.A.; Alexandrov, A.I.; Pashkova, T.V. Schiff base complexes with different metals incorporating derivatives of 3,6-di-tert-butylcarbazole. Appl. Organomet. Chem. 2021, 35, e6145. [Google Scholar] [CrossRef]
- Gruzdev, M.S.; Chervonova, U.V.; Akopova, O.B.; Kolker, A.M. Synthesis and phase behavior of dendrons derived from 3,4,5-tris(tetradecyloxy)benzoic acid with different functional groups in focal point. J. Chem. Sci. 2015, 127, 1801–1810. [Google Scholar] [CrossRef]
- Domracheva, N.; Vorobeva, V.; Pyataev, A.; Tamura, R.; Suzuki, K.; Gruzdev, M.; Chervonova, U.; Kolker, A. Magnetic properties of novel dendrimeric spin crossover iron(III) complex. Inorg. Chim. Acta. 2016, 439, 186–195. [Google Scholar] [CrossRef]
- Marov, I.; Kostromina, N. EPR and NMR in the Chemistry of Coordination Compounds; Nauka: Moscow, Russia, 1979. (In Russian) [Google Scholar]
- Pretsch, E.; Buhlmann, P.; Affolter, C. Structure Determination of Organic Compounds-Tables of Spectral Data; Springer: Berlin/Heidelberg, Germany, 2000. [Google Scholar]
- Becker, H.; Beckert, R.; Berger, W.; Domschke, G. Organikum, Organisch-chemisches Grundpraktikum; Deutscher Verlag der Wissenschaften Publ.: Berlin, Germany, 1993. [Google Scholar]
- Nakamoto, K. Infrared and Raman Spectra of Inorganic and Coordination Compounds, 6th ed.; John Wiley and Sons, Inc.: Hoboken, NJ, USA, 2009. [Google Scholar]
- Finch, A.; Gates, P.; Radcliffe, K.; Dickson, F.; Bentley, F. Chemical Applications of Far Infrared Spectroscopy; Academic Press: London, UK; New York, NY, USA, 1970. [Google Scholar]
- Cheremisina, I.M. Frequencies of predominantly stretching vibrations and the nature of the metal-ligand bond. J. Struct. Chem. 1978, 19, 286–300. [Google Scholar] [CrossRef]
- Roberts, G.G. Langmuir-Blodgett Films; Springer: New York, NY, USA, 1990. [Google Scholar] [CrossRef]
- Hussain, S.A.; Dey, B.; Bhattacharjee, D.; Mehta, N. Unique supramolecular assembly through Langmuir-Blodgett (LB) technique. Heliyon 2018, 4, e01038. [Google Scholar] [CrossRef] [PubMed]
- Alexandrov, A.I.; Barakhtenko, D.V.; Pashkova, T.V.; Pyatunin, A.V. Formation and structural investigations of biaxial fullerene containing Langmuir-Blodgett films. Liq. Cryst. Appl. 2009, 4, 100–105. [Google Scholar]
- Alexandrov, A.I.; Pashkova, T.V.; Barakhtenko, D.V.; Gruzdev, M.S.; Chervonova, U.V. Structural investigations of iron complex in bulk samples, floating layers and Langmuir-Blodgett films. Liq. Cryst. Appl. 2011, 4, 14–22. [Google Scholar]
- Vainshtein, B.K. Diffraction of X-rays by Chain Molecules; USSR Academy of Sciences Publisher: Moscow, Russia, 1963. (In Russian) [Google Scholar]


Publisher’s Note: MDPI stays neutral with regard to jurisdictional claims in published maps and institutional affiliations. |
© 2022 by the authors. Licensee MDPI, Basel, Switzerland. This article is an open access article distributed under the terms and conditions of the Creative Commons Attribution (CC BY) license (https://creativecommons.org/licenses/by/4.0/).