Article

Generalized Nonparametric Composite Tests for High-Dimensional Data

by
Xiaoli Kong
1,
Alejandro Villasante-Tezanos
2 and
Solomon W. Harrar
3,*
1
Department of Mathematics, Wayne State University, Detroit, MI 48202, USA
2
Department of Biostatistics and Data Science, School of Public and Population Health, University of Texas Medical Branch, Galveston, TX 77555, USA
3
Dr. Bing Zhang Department of Statistics, University of Kentucky, Lexington, KY 40506, USA
*
Author to whom correspondence should be addressed.
Symmetry 2022, 14(6), 1153; https://doi.org/10.3390/sym14061153
Submission received: 15 April 2022 / Revised: 26 May 2022 / Accepted: 29 May 2022 / Published: 2 June 2022
(This article belongs to the Section Life Sciences)

Abstract

:
In this paper, composite high-dimensional nonparametric tests for two samples are proposed, by using component-wise Wilcoxon–Mann–Whitney-type statistics. No distributional assumption, moment condition, or parametric model is required for the development of the tests and the theoretical results. Two approaches are employed, for estimating the asymptotic variance of the composite statistic, leading to two tests. In both cases, banding of the covariance matrix to estimate variance of the test statistic is involved. An adaptive algorithm, for selecting the banding window width, is proposed. Numerical studies are provided, to show the favorable performance of the new tests in finite samples and under varying degrees of dependence.

1. Introduction

Recent advances in technology have allowed for the collection of data in high frequency and resolution. Sparked by these advances, high-dimensional data have been a subject of theoretical and applied investigations, in the last few decades. High-dimensional refers to the situation where the dimension is (much) larger than the sample size. Examples include data from genomic studies, biological studies, financial studies, satellite imaging, modern diagnostic and intervention modalities, etc. To analyze these data, in particular in the context of group or treatment comparison, the asymptotic theory requires both the sample sizes and dimensions to diverge. For an extensive account of the literature on this subject, we refer the reader to the review article by Harrar and Kong [1].
The classical parametric tests (e.g., [2]) are not applicable because the sample covariance matrices are singular. Even in the nonsingular situation, these tests suffer from low power [3]. The problem is worse, if the distribution of the data is heavy-tailed, or if the data is measured in a nonmetric scale, as the usual mean-based hypothesis and inference are not well defined anymore.
Nonparametric methods are well known for being more robust against nonnormality and other conditions, than their parametric counterparts. Classical nonparametric theory formulates tests, considering distribution functions rather than parameters. The challenges with these formulations are that (a) the alternative hypothesis is difficult to interpret and (b) the tests can not be pivoted to construct confidence intervals. To overcome these challenges, some characteristic of the distribution functions is, often, investigated to compare treatments. In our interest, to be as general as possible, we will employ a nonparametric test statistic, for quantifying group or treatment differences.
In the finite dimensional situation (small p and large n), the problem of testing hypotheses formulated in terms of the nonparametric relative effects have been considered in several papers (e.g., [4,5,6,7,8]). A related topic to high-dimensional inference is the asymptotic setting, where the number of treatments goes to infinity but the sample size per treatment could be fixed or large. These problems have been thoroughly investigated in nonparametric situations [9,10,11,12,13]. High-dimensional theory for nonparametric methods is underdeveloped. To the best of our knowledge, there are only two papers that have studied this problem [14,15]. Wang and Akritas [14] focuses on hypotheses formulated in terms of marginal distributions, while Kong and Harrar [15] considered the more general situation, in which the hypotheses of interest are formulated in terms of the nonparametric relative effects. The underlying idea in both works [14,15] is to make the stochastic comparison of each marginal distribution relative to the overall (average of all marginal) distributions. Therefore, the variables must be commensurate, for these methods to be appropriate. It is one aim of the present manuscript to overcome this challenge, by defining the relative effects, marginally.
Consider two mutually independent random samples X i 1 , , X i n i R p for i { 1 , 2 } . For each i, denote X i j = ( X i j 1 , , X i j p ) , where the random variable X i j k is the k t h variable of the j t h subject from the i t h sample group. Denote the total sample size by n = n 1 + n 2 . To be as general as possible, we assume the nonparametric model
X i j k F i k , f o r   j = 1 , , n i ,
where F i k ( · ) is an arbitrary non-degenerate distribution function. In order to accommodate binary, ordered categorical, discrete, and continuous data types in a unified manner, we will use the normalized version of the distribution function, defined as
F i k ( x ) = 1 2 F i k + ( x ) + F i k ( x ) = P ( X i 1 k < x ) + 1 2 P ( X i 1 k = x ) ,
where F i k ( x ) = P ( X i 1 k < x ) and F i k + ( x ) = P ( X i 1 k x ) are the left and right continuous versions of the distribution function [16,17,18].
In our investigation to compare group effects, we study the so-called nonparametric relative group effects. The relative effect for the k t h variable is defined by
ω k = P ( X 11 k < X 21 k ) + 1 2 P ( X 11 k = X 21 k ) = F 1 k d F 2 k .
When ω k is greater that 1 / 2 , we interpret that observations on the k t h variable in the first sample tend to have smaller values, than observations on the k t h variable in the second sample and vice versa, if ω k is smaller than 1 / 2 . If ω k = 1 / 2 , the two variables are tendentiously equal. It is obvious that if F 1 k = F 2 k , then ω k = 1 / 2 . However, ω k = 1 / 2 does not necessarily imply F 1 k = F 2 k . For example, assume X i 1 k has normal distribution with mean μ i k and standard deviation σ i k , for each i. It is easy to see that ω k = 1 2 , if and only if μ 1 k = μ 2 k , but F 1 k and F 2 k may have different standard deviations. Motivated by this, we consider a nonparametric hypothesis testing, about ω k ’s in the high-dimensional framework. The multivariate relative effect of interest combines all marginal effects, ω = ( ω 1 , , ω p ) . The global non-parametric hypothesis in terms of these relative effects is
H 0 : ω = 1 2 1 p .
A parametric hypothesis could be a special case of (2), e.g., for the multivariate normal distribution.
In this paper, we investigate nonparametric tests, for testing the hypothesis H 0 in high dimension. Our tests are applicable, even in situations where the variables are measured in binary, ordinal, and continuous scales, or a mixture of these. The main contributions are: (a) we construct a nonparametric test in high dimension. A composite of variable-by-variable univariate Wilcoxon–Mann–Whitney type tests of Brunner and Munzel [4] is proposed. We develop the asymptotic theory of the test statistics, without requiring any distributional assumption, moment condition, or parametric model. Motivated by Gregory et al. [19] and Zhang and Wang [20], two versions of the scaling parameter are constructed. (b) We provide an adaptive algorithm for the asymptotic variance estimation. (c) We have shown, with a simulation study, that the proposed tests have superior performance compared to existing methods, especially for heavy-tailed data, where the parametric tests are not applicable.
The remainder of the paper is organized as follows. We propose the rank-based-test statistic in Section 2. The asymptotic results for the test statistic and the results are used to construct hypothesis tests are stated in Section 3. The performance of the tests is investigated via simulation study in Section 4, together with the adaptive algorithm for selecting the banding window width. Finally, we will end the paper with some conclusions in Section 5. All technical details and proofs of lemmas are shifted to the Appendix A.

2. Test Statistic

2.1. Preliminaries

For any k { 1 , , p } , define the transformed variables Y 1 j k and Y 2 j k by
Y 1 j k = F 2 k ( X 1 j k ) for j { 1 , , n 1 } , and Y 2 j k = F 1 k ( X 2 j k ) , for j { 1 , , n 2 } .
Let Y i j = ( Y i j 1 , , Y i j p ) for i { 1 , 2 } and j { 1 , , n i } be a vector of the transformed variables. Note that Y i 1 , , Y i n i are iid, and the two samples { Y 1 j : j = 1 , , n 1 } and { Y 2 j : j = 1 , , n 2 } are, still, independent. Further, let Y ¯ i = ( Y ¯ i 1 , , Y ¯ i p ) and S i = ( S i k k ) k , k = 1 p be the sample mean vector and sample covariance matrix for the ith sample, where Y ¯ i k and S i k k (also denoted by S i k 2 ) are the sample mean and sample variance, respectively, of the k-th variable, and S i k k is the sample covariance between the k-th and k -th variables.
Note that Y i j k [ 0 , 1 ] and is a non-degenerate random variable. Moments of any order of Y i j k exist, and σ i k 2 = Var ( Y ijk ) > 0 . In particular,
E ( Y 1 j k ) = 1 ω k and E ( Y 2 j k ) = ω k .
The null hypothesis (2) is equivalent to the equality of mean vectors of Y 11 and Y 21 , i.e., ω = 1 p ω . The problem of testing equality of mean vectors has been, extensively, studied under the parametric and semiparametric contexts (see [1]). One of the test statistics that has received considerable attention for testing
H 0 : μ 1 = μ 2 against H 0 : μ 1 μ 2
is a composite statistic, formed by averaging the squared two-sample t-statistic over the p dimensions. More specifically,
T n = p 1 k = 1 p t k 2 , where t k = Y ¯ 2 k Y ¯ 1 k S 1 k 2 / n 1 + S 2 k 2 / n 2 .
Intuitively, this statistic quantifies the “total” separation between two groups, across all the dimensions.
To maintain an approximate balance between the two samples, we assume n 1 and n 2 have the same order of magnitude, i.e., n i / n λ i ( 0 , 1 ) as n 1 , n 2 . Further, to standardize T n in high dimension, various estimators for variance of T n have been proposed (e.g., [19,20,21]). Srivastava and Du [21] makes multivariate normality assumption, which was later, generalized, to a nonnormal situation by Srivastava et al. [22].
The test by Gregory et al. [19] assumed { t k 2 : k = 1 , , p } to be an α -mixing sequence and proposed the so-called Generalized Component Test (GCT) statistic, by normalizing T n  as
T GCT = p ( T n ξ ˜ n ) ζ ˜ n .
Two estimators of the centering parameter ξ ˜ n suitable for moderate-p and large-p were proposed. For moderate-p, more precisely p = o ( n 2 ) , the center estimator is ξ ˜ n = 1 . For large-p, specifically p = o ( n 6 ) , it was shown that E [ T n ] = 1 + n 1 a n + n 2 b n + O ( n 3 ) under some moment conditions and, thus, center estimator
ξ ˜ n = 1 + 1 n a ˜ n + 1 n 2 b ˜ n ,
was proposed, where the rather lengthy formulas for a ˜ n and b ˜ n can be found in their paper. The finite sample corrections in the second and third terms on the right-hand side of (5) guard against finite sample bias, from the large-sample approximation of the center. This bias could accumulate considerably, as the dimension p gets large. The scaling quantity ζ ˜ n was estimated by a smoothed version of the sample autocovariance function of { t k 2 : k = 1 , , p } as
ζ ˜ n = | r | < L w ( r / L ) γ ˜ ( r ) , where γ ˜ ( r ) = 1 p | r | k = 1 p | r | ( t k 2 T n ) ( t k + | r | 2 T n ) ,
where L is a user-selected window width, and w ( · ) is an even-weight function. Such weight functions are, commonly, used in spectral-density estimation (e.g., [23]) and satisfy w ( 0 ) = 1 , | w ( x ) | 1 for | x | 1 and w ( x ) = 0 for | x | > 1 . Two examples of smoothing weight functions that were used in Gregory et al. [19] are the Parzen window and the trapezoid window [24], defined by
w p ( r / L ) = 1 6 | r / L | 2 + 6 | r / L | 3 , if 0 | r | < L / 2 ; 2 1 | r / L | 3 , if L / 2 | r | L ; 0 if | r | > L ,
and
w t ( r / L ) = 1 , if 0 | r | < L / 2 ; 1 | r | L / 2 L L / 2 if L / 2 | r | L ; 0 if | r | > L ,
respectively, where L / 2 denotes the largest integer not exceeding L / 2 .
More recently, Zhang and Wang [20] proposed a more efficient scaling quantity and, therefore, a potentially more powerful test (MPT) statistic can be defined, by making α -mixing assumption on the original data. Denote σ i k k = C o v ( Y i 1 k , Y i 1 k ) and σ i k 2 = Var ( Y i 1 k ) for i { 1 , 2 } . Applying Lemma 2.1 of Zhang and Wang [20], it follows that C o v ( t k 2 , t k 2 ) = γ k k + O ( n 1 / 2 ) for any k , k { 1 , , p } , where
γ k k = 2 σ 1 k k / λ 1 + σ 2 k k / λ 2 2 σ 1 k 2 / λ 1 + σ 2 k 2 / λ 2 σ 1 k 2 / λ 1 + σ 2 k 2 / λ 2 .
Estimating σ i k k and σ i k 2 , by the sample covariance S i k k and sample variance S i k 2 , respectively, the quantity γ k k can be estimated by
γ ˜ k k = 2 S 1 k k / λ 1 + S 2 k k / λ 2 2 S 1 k 2 / λ 1 + S 2 k 2 / λ 2 S 1 k 2 / λ 1 + S 2 k 2 / λ 2 .
Note that the assumptions of the aforementioned Lemma 2.1, of Zhang and Wang [20], are automatically satisfied for Y i j k . Zhang and Wang [20] proposed the estimator of Var ( p T n )  as
τ ˜ n 2 = 1 p | k k | L γ ˜ k k ,
where L = p ϵ is a window width for some 0 < ϵ < 1 . The banded partial sum is intended to capture the important correlations among neighboring observations and facilitates consistent estimation of the asymptotic variance. Zhang and Wang [20] suggested selecting L = p 3 / 8 when p 300 for practical applications. Incidentally, they, also, noted from their simulation study that the type I error rate and power of GCT change, drastically, with varying window width. We will discuss more about window-width selection in Section 4. They, numerically, validated that the estimator τ ˜ n 2 provides an improvement over ζ ˜ n 2 , for scaling T n . An intuitive explanation is that τ ˜ n 2 makes use of the replications in the sample, directly, to reduce the variability.
The MPT statistic is, then, defined by normalizing T n as
T MPT = p ( T n ξ ˜ n ) τ ˜ n .
It was noted in Zhang and Wang [20] that both GCT and MPT yield liberal type I error rates, when using the large-p version of the centering parameter ξ ˜ n , given in (5). This happens, especially, in small n, which may be due to the fact that the third and fourth moments involved in the estimator ξ ˜ n , often, require large sample size to achieve a reasonable accuracy. Both Gregory et al. [19] and Zhang and Wang [20] proposed to reject null hypothesis with two-tailed rejection regions.
However, the transformed variables { Y i j k } are not observable and, thus, the test statistics T GCT or T MPT cannot be, directly, computed to test the nonparametric null hypothesis (2). Alternatively, the empirical distribution functions will be substituted in places of the distribution functions, to construct valid nonparametric tests. This strategy is investigated in detail in the next subsection.

2.2. Nonparametric Tests

In our approach, we seek rank-based estimates for the relative effects and use these estimates to construct a nonparametric test. To that end, define F ^ i k = 1 2 ( F ^ i k + + F ^ i k ) , where F ^ i k + and F ^ i k are the right- and left-continuous empirical distribution functions, respectively. More specifically, F ^ i k ( x ) = 1 n i j = 1 n i c ( x X i j k ) , where c ( u ) = 0 , 1 / 2 , or 1 according to u < 0 , u = 0 , or u > 0 . For k { 1 , , p } , define Y ^ 1 j k = F ^ 2 k ( X 1 j k ) for j { 1 , , n 1 } and Y ^ 2 j k = F ^ 1 k ( X 2 j k ) for j { 1 , , n 2 } .
It is natural to estimate the relative effects ω k , by replacing the distribution functions F i k with their empirical counterparts F ^ i k . That is,
ω ^ k = F ^ 1 k d F ^ 2 k = 1 n 2 j = 1 n 2 F ^ 1 k ( X 2 j k ) = 1 n 1 n 2 = 1 n 1 j = 1 n 2 c ( X 2 j k X 1 k ) ,
which is, actually, the sample mean of Y ^ 2 j k for k { 1 , , p } and can be computed in terms of component-wise ranks as [4],
ω ^ k = 1 n 1 n 2 j = 1 n 2 R 2 j k R j k ( 2 ) = 1 n 1 R ¯ 2 · k n 2 + 1 2 .
To see this, observe that Y ^ 2 j k = 1 n n i ( R 2 j k R j k ( 2 ) ) and j = 1 n i R j k ( i ) = n i ( n i 1 ) 2 , where R i j k refers to the (mid-)rank of X i j k among all n observations of the k-th variable within the two samples, R j k ( i ) refers to the (mid-)rank of X i j k , among the n i observations of the k-th variable, within sample i, and R ¯ i · k = 1 n i j = 1 n i R i j k . More precisely, R i j k = n 1 F ^ 1 k ( X i j k ) + n 2 F ^ 2 k ( X i j k ) + 1 / 2 and R j k ( i ) = n i F ^ i k ( X i j k ) + 1 / 2 .
Note that ω ^ k is the Wilcoxon–Mann–Whitney-type U-statistic. It is well known that, even in the presence of ties, the estimator ω ^ k is L 2 -consistent for ω k , under the asymptotic framework that n 1 and n 2 diverge proportionally [4,17]. It is, also, well known that, under the same asymptotic framework, n ( ω ^ k ω k ) / σ k has, asymptotically, a standard normal distribution, N ( 0 , 1 ) , where σ k 2 = n ( σ 1 k 2 / n 1 + σ 2 k 2 / n 2 ) (see, also, Theorem 2 of [6]). An L 2 -consistent rank-based estimator for σ k 2 can be constructed, as given in Brunner and Munzel [4]
σ ^ k 2 = n ( σ ^ 1 k 2 / n 1 + σ ^ 2 k 2 / n 2 ) ,
where
σ ^ i k 2 = 1 ( n n i ) 2 ( n i 1 ) j = 1 n i R i j k R j k ( i ) R ¯ i · k + n i + 1 2 2
is the sample variance of Y ^ i j k for j { 1 , , n i } . Thus, it follows, immediately, from Slutsky’s theorem that n ( ω ^ k ω k ) / σ ^ k has, asymptotically, a standard normal distribution, N ( 0 , 1 ) . Some of these results are summarized in Lemmas A1–A7 of Appendix A.
Under the null hypothesis (2), denote
t ^ k = n ( ω ^ k 1 / 2 ) / σ ^ k .
Obviously, t ^ k and t k have the same asymptotic distribution under the null hypothesis (2). In the following Lemma, the mean of t ^ k 2 is given, up to the order of n 1 .
Lemma 1.
Assume lim n n i / n λ i ( 0 , 1 ) for i = 1 , 2 and min { σ 1 k 2 , σ 2 k 2 } > 0 , for all k { 1 , , p } . Then, under H 0 , E ( t ^ k 2 ) = 1 + O ( n 1 ) , for any k { 1 , , p } . Moreover, sup k E [ t ^ k 2 r ] < , for any integer r > 1 .
The covariance of t ^ k 2 and t ^ k 2 , for any k , k { 1 , , p } , are given up to the order of n 1 / 2 , in Lemma 2. It is shown that the covariance Cov t ^ k 2 , t ^ k 2 shares the same dominating term as Cov ( t k 2 , t k 2 ) .
Lemma 2.
Assume lim n n i / n λ i ( 0 , 1 ) for i = 1 , 2 and min { σ 1 k 2 , σ 2 k 2 } > 0 for all k { 1 , , p } . Then, under H 0 , Cov t ^ k 2 , t ^ k 2 = γ k k + O ( n 1 / 2 ) , for any k , k { 1 , , p } , where γ k k is defined in (7).
The core component of our test is the composite statistic
T ^ n = 1 p k = 1 p t ^ k 2 .
The motivation behind this construction is that in many high-dimensional applications, e.g., transcriptomics, the effect on any individual variable (gene expression) may be small, and composite statistics will have high power in detecting the cumulative effect. To develop a test statistic for testing the null hypothesis (2), based on (11), there are two options for scaling T ^ n . One is replacing t k by t ^ k in (6), i.e., define
ζ ^ n = | r | < L w ( r / L ) γ ^ ( r ) , where γ ^ ( r ) = 1 p | r | k = 1 p | r | ( t ^ k 2 T ^ n ) ( t ^ k + | r | 2 T ^ n ) ,
and employ similar results, as in Gregory et al. [19]. The other option is using a scale similar to (8) and define
τ ^ n 2 = 1 p | k k | L γ ^ k k , where γ ^ k k = 2 σ ^ 1 k k / λ 1 + σ ^ 2 k k / λ 2 2 σ ^ 1 k 2 / λ 1 + σ ^ 2 k 2 / λ 2 σ ^ 1 k 2 / λ 1 + σ ^ 2 k 2 / λ 2 ,
σ ^ i k 2 is the L 2 -consistent estimator for σ i k 2 , defined in (10), and σ ^ i k k is the L 2 -consistent estimator of σ i k k , defined by (see Lemma A8),
σ ^ i k k = 1 ( n n i ) 2 ( n i 1 ) j = 1 n i R i j k R j k ( i ) R ¯ i · k + n i + 1 2 R i j k R j k ( i ) R ¯ i · k + n i + 1 2 ,
which is the sample covariance of Y ^ i j k and Y ^ i j k for j { 1 , , n i } . The comparison of the two scaling parameters is investigated, numerically, in Section 4. The main difference between these two scaling quantities given in (12) and (13) is that (13) uses the data more efficiently and, hence, is expected to enhance the power of the test. The window width can be, similarly, set as L = p ϵ , for some 0 < ϵ < 1 , as for MPT. However, the choice of ϵ should depend not only on the dimension p but also on the underlying distribution of the data. It can be seen from the simulation that there is no fixed number ϵ , for which the window width L = p ϵ works for all models. Thus, we provide an algorithm in Section 4 for choosing L, for use in practice.
For the moderate-p setting, specifically p = o ( n 2 ) , we propose the test statistic analogous to (4) and (9) as
T ^ GCT : = p ( T ^ n 1 ) ζ ^ n and T ^ MPT : = p ( T ^ n 1 ) τ ^ n .
In the large-p setting, the center (5) computed in terms of Y ^ i j k may be used. However, as stated in Zhang and Wang [20], using the large-p center estimator tends to give liberal type I error rates.

3. Main Results

For a sequence of random variables { Z k : k = 1 , 2 } , define the mixing coefficient α ( r ) as
α ( r ) = sup k 1 | P ( A B ) P ( A ) P ( B ) | : A F 1 k , B F k + r ,
for r = 1 , 2 , , where F a b = σ { Z k : a k b } denotes the σ -field generated by the random variables Z a , , Z b . Here, α ( r ) measures the dependency among the components that are at least r indices apart. A sequence of random variables is α -mixing (strong-mixing), if the mixing coefficient α ( r ) goes to 0 as r goes to infinity. The α -mixing condition assumed on the sequence { Z k : k = 1 , , p } , basically, requires the dependence between two observations to decay, as the separation between the observations (r) increases. It prescribes weak dependence among the components of the random vector, which is commonly assumed in time-series analysis, repeated measures, or some other types of data. Two-sample tests on α -mixing sequence random variables were considered by many authors ([14,15,19,20,25,26,27], etc.).
To derive the asymptotic distribution of T ^ n and construct a test statistic, we require the following assumptions that are analogous to Zhang and Wang [20].
C1:
For any i { 1 , 2 } and j { 1 , , n i } , the sequence { X i j k : k = 1 , , p } has a mixing coefficient α ( r ) , which satisfies r = 1 r [ α ( r ) ] ν / ( 2 + ν ) < , for some ν > 0 .
C2:
For any i { 1 , 2 } , j { 1 , , n i } and k { 1 , , p } , X i j k F i k is non-degenerate.
C3:
lim n n i / n λ i ( 0 , 1 ) for i = 1 , 2 where n = n 1 + n 2 .
Remark 1.
Similar to Zhang and Wang [20], a sufficient condition for r = 1 r [ α ( r ) ] ν / ( 2 + ν ) < in C1 is α ( r ) = O ( r c ) , for some c > 2 + 4 / ν . It provides a condition on the mixing coefficient α ( r ) on r, for a given ν > 0 ; if satisfied, the window width L is not required in the proof of the consistency of the estimator for the scaling parameter, see Theorem 2.
Applying the Theorem 5.2 of Bradley [28] to the marginal distribution function F i k , which is a Borel function with a single argument, the α -mixing assumption on the original sequence { X i j k : k = 1 , , p } will be inherited by the transformed sequence { Y i j k , k = 1 , , p } , with the same mixing coefficient. Under condition C1, the sequence of squared t-statistics derived from { X i j k } is an α -mixing process, with the same mixing coefficient α ( r ) , by Lemma III.3 in the Supplementary Material of Zhang and Wang [20], so the sequence derived from { Y i j k } . Strictly speaking, the mixing coefficients of the two samples are not required to be equal. Condition C1 can be stated in terms of the maximum of the two coefficients from the two samples. Note that squared Wilcoxon–Mann–Whitney-type statistic t ^ k 2 , derived from { Y ^ i j k } , is actually defined through basic arithmetic operations on the Borel functions c ( X 2 j k X 1 k ) for = 1 , , n 1 , and j = 1 , , n 2 . Thus, t ^ k 2 can be viewed as a Borel function h k of the n observations on the k-th variable, i.e.,
t ^ k 2 = h k ( X 11 k , , X 1 n 1 k , X 21 k , , X 2 n 2 k ) .
Therefore, along the same arguments as in Zhang and Wang [20], the sequence { t ^ k 2 : k = 1 , , p } is α -mixing with the same coefficient α ( r ) , under condition C1. The asymptotic distribution of T ^ n is, then, established in Theorem 1.
Theorem 1.
Suppose { X i j k : k = 1 , , p } for any i { 1 , 2 } and j { 1 , , n i } are sequences of random variables satisfying conditions C1, C2, and C3. Then, under H 0 ,
p ( T ^ n E [ T ^ n ] ) Var ( p T ^ n ) d N ( 0 , 1 ) , as n , p .
Proof. 
Under conditions C1, C2, and C3, the sequence { t ^ i k 2 , k = 1 , . . . , p } has the same α -mixing property as { t i k 2 ; k = 1 , . . . , p } . Moment conditions that are analogous to those in Theorem 2.2 of Zhang and Wang [20] are satisfied by Lemmas 1 and 2. Therefore, the remainder of the proof follows, along the same lines.    □
Remark 2.
As pointed out earlier, asymptotic normality of T n was argued in Gregory et al. [19], without proof under different conditions. Similar arguments could be made here, to have asymptotic normality of T ^ n . Besides the α-mixing condition on the { t ^ k 2 : k = 1 , , p } and conditions C2 and C3, it is, additionally, required that the autocovariance function of the sequence { t ^ k 2 : k = 1 , , p } satisfies lim n 1 p r k = 1 p r Cov ( t ^ k 2 , t ^ k + r 2 ) = γ ( r ) , for each lag r > 0 . Other conditions assumed in Gregory et al. [19] are, automatically, satisfied in our setup.
The central limit theorem stated above involves centering E ( T ^ n ) and scaling Var ( p T ^ n ) parameters. In both statistics T ^ G C T and T ^ M P T , the centering parameter ξ ˜ n is set to 1, whereas the scaling parameter Var ( p T ^ n ) is estimated by ζ ^ n and τ ^ n , respectively. If the estimators for the scaling parameter are consistent, then the asymptotic normality of T ^ G C T and T ^ M P T follow from Slutsky’s theorem. In Lemma 3, the consistency of γ ^ k k is proven and, subsequently, in Theorem 2, the consistency of τ ^ n is established.
Lemma 3.
Suppose { X i j k : k = 1 , , p } for any i { 1 , 2 } and j { 1 , , n i } are sequences of random variables satisfying conditions C1, C2, and C3. Then, under H 0 , γ ^ k k = γ k k + O p ( n 1 / 2 ) , for any k , k { 1 , , p } , where γ k k and γ ^ k k are as defined in (7) and (13), respectively.
Theorem 2.
Suppose { X i j k : k = 1 , , p } for any i { 1 , 2 } and j { 1 , , n i } are sequences of random variables satisfying conditions, C1, C2, and C3. Assume L = p ϵ , for some 0 < ϵ < 1 . Then, under H 0 and for τ ^ n , defined in (13),
τ ^ n 2 Var ( p T ^ n ) = O p ( n 1 / 2 ) + O ( L 1 ) , as n , p .
Further, if α ( r ) = O ( r c ) , for some c > 1 , then
τ ^ n 2 Var ( p T ^ n ) = O p ( n 1 / 2 ) + O ( p 1 c ν / ( 2 + ν ) ) ,
for some ν > 2 / ( c 1 ) as n , p .
Proof. 
Similar to the proof of Theorem 2.5 of Zhang and Wang [20],    □
The asymptotic distribution of the test statistic T ^ MPT is stated in Corollary 1.
Corollary 1.
Suppose { X i j k : k = 1 , , p } for any i { 1 , 2 } and j { 1 , , n i } are sequences of random variables satisfying conditions C1, C2, and C3. Then, under H 0 and p = o ( n 2 ) ,
T ^ MPT = p ( T ^ n 1 ) τ ^ n d N ( 0 , 1 ) , as n , p ,
where τ ^ n is as defined in (13) and L = p ϵ for some 0 < ϵ < 1 .
Proof. 
The consistency of τ ^ n is stated in Theorem 2. By Lemma 1, E ( t ^ k 2 ) = 1 + O ( n 1 ) . Therefore,
p ( E [ T ^ n ] 1 ) ] = p p i = 1 p ( E [ t ^ k 2 ] 1 ) = o ( 1 ) , when p = o ( n 2 ) .
The desired result follows from Theorem 1, by applying Slutsky’s theorem.    □
Under the assumptions discussed in Remark 2, the sample autocovariance γ ^ ( r ) is consistent for γ ( r ) . Therefore, the consistency of ζ ^ n follows, if a suitable window width L is chosen. Consequently, one can establish the asymptotic distribution of the statistic T ^ G C T as
T ^ GCT = p ( T ^ n 1 ) ζ ^ n d N ( 0 , 1 ) , as n , p ,
where ζ ^ n is defined in (12) for either of the Parzen or trapezoid-window-weight function w ( · ) . To be consistent, one may choose the same window width L as in Corollary 1. It was noted in Zhang and Wang [20] that GCT’s estimate of scaling parameter does not, effectively, use the sample replications, as they rely on a single term ( t ^ k 2 T ^ n ) ( t ^ k 2 T ^ n ) . This might be a negative number, while Cov ( t ^ k 2 , t ^ k 2 ) has been proven to be positive. Instead, MPT’s estimate of the scaling parameter benefits from both increasing the number of replications and the dimension. Thus, MPT’s estimate is likely to produce more stable and consistent results over different samples, while the GCT’s estimate could vary drastically. From the simulation study in Section 4, we can see features from the two proposed ranked-version tests, referred to as RGCT and RMPT, respectively.
Both Gregory et al. [19] and Zhang and Wang [20] proposed to use a two-tailed rejection region. However, we believe that the hypothesis H 0 should be rejected, when T n or T ^ n is large. That means a one-tailed rejection region should be used. The numerical results are shown in Figure 1, Figure 2, Figure 3, Figure 4 and Figure 5.

4. Simulation

4.1. Simulation Design

The aim of this section is to compare the proposed rank-based tests RGCT and RMPT (for testing the hypothesis (2)), with their parametric versions GCT and MPT (for testing the hypothesis of equality of two mean vectors), through Monte Carlo simulation. As we explained before, we use the moderate-p version statistics for all four tests. We employ one-tailed rejection regions and Parzen window weight for GCT and RGCT, and two-tailed rejection regions for MPT and RMPT. In order to allow correct interpretation of the powers vis-à-vis the achieved sizes, the empirical type I error rates as well as powers of these tests are presented in Figure 2, Figure 3 and Figure 4. Throughout, the sizes and powers are calculated through 2000 replications, and the actual level of significance is set at α = 0.05 . The proportion of rejections, out of the 2000 runs, is recorded. We will investigate the effects of window width and the influence of dimensionality under various dependence structures and innovation distributions, while some of them may violate the model assumption C1 or moment assumptions stated in Gregory et al. [19] or Zhang and Wang [20].
The two groups are always independent, and the dependency only exists within the same subject. More precisely, for any i { 1 , 2 } and j { 1 , , n i } , we generate data as
X i j k = μ i k + ε i j k ,
for k { 1 , , p } , where μ i k is a constant and { ε i j k : k = 1 , , p } is the error process. Let μ i = ( μ i 1 , , μ i p ) . Under the null hypothesis, we set μ 1 = μ 2 = 0 p . Under the alternative hypothesis, let μ 1 = 0 p and 0 < β 1 be the proportion of nonzero elements in μ 2 . We set the p β / 2 elements of μ 2 to δ , the next p β / 2 elements to δ , and the remaining p p β elements to 0, i.e.,
μ 2 = ( δ , , δ β p / 2 , δ , , δ β p / 2 , 0 , , 0 1 β p ) .
Four distributions for the innovation ε i j k are considered,
Normal:
standard normal distribution Normal (0, 1);
T:
t distribution with degrees of freedom 3;
Gamma:
centered Gamma distribution with shape parameter 4 and scale parameter 2;
Cauchy:
Cauchy (0, 0.1) distribution.
Here, standard normal distribution serves as a benchmark; the t distribution is used to assess how the tests perform, when the higher-order moment conditions are violated of GCT and MPT; and the gamma and Cauchy distributions allow to evaluate robustness to skewed and heavy-tailed data, respectively. We will consider independent and three dependent error processes, but, otherwise, the errors in the two groups are generated by the same process.
IND
(independent): ε i j k is independently drawn from the innovation distribution for k = 1 , , p .
WD
(weakly dependent): ε i j k is generated, according to ARMA(2, 2), with autoregressive parameter ϕ = ( 0.4 , 0.1 ) and moving-average parameters ϑ = ( 0.2 , 0.3 ) .
SD
(strongly dependent): ε i j k is generated, according to AR(1), with autoregressive parameters ϕ = 0.9 .
LD
(long-range dependent): Let A = ( a s t ) s , t = 1 p , where a s t = 0.5 [ ( r + 1 ) 2 H + ( r 1 ) 2 H 2 r 2 H ] , for constant self-similarity parameters H = 0.7 and r = | s t | . Decompose A by Cholesky factorization, to get the matrix U, such that A = U U . Independently, draw η i j k from the innovation distribution for k = 1 , , p . Let η i j = ( η i j 1 , , η i j p ) and set ε i j = ( ε i j 1 , , ε i j p ) = U η i j .
The long-range dependent process is generated, following the approach proposed by Hall et al. [29]. It was mentioned in Zhang and Wang [20] that the correlation for each of the four setups tends to 0, when the lag separation between the two components goes to infinity. However, the decaying speed of LD is that the correlation converges to 0 at the rate O ( r 2 ( 1 H ) ) (see [30]), which is much slower than the ARMA model. The condition for mixing coefficients C1 holds for the IND, WD, and SD models but not for the LD model. Thus, including the LD error process in the simulation helps us to evaluate the robustness of the tests, against the assumed dependence regularity.

4.2. Adaptive Selection of Window Width L
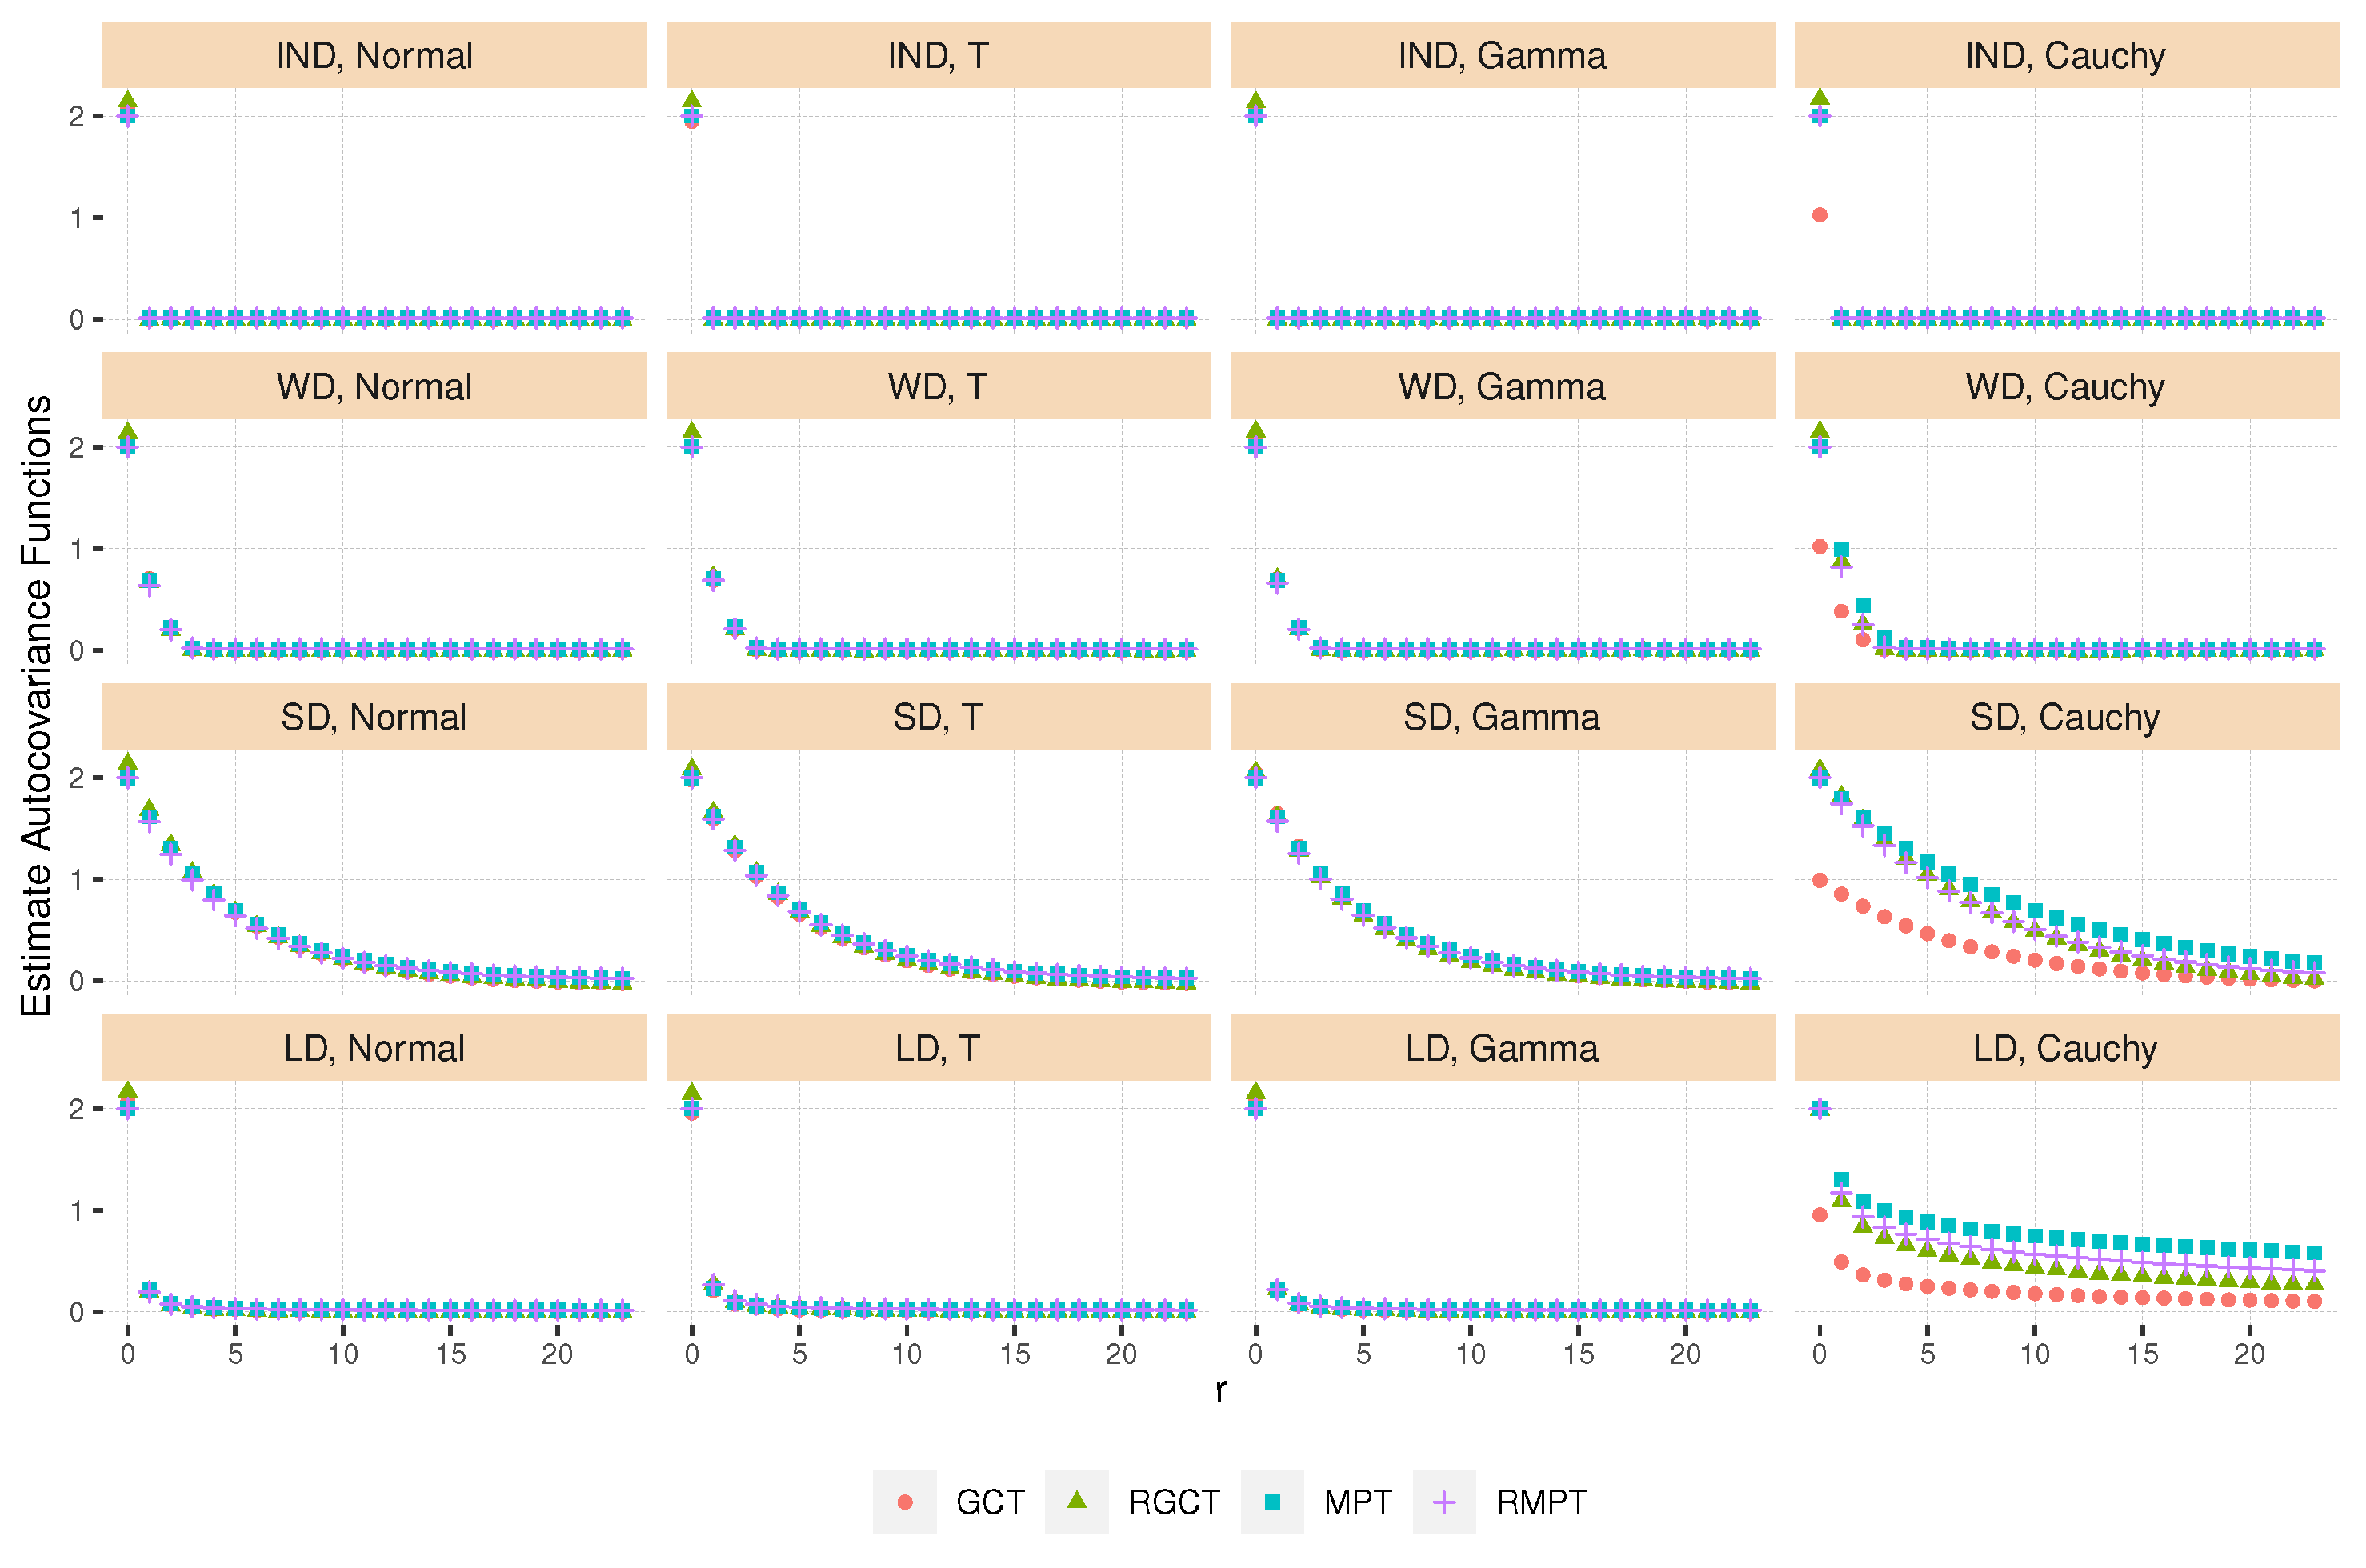
To compare the two estimators of the scaling parameter, estimated autocovariance of the sequence { t ^ k 2 : k = 1 , , p } at lags r = 0 , 1 , , L , i.e., γ ^ ( r ) for RGCT and 1 p k k = r γ ^ k k for RMPT are displayed in Figure 1, together with the parametric versions for GCT and MPT, on the original data. Estimates are averages over 2000 runs at each lag r, with dimension p = 500 , sample size n 1 = 80 , n 2 = 100 , and for L = 500 1 / 2 23 . The four estimates are very close, except for LD and SD Cauchy. The similarity of the estimates verifies that the mixing structures of the sequence of squared t-statistics, derived from the original data and the rank-transformed data, are about the same. It, also, shows that the decaying speeds are not only related to the error processes but also to the innovation distributions. Thus, there does not appear to exist a fixed number ϵ , such that the window-width choice L = p ϵ works, reasonably, for all data.
Figure 1. The estimates of the autocovariance function at varying lags r = 0 , 1 , , L , from 2000 simulation runs. We set n 1 = 80 , n 2 = 100 , and p = 500 .
Symmetry 14 01153 g001
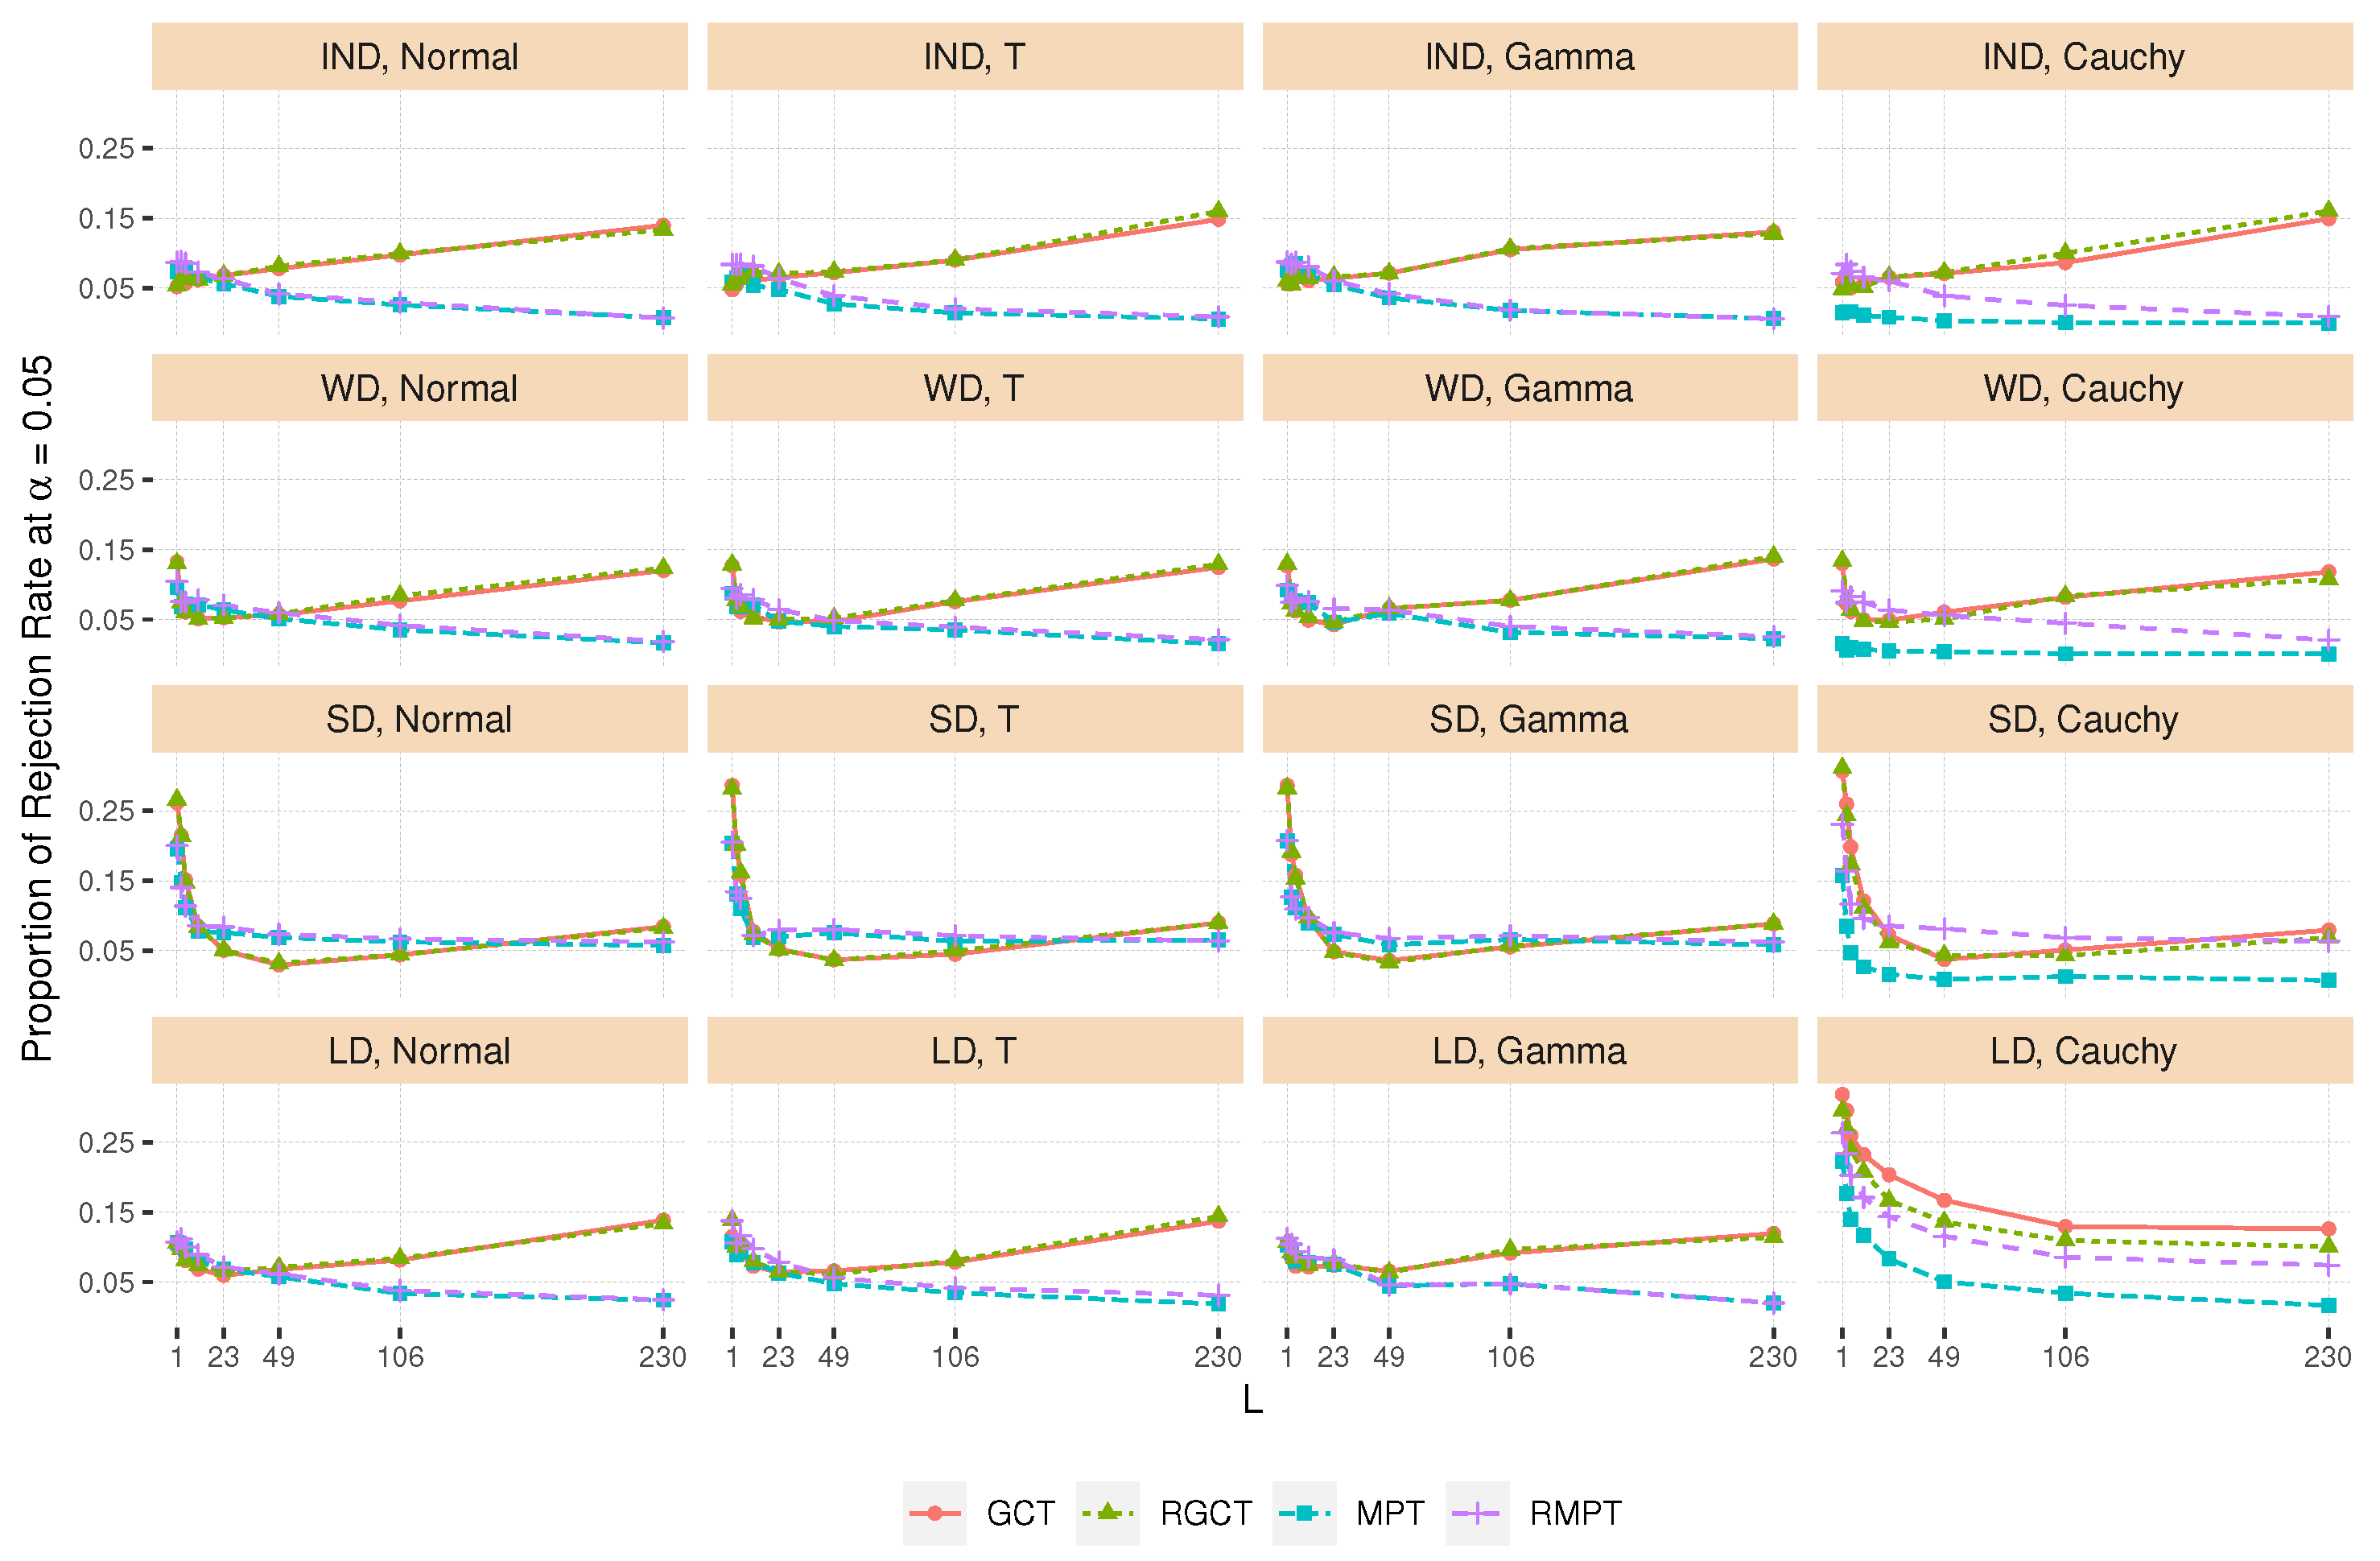
To illustrate the sensitivity to the choice of the window width, Figure 2 reports a type I error rate, by setting the dimension p = 500 and sample sizes n 1 = 80 and n 2 = 100 . A sequence of values, L = p ϵ , for ϵ = i / 8 , and i = 0 , 1 , , 7 , i.e., L = 1 , 3 , 5 , 11 , 23 , 49 , 106 , 230 , are experimented. It can be, clearly, seen from the plots that all four tests are sensitive to the window width. MPT and RMPT exhibit a slightly decreasing trend of the type I error rate, while the trends of GCT and RGCT are not monotonic if the data are dependent. When the window gets wider, the type I errors of MPT and RMPT tend to be conservative, while GCT and RGCT have more rejections. Especially, if the data are strongly or long-range dependent, a wider window width is needed, to capture more correlations, but if the data are less dependent, a wider window width may include more noise, such that the scaling parameters of GCT and RGCT will be underestimated, while those for MPT and RMPT are overestimated.
Figure 2. The empirical type I errors at level α = 0.05 from 2000 simulation runs, for varying window widths L = ( 1 , 3 , 5 , 11 , 23 , 49 , 106 , 230 ) . We set n 1 = 80 , n 2 = 100 , and p = 500 .
Symmetry 14 01153 g002
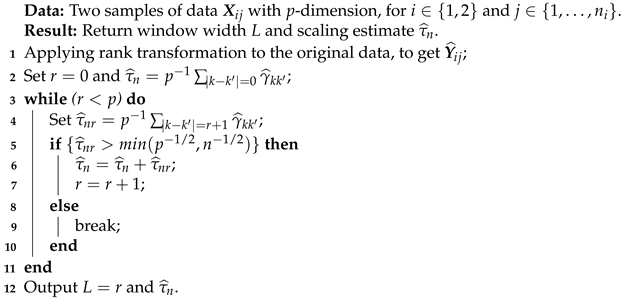
Thus, instead of using a window width L = p ϵ , for a fixed ϵ , we provide the following algorithm to select L for RMPT. According to Lemma 2, Cov ( t ^ k 2 , t ^ k 2 ) = γ k k + O ( n 1 / 2 ) . Since it was assumed that p = o ( n 2 ) and p > n , usually, holds in real data application, we choose the window width L to be the smallest r, such that p 1 | k k | = r + 1 γ ^ k k is less than p 1 / 2 . In the case of n < p , the bound can be replaced with n 1 / 2 . From Figure 1, the decaying speed of RGCT and RMPT are about the same. So, we may choose L + 1 to be the window width for RGCT. The extra one is, actually, not used, since the weight w p ( L / L ) = 0 . Note that we do not use γ ^ ( r ) as the selection criterion, since it relies only on a single unstable term and does not take advantage of the sample replications. Applying this algorithm to the original data (removing step 1 in Algorithm 1), we can obtain a window width L for MPT and, then, L + 1 could be used as a window width for GCT. For all the remaining simulations and applications, we will use this algorithm to determine the window width.
Algorithm 1: Data adaptive window width selection
Symmetry 14 01153 i001

4.3. Type I Error Rate

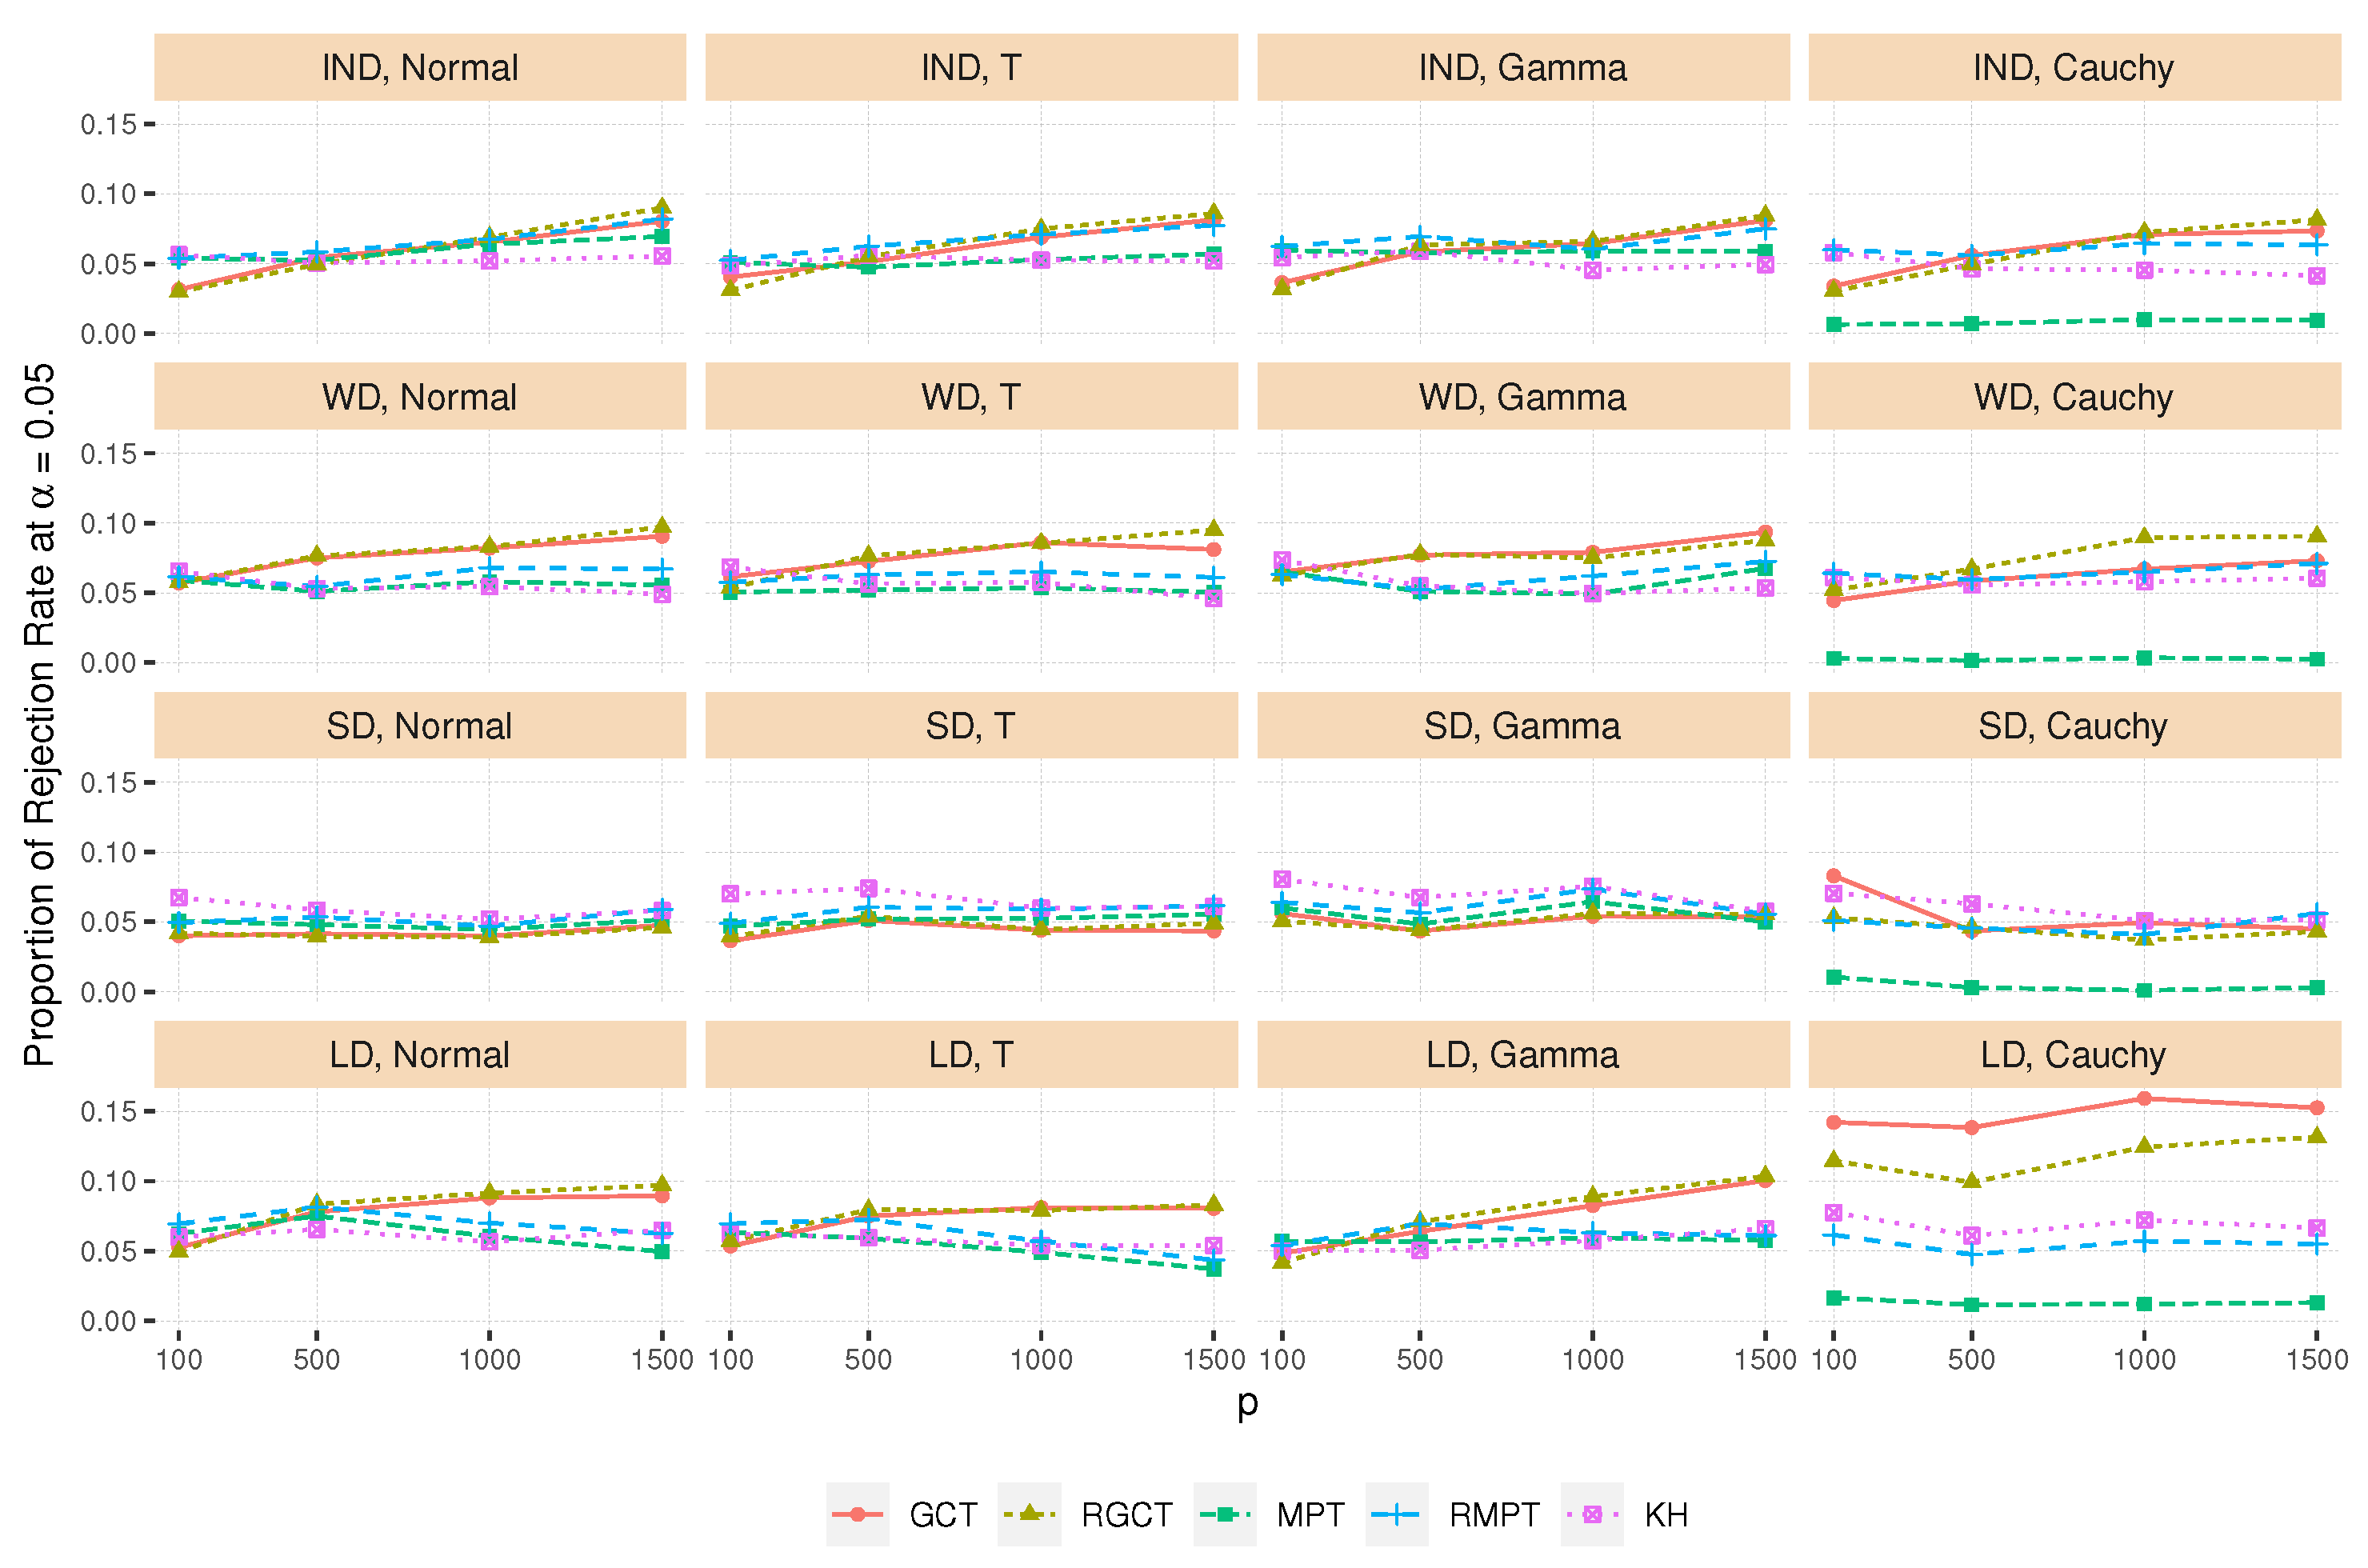
The effect of dimensionality is investigated in Figure 3, by considering p = 100, 500, 1000, and 1500, for fixed sample sizes n 1 = 80 and n 2 = 100 . In addition, a two-sample rank-based test, given in Kong and Harrar [15] (referred to as KH), is included, always with the other four tests, although it tests the overall relative effects. From Figure 3, MPT tends to be conservative for Cauchy innovations. That is reasonable, since the moments of Cauchy distribution do not exist. When the dimension gets larger, some inflated type I errors for GCT and RGCT are observed, especially for LD dependence that violates condition C1. Test KH has a few inflated type I errors, under SD dependence. Speaking overall, RMPT always has a type I error rate close to the nominal level, which also confirms that the window width was selected well.
Figure 3. The empirical type I errors at level α = 0.05 from 2000 simulation runs, for varying dimensions p = 100 , 500 , 1000 , and 1500, with n 1 = 80 and n 2 = 100 . Window widths are calculated from Algorithm 1.
Symmetry 14 01153 g003

4.4. Power Comparison

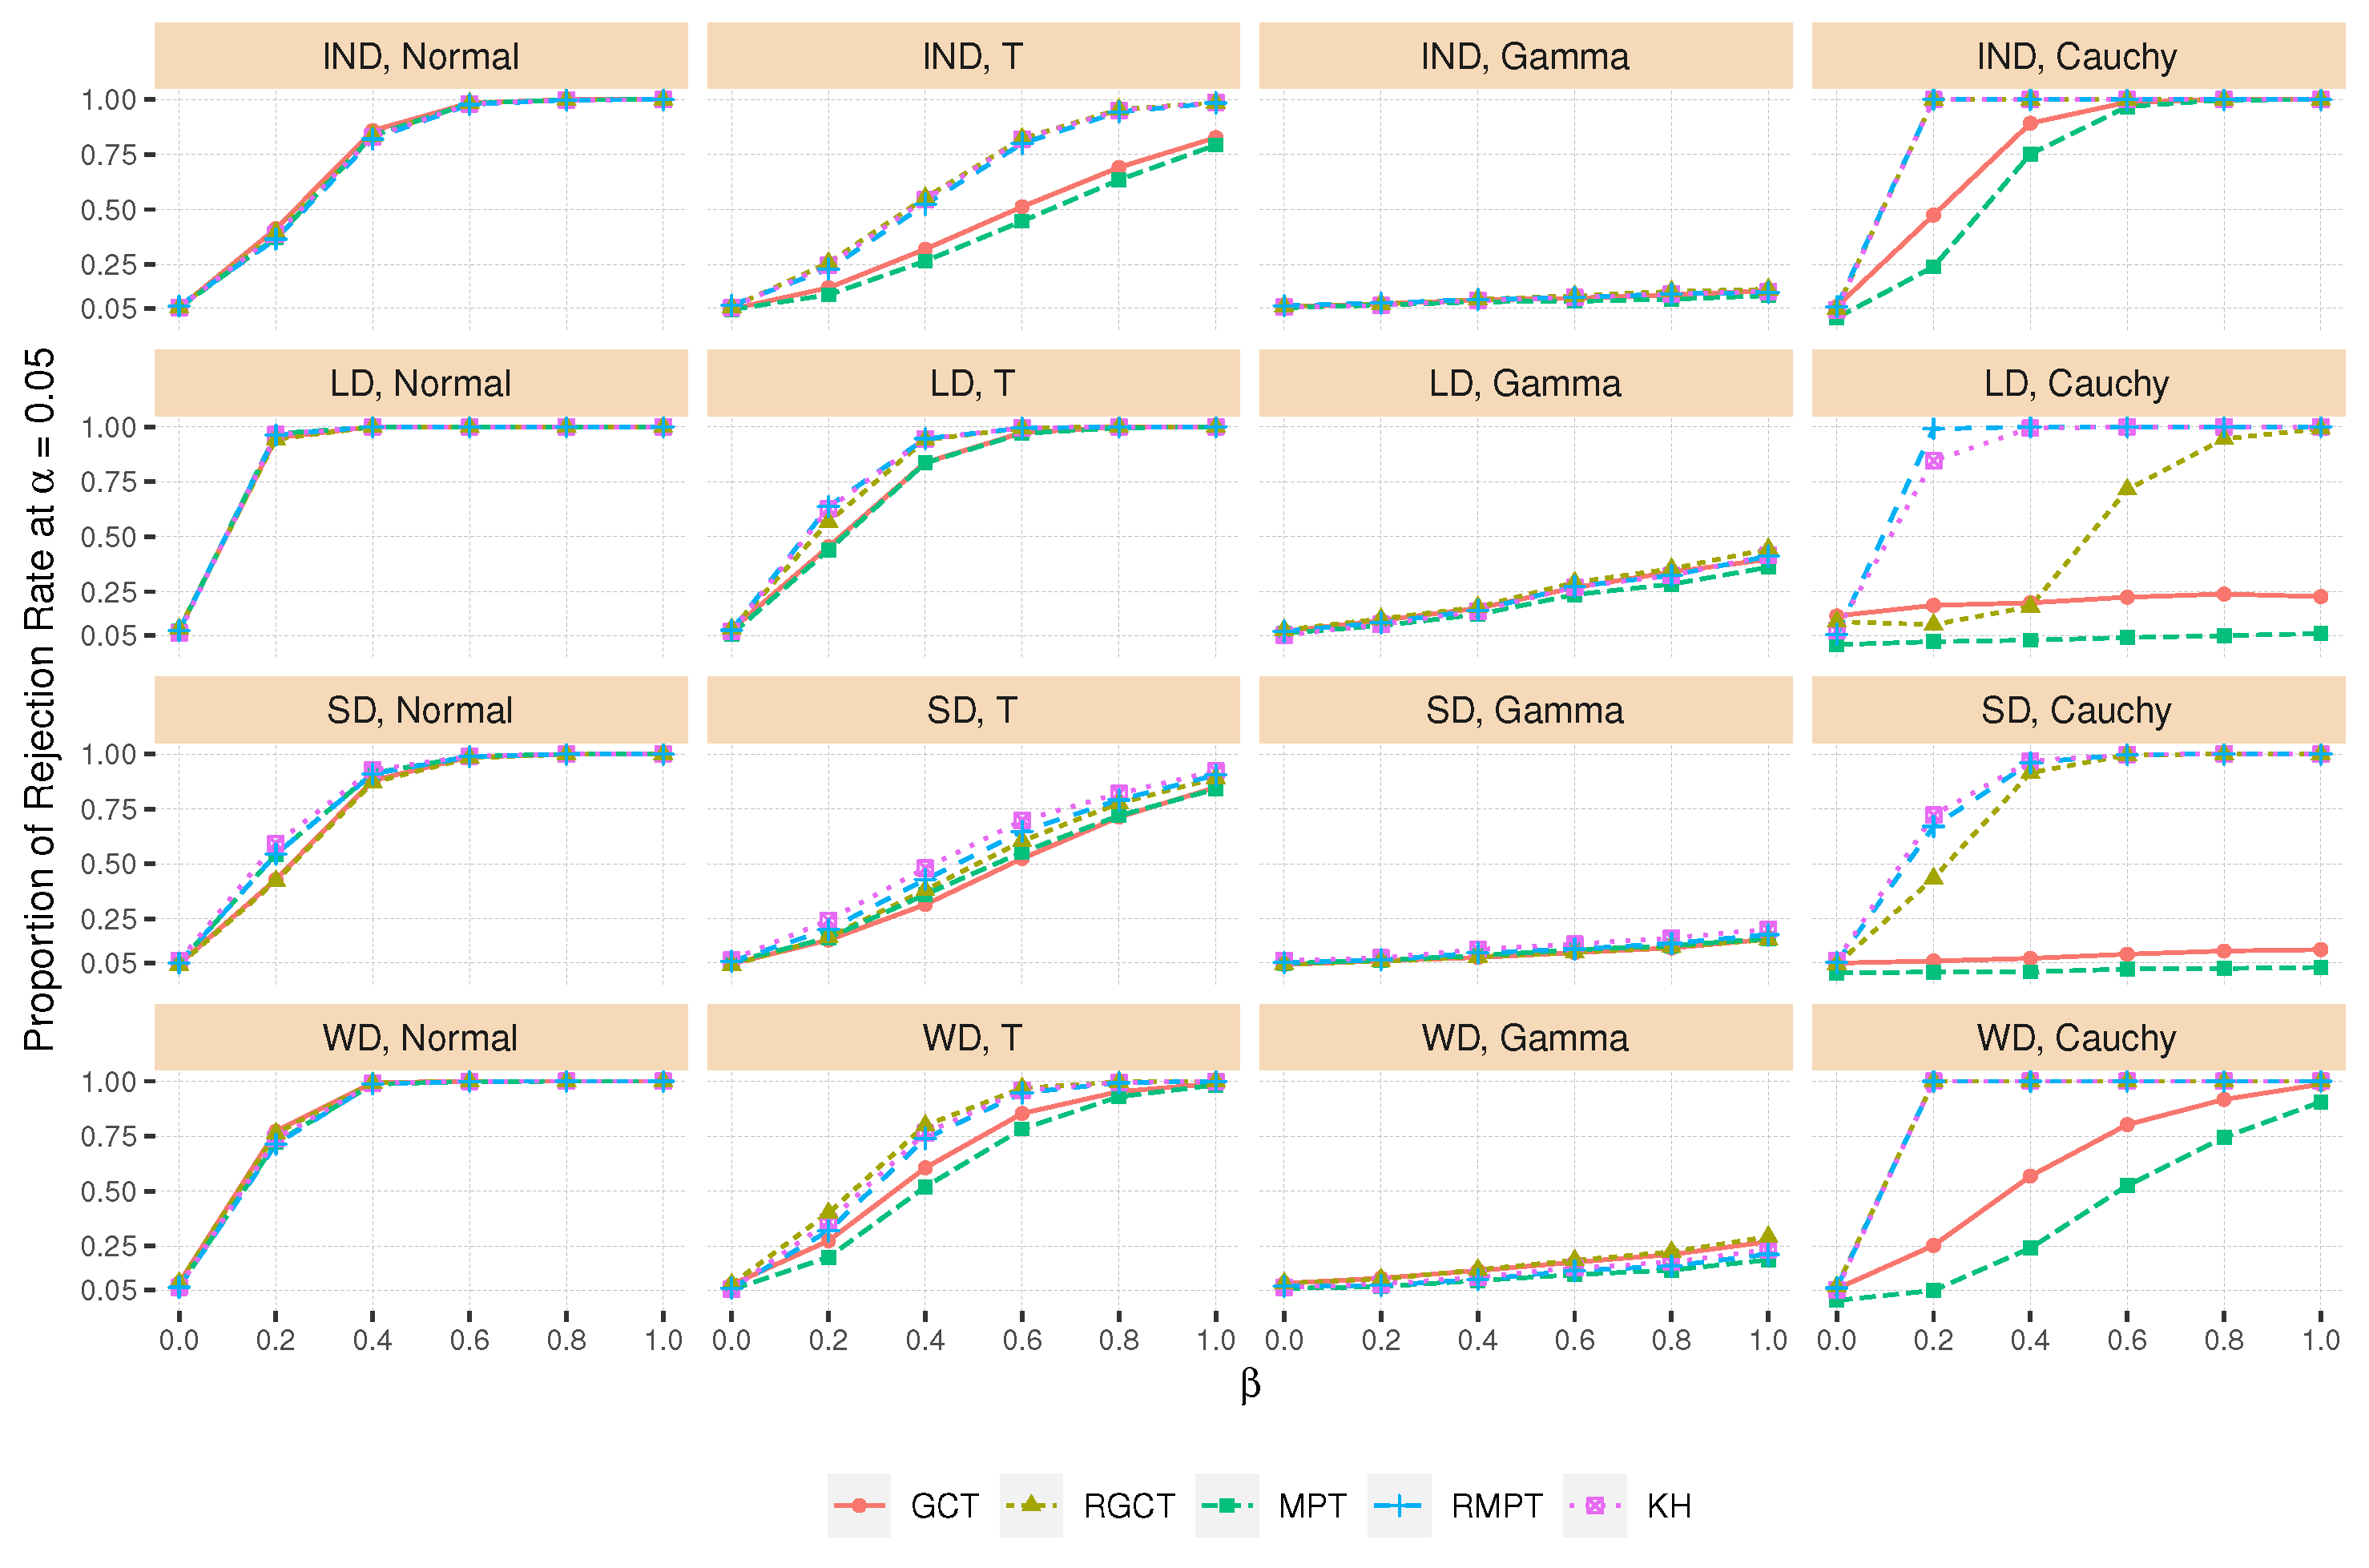
For power comparison, we fix dimension p = 500 and sample sizes n 1 = 80 and n 2 = 100 . We plot the powers of the tests against β { 0 , 0.2 , 0.4 , 0.6 , 0.8 , 1 } . The signal magnitude δ is chosen as follows: δ = 0.1 for IND, 0.2 for LD and WD, and 0.5 for SD. As shown in Figure 4, there is a clear advantage of the rank tests RGCT and RMPT, for heavily tailed distributions, such as Cauchy, while GCT and MPT tend to be conservative, under correlated error processes. This is expected, because the model violates most of the moment assumptions needed for the theoretical results of GCT and MPT. All five tests are comparable in terms of power, for the other innovation distributions. Notably, they all have low power under centered Gamma innovation, increasing signal magnitude δ , which is needed for obtaining higher power.
Figure 4. The empirical rejection frequencies at nominal level α = 0.05 from 2000 simulation runs for varying β = ( 0 , 0.2 , 0.4 , 0.6 , 0.8 , 1 ) . Fix p = 500 , n 1 = 80 , and n 2 = 100 , and window widths are calculated from Algorithm 1. The signal magnitude δ = 0.1 for IND, 0.2 for LD and WD, and 0.5 for SD.
Symmetry 14 01153 g004

4.5. One-Tailed versus Two-Tailed Tests
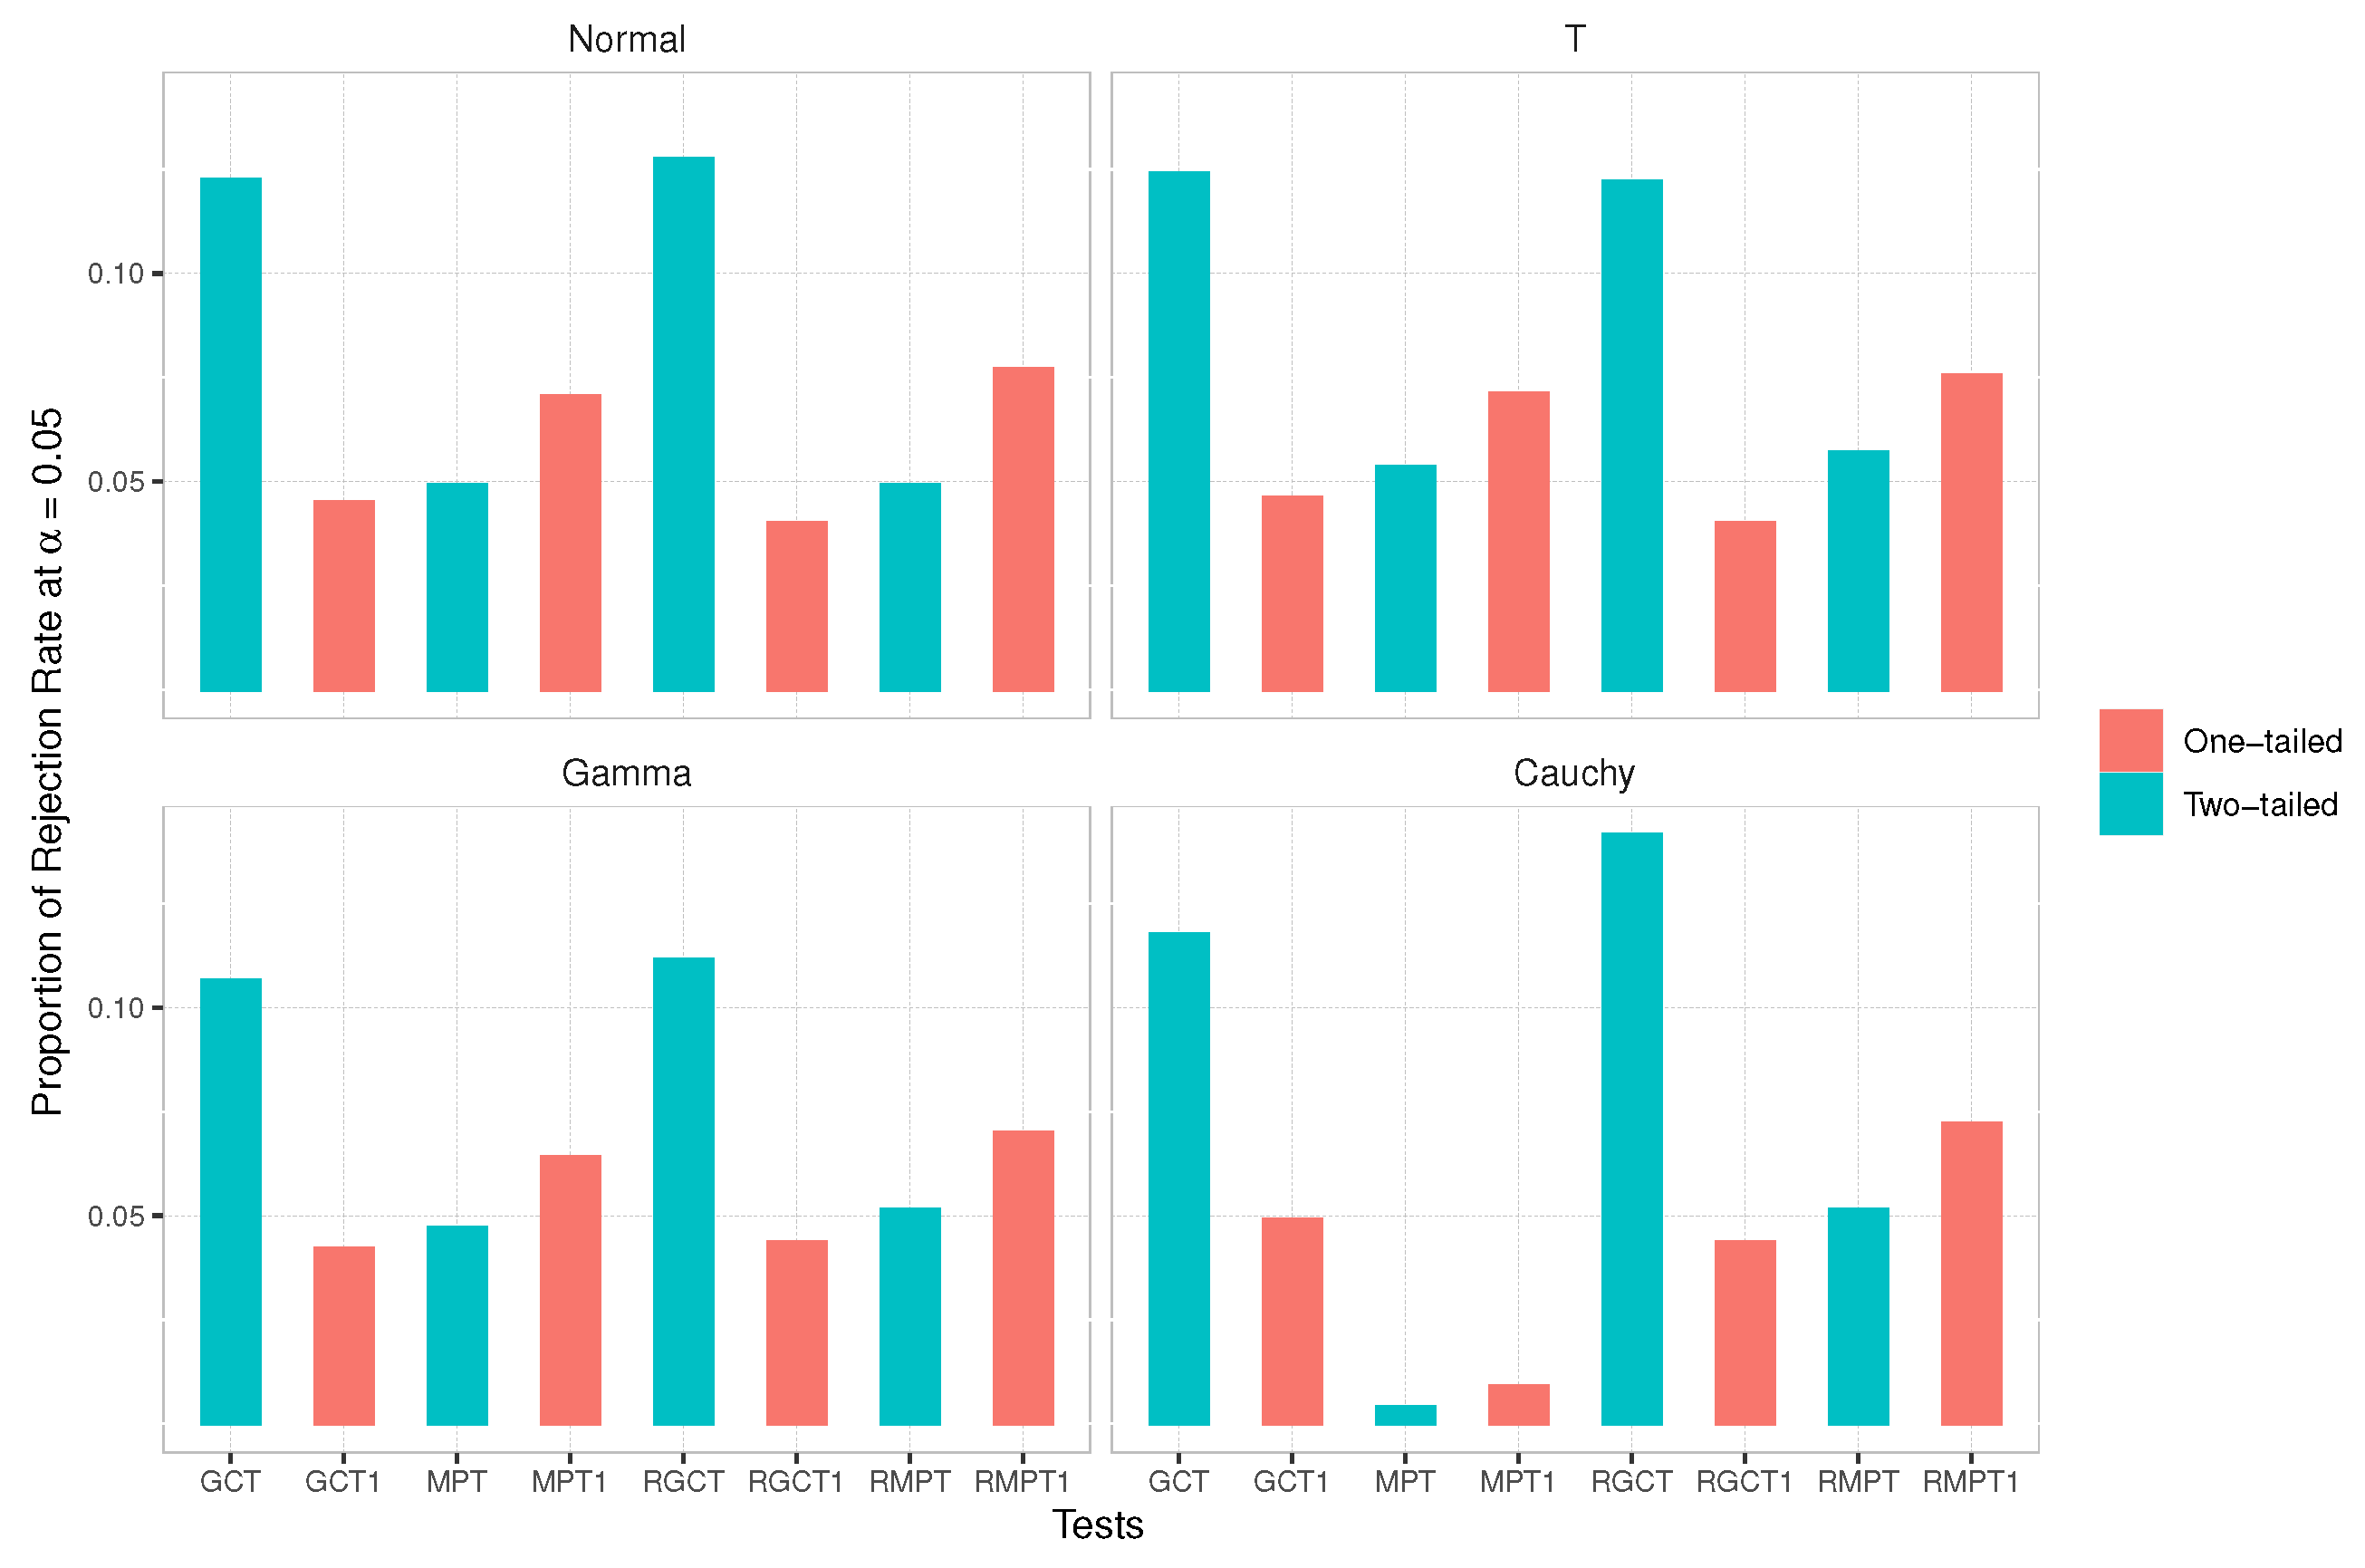
We close the simulation study, by investigating type I error rates for one-tailed and two-tailed tests. Figure 5 provides achieved type I error rates, in the case of the SD-dependence model. For convenience, two-tailed tests are labeled as GCT, MPT, RGCT, and RMPT, while the corresponding one-tailed tests are labeled as GCT1, MPT1, RGCT1, and RMPT1. The plot shows that two-tailed GCT and RGCT tend to have liberal type I error rates. Although there is not much difference, the type I errors of one-tailed MPT and RMPT are closer to the nominal level ( α = 0.05 ). Thus, we recommend to use the one-tailed rejection region for GCT and RGCT and keep using the two-tailed rejection region for MPT and RMPT for comparison. It can, also, be seen from the power plot in Figure 4, that the one-tailed GCT and RGCT are comparable to the two-tailed MPT and RMAPT.
Figure 5. The empirical type I errors at level α = 0.05 from 2000 simulation runs for one-tiled and two-tiled tests, under SD dependence. Set p = 500 , n 1 = 80 , and n 2 = 100 , and window widths are calculated using Algorithm 1.
Symmetry 14 01153 g005

5. Conclusions

In this work, we developed nonparametric tests for high-dimensional data, in two samples. The hypothesis is formulated in terms of the nonparametric marginal relative effects. These effects are meaningful and well defined, even for data measured on an ordinal scale or for heavily tailed data. The only stipulation is that the marginal distributions of the data are non-degenerate.
Related research by Gregory et al. [19] or, more recently, Zhang and Wang [20] developed a test for equality of mean vectors, where a composite of the squares of marginal t statistics are employed. Our test statistics are in the same vein, but we use the nonparametric Wilcoxon–Mann–Whitney-type statistic of Brunner and Munzel [4], instead of the t statistic. In many high-dimensional applications, such as transcriptomics, the effect on any individual variable (gene expression) may be small, and composite statistics will have high power in detecting the cumulative effect.
We proposed two tests that differ in the way the asymptotic variance of the composite statistic is estimated. In both cases, the test statistics are shown to, asymptotically, follow a standard normal distribution, under α -mixing (strong-mixing) dependence. The estimation of the asymptotic variances involves banding the covariance matrix of the marginal squared Wilcoxon–Mann–Whitney-type statistics, to guard against overestimation or underestimation. We demonstrated that the length of the banding window is related to the distribution of data as well as the strength of dependence, among the variables. We provided an algorithm for, adaptively, selecting the window width from the data. The algorithm was shown to improve the performance of the asymptotic variance estimator and, also, plays a crucial role in controlling the type I error rate.
The finite sample performance of the proposed tests was studied via simulation and compared with their parametric counterparts as well as another rank-based test. Generally, the parametric tests were found to be liberal in type I error control, when the dimension is large or for heavily tailed distributions, whereas the proposed tests have satisfactory performance overall.
Nonparametric tests, for relative effects in high dimensions, are not well studied [14,15]. For available methods to be applicable, the variables must be commensurate, so that the relative effects, which are measured to the average of all marginal distributions, would be appropriate. The present manuscript overcomes this challenge, by defining the relative effects, marginally. Comparing our proposed tests, overall RGCT is more reliable, when sample sizes are small. However, efficiency may be gained, by using the replications in estimating the asymptotic variance, as in RMPT, if the sample size per group is relatively large. All these nonparametric methods are, currently, available only for two groups and, by extension, to multiple treatment groups, which is an important problem for future research.

Author Contributions

Conceptualization, S.W.H. and X.K.; methodology, S.W.H., X.K. and A.V.-T.; validation, S.W.H. and X.K.; formal analysis, S.W.H. and X.K.; investigation, S.W.H. and X.K.; writing—original draft preparation, S.W.H., X.K. and A.V.-T., writing—review and editing, S.W.H., X.K. and A.V.-T. All authors have read and agreed to the published version of the manuscript.

Funding

This research received no external funding.

Institutional Review Board Statement

Not applicable.

Informed Consent Statement

Not applicable.

Data Availability Statement

Not applicable.

Acknowledgments

The authors are grateful to the four anonymous referees, for critically reading the original version of the manuscript and making valuable suggestions that led to great improvements. The authors are, also, thankful to the editor for the orderly handling of the manuscript.

Conflicts of Interest

The authors declare no conflict of interest.

Appendix A

We present some key Lemmas, needed for the proof of the main results, below. The proofs of Lemmas A1, A2, A5, and A7 can be found, for example, in Brunner and Munzel [4]. For the sake of completeness, Lemmas A3, A4, and A6 are stated for proving Lemmas A8, 1, and 2, which are somewhat new.
Lemma A1.
For any 1 k p and 1 j n 2 , E [ F ^ 1 k ( X 2 j k ) ] = E [ F 1 k ( X 2 j k ) ] = ω k .
Lemma A2.
For any 1 k p and 1 j n 2 , E F ^ 1 k ( X 2 j k ) F 1 k ( X 2 j k ) 2 1 / n 1 .
Lemma A3.
For any 1 k , k p , 1 1 2 n 1 and 1 j n 2 ,
E c ( X 2 j k X 1 1 k ) ω k c ( X 2 j k X 1 2 k ) ω k = σ 2 k k .
Lemma A4.
For any 1 k , k p , 1 n 1 and 1 < j 1 j 2 n 2 ,
E c ( X 2 j 1 k X 1 k ) ω k c ( X 2 j 2 k X 1 k ) ω k = σ 1 k k .
Lemma A5.
As min { n 1 , n 2 } and n i / n λ i ( 0 , 1 ) , two statistics, n ( ω ^ k ω k ) and n ( Y ¯ 2 k Y ¯ 1 k + 1 2 ω k ) , asymptotically, have the same distribution.
Lemma A6.
As min { n 1 , n 2 } and n i / n λ i ( 0 , 1 ) , Var ( ω ^ k ) = σ 1 k 2 / n 1 + σ 2 k 2 / n 2 + O ( n 2 ) .
Lemma A7.
As min { n 1 , n 2 } and n i / n λ i ( 0 , 1 ) , σ ^ i k 2 defined in (10) is an L 2 consistency estimator of σ i k 2 .
Lemma A8.
As min { n 1 , n 2 } and n i / n λ i ( 0 , 1 ) , σ ^ i k k defined in (14) is an L 2 consistency estimator of σ i k k for any k k .
Proof. 
The proof of the two i’s are similar, so, without loss of generality, we only prove it for i = 2 . First,
σ 2 k k = Cov ( Y 21 k , Y 21 k ) = E [ Y 21 k Y 21 k ] ω k ω k ,
and
σ ^ 2 k k = 1 n 1 2 ( n 2 1 ) j = 1 n 2 R 2 j k R j k ( 2 ) R ¯ 2 · k + n 2 + 1 2 R 2 j k R j k ( 2 ) R ¯ 2 · k + n 2 + 1 2 = 1 n 2 1 j = 1 n 2 F ^ 1 k ( X 2 j k ) ω ^ k F ^ 1 k ( X 2 j k ) ω ^ k = n 2 n 2 1 1 n 2 j = 1 n 2 F ^ 1 k ( X 2 j k ) F ^ 1 k ( X 2 j k ) ω ^ k ω ^ k .
Thus, it suffices to show that, as n ,
1 n 2 j = 1 n 2 F ^ 1 k ( X 2 j k ) F ^ 1 k ( X 2 j k ) L 2 E [ Y 21 k Y 21 k ] , and ω ^ k ω ^ k L 2 ω k ω k .
It is known from Lemma A6 that ω ^ k and ω ^ k are L 2 -consistent to ω k and ω k , respectively. Thus, applying c r -inequality for r = 2 , it follows that
E [ { ω ^ k ω ^ k ω k ω k } 2 ] = E [ { ω ^ k ( ω ^ k ω k ) + ( ω ^ k ω k ) ω k } 2 ] 2 E [ ω ^ k 2 ( ω ^ k ω k ) 2 ] + 2 E [ ( ω ^ k ω k ) 2 ω k 2 ] 2 E [ ( ω ^ k ω k ) 2 ] + 2 E [ ( ω ^ k ω k ) 2 ] 0 ,
since | ω ^ k | 1 and | ω k | 1 . It proves the second L 2 consistency in (A1).
On the other hand, 1 n 2 j = 1 n 2 F 1 k ( X 2 j k ) F 1 k ( X 2 j k ) L 2 E [ Y 21 k Y 21 k ] , since
E 1 n 2 j = 1 n 2 F 1 k ( X 2 j k ) F 1 k ( X 2 j k ) E [ Y 21 k Y 21 k ] 2 = 1 n 2 2 j = 1 n 2 E { Y 2 j k Y 2 j k E [ Y 2 j k Y 2 j k ] } 2 1 n 2 0 ,
where the last inequality is because | Y 2 j k Y 2 j k E [ Y 2 j k Y 2 j k ] | 1 . Thus, to prove the first L 2 consistency in (A1), it suffices to prove
E 1 n 2 j = 1 n 2 F ^ 1 k ( X 2 j k ) F ^ 1 k ( X 2 j k ) F 1 k ( X 2 j k ) F 1 k ( X 2 j k ) 2 0 .
Applying c r -inequality for r = 2 , it follows that
j = 1 n 2 F ^ 1 k ( X 2 j k ) F ^ 1 k ( X 2 j k ) F 1 k ( X 2 j k ) F 1 k ( X 2 j k ) 2 = j = 1 n 2 F ^ 1 k ( X 2 j k ) F ^ 1 k ( X 2 j k ) F 1 k ( X 2 j k ) + F ^ 1 k ( X 2 j k ) F 1 k ( X 2 j k ) F 1 k ( X 2 j k ) 2 2 j = 1 n 2 F ^ 1 k ( X 2 j k ) F ^ 1 k ( X 2 j k ) F 1 k ( X 2 j k ) 2 + 2 j = 1 n 2 F ^ 1 k ( X 2 j k ) F 1 k ( X 2 j k ) F 1 k ( X 2 j k ) 2 .
Taking the expectation on the first term, it follows that
2 n 2 2 E j = 1 n 2 F ^ 1 k ( X 2 j k ) ( F ^ 1 k X 2 j k ) F 1 k ( X 2 j k ) 2 2 n 2 2 j = 1 n 2 E F ^ 1 k 2 ( X 2 j k ) F ^ 1 k ( X 2 j k ) F 1 k ( X 2 j k ) 2 + 2 n 2 2 j 1 j 2 n 2 E F ^ 1 k ( X 2 j 1 k ) F ^ 1 k ( X 2 j 1 k ) F 1 k ( X 2 j 1 k ) F ^ 1 k ( X 2 j 2 k ) F ^ 1 k ( X 2 j 2 k ) F 1 k ( X 2 j 2 k ) .
Since F ^ 1 k 2 ( X 2 j k ) 1 , and by Lemma A2,
2 n 2 2 j = 1 n 2 E F ^ 1 k 2 ( X 2 j k ) F ^ 1 k ( X 2 j k ) F 1 k ( X 2 j k ) 2 2 n 2 2 j = 1 n 2 E F ^ 1 k ( X 2 j k ) F 1 k ( X 2 j k ) 2 2 n 1 n 2 0 ,
and
2 n 2 2 j 1 j 2 n 2 E F ^ 1 k ( X 2 j 1 k ) F ^ 1 k ( X 2 j 1 k ) F 1 k ( X 2 j 1 k ) F ^ 1 k ( X 2 j 2 k ) F ^ 1 k ( X 2 j 2 k ) F 1 k ( X 2 j 2 k ) = 2 n 1 4 n 2 2 j 1 j 2 n 2 1 , 2 , 3 , 4 = 1 n 1 E [ c ( X 2 j 1 k X 1 1 k ) c ( X 2 j 1 k X 1 2 k ) F 1 k ( X 2 j 1 k ) c ( X 2 j 2 k X 1 3 k ) c ( X 2 j 2 k X 1 4 k ) F 1 k ( X 2 j 2 k ) ] 2 n 2 ( n 2 1 ) ( n 1 3 + 2 n 1 ( n 1 1 ) ) n 1 4 n 2 2 0 , as n 1 , n 2 .
The last inequality is because the expectations of terms in the summation are zero, if { 1 , 2 , 3 , 4 } are all different, 2 is not the same of any { 1 , 3 , 4 } , or 4 is not the same of any { 1 , 2 , 3 } by Lemma A1. We divide it by two cases, when the expectations may not be 0, 2 = 4 , or 2 4 . If 2 = 4 , the above summation is less than n 2 ( n 2 1 ) n 1 3 . If 2 4 , then it should have { 1 , 3 } = { 2 , 4 } , and the above summation is less than 2 n 2 ( n 2 1 ) n 1 ( n 1 1 ) .
Similarly, the second term,
2 n 2 2 E j = 1 n 2 F ^ 1 k ( X 2 j k ) F 1 k ( X 2 j k ) F 1 k ( X 2 j k ) 2 = 2 n 2 2 j = 1 n 2 E ( F ^ 1 k ( X 2 j k ) F 1 k ( X 2 j k ) ) 2 F 1 k 2 ( X 2 j k ) + 2 n 2 2 j 1 j 2 n 2 E F ^ 1 k ( X 2 j 1 k ) F 1 k ( X 2 j 1 k ) F 1 k ( X 2 j 1 k ) F ^ 1 k ( X 2 j 2 k ) F 1 k ( X 2 j 2 k ) F 1 k ( X 2 j 2 k ) .
Since F 1 k 2 ( X 2 j k ) 1 , and by Lemma A2,
2 n 2 2 j = 1 n 2 E F ^ 1 k ( X 2 j k ) F 1 k ( X 2 j k ) 2 F 1 k 2 ( X 2 j k ) 2 n 2 2 j = 1 n 2 E F ^ 1 k ( X 2 j k ) F 1 k ( X 2 j k ) 2 2 n 1 n 2 0 ,
and
2 n 2 2 j 1 j 2 n 2 E F ^ 1 k ( X 2 j 1 k ) F 1 k ( X 2 j 1 k ) F 1 k ( X 2 j 1 k ) F ^ 1 k ( X 2 j 2 k ) F 1 k ( X 2 j 2 k ) F 1 k ( X 2 j 2 k ) = 2 n 1 2 n 2 2 j 1 j 2 n 2 1 , 2 = 1 n 1 E c ( X 2 j 1 k X 1 1 k ) F 1 k ( X 2 j 1 k ) c ( X 2 j 2 k X 1 2 k ) F 1 k ( X 2 j 2 k ) F 1 k ( X 2 j 1 k ) F 1 k ( X 2 j 2 k ) = 2 n 1 2 n 2 2 j 1 j 2 n 2 1 = 1 n 1 E c ( X 2 j 1 k X 1 1 k ) F 1 k ( X 2 j 1 k ) c ( X 2 j 2 k X 1 1 k ) F 1 k ( X 2 j 2 k ) F 1 k ( X 2 j 1 k ) F 1 k ( X 2 j 2 k ) 2 ( n 2 1 ) n 1 n 2 0 .
Proof of Lemma 1. 
For any k { 1 , , p } , denote Δ n = σ ^ 1 k 2 / λ 1 σ 1 k 2 / λ 1 + σ ^ 2 k 2 / λ 2 σ 2 k 2 / λ 2 . It can be seen from Lemma A7 that σ ^ 1 k 2 = σ 1 k 2 + O p ( n 1 / 2 ) and σ ^ 2 k 2 = σ 2 k 2 + O p ( n 1 / 2 ) . Thus Δ n = O p ( n 1 / 2 ) . From Lemma A6, n ( ω ^ k 1 / 2 ) 2 = O p ( 1 ) under H 0 . Recall that σ k 2 = σ 1 k 2 / λ 1 + σ 2 k 2 / λ 2 . Therefore,
t ^ k 2 = ( ω ^ k 1 / 2 ) 2 σ ^ 1 k 2 / n 1 + σ ^ 2 k 2 / n 2 = n ( ω ^ k 1 / 2 ) 2 Δ n + σ k 2 = n σ k 2 ( ω ^ k 1 / 2 ) 2 ( 1 + σ k 2 Δ n ) + O p ( n 1 ) ,
where the last equality follows from Taylor’s expansion. Taking the expectation, by Lemma A6, it follows that
n σ k 2 E [ ( ω ^ k 1 / 2 ) 2 ] = 1 + O ( n 1 ) .
For the second term,
( ω ^ k 1 / 2 ) 2 Δ n = ( ω ^ k 1 / 2 ) 2 ( σ ^ 1 k 2 / λ 1 σ 1 k 2 / λ 1 ) + ( ω ^ k 1 / 2 ) 2 ( σ ^ 2 k 2 / λ 2 σ 2 k 2 / λ 2 ) .
It suffices to show that E [ ( ω ^ k 1 / 2 ) 2 ( σ ^ 2 k 2 σ 2 k 2 ) ] = O ( n 2 ) , while the proof for the other term is similar. Note that, by Lemma A7, it follows that
( ω ^ k 1 / 2 ) 2 ( σ ^ 2 k 2 σ 2 k 2 ) = n 2 n 2 1 ( ω ^ k 1 / 2 ) 2 F ^ 1 k 2 d F ^ 2 k F 1 k 2 d F 2 k ω ^ k 2 + 1 / 4 + O p ( n 2 ) = n 2 n 2 1 ( ω ^ k 1 / 2 ) 2 ( F ^ 1 k 2 F 1 k 2 ) d F ^ 2 k F 1 k 2 d ( F ^ 2 k F 2 k ) ( ω ^ k 2 1 / 4 ) + O p ( n 2 ) .
Taking the expectation, the first term becomes
E ( ω ^ k 1 / 2 ) 2 ( F ^ 1 k 2 F 1 k 2 ) d F ^ 2 k = 1 n 2 E ( ω ^ k 1 / 2 ) 2 j = 1 n 2 F ^ 1 k 2 ( X 2 j k ) F 1 k 2 ( X 2 j k ) = 1 n 2 3 j , j 1 , j 2 = 1 n 2 E F ^ 1 k ( X 2 j 1 k ) 1 / 2 F ^ 1 k ( X 2 j 2 k ) 1 / 2 F ^ 1 k ( X 2 j k ) F 1 k ( X 2 j k ) F ^ 1 k ( X 2 j k ) + F 1 k ( X 2 j k ) = 1 n 1 4 n 2 3 1 , 2 , 3 , 4 = 1 n 1 j , j 1 , j 2 = 1 n 2 E [ { c ( X 2 j 1 k X 1 1 k ) 1 / 2 } { c ( X 2 j 2 k X 1 2 k ) 1 / 2 } · c ( X 2 j k X 1 3 k ) F 1 k ( X 2 j k ) c ( X 2 j k X 1 4 k ) + F 1 k ( X 2 j k ) ] = 1 n 1 4 n 2 3 1 = 2 3 4 n 1 j j 1 j 2 n 2 + 1 2 3 4 n 1 j j 1 = j 2 n 2 E [ ] + O ( n 2 ) = O ( n 2 ) ,
since E [ c ( X 2 j 1 k X 1 1 k ) 1 / 2 ] = 0 for any 1 { 1 , , n 1 } and E c ( X 2 j k X 1 3 k ) F 1 k ( X 2 j k ) c ( X 2 j k X 1 4 k ) + F 1 k ( X 2 j k ) = 0 for any 3 4 . The expectation of the second term is
E ( ω ^ k 1 / 2 ) 2 F 1 k 2 d ( F ^ 2 k F 2 k ) = 1 n 2 E ( ω ^ k 1 / 2 ) 2 j = 1 n 2 F 1 k 2 ( X 2 j k ) E [ F 1 k 2 ( X 2 j k ) ] = 1 n 1 2 n 2 3 1 , 2 = 1 n 1 j , j 1 , j 2 = 1 n 2 E { c ( X 2 j 1 k X 1 1 k ) 1 / 2 } { c ( X 2 j 2 k X 1 2 k ) 1 / 2 } F 1 k 2 ( X 2 j k ) E [ F 1 k 2 ( X 2 j k ) ] = 1 n 1 2 n 2 3 1 = 2 n 1 j j 1 j 2 n 2 + 2 1 2 n 1 j = j 1 j 2 n 2 + 1 2 n 1 j j 1 = j 2 n 2 E [ ] + O ( n 2 ) = O ( n 2 ) ,
The following results, on expectation of the third term, can be proven, similarly,
E ( ω ^ k 1 / 2 ) 2 ( ω ^ k 2 1 / 4 ) = E ( ω ^ k 1 / 2 ) 3 ( ω ^ k + 1 / 2 ) = O ( n 2 ) .
Using the same arguments as above, it can be shown that E [ ( ω ^ k 1 / 2 ) 2 r ] = O ( n r ) . Finally, we show sup k E [ t ^ k 2 r ] < , for any r > 1 . Since 1 + σ k 2 Δ n = σ ^ k 2 / σ k 2 0 and ( ω ^ k 1 / 2 ) 2 r 0 , applying Hölder inequality,
E [ t ^ k 2 r ] = σ k 2 r E [ n r ( ω ^ k 1 / 2 ) 2 r ( 1 + σ k 2 Δ n ) r ] σ k 2 r E [ n r + 1 ( ω ^ k 1 / 2 ) 2 r + 2 ] 2 r 2 r + 2 E [ ( 1 + σ k 2 Δ n ) 2 r ( r + 1 ) ] 1 2 r + 2 .
First E [ n r + 1 ( ω ^ k 1 / 2 ) 2 r + 2 ] = O ( 1 ) . It was seen in Lemma A7 that Δ n converges to 0 in L 2 . Thus, applying Taylor’s expansion
E [ ( 1 + σ k 2 Δ n ) 2 r ( r + 1 ) ] = E [ 1 2 r ( r + 1 ) σ k 2 Δ n + O p ( Δ n 2 ) ] 1 + σ k 2 E [ | Δ n | ] + O ( n 1 ) .
This proves that E [ t ^ k 2 r ] < for any k. Thus the desired result follows. □
Proof of Lemma 2. 
Under H 0 ,
t ^ k 2 = ( ω ^ k 1 / 2 ) 2 σ ^ 1 k 2 / n 1 + σ ^ 2 k 2 / n 2 = n ( ω ^ k 1 / 2 ) 2 σ 1 k 2 / λ 1 + σ 2 k 2 / λ 2 · σ 1 k 2 / λ 1 + σ 2 k 2 / λ 2 σ ^ 1 k 2 / λ 1 + σ ^ 2 k 2 / λ 2 = n ( ω ^ k 1 / 2 ) 2 σ 1 k 2 / λ 1 + σ 2 k 2 / λ 2 + O p ( n 1 / 2 ) ,
where the last equality follows from Taylor’s expansion. Next, consider
Cov n ( ω ^ k 1 / 2 ) 2 , n ( ω ^ k 1 / 2 ) 2 = n 2 E ( ω ^ k 1 / 2 ) 2 ( ω ^ k 1 / 2 ) 2 n 2 E [ ( ω ^ k 1 / 2 ) 2 ] E [ ( ω ^ k 1 / 2 ) 2 ] .
By Lemma A6, the second term in (A2) becomes
n 2 σ 1 k 2 / n 1 + σ 2 k 2 / n 2 + O ( n 2 ) σ 1 k 2 / n 1 + σ 2 k 2 / n 2 + O ( n 2 ) = ( σ 1 k 2 / λ 1 + σ 2 k 2 / λ 2 ) ( σ 1 k 2 / λ 1 + σ 2 k 2 / λ 2 ) + O ( n 1 ) .
The first term in (A2) is
n 2 E ( ω ^ k 1 / 2 ) 2 ( ω ^ k 1 / 2 ) 2 = n 2 n 1 4 n 2 4 1 , 2 , 3 , 4 = 1 n 1 j 1 , j 2 , j 3 , j 4 = 1 n 2 E [ c ( X 2 j 1 k X 1 1 k ) ω k c ( X 2 j 2 k X 1 2 k ) ω k c ( X 2 j 3 k X 1 3 k ) ω k c ( X 2 j 4 k X 1 4 k ) ω k ] = n 2 n 1 4 n 2 4 1 2 3 n 1 j 1 j 2 j 3 n 2 E c ( X 2 j 1 k X 1 2 k ) ω k c ( X 2 j 1 k X 1 3 k ) ω k · E c ( X 2 j 2 k X 1 1 k ) ω k c ( X 2 j 3 k X 1 1 k ) ω k + E c ( X 2 j 2 k X 1 1 k ) ω k c ( X 2 j 3 k X 1 1 k ) ω k · E c ( X 2 j 1 k X 1 2 k ) ω k c ( X 2 j 1 k X 1 3 k ) ω k + 4 E c ( X 2 j 1 k X 1 2 k ) ω k c ( X 2 j 1 k X 1 3 k ) ω k · E c ( X 2 j 2 k X 1 1 k ) ω k c ( X 2 j 3 k X 1 1 k ) ω k + n 2 n 1 4 n 2 4 1 2 n 1 j 1 j 2 j 3 j 4 n 2 E c ( X 2 j 1 k X 1 1 k ) ω k c ( X 2 j 2 k X 1 1 k ) ω k · E c ( X 2 j 3 k X 1 2 k ) ω k c ( X 2 j 4 k X 1 2 k ) ω k
+ 2 E c ( X 2 j 1 k X 1 1 k ) ω k c ( X 2 j 2 k X 1 1 k ) ω k · E c ( X 2 j 3 k X 1 2 k ) ω k c ( X 2 j 4 k X 1 2 k ) ω k + n 2 n 1 4 n 2 4 1 2 3 4 n 1 j 1 j 2 n 2 E c ( X 2 j 1 k X 1 1 k ) ω k c ( X 2 j 1 k X 1 2 k ) ω k · E c ( X 2 j 2 k X 1 3 k ) ω k c ( X 2 j 2 k X 1 4 k ) ω k + 2 E c ( X 2 j 1 k X 1 1 k ) ω k c ( X 2 j 1 k X 1 2 k ) ω k · E c ( X 2 j 2 k X 1 3 k ) ω k c ( X 2 j 2 k X 1 4 k ) ω k + O ( n 1 ) = n 2 n 1 4 n 2 4 { 1 2 3 n 1 j 1 j 2 j 3 n 2 ( σ 1 k 2 σ 2 k 2 + σ 1 k 2 σ 2 k 2 + 4 σ 1 k k σ 2 k k ) + 1 2 n 1 j 1 j 2 j 3 j 4 n 2 ( σ 1 k 2 σ 1 k 2 + 2 σ 1 k k 2 ) + 1 2 3 4 n 1 j 1 j 2 n 2 ( σ 2 k 2 σ 2 k 2 + 2 σ 2 k k 2 ) } + O ( n 1 ) = 2 ( σ 1 k k / λ 1 σ 2 k k / λ 2 ) 2 + ( σ 1 k 2 / λ 1 + σ 2 k 2 / λ 2 ) ( σ 1 k 2 / λ 1 + σ 2 k 2 / λ 2 ) + O ( n 1 ) ,
by Lemmas A3 and A4. Putting the simplified forms back in two terms of (A2), it follows that
Cov n ( ω ^ k 1 / 2 ) 2 , n ( ω ^ k 1 / 2 ) 2 = 2 ( σ 1 k k / λ 1 σ 2 k k / λ 2 ) 2 + O ( n 1 ) .
Therefore,
Cov t ^ k 2 , t ^ k 2 = 2 ( σ 1 k k / λ 1 σ 2 k k / λ 2 ) 2 σ 1 k 2 / λ 1 + σ 2 k 2 / λ 2 + O ( n 1 / 2 ) .
Proof of Lemma 3. 
By Lemma 1, sup k E [ t ^ k 2 t ^ k 2 ] < and, hence, by Cauchy–Schwarz inequality γ k k < . By Lemmas A7 and A8, it follows that σ ^ 1 k 2 = σ 1 k 2 + O p ( n 1 / 2 ) , σ ^ 2 k 2 = σ 2 k 2 + O p ( n 1 / 2 ) , σ ^ 1 k k = σ 1 k k + O p ( n 1 / 2 ) , and σ ^ 2 k k = σ 2 k k + O p ( n 1 / 2 ) for any k , k { 1 , , p } . Thus, following similar arguments, as in the proof of Lemma 2.4 of Zhang and Wang [20], we can get the desired result. □

References

  1. Harrar, S.W.; Kong, X. Recent developments in high-dimensional inference for multivariate data: Parametric, semiparametric and nonparametric approaches. J. Multivar. Anal. 2022, 188, 104855. [Google Scholar] [CrossRef]
  2. Anderson, T.W. An Introduction to Multivariate Statistical Analysis, 3rd ed.; Wiley Series in Probability and Statistics; Wiley-Interscience: Hoboken, NJ, USA, 2003. [Google Scholar]
  3. Bai, Z.; Saranadasa, H. Effect of high dimension: By an example of a two sample problem. Stat. Sin. 1996, 6, 311–329. [Google Scholar]
  4. Brunner, E.; Munzel, U. The nonparametric Behrens-Fisher problem: Asymptotic theory and a small sample approximation. Biom. J. 2000, 42, 17–25. [Google Scholar] [CrossRef]
  5. Brunner, E.; Munzel, U.; Puri, M.L. The multivariate nonparametric Behrens-Fisher problem. J. Stat. Plan. Inference 2002, 108, 37–53. [Google Scholar] [CrossRef]
  6. Brunner, E.; Konietschke, F.; Pauly, M.; Puri, M.L. Rank-based procedures in factorial designs: Hypotheses about non-parametric treatment effects. J. R. Stat. Soc. Ser. B 2017, 79, 1463–1485. [Google Scholar] [CrossRef] [Green Version]
  7. Konietschke, F.; Aguayo, R.R.; Staab, W. Simultaneous inference for factorial multireader diagnostic trials. Stat. Med. 2018, 37, 28–47. [Google Scholar] [CrossRef]
  8. Dobler, D.; Friedrich, S.; Pauly, M. Nonparametric MANOVA in meaningful effects. Ann. Inst. Stat. Math. 2020, 72, 997–1022. [Google Scholar] [CrossRef]
  9. Bathke, A.C.; Harrar, S.W. Nonparametric methods in multivariate factorial designs for large number of factor levels. J. Stat. Plan. Inference 2008, 138, 588–610. [Google Scholar] [CrossRef]
  10. Harrar, S.W.; Bathke, A.C. Nonparametric methods for unbalanced multivariate data and many factor levels. J. Multivar. Anal. 2008, 99, 1635–1664. [Google Scholar] [CrossRef] [Green Version]
  11. Bathke, A.C.; Harrar, S.W.; Madden, L.V. How to compare small multivariate samples using nonparametric tests. Comput. Stat. Data Anal. 2008, 52, 4951–4965. [Google Scholar] [CrossRef]
  12. Burchett, W.W.; Ellis, A.R.; Harrar, S.W.; Bathke, A.C. Nonparametric inference for multivariate data: The R package npmv. J. Stat. Softw. 2017, 76, 1–18. [Google Scholar] [CrossRef] [Green Version]
  13. Bathke, A.C.; Harrar, S.W. Rank-based inference for multivariate data in factorial designs. In Robust Rank-BASED and Nonparametric Methods; Springer: Berlin, Germany, 2016; pp. 121–139. [Google Scholar]
  14. Wang, H.; Akritas, M.G. Rank test for heteroscedastic functional data. J. Multivar. Anal. 2010, 101, 1791–1805. [Google Scholar] [CrossRef] [Green Version]
  15. Kong, X.; Harrar, S.W. High-dimensional rank-based inference. J. Nonparametr. Stat. 2020, 32, 294–322. [Google Scholar] [CrossRef]
  16. Ruymgaart, F.H. Statistique non Paramétrique Asymptotique: A Unified Approach to the Asymptotic Distribution Theory of Certain Midrank Statistics; Springer: Berlin/Heidelberg, Germany, 1980; pp. 1–18. [Google Scholar]
  17. Akritas, M.G.; Brunner, E. A unified approach to rank tests for mixed models. J. Stat. Plan. Inference 1997, 61, 249–277. [Google Scholar] [CrossRef]
  18. Brunner, E.; Munzel, U.; Puri, M.L. Rank-score tests in factorial designs with repeated measures. J. Multivar. Anal. 1999, 70, 286–317. [Google Scholar] [CrossRef] [Green Version]
  19. Gregory, K.B.; Carroll, R.J.; Baladandayuthapani, V.; Lahiri, S.N. A two-sample test for equality of means in high dimension. J. Am. Stat. Assoc. 2015, 110, 837–849. [Google Scholar] [CrossRef]
  20. Zhang, H.; Wang, H. A more powerful test of equality of high-dimensional two-sample means. Comput. Stat. Data Anal. 2021, 164, 107318. [Google Scholar] [CrossRef]
  21. Srivastava, M.S.; Du, M. A test for the mean vector with fewer observations than the dimension. J. Multivar. Anal. 2008, 99, 386–402. [Google Scholar] [CrossRef] [Green Version]
  22. Srivastava, M.S.; Katayama, S.; Kano, Y. A two sample test in high dimensional data. J. Multivar. Anal. 2013, 114, 349–358. [Google Scholar] [CrossRef]
  23. Brockwell, P.J.; Davis, R.A. Time Series: Theory and Methods; Springer Series in Statistics; Springer: New York, NY, USA, 2013. [Google Scholar]
  24. Politis, D.N.; Romano, J.P. Bias-corrected nonparametric spectral estimation. J. Time Ser. Anal. 1995, 16, 67–103. [Google Scholar] [CrossRef]
  25. Xu, G.; Lin, L.; Wei, P.; Pan, W. An adaptive two-sample test for high-dimensional means. Biometrika 2016, 103, 609–624. [Google Scholar] [CrossRef] [PubMed] [Green Version]
  26. Chen, S.; Li, J.; Zhong, P. Two-sample and ANOVA tests for high dimensional means. Ann. Stat. 2019, 47, 1443–1474. [Google Scholar] [CrossRef] [Green Version]
  27. Kong, X.; Harrar, S.W. High-dimensional MANOVA under weak conditions. Stat. A J. Theor. Appl. Stat. 2021, 55, 321–349. [Google Scholar] [CrossRef]
  28. Bradley, R.C. Basic properties of strong mixing conditions. A Survey and some open questions. Probab. Surv. 2005, 2, 107–144. [Google Scholar] [CrossRef] [Green Version]
  29. Hall, P.; Jing, B.; Lahiri, S. On the sampling window method for long-range dependent data. Stat. Sin. 1998, 8, 1189–1204. [Google Scholar]
  30. Samorodnitsky, G. Long Range Dependence; Now Publishers Inc.: Hanover, MA, USA, 2007. [Google Scholar]
Publisher’s Note: MDPI stays neutral with regard to jurisdictional claims in published maps and institutional affiliations.