Abstract
Magnetic materials are used in many devices in everyday life. To control their properties, we must first understand how they are ordered. This can be accomplished through neutron diffraction measurements. However, in many cases, there are too many parameters to determine the structure uniquely. Fortunately, symmetry can greatly constrain the number of parameters. Symmetry can also allow us to determine which physical properties are possible. In this review, I discuss the role of symmetry in magnetic structure determination using neutron diffraction. In this review, I will discuss both representational analysis as well as the magnetic superspace formalism. I will also discuss where the magnetic structure has been critical to understanding the fundamental science of the problem.
1. Introduction
Humans have found magnets useful since the days of lodestones in Greece and compasses in China. In more modern times, magnetism is at the heart of the storage of information and other devices which undergird the modern world. The magnetic properties of materials are critical to classes of materials such as multiferroics and magnetic topological materials. The probe most suited to determining magnetic order at the atomic level is neutron diffraction.
Magnetic neutron diffraction is a classic inverse problem, where, if we know the magnetic order, we can calculate how neutrons will scatter from the material. However, as in crystallography, the inverse problem of determining the magnetic order from the scattering pattern is not one that is directly invertible due to the phase problem. Thus, we must fit the data to a model. If we consider a system such as , the ordered magnetic cell contains 64 atoms. If all spins were independent, its magnetic structure would be impossible to solve given the number of reflections observed in powder diffraction. Fortunately, we can use symmetry to simplify the problem so that we can try different classes of models to see if they can fit the data, with each class often having a manageable number of parameters.
Historically, the problem has been approached in a number of ways. In the earliest days, a model was constructed (‘guessed at’) and tested against the data in a rather ad hoc fashion. For simple systems, this was sufficient. As the materials studied became more complicated, two approaches emerged—that of magnetic superspace groups and that of representational analysis [1,2,3,4].
2. Materials and Methods
Calculations in this paper were performed using the FULLPROF Suite [5] and the Bilbao Crystallographic Server [6,7]. Visualizations of crystal structures were made using VESTA [8], JMol (Jsmol) [9], and the Bilbao crystallographic server.
3. Results and Discussion
There are a number of excellent reviews and texts on the theories of representational analysis as well as the use of magnetic superspace groups [2,3,4,10,11,12]. Instead of focusing on theory, in this paper, I will look at applications to some instructive examples.
3.1. MnO
MnO is the earliest example of an antiferromagnet studied by neutron scattering [13]. It crystallizes in the space group with a lattice parameter of a = 4.446 Å. They observed a new set of reflections appearing at 120 K. This can be seen in Figure 1. Today, we would start by determining the wave-vector. In this case, we see that new reflections appear with a wave-vector of indexed to the original cell (the reflections in the figure are indexed to the magnetic unit cell which is doubled along ,, and ). For a more complicated indexing, in a modern setting, we would turn to programs such as TREOR [14], DICVOL [15], or SARAh [16], to index the ordering wave-vector to the paramagnetic cell, which can be nontrivial.
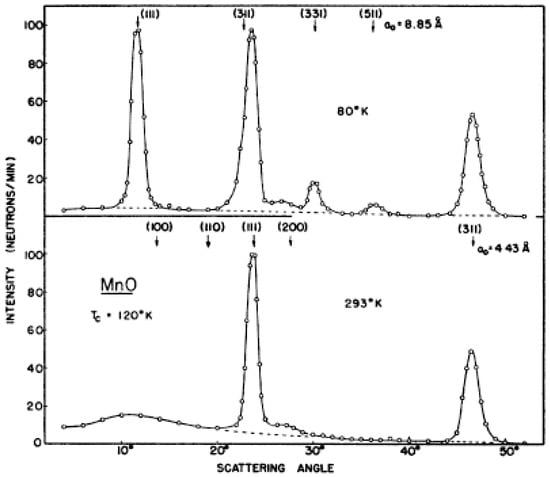
Figure 1.
This is the diffraction pattern of MnO taken above and below the transition, reproduced from [13].
Shull et al. observed five new reflections (see Figure 1) at low temperatures. They also measured the order parameter to determine the transition temperature. Along with the magnetic ordering, they also observed a rhombohedral distortion.
They considered three possible magnetic orders. In one case, they imagined that the moments could be along a [1 0 0] like direction. Another case they considered was that the moment was along the [1 1 1] body diagonal. Another possibility they considered was that the moment was somewhere within the [1 1 1] plane. Amongst these three models, they found that the model with the moment along a cubic axis was most consistent with the observed data. See Figure 2.
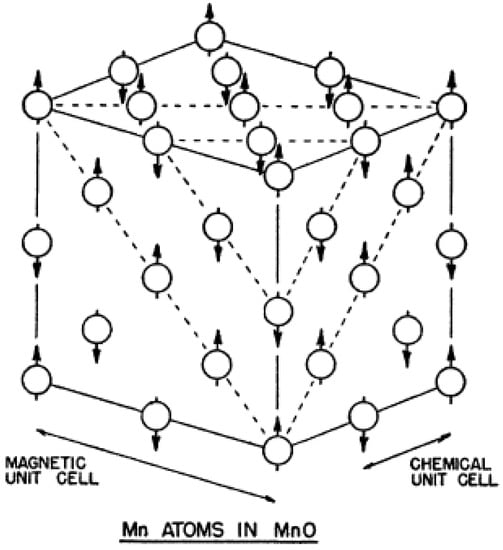
Figure 2.
This is a cartoon of the magnetic structure of MnO, reproduced from [13].
A later group measured 11 reflections [17]. They considered two models. In one model, the spins were along the direction in the [1 1 1] plane. In the other model, spins were along the [1 0 0] direction. The first model fits better. They also mention a slight rhombohedral distortion associated with the magnetic ordering (we note that a structural distortion has also been detected by observations of the phonons [18,19]). There have been a number of other papers on magnetostriction and order parameter measurements in this system without any definite resolution [20,21,22].
Today, we would look at the Bilbao crystallographic server [6,7]. Using the MAXMAGN program, we find that there is only one magnetic space group with a nonzero magnetic moment, (#167.108). Here, we see that the moment is along the [1 1 1] direction. This is a rather beautiful result in which the moment direction is set and there is a rhombohedral distortion as observed. However, given the strength of the (1 1 1) reflection, it is not possible that the moment is along this direction (if it were along this direction, there would be no intensity observed).
Let us briefly turn to representational analysis. Using SaraH, we find that the moment can lie within the [1 1 1] plane, but this it is not constrained to lie along a particular axis. Given the various discussions in the articles discussed, as well as others, it would seem that distinguishing the in-plane moment direction is challenging (see Table 1). This is not surprising. Given powder averaging, for a rhombohedral crystal, we should only be able to expect to determine the moment direction relative to the [1 1 1] direction as well as its magnitude.

Table 1.
Basis vectors for the space group F m -3 m with . The decomposition of the magnetic representation for the site is . The atom of the primitive basis is defined according to 1: .
However, we seem to find ourselves in a contradiction. From the representational analysis, we see that there are two possibilities based on ordering within a single representation. One possibility is consistent with that from space groups—that the moment is along the [1 1 1] direction. This disagrees with the data. The other is that the moment is within the scattering plane–which does not seem to be a possibility for the magnetic space group. The resolution is that the representation that is consistent with the observed magnetic order is two-dimensional. However, we have only examined the maximal magnetic space group. It is not necessary that it be a maximal space group given that the representation is two-dimensional. While in many cases the maximal magnetic superspace group determines the ground state, this is not necessarily the case, and if there is a discrepancy with the data, lower symmetry cases must be examined.
Recently, Goodwin et al. [23] performed a total scattering measurement and discovered a very slight modulation of the structure. They place the symmetry as a slightly monoclinic space group and place the moments along the [1 1 ] axes. They note that the preference for this particular direction as compared to others in the plane is slight. This results in a magnetic space group of C2. They also find a small out of plane spin component modulated along accompanied by a lattice modulation with the same periodicity. Hopefully, future theoretical calculations can determine why this moment direction is preferred.
3.2.
Another instructive example to consider is the multiferroic material . At high temperatures, the material crystallizes in the Pbam space group (Figure 3). As the temperature lowers, it orders magnetically at 45 K [24,25]. This is accompanied by a ferroelectric phase transition [24,25]. At 19 K, a second dielectric and magnetic transition occurs, showing that the structure and magnetism are intimately linked in this material. Early neutron investigations revealed that the high temperature transition was associated with a commensurate ordering with a wave vector of k1 = . The lower transition ordering wave vector was observed to be incommensurate with a wave-vector of k2 = [25]. While this early neutron diffraction study was performed on a single crystal, it primarily associated the ordering wave-vector with different ferroelectric states. Note that the true behavior is slightly more complex than described here in terms of the number and type of commensurate to incommensurate phase transitions [26].
Following these initial studies, subsequent authors moved to solve the magnetic structure and to relate this magnetic structure to the ferroelectric order [27]. This study was performed on powders on a time of flight instrument at ISIS. Magnetic refinement results in a rather complex magnetic order shown in Figure 4 in the commensurate phase. This commensurate phase was found to be amplitude modulated. It seems that the phase was set to be to achieve constant moments—this was not a constraint from symmetry. For the low temperature phase, a free fit of the parameters was performed using simulated annealing and can be mapped to the combination of two irreducible representations. These complex magnetic structures can be seen in Figure 4. Extracting crystallographic and magnetic parameters, a good agreement can be found with the measured polarization data as shown in Figure 5.
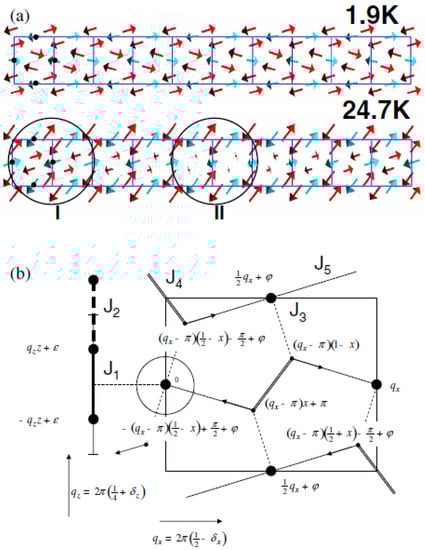
Figure 4.
(a) Magnetic structure at 24.7 (top) and 1.9 K (bottom) projected in the ab plane. Ten unit cells are displayed along a. For clarity, a single layer is shown. The arrows represent the magnetic moment on (blue), at positions marked by black dots, and Mn3 (red). For the ICM structure, region I is locally very similar to the CM phase (both chains having sizable moments) and does not contain inversion centers. Region II could potentially contain an inversion center and is described in more detail in (b) and in the text; (b) a schematic representation of the magnetic structures of both CM and ICM phases (see text). The fragment on the left side represents a portion of the - chains along the c-axis. The SDW phases are as shown in the labels of the sites and are obtained for the sites by adding the values of the a- and c-axis projections. The arrows indicate the direction of the underlying centrosymmetric vector field that is coupled to the magnetism and coincides with the axes of the pyramids. Magnetic exchange pathways are also indicated, reproduced from Figure 2 of [27].
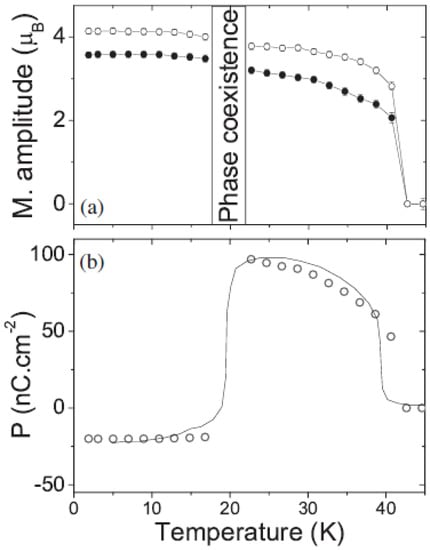
Figure 5.
(a) Refined values of the magnetic wave amplitudes on (open symbols) and (solid symbols) as a function of temperature. The average moment on each site is of the wave amplitude; (b) symbols: Electrical polarization of , as calculated from Equation (1) of [27]. Solid line: Experimental values of the electrical polarization, extracted from Kagomiya et al. [24]. The calculated polarization has been scaled by a single constant to account for the unknown magnetoelastic coupling parameter, reproduced from Figure 3 of [27].

Figure 3.
Crystal structure of projected in the ab plane (top panel) and ac plane (bottom panel). The green (small and light gray), red (gray), and blue (black) spheres correspond to Mn4+, Mn3+, and R3+ ions, respectively. Mn-O polyhedra are shown with the same color scheme. The thin black line represents the crystallographic unit cell, reproduced from Figure 1 [28].

While this initial work was impressive, there are definitely constraints on what can be learned from powder. For example, powder diffraction is rather insensitive to phase information. It is often difficult to impossible to distinguish between spiral, cycloidal, and amplitude modulated structures. In addition, the parameter space to search is extremely large. To address this, researchers moved towards studies of single crystals. Vecchini et al. [28] find that the and moments are primarily along the a-axis, with components along b and c. For , they form zig-zag antiferromagnetic chains as seen in Figure 6. The moments have a slight cycloidal pattern that is displayed in Figure 7 and Figure 8. The interested reader is directed to the paper for a rich discussion of domains. This structure shares a fair amount of overlap with that of [29].
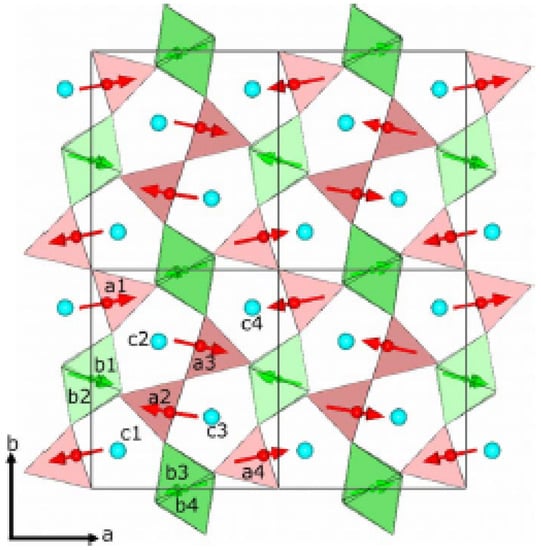
Figure 6.
Magnetic structure of projected in the ab plane. The structure is shown in two unit cells, marked by thin black lines, along the a and b axes. The green (small and light gray) and red (gray) arrows represent magnetic moments on Mn and Mn sites, respectively. Corresponding Mn-O polyhedra are shown with the same colors. The blue spheres (black) represent Y ions, reproduced from Figure 3 of [28].
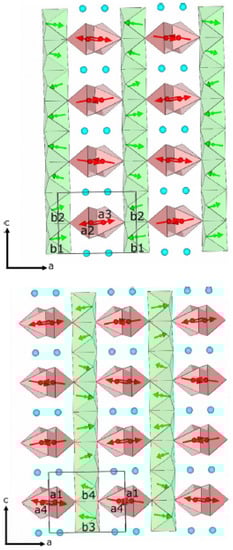
Figure 7.
Magnetic structure of projected in the ac plane shown within four unit cells along c and two unit cells along a. The projection is separately shown for magnetic sites belonging to the first AFM chain (top) and the second chain (bottom). The green (small and light gray) and red (gray) arrows represent magnetic moments on and sites, respectively. Corresponding Mn-O polyhedra are shown with the same colors. The blue (black) spheres represent Y ions, reproduced from Figure 4 of [28].
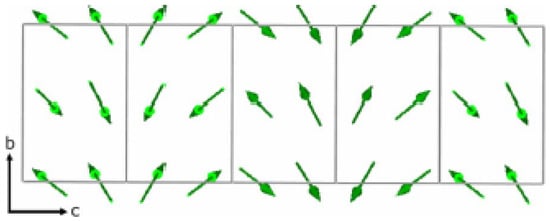
Figure 8.
Magnetic structure of projected in the bc plane and showing only the moments. The figure shows the small helicoidal modulation generated by the out-of-phase c component. To highlight this weak modulation, the moments have been scaled by a factor of 5 with respect to what represented in the other figures, reproduced from Figure 5 of [28].
While this and the paper of Kimura [26] might have seemed to have resolved the magnetic structure, there was still a question of mechanism that was under debate. Namely, did the multiferroicity in these compounds derive from exchange–striction as championed by Chapon, Radaelli, and coworkers, the spin current model of Katsura and Mostovoy, or something different. Another group weighed in through using a rather sophisticated approach [30]. They approached the problem by co-refining single crystal and spherical polarimetry data. In a spherical polarimetry experiment, one can measure the full polarization tensor, which provides significant constraints on the magnetic structure. Thus, even though they had no constraints implied by symmetry, the data offered additional constraints on the single crystal data, and they found a model of the magnetic structure that was different from that of Kimura. Later, the group of Radaelli and Chapon thought more about symmetry and delved into the idea of co-representations [31,32]. The basic idea behind co-representations is that, when dealing with spin , one should consider anti-unitary operators. From this, they were able to find symmetry constraints and a simpler solution that resulted in a better fit to the data than that achieved by Kim et al. Finally, in an excellent review, Perez-Mato [11] showed how superspace groups were sufficient without the need for co-representations. We note that one alternative approach that we have not considered was developed by Harris et al. [33,34] and involves considering the full free energy of the system. This can reveal symmetries that are not captured by representational analysis but is rather difficult to apply for experimentalists.
Thus, to recap, we have seen how our understanding of this material grew from initial investigations with powder and representational analysis to the language of co-representations and superspace methods.
4. Tools
From the previous examples, we have seen some of the simple and complex examples of magnetic structure determination. Today, there are a variety of tools to use in the determination of magnetic structure. There are also a number of schools and workshops to train people in their use. There has also been an expanding series of articles on the use of magnetic space group symmetry and these tool. This section provides a very broad overview of these tools. The interested reader should refer to individual references for a more detailed discussion.
As was mentioned earlier, one of the first steps in a neutron diffraction experiment is to determine the wave-vector (or multiple wave-vectors!) which defines the periodicity of the magnetic structure. In a single crystal experiment, this can be determined directly by the appearance of new reflections when the periodicity of the magnetic order differs from that of crystallographic cell. When the magnetic and crystallographic cell are the same (often called a magnetic structure), magnetic reflections will appear at the same positions as structural reflections. In this case, either polarized neutrons may be used to separate the magnetic order, or subtraction of the intensities from above the magnetic transition can reveal the magnetic component of the observed intensities. In some cases, even for non structures, it may be ambiguous as to whether the new reflections are magnetic or structural in nature. For example, there can be reflections associated with charge ordering or a lowering of space-group symmetry. This can be distinguished through the use of polarized neutron scattering. It should be noted that, while white beam instruments can reveal the full diffraction pattern, for instruments with a single detector (or small position sensitive detector), it is difficult to search reciprocal space. When examining a new material where there is no information on the k-vector, it is often best when possible to start with a powder even if it requires the crushing of single crystals. Exceptions can be in thin films or when the signal is exquisitely weak (as in low moment systems). Other challenges to be aware of when working with single crystals are twinning and absorption. These can be corrected for in many cases (e.g., isotopic substitution), but powders provide for a much easier starting point.
For powders, we would turn to programs such as TREOR [14], DICVOL [15], or SARAh [16], to index the ordering wave-vector to the paramagnetic cell, which can be nontrivial. The difficulty is that often there can be relatively few magnetic reflections, which leaves the index of the new reflection(s) ambiguous. Another difficulty is that there can be overlap between reflections. The aforementioned programs can search along high symmetry directions along with general directions to attempt to determine the ordering wave-vector. One can also employ custom global fits to determine the wave-vector in a Lebail-like manner [35]. One common difficulty that is useful to remember for those new to magnetic structure refinement is that, for centered cells, the propagation vector is often rather than .
Once the ordering wave-vector has been determined, there are two common paths forward [36]. One path is that of representational analysis. Programs such as SARah [16] or Fullprof [5] (specifically, the BASIREPS program) allow the user to enter information about the space group, positions of magnetic atoms in the crystallographic primitive cell, and the wave-vector. Based on this information, these programs (and others) will perform the calculations associated with representational analysis and will provide the user with the basis functions associated with the different representations. The coefficients of these basis functions can then be fit against the observed data (for both powder and single crystal data), thus determining the magnetic structure. SARah also allows for providing an easy interface for fitting these coefficients through Fullprof, while allowing for mixing between different representations (as can occur for first order transitions, or when there are terms in the free energy which allow for mixing). As discussed earlier, there are complexities involved in the fitting and at times judgement calls which must be made in the cases of multiple ordering wave-vectors. Additionally, with nonsymmorphic space-groups such as discussed above for the , one has to be wary of wave-vectors on the edge of the Brillouin zone such as . In this case, most of the programs using representational analysis will not adequately constrain the magnetic structure. In this case, one can either use co-representations as discussed, or use magnetic superspace groups. Magnetic superspace groups are handled in existing software packages, so would likely be more approachable than the more specialized use of double-groups, co-representations, or solutions of the free energy.
The other approach is to use magnetic superspace groups. Here, one can take advantage of the Bilbao crystallographic server [11]. Isodisplace [37] is also an excellent resource. For the Bilbao crystallographic server, one can start with the program MAXMAGN. Here, the user inputs the structural information by providing the wave-vector, space-group, and a cif file with the crystallographic structural information. From this, the program determines the maximal symmetry superspace groups. From the web interface, one can visualize the possible magnetic structures associated with each of these magnetic superspace groups and obtain an mCIF file which can be used for refinement. Programs such as Jana [38] and GSAS II [39] directly interact with the Bilbao crystallographic server to use magnetic superspace groups for the refinement.
For unpolarized neutrons, there can still be ambiguities. For example, in measurements on skyrmions [40,41], a uniaxial polarized beam may be required to fully analyze the magnetic structure. It can also be useful in determining if a single magnetic chirality domain is present [42]. Other uses can be in determining basic features of the magnetic structure in thin films [43]. In some cases, even uniaxial polarization analysis is insufficient. For example, there can be chirality domains. Spherical polarimetry can resolve these ambiguities by measuring the full polarization tensor. This is a tool best used after unpolarized techniques have been exhausted. This is because the counting times are long and the analysis can be complex. The Mag2Pol [44] package is friendly to use for analyzing data. It was critical in the studies of some multiferroic thin films [45].
For programs such as Fullprof, it is easy to output a mCIF file that uniquely describes the magnetic structure. It is good practice to add this file to the supplemental materials when submitting a paper for publication.
5. Conclusions
Magnetic superspace groups and representational analysis are both useful tools for determining how materials order magnetically and the implication for their physical properties. As we study materials with complex magnetic structures, we should take advantage of both tools not just to reduce the number of parameters, but to increase our understanding of the physics of the system. There has been a renaissance in the use of magnetic superspace groups to describe materials with incommensurate magnetic order. New tools such as ISODISTORT and the Bilbao crystallographic server provide accessible access to these methods. They have also been incorporated into major refinement programs such as Fullprof and Jana. They also make consistent reporting in publications possible. By taking advantage of these new methods, we can take advantage of the full symmetry of materials as we seek to understand their magnetic order.
Funding
This research was funded by the United States Department of Commerce.
Acknowledgments
We acknowledge useful conversations over the years about magnetic structure determination with Efrain Rodriguez, Juan Rodriguez-Carvajal, Andrew Wills, Michel Kenzelmann, Branton Campbell, Paulo Radaelli, Laurent Chapon, Qing Huang, Juan Perez-Mato, and many others.
Conflicts of Interest
The author declares no conflict of interest.
References
- Hammermesh, M. Group Theory and Its Application to Physical Problems, reprint ed.; Dover Publications: Mineola, NY, USA, 1989. [Google Scholar]
- Bradley, C.; Cracknell, A.P. The Mathematical Tehory of Symmetry in Solids; Representation Theory for Point Groups and Space Groups, revised ed.; Oxford University Press: Oxford, UK, 2010. [Google Scholar]
- Mirman, R. Point Groups, Space Groups, Crystals, Molecules; World Scientific: Singapore, 1999. [Google Scholar]
- Izyumov, Y.A.; Syromyatnikov, V. Phase Transitions and Crystal Symmetry, english ed.; Kluwer Academic Publishers: Boston, MA, USA, 1990. [Google Scholar]
- Rodriguez-Carvajal, J. FULLPROF: A Program for Rietveld Refinement and Pattern Matching Analysis. In Abstracts of the Satellite Meeting on Powder Diffraction of the XV Congress of the IUCr; Toulouse, France, 1990; p. 127. Available online: https://www.scirp.org/(S(351jmbntvnsjt1aadkposzje))/reference/ReferencesPapers.aspx?ReferenceID=868636 (accessed on 20 April 2022).
- Aroyo, M.I.; Perez-Mato, J.M.; Capillas, C.; Kroumova, E.; Ivantchev, S.; Madariaga, G.; Kirov, A.; Wondratschek, H. Bilbao Crystallographic Server: I. Databases and crystallographic computing programs. Z. Krist. 2006, 221, 15–27. [Google Scholar] [CrossRef]
- Aroyo, M.I.; Kirov, A.; Capillas, C.; Perez-Mato, J.M.; Wondratschek, H. Bilbao Crystallographic Server. II. Representations of crystallographic point groups and space groups. Acta Crystallogr. Sect. A 2006, 62, 115–128. [Google Scholar] [CrossRef]
- Momma, K.; Izumi, F. VESTA: A three-dimensional visualization system for electronic and structural analysis. J. Appl. Crystallogr. 2008, 41, 653–658. [Google Scholar] [CrossRef]
- Willighagen, E.; Howard, M. Fast and Scriptable Molecular Graphics in Web Browsers without Java3D. Nat. Preced. 2007, 1. [Google Scholar] [CrossRef]
- Pérez-Mato, J.M.; Madariaga, G.; Tello, M.J. Superspace groups and Landau theory. A physical approach to superspace symmetry in incommensurate structures. Phys. Rev. B 1984, 30, 1534–1543. [Google Scholar] [CrossRef]
- Perez-Mato, J.; Gallego, S.; Tasci, E.; Elcoro, L.; de la Flor, G.; Aroyo, M. Symmetry-Based Computational Tools for Magnetic Crystallography. Annu. Rev. Mater. Res. 2015, 45, 217–248. [Google Scholar] [CrossRef]
- Kopský, V. Towards a system in space group representations. Comput. Math. Appl. 1988, 16, 493–505. [Google Scholar] [CrossRef][Green Version]
- Shull, C.G.; Strauser, W.A.; Wollan, E.O. Neutron diffraction by paramagnetic and antiferromagnetic substances. Phys. Rev. 1951, 83, 333–345. [Google Scholar] [CrossRef]
- Werner, P.E.; Eriksson, L.; Westdahl, M. TREOR, a semi-exhaustive trial-and-error powder indexing program for all symmetries. J. Appl. Crystallogr. 1985, 18, 367–370. [Google Scholar] [CrossRef]
- Boultif, A.; Èr, D.L. Applied Crystallography Powder pattern indexing with the dichotomy method. J. Appl. Crystallogr. 2004, 37. [Google Scholar] [CrossRef]
- Wills, A.S. A new protocol for the determination of magnetic structures using simulated annealing and representational analysis (SARAh). Phys. B Condens. Matter 2000, 276–278, 680–681. [Google Scholar] [CrossRef]
- Blech, I.A.; Averbach, B.L. Long-range magnetic order in MnO. Phys. Rev. 1966, 142, 287–290. [Google Scholar] [CrossRef]
- Rudolf, T.; Kant, C.; Mayr, F.; Loidl, A. Magnetic-order induced phonon splitting in MnO from far-infrared spectroscopy. Phys. Rev. B-Condens. Matter Mater. Phys. 2008, 77, 024421. [Google Scholar] [CrossRef]
- Chung, L.; Paul, M.K.; Balakrishnan, G.; Lees, R.; Ivanov, A.; Yethiraj, M. Role of electronic correlations on the phonon modes of MnO and NiO. Phys. Rev. B 2003, 68, 140406. [Google Scholar] [CrossRef]
- Cheetham, A.K.; Hope, D.A.O. Magnetic ordering and exchange effects in the antiferromagnetic solid solutions MnxN. Phys. Rev. B 1983, 27, 6964–6967. [Google Scholar] [CrossRef]
- Sun, X.; Feng, E.; Su, Y.; Nemkovski, K.; Petracic, O.; Brückel, T. Magnetic properties and spin structure of MnO single crystal and powder. J. Phys. Conf. Ser. 2017, 862. [Google Scholar] [CrossRef]
- Kantor, A.P.; Dubrovinsky, L.S.; Dubrovinskaia, N.A.; Kantor, I.Y.; Goncharenko, I.N. Phase transitions in MnO and FeO at low temperatures: A neutron powder diffraction study. J. Alloys Compd. 2005, 402, 42–45. [Google Scholar] [CrossRef]
- Goodwin, A.L.; Tucker, M.G.; Dove, M.T.; Keen, D.A. Magnetic structure of MnO at 10 K from total neutron scattering data. Phys. Rev. Lett. 2006, 96, 047209. [Google Scholar] [CrossRef]
- Kagomiya, I.; Matsumoto, S.; Kohn, K.; Fukuda, Y.; Shoubu, T.; Kimura, H.; Noda, Y.; Ikeda, N. Lattice Distortion at Ferroelectric Transition of YMn2O5. Ferroelectrics 2011, 286, 167–174. [Google Scholar] [CrossRef]
- Kobayashi, S.; Osawa, T.; Kimura, H.; Noda, Y.; Kagomiya, I.; Kohn, K. Reinvestigation of simultaneous magnetic and ferroelectric phase transitions in YMn2O5. J. Phys. Soc. Jpn. 2004, 73, 1593–1596. [Google Scholar] [CrossRef]
- Kimura, H.; Kobayashi, S.; Fukuda, Y.; Osawa, T.; Kamada, Y.; Noda, Y.; Kagomiya, I.; Kohn, K. Spiral spin structure in the commensurate magnetic phase of multiferroic RMn2O5. J. Phys. Soc. Jpn. 2007, 76, 074706. [Google Scholar] [CrossRef]
- Chapon, L.C.; Radaelli, P.G.; Blake, G.R.; Park, S.; Cheong, S.W. Ferroelectricity induced by acentric spin-density waves in YMn2O5. Phys. Rev. Lett. 2006, 96, 097601. [Google Scholar] [CrossRef] [PubMed]
- Vecchini, C.; Chapon, L.; Brown, P.; Chatterji, T.; Park, S.; Cheong, S.W.; Radaelli, P. Commensurate magnetic structures of RMn2O5 (R = Y,Ho,Bi) determined by single-crystal neutron diffraction. Phys. Rev. B 2008, 77, 134434. [Google Scholar] [CrossRef]
- Noda, Y.; Kimura, H.; Fukunaga, M.; Kobayashi, S.; Kagomiya, I.; Kohn, K. Magnetic and ferroelectric properties of multiferroic RMn2O5. J. Phys. Condens. Matter 2008, 20, 434206. [Google Scholar] [CrossRef]
- Kim, J.H.; Lee, S.H.; Park, S.I.; Kenzelmann, M.; Harris, A.B.; Schefer, J.; Chung, J.H.; Majkrzak, C.F.; Takeda, M.; Wakimoto, S.; et al. Spiral spin structures and origin of the magnetoelectric coupling in YMn2O5. Phys. Rev. B 2008, 78, 245115. [Google Scholar] [CrossRef]
- Radaelli, P.G.; Vecchini, C.; Chapon, L.C.; Brown, P.J.; Park, S.; Cheong, S.W. Incommensurate magnetic structure of YMn2O5: A stringent test of the multiferroic mechanism. Phys. Rev. B 2009, 79, 020404. [Google Scholar] [CrossRef]
- Radaelli, P.G.; Chapon, L.C. Symmetry constraints on the electrical polarization in multiferroic materials. Phys. Rev. B-Condens. Matter Mater. Phys. 2007, 76, 054428. [Google Scholar] [CrossRef]
- Harris, A.B.; Kenzelmann, M.; Aharony, A.; Entin-Wohlman, O. Effect of inversion symmetry on the incommensurate order in multiferroic R Mn2O5 (R = rare earth). Phys. Rev. B Condens. Matter Mater. Phys. 2008, 78, 014407. [Google Scholar] [CrossRef]
- Harris, A.B.; Aharony, A.; Entin-Wohlman, O. Order parameters and phase diagram of multiferroic RMn2O5. Phys. Rev. Lett. 2008, 100, 217202. [Google Scholar] [CrossRef]
- Lesniewski, J.E.; Disseler, S.M.; Quintana, D.J.; Kienzle, P.A.; Ratcliff, W.D. Bayesian method for the analysis of diffraction patterns using BLAND. J. Appl. Crystallogr. 2016, 49, 2201–2209. [Google Scholar] [CrossRef]
- Petíček, V.; Fuksa, J.; Dušek, M. Magnetic space and superspace groups, representation analysis: Competing or friendly concepts? Acta Crystallogr. Sect. A Found. Crystallogr. 2010, 66, 649–655. [Google Scholar] [CrossRef] [PubMed]
- Campbell, B.J.; Stokes, H.T.; Tanner, D.E.; Hatch, D.M. ISODISPLACE: A web-based tool for exploring structural distortions. J. Appl. Crystallogr. 2006, 39, 607–614. [Google Scholar] [CrossRef]
- Petrícek, V.; Dušek, M.; Palatinus, L. Crystallographic computing system JANA2006: General features. Z. Krist. 2014, 229, 345–352. [Google Scholar] [CrossRef]
- Toby, B.H.; Von Dreele, R.B. GSAS-II: The genesis of a modern open-source all purpose crystallography software package. J. Appl. Crystallogr. 2013, 46, 544–549. [Google Scholar] [CrossRef]
- White, J.S.; Butykai.; Cubitt, R.; Honecker, D.; Dewhurst, C.D.; Kiss, L.F.; Tsurkan, V.; Bordács, S. Direct evidence for cycloidal modulations in the thermal-fluctuation-stabilized spin spiral and skyrmion states of GaV4S8. Phys. Rev. B 2018, 97, 020401. [Google Scholar] [CrossRef]
- Dally, R.L.; Ratcliff, W.D.; Zhang, L.; Kim, H.S.; Bleuel, M.; Kim, J.W.; Haule, K.; Vanderbilt, D.; Cheong, S.W.; Lynn, J.W. Magnetic phase transitions and spin density distribution in the molecular multiferroic system GaV4S8. Phys. Rev. B 2020, 102, 014410. [Google Scholar] [CrossRef]
- Lee, S.; Choi, T.; Ratcliff, W.; Erwin, R.; Cheong, S.W.; Kiryukhin, V. Single ferroelectric and chiral magnetic domain of single-crystalline BiFeO3 in an electric field. Phys. Rev. B-Condens. Matter Mater. Phys. 2008, 78, 100101. [Google Scholar] [CrossRef]
- Ratcliff, W.; Kan, D.; Chen, W.; Watson, S.; Chi, S.; Erwin, R.; McIntyre, G.J.; Capelli, S.C.; Takeuchi, I. Neutron Diffraction Investigations of Magnetism in BiFeO3 Epitaxial Films. Adv. Funct. Mater. 2011, 21, 1567–1574. [Google Scholar] [CrossRef]
- Qureshi, N. Mag2Pol: A program for the analysis of spherical neutron polarimetry, flipping ratio and integrated intensity data. J. Appl. Crystallogr. 2019, 52, 175–185. [Google Scholar] [CrossRef]
- Maruyama, S.; Anbusathaiah, V.; Fennell, A.; Enderle, M.; Takeuchi, I.; Ratcliff, W.D. Change in the magnetic structure of (Bi,Sm)FeO3 thin films at the morphotropic phase boundary probed by neutron diffraction. APL Mater. 2014, 2, 116106. [Google Scholar] [CrossRef]


Publisher’s Note: MDPI stays neutral with regard to jurisdictional claims in published maps and institutional affiliations. |
© 2022 by the author. Licensee MDPI, Basel, Switzerland. This article is an open access article distributed under the terms and conditions of the Creative Commons Attribution (CC BY) license (https://creativecommons.org/licenses/by/4.0/).