
Effect of Zeolite Catalyst on the Pyrolysis Kinetics of Multi-Layered Plastic Food Packaging

 , ,
, ,  ,
,  and
and
Abstract
: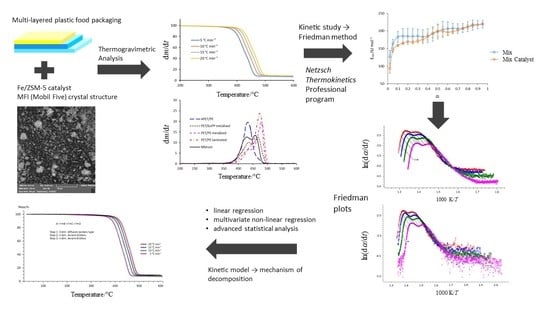
1. Introduction
2. Materials and Methods
2.1. Materials
2.2. Thermogravimetry
2.3. Kinetic Study
- Record the TG measurements performed at different heating rates (at least 4 or 5). The shapes of the TG and DTG (first-order derivative of TG data) curves can indicate the reaction path. When the residual mass varies with the heating rate, it usually indicates branching in the reaction path; otherwise, the reaction path remains unbranched.
- Process the experimental TG data to calculate the activation energy associated with degradation steps by isoconversional methods. According to ICTAC’s guidelines, a kinetic study should start with the precise determination of one parameter without any assumption of a kinetic model (a mechanism). Model-free isoconversional approaches make this achievable. Isoconversional model-free approaches such as those of Ozawa–Flynn–Wall and Kissinger–Akahira–Sunose (integral methods) [40] and Friedman (differential method) [41] are the most commonly utilized methods for kinetic analysis of solid-waste pyrolysis processes. Model-fitting methods are also often used, with the Coats–Redfern method dominating solid-waste pyrolysis research [42,43]. The differential Friedman method was used in this research. Friedman’s differential model-free isoconversional method employs the logarithmic form of the fundamental kinetic equation:
- 3.
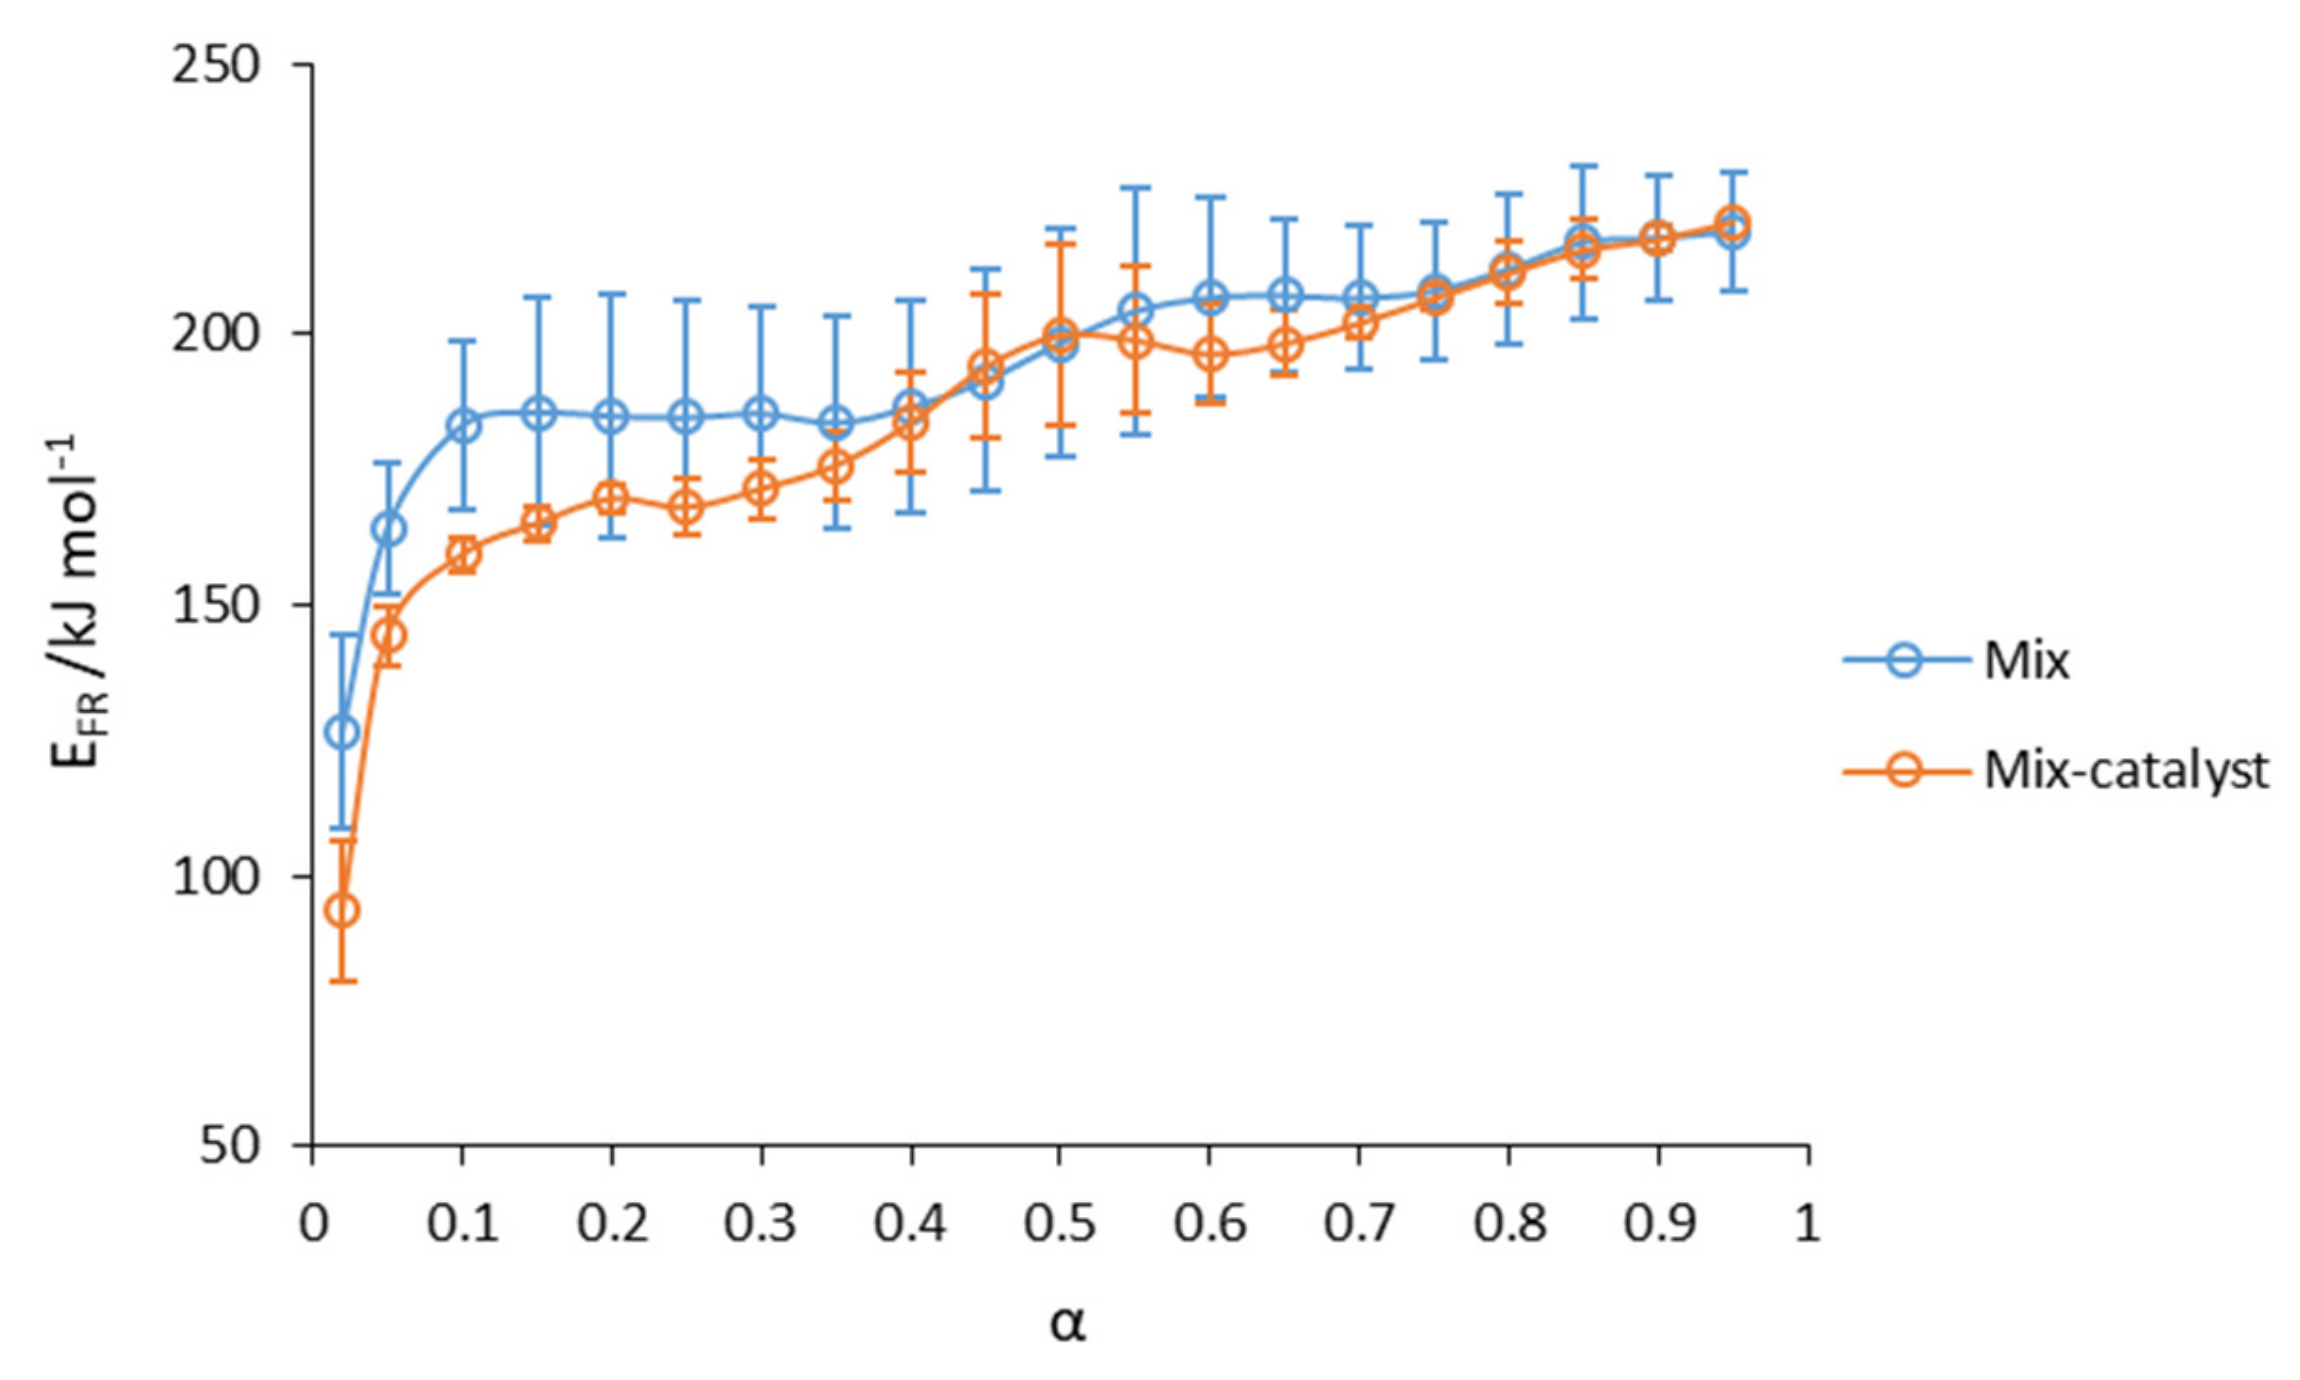
- Plot the obtained activation energy against the degree of conversion. If the highest and lowest calculated values of activation energy values vary by more than 30% from the average value, it is implied that the process is complex and occurs in multiple stages [44]. This demands multivariate non-linear model-fitting regression methods. Otherwise, if it does not vary significantly, the process is simple, and the kinetic model can be determined by using linear model-fitting regression methods to the experimental data.
- 4.
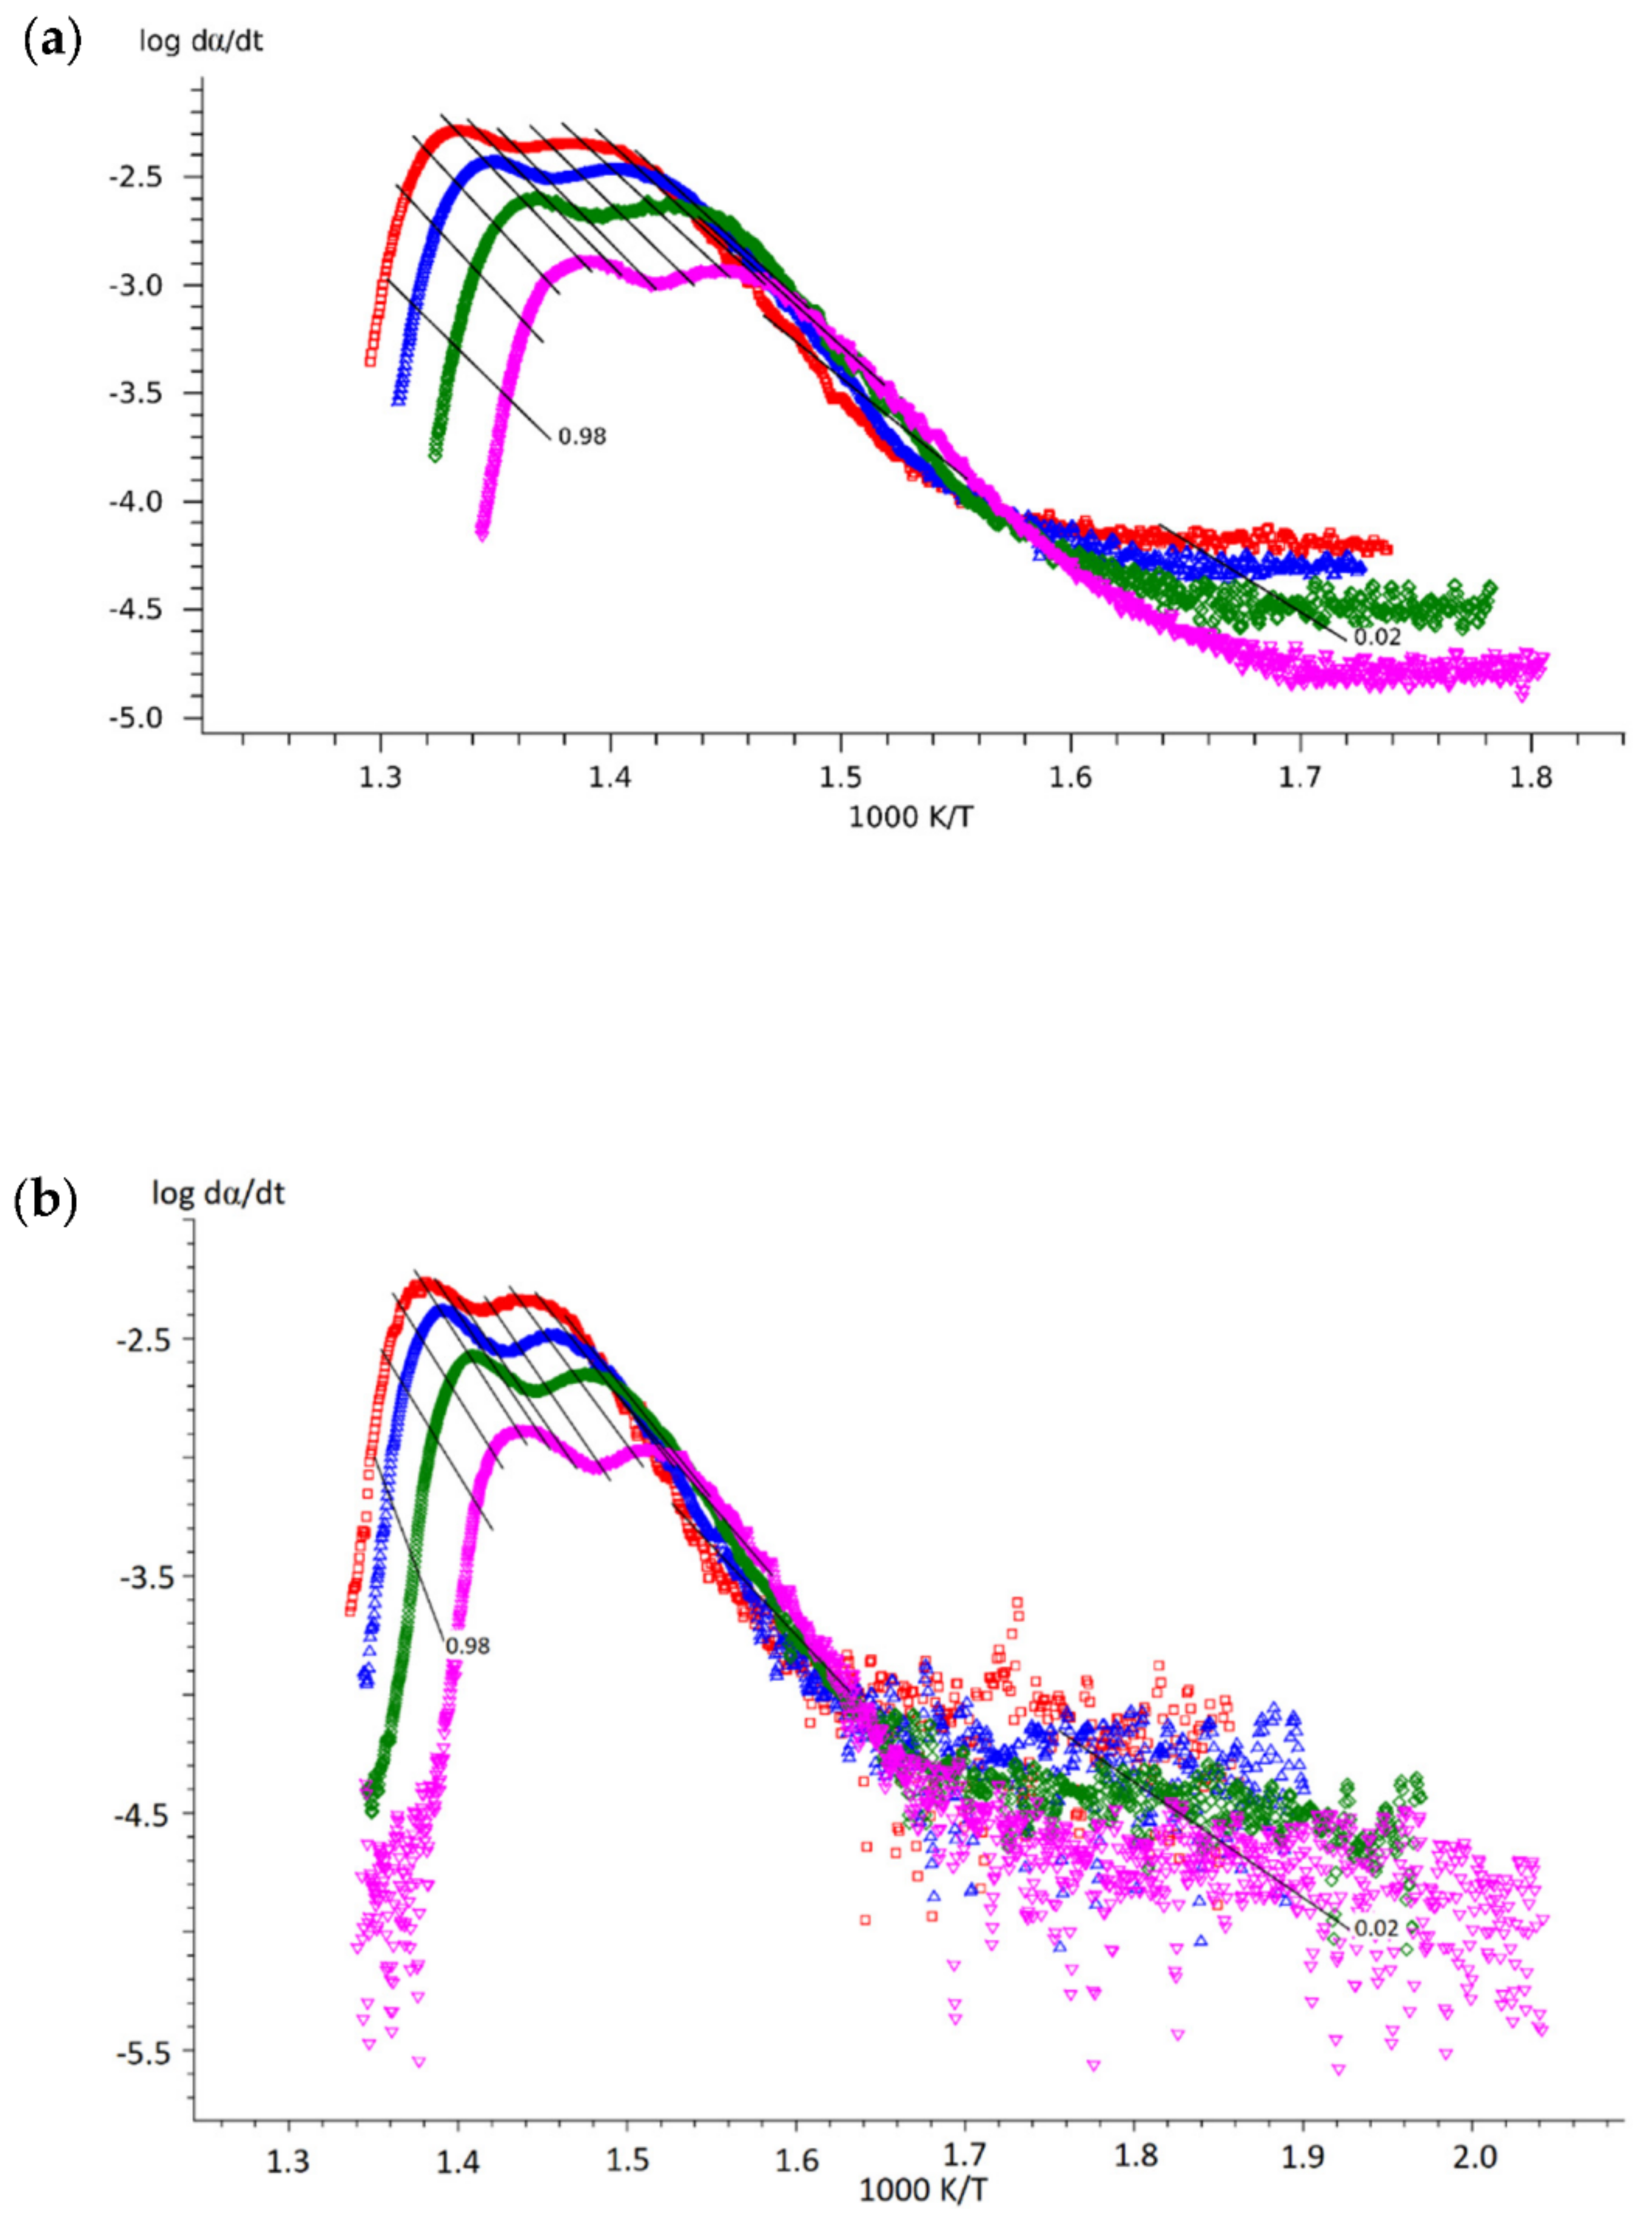
- Obtain Friedman plots from the experimental data (Equation (3)). It is very important to compare the slopes of the experimental data and isoconversional lines by the Friedman method at the beginning of the reaction (0.01 < α < 0.10) since this will give insight into the most probable process at the initial reaction stage:
- The slopes are comparably similar: reaction-order or phase-boundary reaction;
- The slope of the experimental data is lower than the slope of the isoconversional lines: diffusion;
- The slope of the experimental data is steeper than the slope of the isconversional lines: autocatalytically activated reaction type of Avrami–Erofeev.
3. Results and Discussion
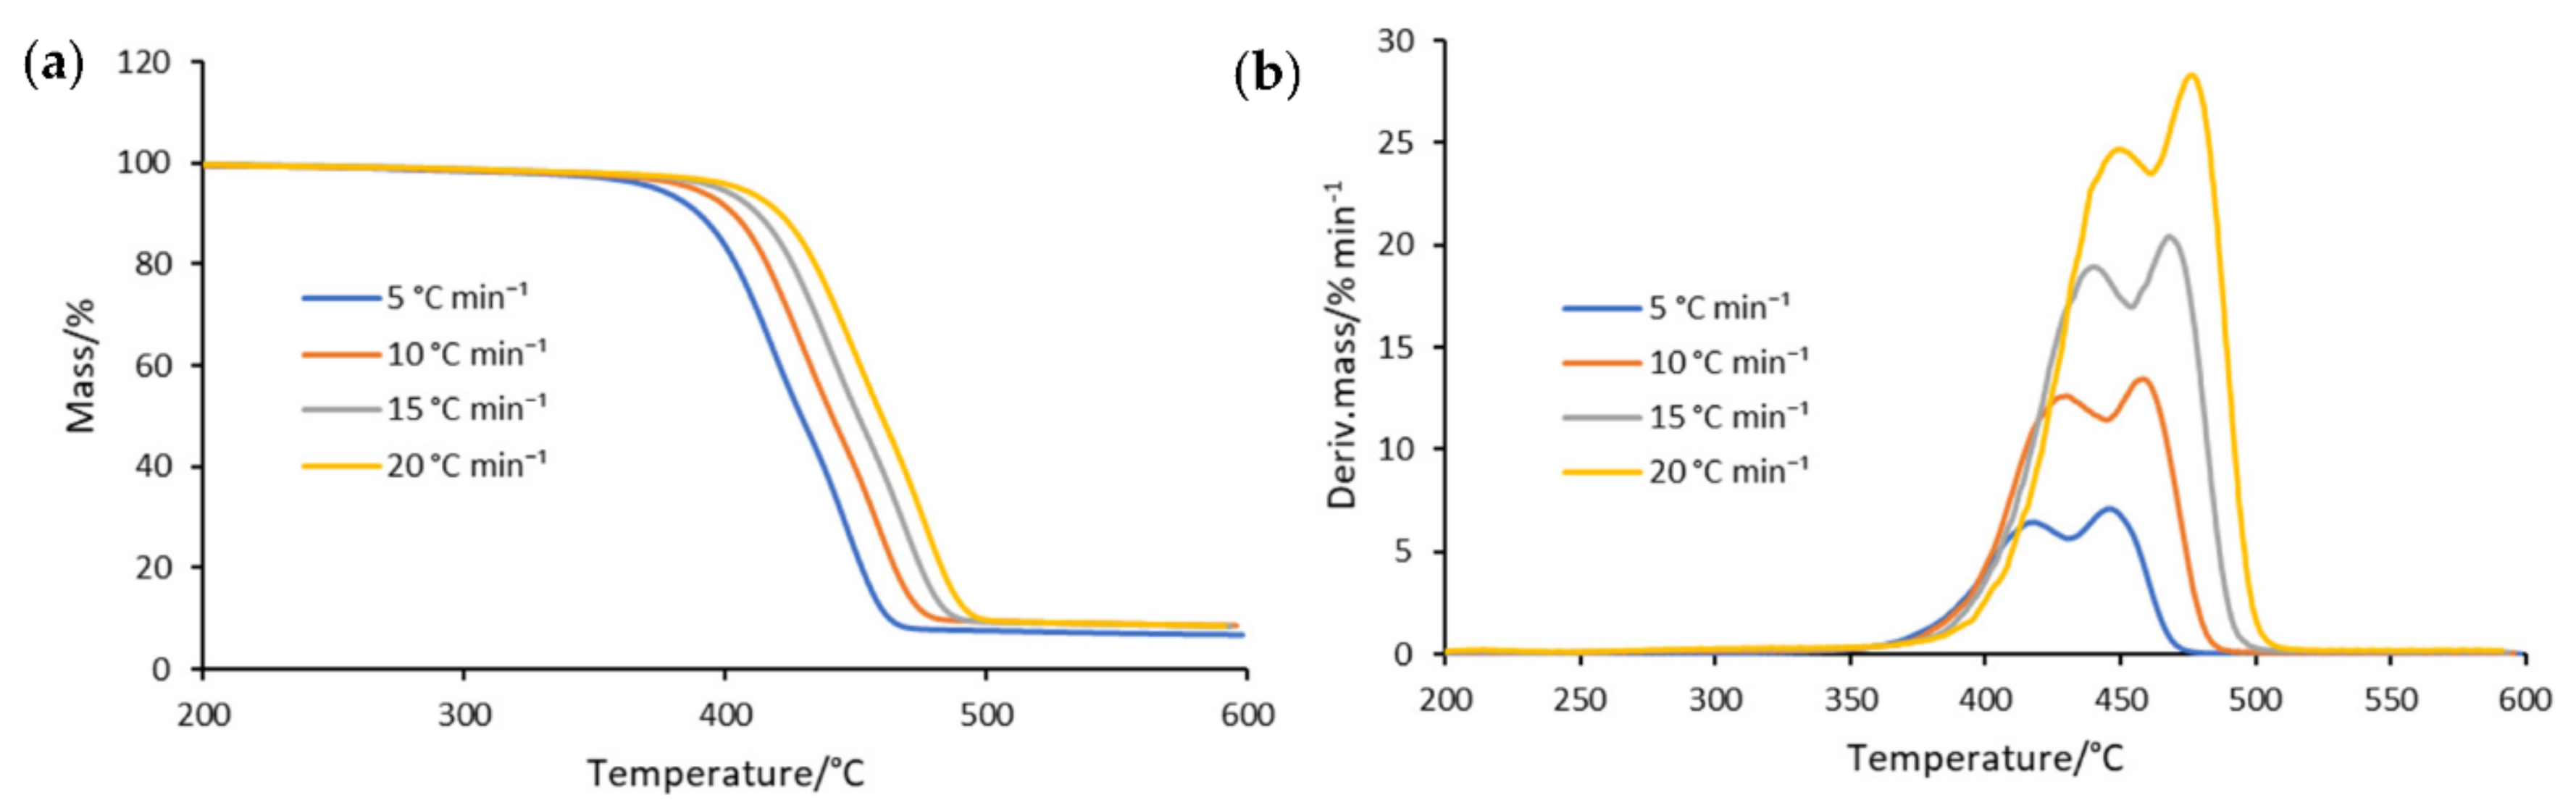
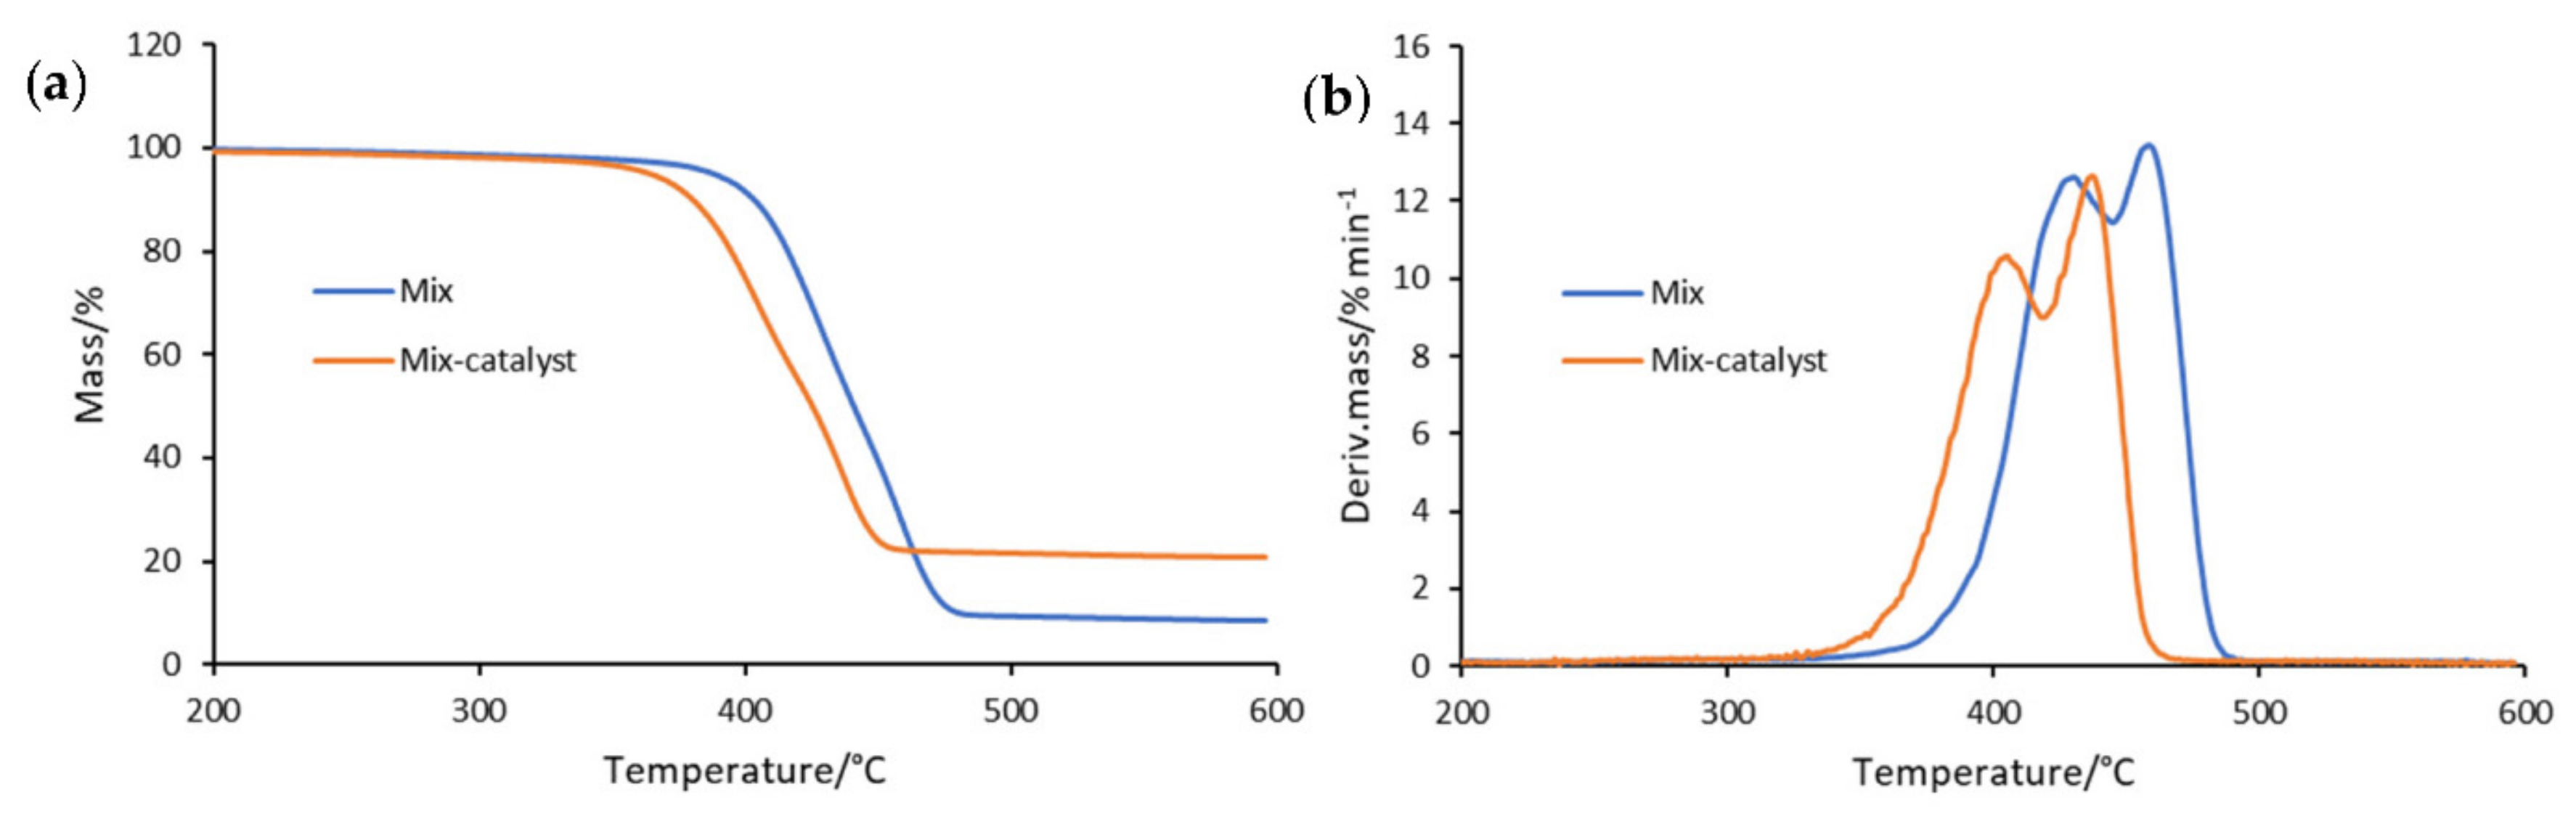
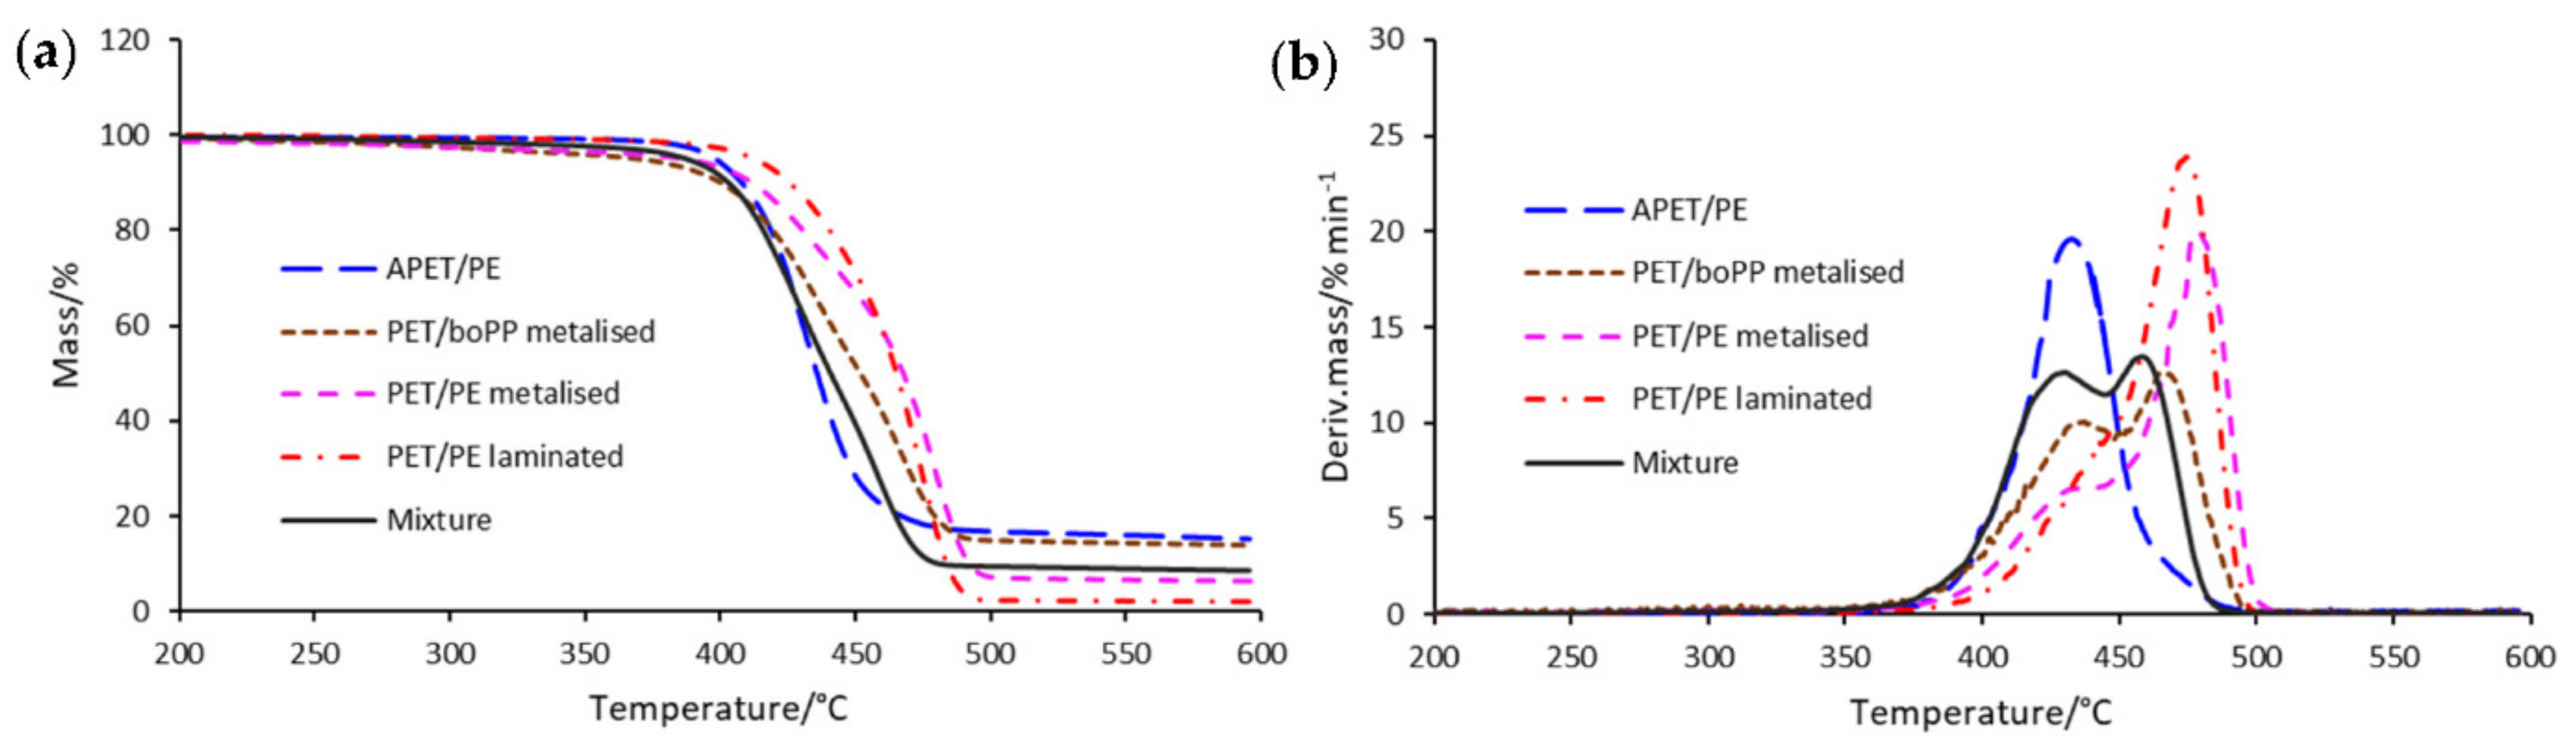
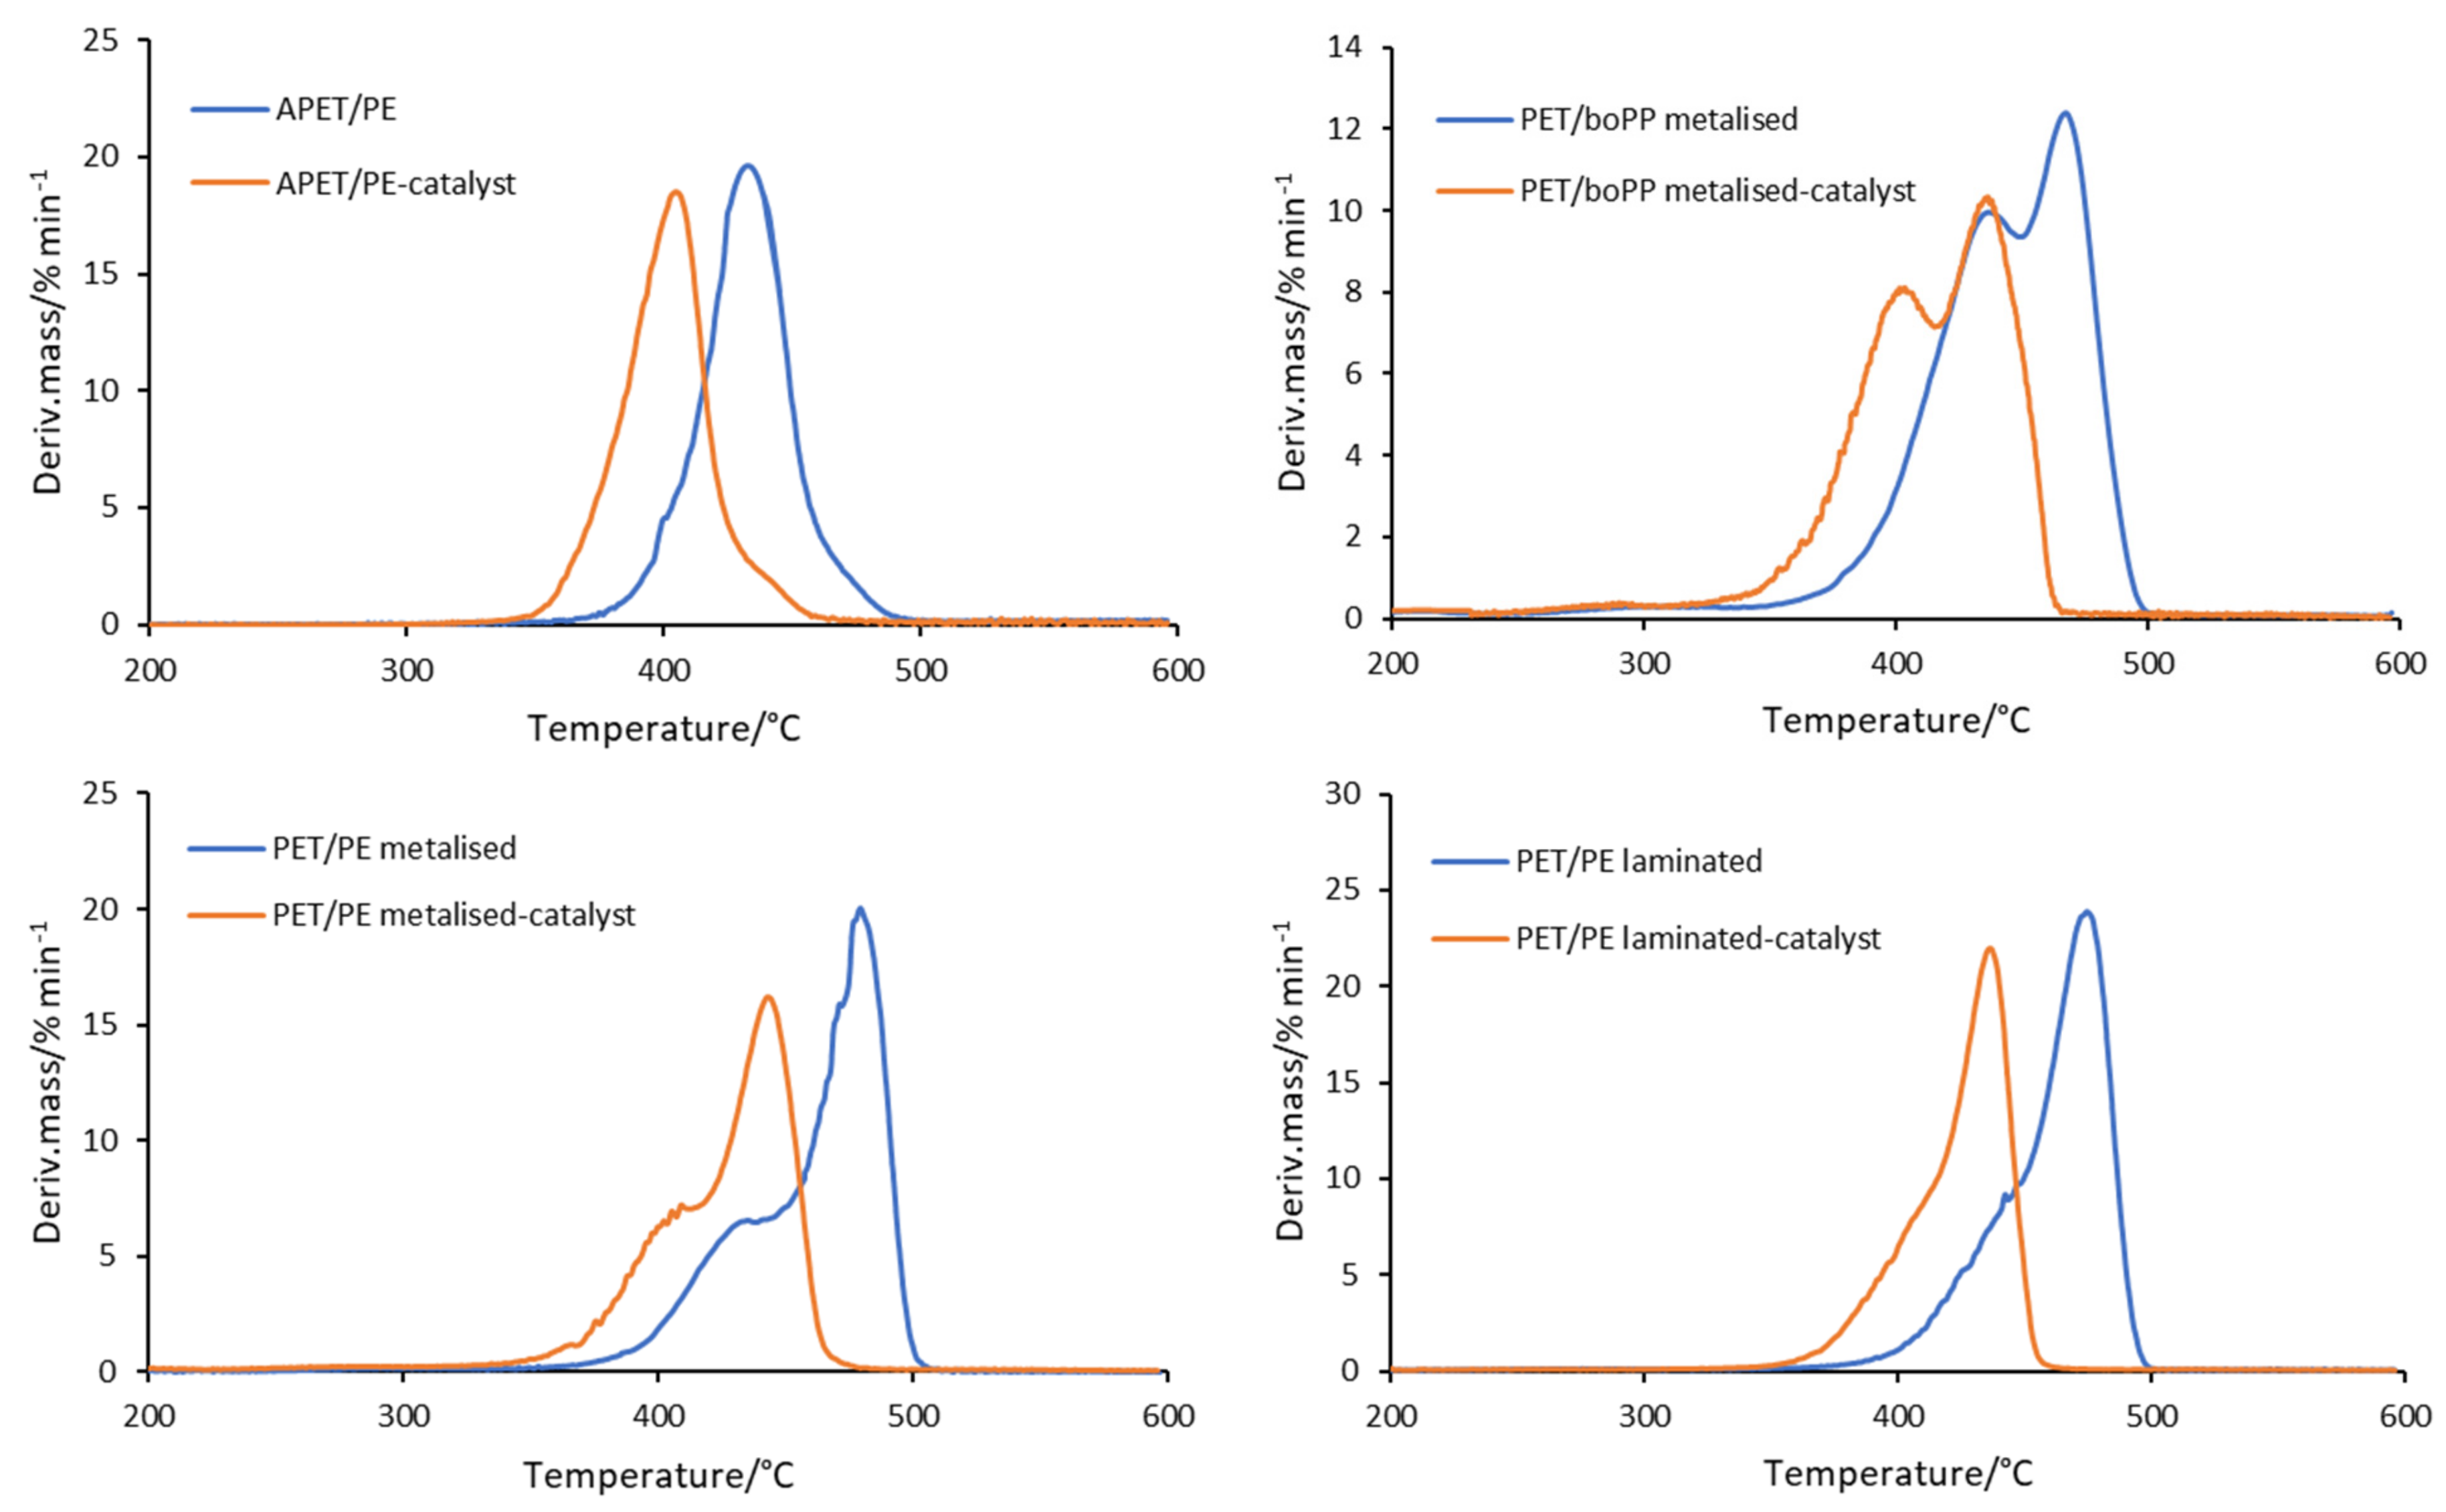
3.1. Thermogravimetric Analysis
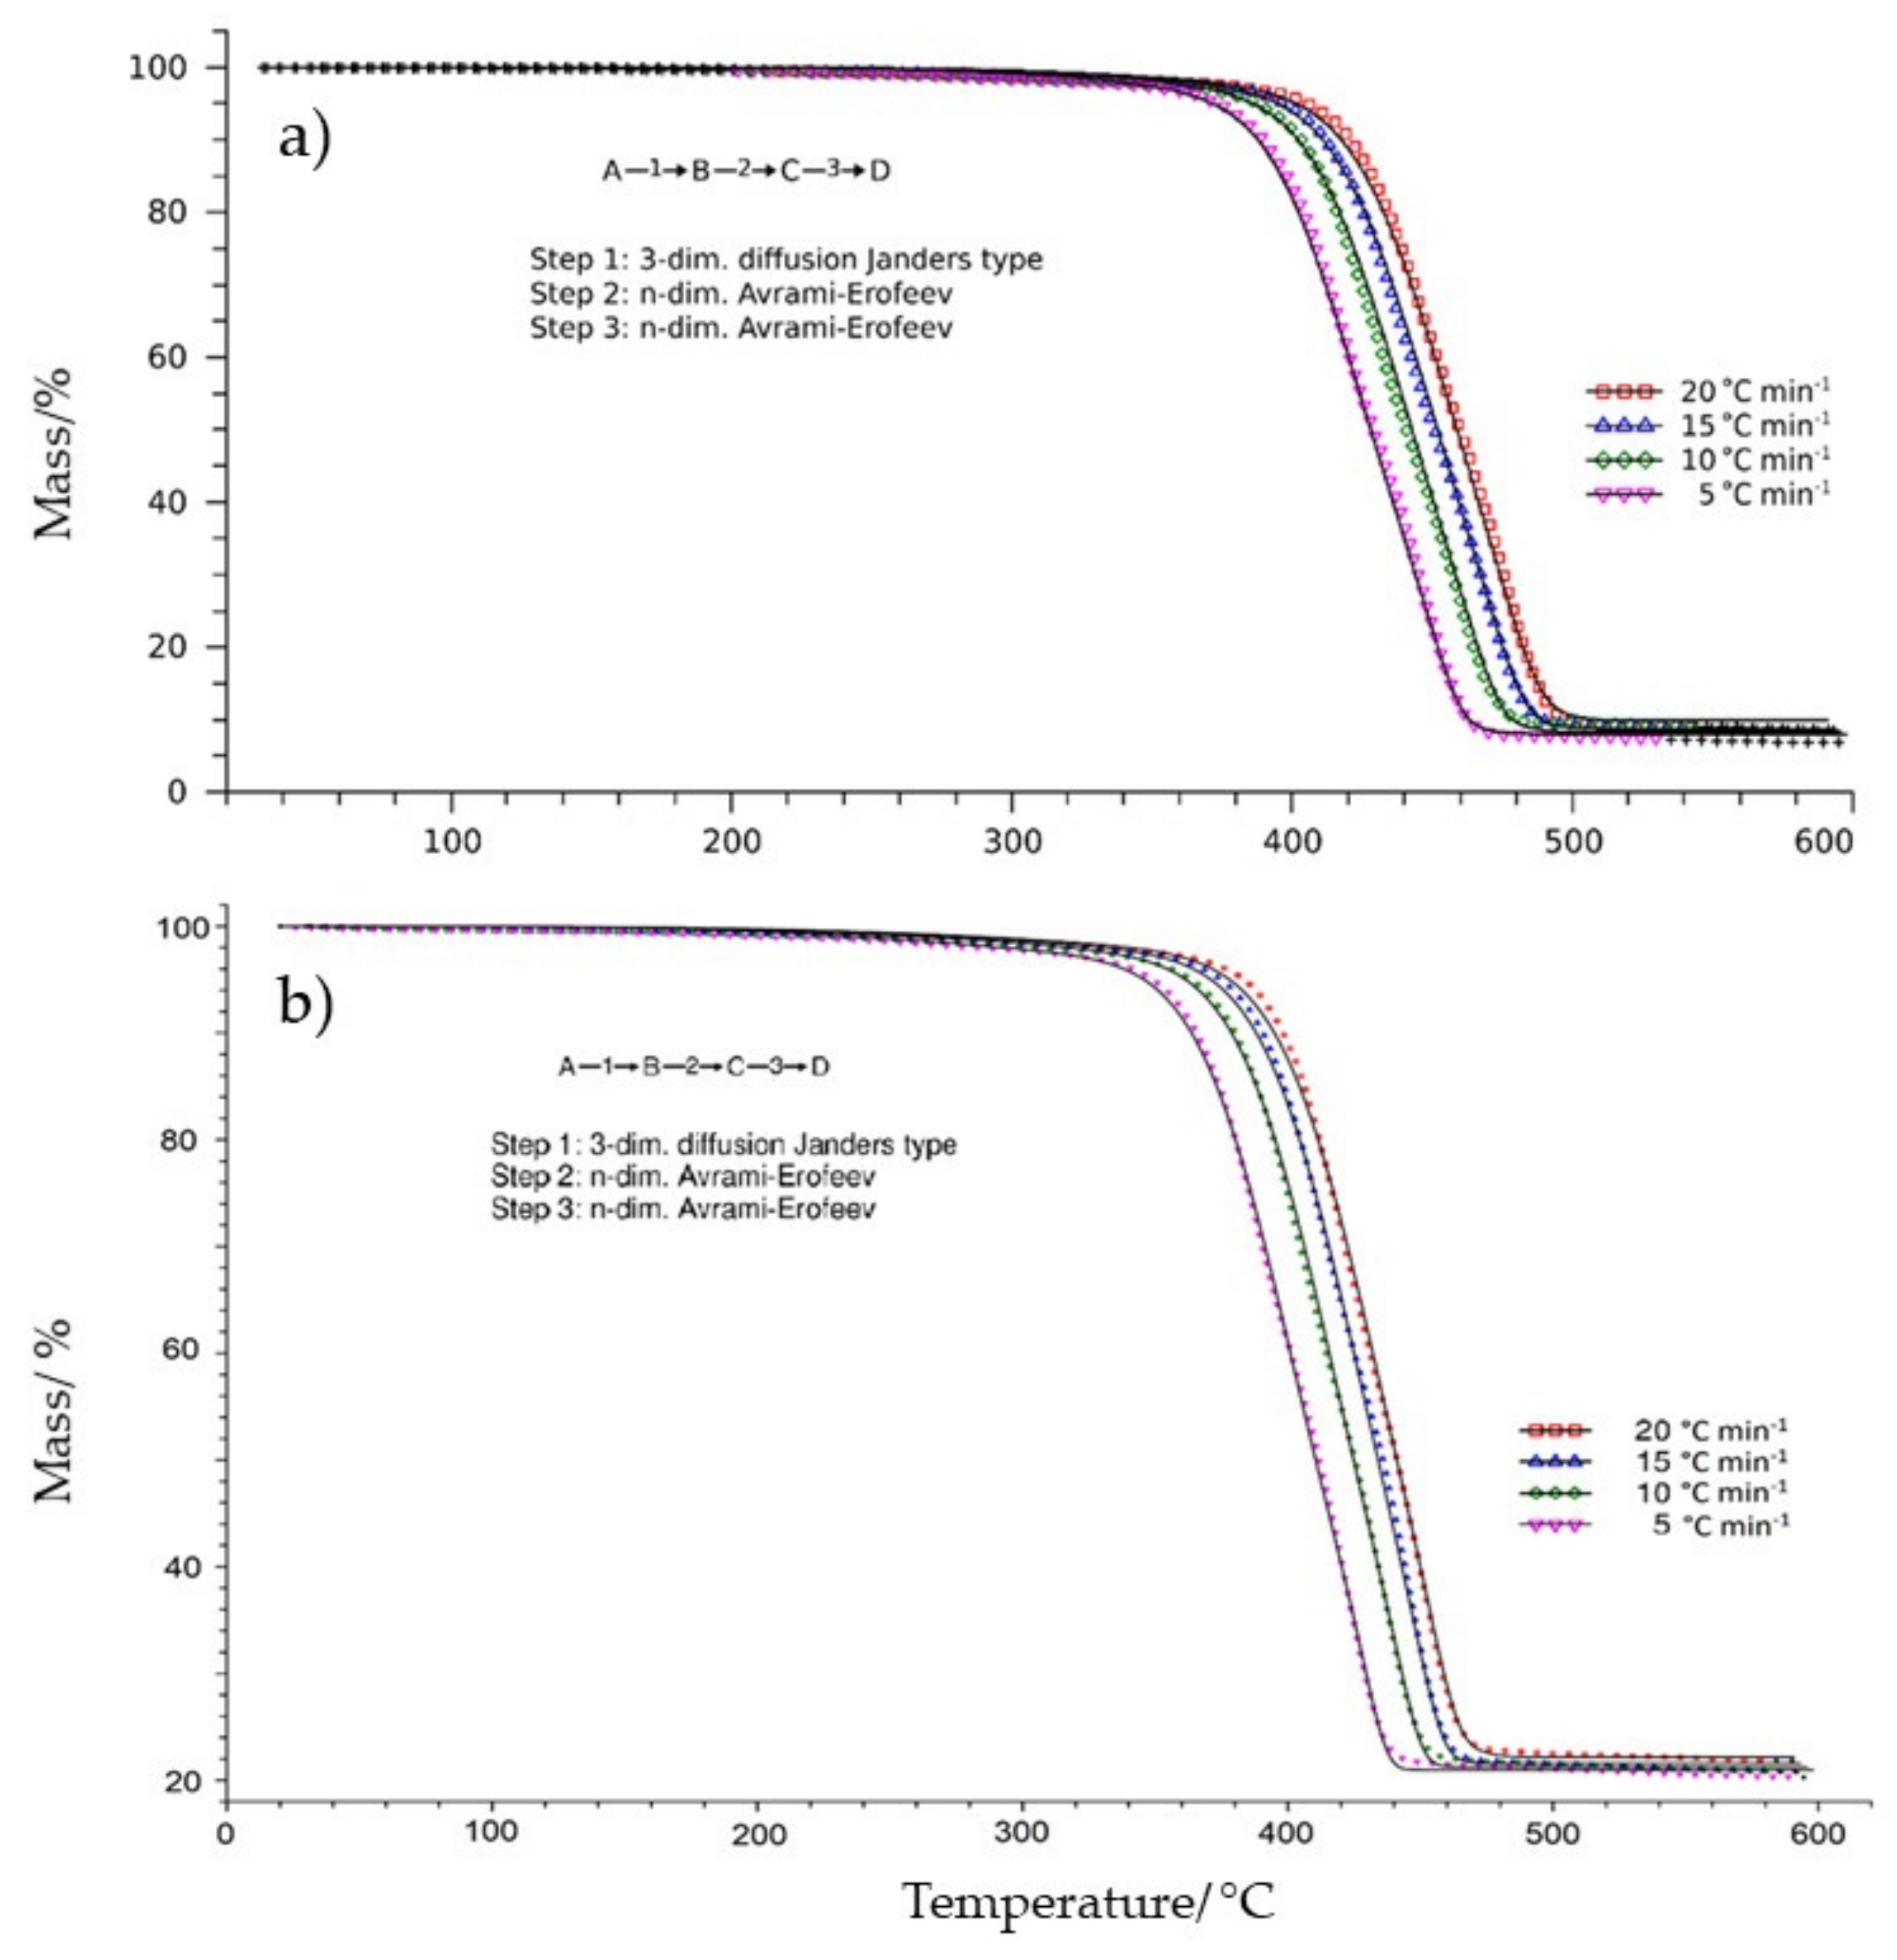
3.2. Results of the Kinetic Study
4. Conclusions
Author Contributions
Funding
Data Availability Statement
Acknowledgments
Conflicts of Interest
References
- Briassoulis, D.; Tserotas, P.; Hiskakis, M. Mechanical and degradation behaviour of multilayer barrier films. Polym. Degrad. Stab. 2017, 143, 214–230. [Google Scholar] [CrossRef]
- PlasticsEurope. An Analysis of European Plastics Production, Demand and Waste Data. 2021. Available online: https://plasticseurope.org/knowledge-hub/plastics-the-facts-2021/ (accessed on 1 May 2022).
- Mumladze, T.; Yousef, S.; Tatariants, M.; Kriukiene, R.; Makarevicius, V.; Lukošiute, S.I.; Bendikiene, R.; Denafas, G. Sustainable approach to recycling of multilayer flexible packaging using switchable hydrophilicity solvents. Green Chem. 2018, 20, 3604–3618. [Google Scholar] [CrossRef]
- Morris, B.A. The Science and Technology of Flexible Packaging: Multilayer Films from Resin and Process to End Use; Elsevier: Amsterdam, The Netherlands, 2016. [Google Scholar]
- Mount, E.M. Coextrusion Equipment for Multilayer Flat Films and Sheets. In Multilayer Flexible Packaging, 2nd ed.; Wagner, J.R., Jr., Ed.; Elsevier: Amsterdam, The Netherlands, 2016; pp. 99–122. [Google Scholar] [CrossRef]
- Niaounakis, M. Recycling of Flexible Plastic Packaging; Elsevier: Amsterdam, The Netherlands, 2019. [Google Scholar] [CrossRef]
- Thoden van Velzen, U.; Weert, L.; Molenveld, K. Flexible Laminates within the Circular Economy; Wageningen Food & Biobased Research: Wageningen, The Netherlands, 2020. [Google Scholar]
- Mieth, A.; Simoneau, C.; Hoekstra, E. Guidance for the Identification of Polymers in Multilayer Films Used in Food Contact Materials; EUR 27816 EN; European Union: The Hague, The Netherlands, 2017. [Google Scholar] [CrossRef]
- Anukiruthika, T.; Sethupathy, P.; Wilson, A.; Kashampur, K.; Moses, J.A.; Anandharamakrishnan, C. Multilayer packaging: Advances in preparation techniques and emerging food applications. Compr. Rev. Food Sci. Food Saf. 2020, 19, 1156–1186. [Google Scholar] [CrossRef] [PubMed] [Green Version]
- Walker, T.W.; Frelka, N.; Shen, Z.; Chew, A.K.; Banick, J.; Grey, S.; Kim, M.S.; Dumesic, J.A.; Van Lehn, R.C.; Huber, G.W. Recycling of multilayer plastic packaging materials by solvent-targeted recovery and precipitation. Sci. Adv. 2020, 6, eaba7599. [Google Scholar] [CrossRef] [PubMed]
- Kaiser, K.; Schmid, M.; Schlummer, M. Recycling of Polymer-Based Multilayer Packaging: A Review. Recycling 2018, 3, 1. [Google Scholar] [CrossRef] [Green Version]
- Horodytska, O.; Valdés, F.J.; Fullana, A. Plastic flexible films waste management—A state of art review. Waste Manag. 2018, 77, 413–425. [Google Scholar] [CrossRef]
- Conversio Market and Strategy GmbH. Global Plastics Flow 2018. 2020. Available online: https://www.carboliq.com/pdf/19_conversio_global_plastics_flow_2018_summary.pdf (accessed on 30 May 2022).
- Tomić, T.; Schneider, D.R. The role of energy from waste in circular economy and closing the loop concept–Energy analysis approach. Renew. Sustain. Energy Rev. 2018, 98, 268–287. [Google Scholar] [CrossRef]
- Tomić, T.; Schneider, D.R. Circular economy in waste management–Socio-economic effect of changes in waste management system structure. J. Environ. Manag. 2020, 267, 110564. [Google Scholar] [CrossRef]
- De Mello Soares, C.T.; Ek, M.; Östmark, E.; Gällstedt, M.; Karlsson, S. Recycling of multi-material multilayer plastic packaging: Current trends and future scenarios. Resour. Conserv. Recycl. 2022, 176, 105905. [Google Scholar] [CrossRef]
- Ragaert, K.; Delva, L.; Van Geem, K. Mechanical and chemical recycling of solid plastic waste. Waste Manag. 2017, 69, 24–58. [Google Scholar] [CrossRef]
- Thiounn, T.; Smith, R.C. Advances and approaches for chemical recycling of plastic waste. J. Polym. Sci. 2020, 58, 1347–1364. [Google Scholar] [CrossRef] [Green Version]
- Anuar Sharuddin, S.D.; Abnisa, F.; Wan Daud, W.M.A.; Aroua, M.K. A review on pyrolysis of plastic wastes. Energy Convers. Manag. 2016, 115, 308–326. [Google Scholar] [CrossRef]
- Mark, L.O.; Cendejas, M.C.; Hermans, I. The Use of Heterogeneous Catalysis in the Chemical Valorization of Plastic Waste. Chem. Sus. Chem. 2020, 13, 5808–5836. [Google Scholar] [CrossRef] [PubMed]
- Ratnasari, D.K.; Nahil, M.A.; Williams, P.T. Catalytic pyrolysis of waste plastics using staged catalysis for production of gasoline range hydrocarbon oils. J. Anal. Appl. Pyrolysis 2017, 124, 631–637. [Google Scholar] [CrossRef]
- Miskolczi, N.; Sója, J.; Tulok, E. Thermo-catalytic two-step pyrolysis of real waste plastics from end of life vehicle. J. Anal. Appl. Pyrolysis 2017, 128, 1–12. [Google Scholar] [CrossRef]
- Kassargy, C.; Awad, S.; Burnens, G.; Kahine, K.; Tazerout, M. Experimental study of catalytic pyrolysis of polyethylene and polypropylene over USY zeolite and separation to gasoline and diesel-like fuels. J. Anal. Appl. Pyrolysis 2017, 127, 31–37. [Google Scholar] [CrossRef]
- Siddiqui, M.Z.; Park, Y.K.; Kang, Y.; Watanabe, A.; Kim, S.; Kim, Y.M. Effective use of aluminum-plastic laminate as a feedstock for catalytic pyrolysis over micro and mesoporous catalysts. J. Clean. Prod. 2019, 229, 1093–1101. [Google Scholar] [CrossRef]
- Veksha, A.; Yin, K.; Moo, J.G.S.; Da Oh, W.; Ahamed, A.; Chen, W.Q.; Weerachanchai, P.; Giannis, A.; Lisak, G. Processing of flexible plastic packaging waste into pyrolysis oil and multi-walled carbon nanotubes for electrocatalytic oxygen reduction. J. Hazard. Mater. 2020, 387, 121256. [Google Scholar] [CrossRef]
- Sivagami, K.; Divyapriya, G.; Selvaraj, R.; Madhiyazhagan, P.; Sriram, N.; Nambi, I. Catalytic pyrolysis of polyolefin and multilayer packaging based waste plastics: A pilot scale study. Process Saf. Environ. Prot. 2021, 149, 497–506. [Google Scholar] [CrossRef]
- Yousef, S.; Eimontas, J.; Striūgas, N.; Zakarauskas, K.; Praspaliauskas, M.; Abdelnaby, M.A. Pyrolysis kinetic behavior and TG-FTIR-GC–MS analysis of metallised food packaging plastics. Fuel 2020, 282, 118737. [Google Scholar] [CrossRef]
- Yousef, S.; Eimontas, J.; Zakarauskas, K.; Striūgas, N. Microcrystalline paraffin wax, biogas, carbon particles and aluminum recovery from metallised food packaging plastics using pyrolysis, mechanical and chemical treatments. J. Clean. Prod. 2021, 290, 125878. [Google Scholar] [CrossRef]
- Eimontas, J.; Striūgas, N.; Abdelnaby, M.A.; Yousef, S. Catalytic pyrolysis kinetic behavior and TG-FTIR-GC–MS analysis of metallized food packaging plastics with different concentrations of ZSM-5 zeolite catalyst. Polymers 2021, 13, 702. [Google Scholar] [CrossRef] [PubMed]
- Cafiero, L.; Fabbri, D.; Trinca, E.; Tuffi, R.; Vecchio Ciprioti, S. Thermal and spectroscopic (TG/DSC-FTIR) characterization of mixed plastics for materials and energy recovery under pyrolytic conditions. J. Therm. Anal. Calorim. 2015, 121, 1111–1119. [Google Scholar] [CrossRef]
- Cafiero, L.; Castoldi, E.; Tuffi, R.; Vecchio Ciprioti, S. Identification and characterization of plastics from small appliances and kinetic analysis of their thermally activated pyrolysis. Polym. Degrad. Stabil. 2014, 109, 307–318. [Google Scholar] [CrossRef]
- Benedetti, M.; Cafiero, L.; De Angelis, D.; Dell’Era, A.; Pasquali, M.; Stendardo, S.; Tuffi, R.; Vecchio Ciprioti, S. Pyrolysis of WEEE plastics using catalysts produced from fly ash of coal gasification. Front. Environ. Sci. Eng. 2017, 11, 11. [Google Scholar] [CrossRef]
- Colantonio, S.; Cafiero, L.; De Angelis, D.; Ippolito, N.M.; Tuffi, R.; Vecchio Ciprioti, S. Thermal and catalytic pyrolysis of a synthetic mixture representative of packaging plastics residue. Front. Chem. Sci. Eng. 2020, 14, 288–303. [Google Scholar] [CrossRef]
- Esposito, L.; Cafiero, L.; De Angelis, D.; Tuffi, R.; Vecchio Ciprioti, S. Valorization of the plastic residue from a WEEE treatment plant by pyrolysis. Waste Manag. 2020, 112, 1–10. [Google Scholar] [CrossRef]
- Santella, C.; Cafiero, L.; De Angelis, D.; La Marca, F.; Tuffi, R.; Vecchio Ciprioti, S. Thermal and catalytic pyrolysis of a mixture of plastics from small waste electrical and electronic equipment (WEEE). Waste Manag. 2016, 54, 143–152. [Google Scholar] [CrossRef]
- Al-Salem, S.M. Feedstock and optimal operation for plastics to fuel conversion in pyrolysis, Plast. to Energy Fuel. Chapter V. Chem. Sustain. Implic. 2018, 117–146. [Google Scholar] [CrossRef]
- Kremer, I.; Tomić, T.; Katančić, Z.; Erceg, M.; Papuga, S.; Parlov Vuković, J.; Schneider, D.R. Catalytic pyrolysis and kinetic study of real-world waste plastics: Multi-layered and mixed resin types of plastics. Clean Technol. Environ. Policy 2022, 24, 677–693. [Google Scholar] [CrossRef]
- Vyazovkin, S.; Burnham, A.K.; Criado, J.M.; Pérez-Maqueda, L.A.; Popescu, C.; Sbirrazzuoli, N. ICTAC Kinetics Committee recommendations for performing kinetic computations on thermal analysis data. Thermochim. Acta 2011, 520, 1–19. [Google Scholar] [CrossRef]
- Erceg, M.; Krešić, I.; Vrandečić, N.S.; Jakić, M. Different approaches to the kinetic analysis of thermal degradation of poly(ethylene oxide). J. Therm. Anal. Calorim. 2018, 131, 325–334. [Google Scholar] [CrossRef]
- Qu, B.; Li, A.; Qu, Y.; Wang, T.; Zhang, Y.; Wang, X.; Gao, Y.; Fu, W.; Ji, G. Kinetic analysis of waste tire pyrolysis with metal oxide and zeolitic catalysts. J. Anal. Appl. Pyrolysis 2020, 152, 104949. [Google Scholar] [CrossRef]
- Straka, P.; Bičáková, O.; Šupová, M. Thermal conversion of polyolefins/polystyrene ternary mixtures: Kinetics and pyrolysis on a laboratory and commercial scales. J. Anal. Appl. Pyrolysis 2017, 128, 196–207. [Google Scholar] [CrossRef]
- Tao, L.; Ma, X.; Ye, L.; Jia, J.; Wang, L.; Ma, P.; Liu, J. Interactions of lignin and LDPE during catalytic co-pyrolysis: Thermal behavior and kinetics study by TG-FTIR. J. Anal. Appl. Pyrolysis 2021, 158, 105267. [Google Scholar] [CrossRef]
- Liu, G.; Liao, Y.; Guo, S.; Ma, X.; Zeng, C.; Wu, J. Thermal behavior and kinetics of municipal solid waste during pyrolysis and combustion process. Appl. Therm. Eng. 2016, 98, 400–408. [Google Scholar] [CrossRef]
- Vyazovkin, S.; Chrissafis, K.; Di Lorenzo, M.L.; Koga, N.; Pijolat, M.; Roduit, B.; Sbirrazzuoli, N.; Suñol, J.J. ICTAC Kinetics Committee recommendations for collecting experimental thermal analysis data for kinetic computations. Thermochim. Acta. 2014, 590, 1–23. [Google Scholar] [CrossRef]
- Netzsch Gerätebau GmbH. Netzsch Thermokinetics Software Manual; Netzsch Gerätebau GmbH: Waldkraiburg, Germany, 2014. [Google Scholar]
- Das, P.; Tiwari, P. Thermal degradation study of waste polyethylene terephthalate (PET) under inert and oxidative environments. Thermochim. Acta 2019, 679, 178340. [Google Scholar] [CrossRef]
- Diaz Silvarrey, L.S.; Phan, A.N. Kinetic study of municipal plastic waste. Int. J. Hydrogen Energy 2016, 41, 16352–16364. [Google Scholar] [CrossRef] [Green Version]
- Abnisa, F.; Wan Daud, W.M.A. A review on co-pyrolysis of biomass: An optional technique to obtain a high-grade pyrolysis oil. Energy Convers. Manag. 2014, 87, 71–85. [Google Scholar] [CrossRef]
- Raveh-Amit, H.; Lemont, F.; Bar-Nes, G.; Klein-BenDavid, O.; Banano, N.; Gelfer, S.; Charvin, P.; Bin Rozaini, T.; Sedan, J.; Rousset, F. Catalytic Pyrolysis of High-Density Polyethylene: Decomposition Efficiency and Kinetics. Catalysts 2022, 12, 140. [Google Scholar] [CrossRef]
- Sethia, G.; Dangi, G.P.; Jetwani, A.L.; Somani, R.S.; Bajaj, H.C.; Jasra, R.V. Equilibrium and dynamic adsorption of carbon monoxide and nitrogen on ZSM-5 with different SiO2/Al2O3 ratio. Sep. Sci. Technol. 2010, 45, 413–420. [Google Scholar] [CrossRef]
- Lv, H.; Zhang, Z.; Fan, L.; Gao, Y.; Zhang, X. A nanocaged cadmium-organic framework with high catalytic activity on the chemical fixation of CO2 and deacetalization-knoevenagel condensation. Microporous Mesoporous Mater. 2022, 335, 111791. [Google Scholar] [CrossRef]


| No. | Composition | Thickness/μm | PET/PE/PP/% | Description and Use |
|---|---|---|---|---|
| 1 | APET/PE | 450/50 | 90.0/10.0/0 | Transparent rigid film used in fresh meat, salami, and quick-prep food packaging |
| 2 | PET/boPP metallized | 12/20 | 37.5/0/62.5 | Metallized flexible film used in snacks and sweets packaging |
| 3 | PET/PE metallized | 12/45 | 21.1/78.9/0 | Metallized flexible film used in snacks packaging and frozen food packaging |
| 4 | PET/PE laminated | 12/75 | 13.8/86.2/0 | Transparent flexible film used in frozen food and sour vegetable packaging |
| 5 | Mixture | - | 71.9/25.1/3.0 | - |
| No. | Sample | Ton/°C | T1/°C | R1/% min−1 | T2/°C | R2/% min−1 |
|---|---|---|---|---|---|---|
| 1 | APET/PE | 398 | 433 | 19.60 | − | − |
| APET/PE-catalyst | 369 | 405 | 18.49 | − | − | |
| 2 | PET/boPP | 369 | 436 | 10.02 | 467 | 12.52 |
| PET/boPPmet-catalyst | 346 | 406 | 8.00 | 438 | 10.17 | |
| 3 | PET/PEmet | 386 | 433 | 6.78 | 478 | 19.9 |
| PET/PEmet-catalyst | 361 | 404 | 6.46 | 442 | 16.22 | |
| 4 | PET/PElam | 413 | − | − | 474 | 23.83 |
| PET/PElam-catalyst | 381 | − | − | 436 | 21.96 | |
| 5 | Mix | 387 | 428 | 12.88 | 458 | 13.71 |
| Mix-catalyst | 363 | 404 | 10.58 | 436 | 12.65 |
| Stage of Reaction | Parameter | Mix | Mix-Catalyst | ||
|---|---|---|---|---|---|
| Statistical Fit | Friedman | Statistical Fit | Friedman | ||
| Stage 1 | E1 (kJ mol−1) | 131.1 | 143.9 | 66.4 | 80.7 |
| log A1 | 7.1 | 8.4 | 2.2 | 3.7 | |
| n | − | − | − | − | |
| Model | D3 | − | D3 | − | |
| Conversion range | 0.00–0.05 | 0.00–0.04 | |||
| Stage 2 | E2 (kJ mol−1) | 200.0 | 191.9 | 197.1 | 177.3 |
| log A2 | 12.7 | 11.8 | 13.1 | 11.1 | |
| n | 0.69 | − | 0.82 | − | |
| Model | An | − | An | − | |
| Conversion range | 0.10–0.65 | 0.05–0.60 | |||
| Stage 3 | E3 (kJ mol−1) | 218.6 | 213.5 | 213.0 | 210.5 |
| log A3 | 13.1 | 13.3 | 13.2 | 13.6 | |
| n | 4.0 | − | 3.9 | − | |
| Model | An | − | An | − | |
| Conversion range | 0.70–0.95 | 0.65–0.95 | |||
Publisher’s Note: MDPI stays neutral with regard to jurisdictional claims in published maps and institutional affiliations. |
© 2022 by the authors. Licensee MDPI, Basel, Switzerland. This article is an open access article distributed under the terms and conditions of the Creative Commons Attribution (CC BY) license (https://creativecommons.org/licenses/by/4.0/).
Share and Cite
Kremer, I.; Tomić, T.; Katančić, Z.; Hrnjak-Murgić, Z.; Erceg, M.; Vecchio Ciprioti, S.; Schneider, D.R. Effect of Zeolite Catalyst on the Pyrolysis Kinetics of Multi-Layered Plastic Food Packaging. Symmetry 2022, 14, 1362. https://doi.org/10.3390/sym14071362
Kremer I, Tomić T, Katančić Z, Hrnjak-Murgić Z, Erceg M, Vecchio Ciprioti S, Schneider DR. Effect of Zeolite Catalyst on the Pyrolysis Kinetics of Multi-Layered Plastic Food Packaging. Symmetry. 2022; 14(7):1362. https://doi.org/10.3390/sym14071362
Chicago/Turabian StyleKremer, Irma, Tihomir Tomić, Zvonimir Katančić, Zlata Hrnjak-Murgić, Matko Erceg, Stefano Vecchio Ciprioti, and Daniel Rolph Schneider. 2022. "Effect of Zeolite Catalyst on the Pyrolysis Kinetics of Multi-Layered Plastic Food Packaging" Symmetry 14, no. 7: 1362. https://doi.org/10.3390/sym14071362
APA StyleKremer, I., Tomić, T., Katančić, Z., Hrnjak-Murgić, Z., Erceg, M., Vecchio Ciprioti, S., & Schneider, D. R. (2022). Effect of Zeolite Catalyst on the Pyrolysis Kinetics of Multi-Layered Plastic Food Packaging. Symmetry, 14(7), 1362. https://doi.org/10.3390/sym14071362