1. Introduction
In recent years, the popularity of mobile internet technology, Facebook, Twitter, Tik Tok, WeChat and other online social network platforms have risen rapidly, gradually changing people’s way of production and life. As social network platforms are not limited by time and space, the interaction between people gradually shifts from offline to online. Therefore, social networks have gradually become an excellent platform for information dissemination and business publicity. The study of social networks is of great significance to the development of society, and influence maximization (IM) has been studied by many scholars because of its important social value.
Influence maximization refers to finding a set of nodes in a complex network through which the greatest spread of influence can be generated [
1,
2,
3]. Domingos and Richardson et al. [
4,
5] for the first study define the influence maximization problem as an algorithmic problem. Subsequently, Kemp et al. [
6] proved that the problem of maximizing influence under a specific propagation model is an NP-difficult problem and proposed a greedy algorithm with an approximate solution of (1–1/e), which is approximated by selecting the nodes with the greatest marginal influence in the network. However, greedy algorithms have low computational efficiency and high time complexity, which are not suitable for large-scale networks.
In order to solve the above problems, the researchers have carried out a lot of research from three aspects—optimizing the operation rules of a greedy algorithms, constructing a new central heuristic algorithm, and applying a intelligent optimization algorithm to explore the influence set. For example, Leskovec et al. [
7] exploited submodularity to improve the greedy algorithm, and proposed the CELF algorithm, which reduced a large number of unnecessary calculations and greatly reduced the time complexity of the greedy algorithm. Goyal et al. [
8] further optimized the CELF algorithm and proposed the CELF++ algorithm. These algorithms are improvements on the greedy algorithm, improving the operation efficiency to a certain extent, but the calculations are still very large, and not suitable for large-scale complex networks.
The heuristic algorithm based on centrality can effectively avoid the problem of low efficiency caused by the large amount of computation of greedy algorithms according to the topology structure and link characteristics of social networks. For example, the heuristic algorithm based on degree centrality [
9] (Degree), the heuristic algorithm based on K-Core centrality [
10] and the heuristic algorithm based on the centrality of Constraint Coefficients [
11]. Such heuristics evaluate the node importance according to the number of neighbors of nodes and their topology structure between neighbors. The advantages of heuristic methods are high in time efficiency, but the calculation results are not accurate enough and prone to influence overlap problems.
In recent years, in order to balance the inefficiency of greedy algorithms and the unsatisfactory performance of heuristics, some scholars have tried to solve effect maximization problems using bionic optimization algorithms [
12,
13,
14,
15,
16,
17,
18], but the results are not obvious. Because the evaluation criteria of the existing optimization algorithms for the influence ability of nodes are not accurate enough, there are problems such as the slow convergence of the algorithm and easy to fall into local optimum. To this end, we try to evaluate node importance based on the contribution of selected nodes to the topological robustness of the network based on the literature [
13]. An improved differential evolution algorithm based on network discreteness (IDDE) is proposed to solve the influence maximization problem in social networks. The method utilizes the symmetry feature that the global connectivity between nodes in the network decreases as the number of target node removals in the social network increases. The main contributions of this article are as follows:
- (1)
According to the change in the network structure after the removal of the target nodes, construct the fitness function based on the discrete number and discrete granularity to evaluate the importance of the target nodes.
- (2)
By improving the variation rules of the traditional differential evolution algorithm, a differential evolution algorithm based on network discreteness (the improved discretization differential evolution (IDDE) algorithm) is proposed.
- (3)
By improving the variation rules of the traditional differential evolution algorithm, a dispersion-based differential evolution algorithm is proposed.
- (4)
Experiments on four real datasets show that the proposed IDDE algorithm outperforms the comparison algorithm.
This article is organized as follows:
Section 2 introduces the related work on influence maximization;
Section 3 gives the definition of the influence maximization problem, and introduces the influence propagation model and the traditional differential evolution algorithm; the proposed FDD algorithm is introduced in
Section 4; the simulation results and analysis based on four different datasets are provided in
Section 5;
Section 6 summarizes this article and looks to future work.
2. Related Work
In order to solve the problem of the low efficiency of greedy algorithms, scholars put forward various heuristic algorithms and bionic optimization algorithms, including degree centrality, closeness centrality, centrality based on k-core and centrality based on the constraint coefficient. The following introduces the working principles of these kinds of algorithms.
The degree centrality [
9] algorithm is the most common method to judge the importance of nodes. The degree of a node represents the number of edges between a node and its neighbors. The greater the degree, the more important the node is considered. When applying the degree centrality method, k nodes with the largest degree are often selected and directly selected as seed nodes. The degree centrality of a node is shown in Equation (1).
In Equation (1), represents the number of edges connecting node i to its neighbors, and N represents the number of nodes in the network.
However, this method has a serious influence overlap problem. In order to solve this problem, Chen et al. [
15] introduced the concept of discount degree and proposed the degree discount heuristic algorithm (degree discount), which calculates the neighbors of seed nodes and effectively reduces the error caused by influence overlap.
The closeness centrality [
9] algorithm measures node importance by the reciprocal of the average distance from one node to the remaining points. The greater the closeness centrality, the more important the node is. When applying the closeness centrality algorithm,
k nodes with short average distance to other nodes are selected to join the seed set. The average distance between node
i and the remaining nodes is expressed as Equation (2).
In Equation (2), N represents the number of nodes in the network and the distance from node i to node j. represents the distance from node i to node j.
The closeness centrality of the node
i is expressed as Equation (3).
The K-Core algorithm proposed by Seidman et al. [
10] can obtain a subgraph of the node degree division and then determine node importance. In order to find k-core quickly and effectively, Batagel et al. [
16] proposed the K-Core decomposition algorithm. Because it can find K-Core in linear time, the algorithm is also called a linear memory algorithm.
The heuristic algorithm based on the constraint coefficient [
11] proposed by Burt et al. in 1992 is used to measure structural holes. The constraint coefficient can describe how closely a node in the network connects with other nodes; and the lower the constraint coefficient, the greater the tightness. The constraint coefficient of the node
i is specifically expressed as Equation (4).
In Equation (4),
represents the degree of constraint when node
i forms structural holes and connects to node
j. The calculation equation of
is expressed as Equation (5).
In Equation (5),
represents the ratio of the shortest path length between node
i and node
j to the sum of the shortest path length of all its adjacent points.
can be calculated by Equation (6).
In Equation (6), represents the shortest path length of node i to j, represents the shortest path length of node j to i, represents the shortest path length of node i to k, and represents the shortest path length of node k to i.
Jiang et al. [
12] introduced the expected diffusion value (EDV) to estimate the influence propagation ability of the seed set and proposed the simulated annealing algorithm combined with the EDV (SAEDV), which is an algorithm to obtain approximate solutions faster at the cost of losing a little accuracy. It can accelerate the speed of problem solving. Gong et al. [
14] proposed discrete particle swarm optimization (DPSO) based on the particle swarm optimization algorithm, which uses the local search strategy to accelerate the convergence process of the discrete particle swarm algorithm in the influence maximization problem, which can effectively and quickly solve the influence maximization problem. Zhang et al. [
17] utilized the complete-three-layer-influence (CTLI) evaluation model in social networks, combined with a novel bacterial foraging optimization algorithm to solve the influence maximization problem. Gu Qiuyang et al. [
18] used the grey Wolf optimization algorithm to measure user influence based on the Shannon entropy index and proposed the GW-CNI algorithm to be applied in the research of influence maximization node identification. Compared with many meta-heuristic algorithms, this algorithm requires a shorter computation time and has higher efficiency.
In the next section, we will first briefly present the classical influence maximization problem, the propagation model, and the differential evolution algorithm. We will then present our novel differential evolution algorithm based on network dispersion.
3. Methodology
3.1. Influence Maximization
Given a social network,
G = (V, E), where
V represents the set of users in the network and E represents the set of relationships between users, the influence maximization problem is to find the seed node set
S with size
k (
k < |V|) and the greatest dispersal ability in the network. The number of nodes activated by the seed set
S under a specific propagation model is represented as
δ(S), and the best seed set is represented as
. The influence maximization problem can be described as Equation (7).
3.2. Diffusion Model
In the influence maximization problem, there are many models describing information transmission in the network [
19,
20,
21], such as the independent cascade model (IC) [
22,
23], the linear threshold model (LT) [
24,
25] and the susceptible–infected–recovered model (SIR) [
26,
27]. This paper is developed based on the
SIR model. In the
SIR model, the whole population was divided into three categories: the susceptible population S (susceptible), the infected population I (infective), and the recovery population R (recovered). The susceptible population refers to those who have not been infected but are highly likely to be infected; the infected population refers to those who have been infected and have the ability to spread; the recovery population refers to those who have been cured and will not be re-infected.
Initially, the nodes in the seed set are infected, and all other nodes are susceptible. In each subsequent time step, the node in the infected state tries to infect each susceptible neighbor node with a probability of . Then, each node in the infected state enters the recovery state with a probability of , and the recovered node is no longer infected and cannot infect the other nodes. When there are no infected nodes in the network, the propagation stops. For the convenience of calculation, this paper sets .
3.3. The Differential Evolution Algorithm
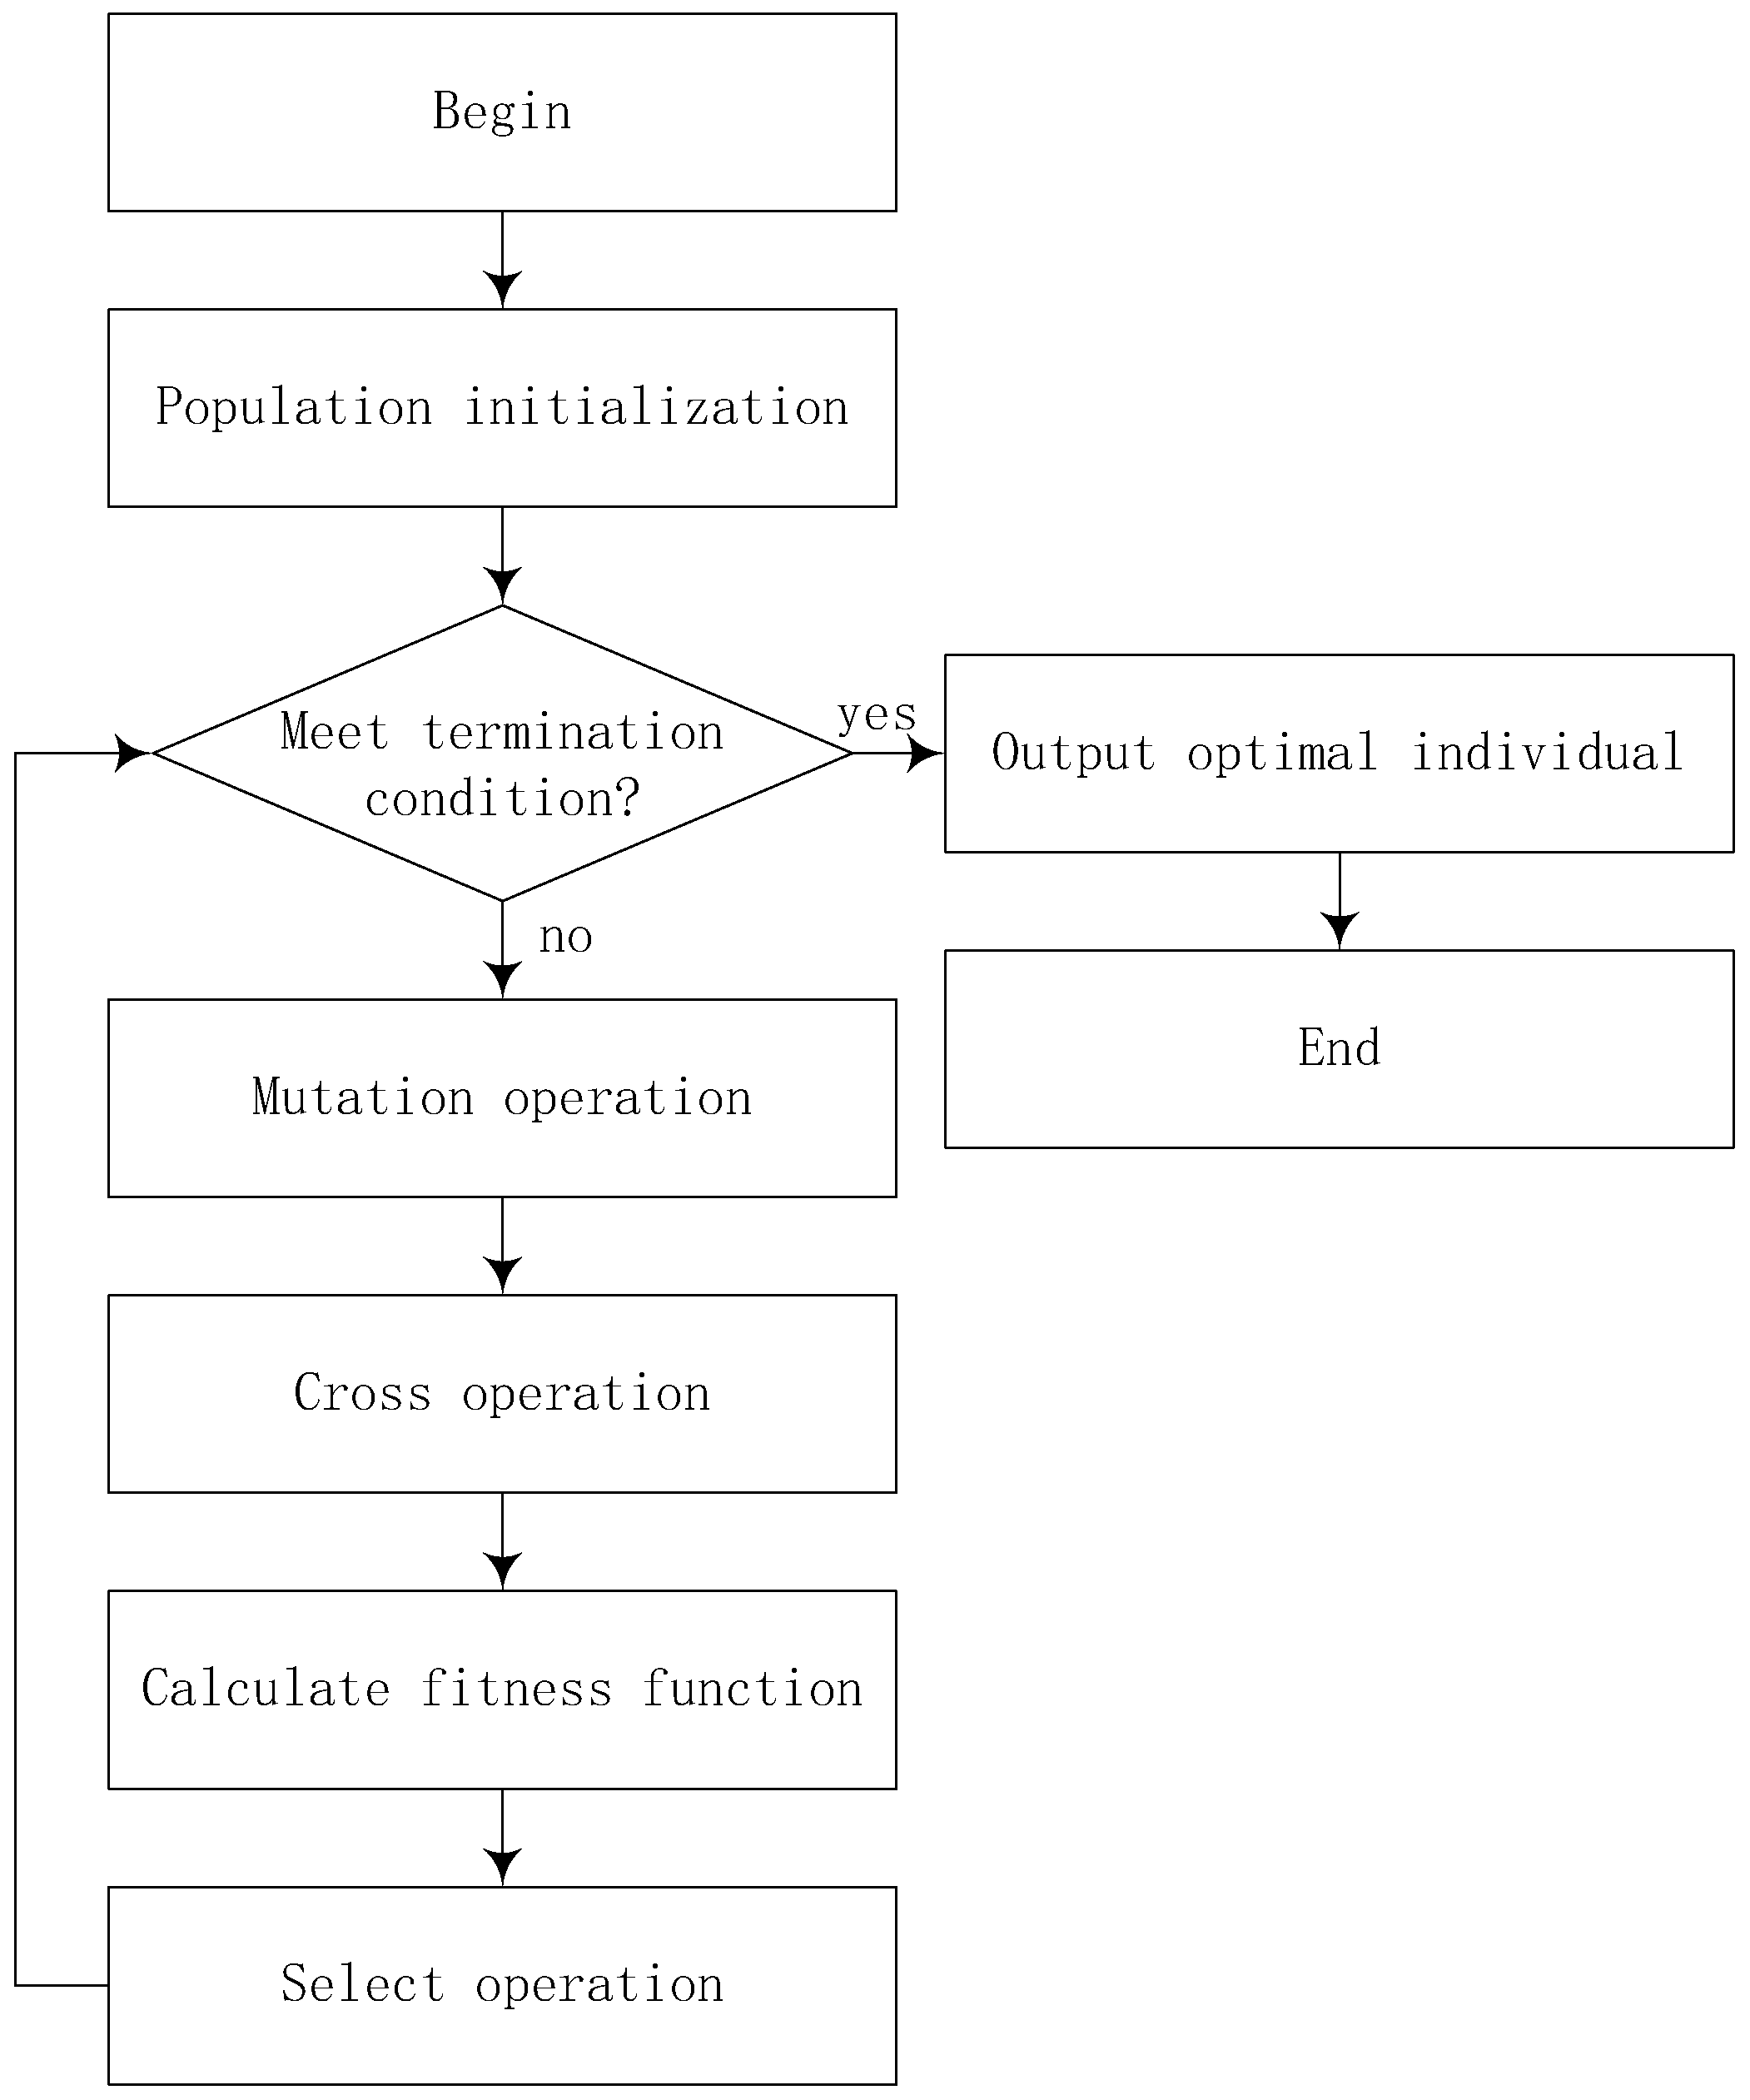
The differential evolution algorithm (DE) is a swarm intelligent optimization algorithm, which is an intelligent optimization search algorithm based on the cooperation and competition among individuals within the group. It was originally proposed by Rainer Storn and Kenneth Price [
28]. The process of the differential evolution algorithm (DE) is similar to that of standard evolution algorithms (EA), including initialization operation, mutation operation, crossover and selection operation. The flow of the algorithm is shown in
Figure 1.
As shown in
Figure 1, the mutation operation of the differential evolution algorithm is to mutate the target individual through the scale difference between individuals to produce new mutated individuals. Then, the mutation individual is crossed with the target individual to produce the experimental individual. Finally, compare the experimental individual with the target individual, select the better individual, and the selected individual will be saved in the next-generation population. This cycle is continued until the termination condition is met, and then the optimal individual is selected from the population.
There are many forms of mutation operation in the differential algorithm, and this paper uses the DE/rand-to-best/1/bin mutation strategy [
28], which is formulated as Equation (8).
where
and
F can be expressed as Equations (9) and (10).
and are two different individuals, is the variation factor, F is the scaling factor, is the maximum number of iterations, and G is the current number of iterations. At the beginning of the algorithm, the scaling factor F is to maintain individual diversity. With the increase the number of iterations, the scaling factor F gradually decreases and approaches in the later stage, to retain good individuals and avoid the destruction of the optimal solution.
Differential evolution algorithms need to measure the quality of individuals in a population in terms of their ability to adapt to the environment (fitness function is used here). Individuals with high fitness have a higher probability of surviving in the population, while individuals with low fitness will be gradually eliminated in the process of evolution. According to the evolution process of the differential evolution algorithm, the population evolves through mutation, crossover, selection and other operations. Among them, the selection operation is the key step to improve the population quality, and the selected individuals are better individuals which have greater fitness values.
In the influence maximization problem, the selected individual should be a set of nodes with a large influence propagation range. Nodes with large influence range in social network are often very important, so the fitness function is used to evaluate the importance of node set in social network.
3.4. The Differential Evolution Algorithm Based on Network Dispersion
Based on the differential evolution algorithm, this paper proposes a differential evolution algorithm based on network discreteness (IDDE). The implementation process of the algorithm needs to discretize the solution space. According to the DPSO algorithm proposed by Maoguo Gong et al. [
14]., the individual mutation rule is improved. This section describes the specific process of the algorithm in detail.
3.4.1. Fitness Function
The research shows that social relationship networks often have the scale-free network symmetry characteristics [
29], which intuitively shows that the degree of most nodes in the network is small and only a few nodes are large, that is, the degree of nodes in the social relationship network is approximately power-law distribution. In case of malicious damage, scale-free networks are more vulnerable to damage. Once the failure ratio of important nodes in the network is in the range of 5–10%, the network connectivity will collapse greatly [
30,
31]. In this paper, the fitness function
is defined according to the phenomenon of the network splitting caused by removing important nodes, which includes the dispersion and discrete granularity components, as shown in Equation (11).
In the above equation, S represents the set of network nodes, t represents the dispersion, namely the number of split blocks of the network after removing the nodes, represents the size of each discrete part, and u represents the average size of the discrete parts, which is expressed as .
In applying the fitness function Fit(∙) to evaluate the importance of nodes in a social network, we first analyze the network dispersion of the target node, and the larger the value of network dispersion, the better the individual is. When the network discreteness is the same, the discrete granularity of the target node needs to be considered. We believe that the more homogeneous the discrete granularity of the network, the more the network is affected, that is, the more important the target node is in the network. For example, when we try to attack a small network with node size 100, the network splits into two parts of size 49 and 50 when attacking node m, while the network splits into two parts of size 1 and 99 when attacking node n. In the case that the network is also split into two parts, it is obviously that attacking node m leads to a greater impact on the network and node m is more important in the network.
3.4.2. Population Initialization
In order to adapt to the calculation of influence maximization in social networks, the IDDE algorithm needs to discretize the individual vector, and use the k-dimensional vector to represent the ith individual in the population. Each element in the individual represents a node in the network. Similarly, the vector is used to represent the mutant individuals obtained after mutation operation, and the vector is used to represent the experimental individuals obtained after crossover operation. Each individual in the population is a viable solution to the influence maximization problem, and the purpose of the IDDE algorithm is to find the individual with the largest fitness function value in the population which is the optimal solution.
Firstly, the IDDE algorithm needs to initialize the population. In order to improve the convergence speed, this paper constructs the initial population according to the degree ranking method and uses the perturbation mechanism to adjust the population to ensure the individual diversity of the initial population. This process is to set a random perturbation factor between [0,1] for each dimension vector of the individual. If the perturbation factor is greater than 0.5, the current dimension of the individual needs to be randomly replaced with a node that does not duplicate other dimensions of the current individual; Otherwise, the current dimension of the individual remains unchanged. The initialization process is described in Algorithm 1.
| Algorithm 1 Initialization_node (G, NP, k) |
Input: Graph G = (V, E), the size of population NP, the size of the seed set k.
Step 1 X ← Max_Degree(G, NP, k);
Step 2 for each do
Step 3 p ← nodes that do not duplicate the current seed set
Step 4 for each do
Step 5 if random > 0.5 and len(p) then
Step 6 replace with the node in p
Step 7 end if
Step 8 end for
Step 9 end for
Output: The initial population X. |
In Algorithm 1, Step 1 means that according to the distribution of node degrees in the social network, the maximum degree nodes in the top k are successively taken out to initialize the population. Steps 2–9 represent the disturbance changes to the population, increase individual diversity and prevent premature falling into local optima. Where len(p) is to prevent the situation that the particle definition is too large and the network is small, resulting in no nodes to be selected.
3.4.3. Mutation Operation
In order to effectively solve the problem of influence maximization, this paper sets the target individual identification vector according to the operation rules of similarity intersection set proposed in reference [
14] and sets the discrete mutation operation is expressed as Equation (12).
In Equation (12), is the identification vector of the target individual vector, expressed as , where corresponds to the jth dimensional vector of particle i. F represents the variation factor, and the symbol “” represents the difference operation. indicates the difference analysis between the individual and the current optimal individual . If a dimension of the particle is not included in the optimal individual, the current dimension ID of the individual is set to 1, otherwise set to 0. Nodes with ID 0 tend to be reserved, and those with ID 1 of individual dimension should be adjusted according to the threshold. indicates a comparison of random individual differences. The purpose of this operation is to maintain individual diversity. is the inertia factor, which indicates the cumulative influence of the results of the previous iteration on the current round of calculating . Experiments show that the effect is the best when .
In addition, in order to prove the necessity of the existence of part in the equation, we propose the variant algorithm HADE of the IDDE algorithm. The difference between this algorithm and IDDE is that it does not retain the comparison of random individual differences in the algorithm, which removes part of equation to realize the screening of optimal individuals. In the experimental part, we make a detailed comparison between the effects of HADE and IDDE.
After the identification vector
is calculated, we stipulate that when
is greater than 2, the node
in individual
will be randomly replaced with a non duplicate node, otherwise it will remain unchanged. The specific equation is expressed as Equation (13).
3.4.4. Crossover Operation
The purpose of crossover operation is to exchange part of the genetic information of two individuals, so as to generate more new individuals, expand the population scale and enrich the individual gene types in the population. We used the mutant individual vector and the target individual vector to carry out binomial intersection to generate the experimental individual vector, which not only retains the information of the original individual, but also increases the information of the mutant individual and enriches the individual diversity in the population. The binomial crossover operation equation is expressed as Equation (14).
In the above equation, represents a random number between [0,1]; represents the crossover probability, and its value range is [0,1], which is used to control the cross-matching process between the target individual vector and the mutant individual vector ; represents a randomly selected sequence, ensuring that can obtain at least one parameter from to ensure that the crossover process is meaningful. At the same time, there cannot be duplicate nodes in , and if the same nodes exist, they will be replaced randomly.
3.4.5. Select Operation
The selection operation is to measure the quality of individuals in the population according to the fitness value, retain excellent individuals, and improve the overall fitness value of the population. The specific process is to compare the fitness value of the target individual vector and the experiment individual vector in the original population and select the individual vector with better fitness value to enter the next stage of the cycle. The rules for selecting operation are represented as Equation (15).
In Equation (15), represents the selected individual. Firstly, the network dispersion function of two individuals is compared. If the value of is different, the individual with larger value of is selected for retention. Otherwise, compare the value of the network discrete granularity function , and select the individual with smaller value to keep. The selected individuals form the next-generation population and continue to iterate until the iteration termination conditions are satisfised.
3.4.6. Algorithm Implementation
The overall framework of the IDDE algorithm is shown in Algorithm 2.
| Algorithm 2 The framework of the IDDE algorithm for influence maximization |
| Input: Graph G = (V, E), the size of population NP, the number of iterations max_steps, the inertia factor , the size of the seed set k, the crossover probability CR and the variation factor . |
| Step 1 Initialization: |
| Initialize population X: |
| X ←Initialization_node (G, NP, k) |
| Step 2 Calculates the fitness value of individuals in the current population and select the optimal individual . |
| Step 3 Begin cycling: |
| Step 3.1 Mutation: |
| Update the vector V by Equation (13) |
| Step 3.2 Crossover: |
| Update the vector U by Equation (14) |
| Step 3.3 Selection: |
| Calculates the fitness value |
| Update the vector X by Equation (15) |
| Select the optimal individual |
| Step 4 Stop criteria: |
| if gen = max_steps, stop the algorithm; |
| otherwise, let gen ← gen + 1 and go to Step 3.1; |
| Output: Output the best vector as the seed set |
In Algorithm 2, Step 1 represents the initialization of the population using Algorithm 1; Step 2 selects the optimal individual in the current population according to the fitness function; Step 3 performs individual mutation, crossover and selection operations according to Equations (13)–(15) in each iteration. If the current iteration number is equal to the maximum iteration number, exit the loop. Finally, the optimal individual in the current population is selected according to the fitness function and output the optimal individual, which is the seed set S.
3.4.7. Time Complexity
We analyze the time complexity of the IDDE algorithm. As described in
Section 4.2, the population initialization method based on degree ranking includes two parts. The maximum degree node screening process requires selecting
NP particles with k dimensions, and the time complexity is
. The disturbance part needs to analyze the disturbance of each dimension of each particle, and the time complexity is also
. Therefore, the time complexity of the population initialization process is
. The time complexity of the IDDE algorithm is mainly concentrated in Step 3 of Algorithm 2, where max_steps is used to represent the number of iterations. Step 3.1 represents the mutation operation, which requires the
step basic operation. Step 3.2 represents a crossover operation that requires the
step basic operation. Step 3.3 represents the selection operation to complete the screening of the optimal individual. The time complexity of the process is
, and the time complexity of calculating the fitness function value in the algorithm is
. Therefore, the worst-case time complexity of the
IDDE algorithm is
, and the final result is
.
4. Experiments and Discussion
In this paper, experiments are conducted on four datasets of different sizes to test the influence of variation factor, crossover probability, inertia factor, iterations, population size, and model parameters on the IDDE algorithm, through the comparative analysis of six benchmark algorithms, we confirm that the differential evolution algorithm based on discreteness IDDE has obvious advantages in propagation range and time efficiency.
4.1. Datasets
To verify the performance of the IDDE algorithm proposed in this paper to solve the influence maximization problem, we conducted experiments on four real datasets fb-pages-food, soc-wiki-vote, ia-email-univ and tech-routers-rf. Available online:
https://networkrepository.com/ (accessed on 15 October 2019). Among them, the fb-pages-food dataset is a network of Facebook pages about mutual likes, describing the data about Facebook pages in November 2017, the nodes represent the pages, and the edges between two nodes are mutual likes between them. The soc-wiki-vote dataset is a Wikipedia voting network that contains all Wikipedia voting data from the time Wikipedia was founded until January 2008. The nodes in the network represent Wikipedia users, and the directed edge from node x to node y indicates that user x votes for user y. The ia-email-univ dataset is an email communications network at the University of Rovira i Virgili in Tarragona, southern Catalonia, Spain. Nodes represent users, and edges between nodes indicate that at least one email was sent between users. The tech-routers-rf dataset is a router technology network. The statistical characteristics of the four datasets are shown in
Table 1.
4.2. Parameter Experiment
In this subsection, we analyze the influence of the proposed IDDE algorithm parameters on the values of the fitness function and obtain the optimal values for each parameter.
4.2.1. Variation Factor, Crossover Probability, and Inertia Factor
To facilitate the experiment, we set the number of iterations max_steps to 200, the population size NP to 15, and the initial seed subset size k to 10.
First, keeping the inertia factor w = 0.5, crossover probability CR = 0.1, the social network discrete number T(S) value with the variation factor F0 = {0.1, 0.1, 0.2, 0.3, 0.4, 0.5, 0.6, 0.7, 0.8, 0.9, 1.0} is shown in
Figure 2. It can be seen that with the increase in variation factor F0, the fitness value of the IDDE algorithm on the dataset fb-pages-food, soc-wiki-vote and ia-email-univ basically tends to be stable when F0 = 0.5, and there is little fluctuation in the interval {0.5, 1}. On the dataset tech-routers-rf, the fitness value reached the maximum when F0 = 0.5. Therefore, we set the variation factor F0 to 0.5.
Then, keeping the inertia factor w = 0.5 and the variation factor F0 = 0.5, in the case of crossover probability CR = {0.1, 0.2, 0.3, 0.4, 0.5, 0.6, 0.7, 0.8, 0.9, 1.0}, the value of the social network discrete number T(S) varies with CR, as shown in
Figure 3. It can be seen that with the increase in crossover probability CR, the fitness value of the IDDE algorithm on four datasets is reduced. Therefore, we set the crossover probability CR to 0.1.
Finally, keeping the variation factor F0 = 0.5 and the crossover probability CR = 0.1, in the case of inertia factor w = {0.1, 0.2, 0.3, 0.4, 0.5, 0.6, 0.7, 0.8, 0.9, 1.0}, the value of the social network discrete number T(S) varies with different inertia factors, as shown in
Figure 4. It can be seen that with the increase in inertia factor w, the fitness values on the dataset fb-pages-food, soc-wiki-vote and ia-email-univ basically tend to be stable at w = 0.5, and on the dataset tech-routers-rf, the fitness value reaches the maximum at w = 0.5. Therefore, we set the inertia factor w to 0.5.
4.2.2. Number of Iterations and Population Size
To analyze the performance of the IDDE algorithm at different numbers of iterations and population sizes, we set the inertia factor to 0.5, the variation factor to 0.5, the crossover probability to 0.1, and the initial seed set size
k to 20. Firstly, the effect of the number of iterations max_steps is analyzed, the population size
NP is set to 15 and the value range of max_steps is 300. In the case of the seed set size
k = {5, 10, 15, 20, 25, 30, 35, 40}, the experimental results of the four real-world social networks are shown in
Figure 5. As can be seen from the figure, IDDE converges on four networks within 200 iterations, so in the subsequent experiments, the value of max_steps is set to 200.
This study also analyzed the influence of population size
NP on fitness value, setting the value of max_steps to 200, in the case of population size
NP = {5, 10, 15, 20, 25, 30}, the results are shown in
Figure 6. It can be seen that the value of the fitness function increases with the parameter
NP, but when the population size is greater than 15, the fitness value does not increase significantly, so in the next experiment, we set the value of the population number
NP to 15.
4.2.3. Infection Rate of the SIR Model
To analyze the performance of the IDDE algorithm with different infection probability in the SIR model, we set the initial seed set size
k to 20, the population size
NP to 15 and compared it to five different algorithms. The performance comparison of each algorithm under different infection probabilities is shown in
Figure 7.
As shown in
Figure 7a, the IDDE algorithm performed well on the dataset fb-pages-food. When the infection probability is different, the influence propagation range exceeds that of the comparison algorithm. However, the difference between the IDDE algorithm and other algorithms is not obvious when the infection probability is
, it was after
that it gradually began to show its strengths. Similarly, as shown in
Figure 7b–d, in the datasets soc-wiki-vote, ia-email-univ and tech-routers-rf, the IDDE algorithm has better influence than other algorithms when
.
In summary, by comparing the performance of each algorithm under different infection probability on four real networks, the propagation range of the IDDE algorithm is better than that of the comparison algorithm when the infection probability is high (). In subsequent experiments, we set the value of the infection probability to 0.7.
4.3. Comparison Experiment
In order to further demonstrate the performance of IDDE, we carry out extensive experiments on four real-world social networks and compared it with other state-of-theart influence maximization algorithms (Degree centrality algorithm, the Closeness algorithm, K-Core algorithm, the Constraint Coefficient algorithm and the variant HADE algorithm of the IDDE algorithm) in terms of influence propagation and running time.
4.3.1. Influence Scope Comparison
Let the size of the seed set
k = {5, 10, 15, 20, 25, 30, 35, 40}, the SIR model is used to evaluate the influence of the seed set selected by different algorithms, and the independent experiment was repeated 500 times by the Monte Carlo method, and the final result was the mean of 500 experiments. The range of influence of the different algorithms in the
SIR model is shown in
Figure 8.
As shown in
Figure 8a, IDDE performed well on the dataset fb-pages-food, all exceeding the comparison algorithm in terms of influence spread range. In addition, the IDDE algorithm has a similar HADE effect when
k = 15, and the IDDE algorithm is better than the HADE when
k is the other value. As shown in
Figure 8b, in the dataset soc-wiki-vote, the IDDE algorithm has better influence than other algorithms at seed set sizes
k from 5 to 30, but the IDDE is similar to the degree effect at
k = 35, and IDDE performs worse than the degree at
k = 40. As shown in
Figure 8c,d, the IDDE algorithm outperformed the others in the datasets ia-email-univ and tech-routers-rf.
Among the four real networks, the IDDE algorithm is better than the deformation algorithm HADE, because the HADE algorithm lacks the consideration of individual diversity in crossover operation and is more likely to fall into a local optimal dilemma than our algorithm.
4.3.2. Running Time Comparison
In addition to the comparison of impact range, we also compared the running time of different algorithms on four datasets (seed set size
k = 20). Considering that the greedy algorithm requires multiple Monte Carlo operations and has a long running time, we did not involve the greedy algorithm in the comparison process, and only made a comparison of the heuristic methods. Here, the IDDE algorithm and the HADE algorithm are set for 200 iterations with the population size
NP = 15, and the experimental results are shown in
Table 2.
It can be seen from
Table 2 that the degree algorithm runs the fastest on each dataset due to the fact that it only evaluates the local characteristics of the nodes, which is followed by the K-Core algorithm, the closeness algorithm, and the constraint algorithm. The HADE algorithm has relatively less running time because there are no random individual variability comparisons introduced in the optimization search process. The running efficiency of the IDDE algorithm is relatively slow, which is mainly attributed to the fact that the algorithm requires several iterations to achieve the optimization search process. We conducted 200 iterations to obtain relatively accurate calculation results, which increased the running time of the program.
5. Discussion
The IDDE algorithm proposed in this paper is a population-based adaptive global optimization algorithm, which carries out global optimization-seeking operations through cooperative and competitive relationships among nodes in a social network. The set of alternative nodes is evaluated by the principle of symmetry (the global connectivity between nodes in the network decreases as the number of target nodes removed in the social network increases). During each iteration of the algorithm, the superior individuals are retained and the inferior individuals are eliminated to finally achieve the screening operation of the target seed node set.
The seed set screened by the IDDE algorithm can effectively avoid the phenomenon of influence overlap generated by heuristic methods and discover target nodes possessing high influence in social networks with quality.
Obviously, it can be seen from the comparison experiments that the operation efficiency of the IDDE algorithm is not as efficient as typical heuristics, which requires us to further improve the operation efficiency of the algorithm. However, the IDDE algorithm can more accurately discover the target node with the maximum influence, which strikes a balance between influence propagation and efficiency. It plays a very important role in the precise location of target customers in the marketing process, epidemic traceability and prevention and control, and monitoring of public opinion information.
6. Conclusions and Future Scope
In this paper, we propose a differential evolutionary algorithm IDDE based on network dispersion to solve the influence maximization problem. The algorithm firstly uses the discrete number and discrete granularity of the network after removing target nodes as indicators for the evaluation of node importance to construct the fitness function of IDDE. Then, the fitness function is used to evaluate the quality of individuals in the population, and finally find the optimal seed set. The experimental results based on four different datasets show that the influence range of the IDDE algorithm is better than the comparison algorithm and has better performance.
In the subsequent research work, we will further optimize the IDDE algorithm, improve the population initialization and individual update method, and improve the convergence speed of the algorithm. In addition, we are going to apply the differential evolution algorithm to the social networks in the competitive environment, construct the influence maximization evaluation function suitable for the competitive environment, and explore the node set that can produce the maximum propagation ability in the competitive environment.


