Article

Numerical Analysis of the Crown Displacements Caused by Tunnel Excavation with Rock Bolts

1
Department of Civil Engineering, National Taipei University of Technology, No. 1, Sec. 3, Zhongxiao E. Rd., Taipei 10608, Taiwan
2
Department of Civil Engineering and Geomatics, Cheng Shiu University, No. 840, Chengching Rd., Niaosong District, Kaohsiung 83347, Taiwan
3
Center for Environmental Toxin and Emerging-Contaminant Research, Cheng Shiu University, No. 840, Chengching Rd., Niaosong District, Kaohsiung 83347, Taiwan
4
Super Micro Mass Research and Technology Center, Cheng Shiu University, No. 840, Chengching Rd., Niaosong District, Kaohsiung 83347, Taiwan
5
The Key Laboratory of Urban Security and Disaster Engineering of Ministry of Education, Beijing University of Technology, No. 100, Pingleyuan, Chaoyang District, Beijing 100124, China
*
Author to whom correspondence should be addressed.
Symmetry 2022, 14(8), 1508; https://doi.org/10.3390/sym14081508
Submission received: 7 July 2022 / Revised: 16 July 2022 / Accepted: 20 July 2022 / Published: 23 July 2022

Abstract

:
The complex geological structure of Taiwan often makes it difficult to control the deformation behavior of tunnel excavations. To simplify analyses, most traditional empirical formulations and modern numerical analyses do not consider the existence of rock bolts. For this reason, this study aimed to investigate the vertical displacements caused in tunnel crowns under various geological conditions using a three-dimensional finite element analysis with tunnels of different cross sections as an example. The analysis was performed using two rock material models: the Mohr–Coulomb and Hoek–Brown models. The results indicated that there was an insignificant difference between the two models in terms of the magnitudes of displacement and the distribution profiles obtained. When a tunnel was being excavated, the weaker the site was geologically and the larger the cross section, the larger the vertical crown displacement. In addition, the presence of rock bolts had a significant influence on the displacement in areas where the geology was weak and the cross section was large. The numerical analysis results of the Mohr–Coulomb and Hoek–Brown models were compared with the values calculated using the formulas suggested by Unlu and Gercek. At the excavation face, the displacement ratio derived from the prediction formula of Unlu and Gercek was smaller than the numerical analysis result, and the difference between the two became larger when the rock mass quality was worse.

1. Introduction

Taiwan features geologically mountainous terrain running from north to south and more hills than flatlands, as it is sandwiched between the Eurasian Plate and the Philippine Sea Plate. Its population and number of vehicles have grown steadily in recent years, resulting in frequent traffic jams during peak hours. As a result, hills are gradually being included in the configuration of intercity roads and mass transportation systems. Typically, tunnels are used for passage through the mountains, in addition to surface and elevated roads for transportation [1,2]. In recent years, Taiwan has become famous for projects such as the improved Suhua–Huawei Highway, the Beiyi Expressway, National Highway No. 3, and the Nantou–Puli section of National Highway No. 6, due to the large scale of these projects and the complex geological conditions in their tunnels.
Tunnel deformation behavior varies with geology and tunnel section. In particular, geological conditions are the most important factor affecting the longitudinal deformation profile [3,4]. Deformation is inevitable during tunnel excavation and is an imperative topic for investigation, as the magnitudes and distributions of deformations have great impacts on the overall stability of the tunnel and the safety of its surroundings [5]. For tunnel design and construction, it is important to study the behaviors of the excavation. A variety of factors influence tunnel deformation, such as the properties of rock masses, initial stresses, tunnel cross sections, tunnel support, and construction steps [6,7,8]. In view of the complexity of geology and the selection and application of tunnel construction methods, tunnel deformation cannot easily be estimated in terms of its magnitude and distribution [9]. It would be very helpful for the construction configuration and design to be able to estimate the pre-deformation behavior ahead of the excavation face.
In view of the complex variability of engineering geology, cross sections have generally been assumed to be circular in previous studies of tunnel deformation behaviors, in order to simplify the analysis [5]. However, most tunnels excavated by drilling and blasting have horseshoe-shaped cross sections, due to economy and stability considerations. It is worth noting that the excavation steps, round length, and primary support vary for each tunnel as a result of the rock mass properties and the size of the cross section. In order to respond to the actual on-site engineering situation as much as possible, this study took an existing highway tunnel as a case study and conducted a three-dimensional simulation analysis using the PLAXIS 3D software. Rock bolts were applied to the three common-strength rock masses in tunnels, and the differences in the magnitude and distribution of the crown deformation ahead of and behind the excavation face are discussed.
Taiwan is relatively young in terms of its geological age, and the geological structures within its territory are quite varied, which often leads to difficulty in controlling the deformation behavior during tunnel excavation. Regarding the deformation of the tunnel crown, most of the traditional empirical formulas and modern numerical analyses do not consider the existence of rock bolts, in order to simplify the analysis. In view of this, the purpose of this study was to investigate the influence of tunnel section size and geological conditions on deformation and to analyze the displacement of tunnel vertical crowns for different rock masses. The Mohr–Coulomb model and the Hoek–Brown model in the PLAXIS 3D program were used for the analysis of the crown deformation caused by excavation activities [10,11]. In particular, the presence or absence of rock bolts was modeled and analyzed separately, which is rare in general research. The results and the benefits of applying rock bolts to reduce displacement are discussed. By normalizing the amount of deformation of the crown and the distance from the excavation surface, the deformation behavior of the tunnel could be estimated at the planning and design stage, and this could then be used as a reference for future tunnel design and construction planning.

2. Literature Review

During tunnel excavation, the rock mass is decompressed, and the stress equilibrium is disrupted, resulting in the redistribution of stresses in the surrounding rocks [12,13]. In view of this, elements such as steel supports, shotcrete, and rock bolts are introduced to support the rock mass at the right time, to achieve a new equilibrium while allowing the rock mass deformation to converge to stability. It is important to monitor the displacement at individual excavation stages while the construction is underway, in order to ensure the safety of workers and the quality of the project [14,15]. Therefore, deformation behavior is a key aspect that is often investigated in tunnel construction [12,16].
Complete deformation includes deformation occurring before, during, and after the tunnel excavation. A tunnel’s longitudinal deformation profile (LDP) refers to the general distribution of the radial displacement of a tunnel along the tunnel excavation area (the longitudinal axis) [8,17]. This profile includes the part ahead of the excavation face (unexcavated section) and the part behind it (excavated section). For the LDP of a tunnel, it is important to determine the appropriate time to install support or to optimize the installation of the support with specific displacement capabilities [18]. There are two ways to obtain the LDP: on-site measurement and numerical simulation. Many researchers have previously discussed the LDP and drawn specific conclusions. For the unexcavated section, the deformation occurs at about 1.5 to 2.5 times the tunnel diameter ahead of the excavation face [17], while for the excavated section, the deformation reaches a maximum value at about 2 to 4 times the tunnel diameter behind the excavation face [19].
Brady and Brown [20] assumed that the medium around a tunnel with a circular cross section was a homogeneous, isotropic, and continuous material, and they deduced the displacement of the surrounding rock mass or soil mass using plane strain linear elasticity theory, as shown in Equations (1) and (2).
u r = P v R 2 ( 1 + v ) 2 E r × { ( 1 + k ) ( 1 k ) [ 4 ( 1 v ) R 2 r 2 ] cos 2 θ }
u θ = P v R 2 ( 1 + v ) 2 E r { ( 1 k ) [ 2 ( 1 2 v ) + R 2 r 2 ] sin 2 θ }
where u r and u θ are radial and tangential displacements, respectively; P v is the vertical in situ pressure; k is the horizontal stress coefficient (k = P h / P v ); E and v are the Young’s modulus and Poisson’s ratio of the surrounding medium, respectively; r and θ are the polar coordinates of the measurement point; and R is the radius of the tunnel’s cross section.
If the in situ stress is in a hydrostatic stress field, i.e., P v = P h = P o (k = 1.0), the tangential displacement u θ disappears and the radial displacement u r can be simplified as in Equation (3) [21]:
u r = P o R 2 ( 1 + v ) E r
If the measurement point is located at the circumference of the excavation cross section, and the in situ stress is in a hydrostatic stress field, the absolute value of the final elastic radial displacement occurring far behind the face of the maximum radial displacement u r is expressed as shown in Equation (4) [21].
u r = P o R ( 1 + v ) E
Prassetyo and Gutierrez [22] compiled a number of well-known LDP equations in 2018 and normalized the distance to the excavation face x and the tunnel diameter D for applications and corrections. It was estimated from the longitudinal displacement u r vs. the maximum longitudinal displacement u rmax in the LDP that the initial displacement occurred at approximately twice the tunnel diameter ahead of the excavation face (unexcavated section), the displacement was u ro at the excavation face, and the displacement at 2 to 4 times the tunnel diameter behind the excavation face (excavated section) reached its maximum, u r   [21]. Panet [23] proposed his LDP equation based on the linear elasticity model, which is helpful for the analysis of settlements in a good rock mass. By dividing the displacement along the longitudinal axis of the tunnel u r by the elastic plane strain value u r , the distance to the excavation face x can be expressed as in Equation (5), which applies only to the area behind the excavation face (the excavated section), with the distance to the excavation face in the equation assumed to be x ≥ 0.
u r u r = 0.28 + 0.72 [ 1 ( 0.84 0.84 + x / R ) 2 ]
Carranza-Torres and Fairhurst [17] derived the displacement ratio vs. the distance to the excavation face as shown in Equation (6), based on the tunnel monitoring data collected and suggestions made by Dr. E. Hoek. This equation applies to the estimation of the displacement behind the excavation face (x ≥ 0) and ahead of the excavation face (x ≤ 0).
u r u r = [ 1 + e x p ( x / R 1.10 ) ] 1.7
It is worth noting that Equation (5) provides the displacement ratios derived from the assumption that a material is linearly elastic, while Equation (6) is an empirical formula based on in situ monitoring data, both of which are related to the ratio of the distance to the excavation face and the tunnel radius (x/R). Unlu and Gercek [21] indicated that during excavation, the normalized elastic pre-deformation ( U o = u ro / u r ) is between 0.25 and 0.31.
Unlu and Gercek [21] used a three-dimensional finite difference stress analysis program, FLAC3D, to investigate the variation in radial boundary displacement along the longitudinal direction of a circular tunnel located in a hydrostatic, in situ stress field. Their results indicated that the deformation of soil is closely correlated with the compressibility of a rock mass. The key factor influencing rock compression is the Poisson’s ratio υ , and the rock mass is categorized as good, medium, or poor according to ratings of 0.25, 0.28, and 0.30, respectively, which are considered in the LDP analysis. The empirical formula of Carranza-Torres and Fairhurst [17] is derived from in situ monitoring data and is therefore suitable for the analysis of the settlement of a rock mass with medium rating. This empirical LDP formula is applicable to linear elasticity analysis for circular tunnel cross sections and is suitable for estimating the longitudinal settlement profile of a tunnel. Relative to the distance to the tunnel face, the LDP consists of three components: (1) Y1, pre-deformation; (2) Y2, loss displacement, which cannot be measured before a monitor is installed; and (3) Y3, measured displacement, as shown in Figure 1 [8].
Ziaei and Ahangari [24] attempted to compare the results obtained from the FLAC model and Equation (6) for the diversion tunnel of the Safavid dam in Kerman Province, Iran in 2018 and found matching effects, as shown in Figure 2 [24,25]. Michael et al. [26] simulated the influence of tunnel boring machine (TBM) excavation in a 3D finite element model using ABAQUS in 2017 and split the model along the longitudinal axis of the tunnel in half for analysis, as shown in Figure 3. The Mohr–Coulomb model was used for the analysis, and hexahedrons with eight nodes were used as the grid elements for this configuration. The total depth was five times the tunnel diameter D, the total excavation length was 13D, and the width was 11D in the model. The simulation of machine excavation revealed that this configuration was more effective in simulating the influence of mechanical behaviors on soil deformation during TBM excavation.
Unlu and Gercek [21] used the FLAC3D finite difference method software to analyze the deformation behavior of tunnels with circular sections in the elastic range and normalized the displacement and the distance from the excavation face. Due to the complexity of the longitudinal deformation curve of the tunnel, it was difficult to express it using a single equation. Therefore, they proposed a general form of the normalized elastic radial displacement that occurred ahead of and behind the excavation, as shown in Figure 4 [21]. Both curves are given as a function of normalized distance from the excavation face (X = | x | / R). The displacement distribution curve ( U a ) ahead of the excavation face (unexcavated section) and the deformation distribution curve ( U b ) behind the excavation face (excavated section) are shown in Equations (7) and (8), respectively.
U a = U o + A a [ 1 exp ( B a X ) ]
U b = U o + A b { 1 [ B b / ( B b + X ) ] 2 }
U o = 0.22 ν + 0.19
A a = 0.22 ν 0.19
B a = 0.73 ν + 0.81
A b = 0.22 ν + 0.81
B b = 0.93 ν + 0.65
where U o ( i . e . ,   u ro / u r ) represents the normalized elastic pre-deformation and ν is the Poisson’s ratio. For the region located ahead of the excavation face, Equation (7) was found to be suitable.
Zheng et al. [1] conducted a large-scale 3D geomechanical model test on asymmetric closely spaced twin tunnels and verified the experimental results through numerical analysis, to study the lining mechanical properties, stress release, and displacement characteristics of sandy ground during excavation and overloading processes. Their test results indicated that the lining was under pressure during the excavation process of the asymmetric closely spaced twin tunnels. The lining of later-excavated small-diameter tunnels was found to be susceptible to bias. In addition, the numerical results showed that if the small-diameter tunnel was excavated first, the subsequent excavation of the large-diameter tunnel would cause a sharp change in the lining bending moment of the small-diameter tunnel. Deng et al. [27] used COMSOL Multiphysics to build a numerical model to study the effect of twin tunnel excavation on ground settlement and patterns in composite strata. Their results showed that after the construction of the twin tunnels was completed, the ground settlement above the first tunnel was slightly larger than that above the second tunnel. The greater the distance between the two tunnels before and after excavation, the smaller the ground settlement and the impact on the surrounding soil. Abdelkader et al. [28] proposed a Gaussian process regression model based on hybrid gray wolf optimization to simulate the deterioration behavior of highway tunnel components. Their results show that the model developed for the five elements of cast-in-place tunnel liners, concrete interior walls, concrete portal, concrete ceiling slab, and concrete slab on grade significantly outperformed other investigated machine-learning-based deterioration models.

3. Project Overview of the Case Study

3.1. Highway Tunnels in Taiwan

The total tunnel length of Taiwan’s road network exceeds 1000 km. The future development trend of Taiwan will lead to the gradual extension of these tunnels to the eastern coastal areas and mountainous areas, and tunnel engineering will play a more important role in the network. Most highway tunnels in Taiwan were constructed using the drill and blast method and have horseshoe-shaped cross sections. Based on the size of the cross section, there are three types of cross sections: (1) single-lane cross sections, such as pilot tunnels or construction adits; (2) two-lane cross sections, such as those on the highways of eastern Taiwan and the expressways leading to hills; and (3) three-lane cross sections, such as those on National Highway No. 3. The schematics of tunnel cross sections are shown in Figure 5 [29], and their geometric data are provided in Figure 6 [30,31].
The rock mass of a highway tunnel is classified mostly based on its rock mass rating (RMR) [32]. In general, the rock mass around the tunnel is classified into types I through VI [33], where a higher rating signifies a poorer rock mass. For simplicity, the rock mass was classified as either good, medium, or poor in this study. The RMR ratings are shown in Table 1.
For the purposes of this study, tunnels were classified into three types of cross section: single-lane, two-lane, and three-lane. In addition, rock masses were classified as good, medium, or poor. For simplicity, T1, T2, and T3 are used to denote single-lane, two-lane, and three-lane cross sections, respectively, hereafter. Following T1, T2, and T3, the letters G, M, and P stand for good, medium, and poor rock masses, respectively. For example, T2G denotes a two-lane cross section with a good rock mass, and T3M denotes a three-lane cross section with a medium rock mass. Nine types of tunnels were investigated in this study. The associated symbols are listed in Table 2.

3.2. Tunnel Excavation and Support

Practically, tunnel excavation is carried out round by round. Considering tunnel stability and workability, the round length often depends on the size of the cross section and the local geology. Generally speaking, tunnels with small cross sections and good rock mass may be excavated with a longer round length. In contrast, the round length should be shorter for tunnels with a poor rock mass and large cross section. Tunnel supports have two parts: the initial support and the inner concrete lining. In general, initial supports are considered in tunnel analysis and design to support the rock pressure surrounding the tunnel, except at the tunnel entrances, at crossing sections, and in geologically complicated areas. The inner concrete lining, on the other hand, serves for the installation of lighting, ventilation, and traffic control, in addition to increasing the tunnel stability.
Relevant information about the tunnels discussed in this study, such as the excavated cross-sectional area, the equivalent diameter, the round length, the rock condition, and the thickness of the shotcrete support, is shown in Table 2. The equivalent diameter (Dequ) is the diameter of a circular cross section converted from the cross-sectional area of a horseshoe-shaped tunnel (A), i.e., Dequ = (4A/π)1/2.

4. Numerical Analysis and Calculations

The finite element program PLAXIS 3D 2018.01, developed by Plaxis B.V., Delft, Netherlands, was used in this study for numerical analysis and computation [33,34,35,36]. This program was first developed by Delft University of Technology in the Netherlands in 1987 and evolved from the 2D version used previously. In 2001, the 3D versions PLAXIS 3D Tunnel and PLAXIS 3D Foundation were released, and both of these were integrated into PLAXIS 3D in 2010. This was subsequently updated to PLAXIS 3D AE in 2016 and to PPLAXIS 2017 in 2017. In the 2017 version, a tunnel designer was added that allows for the simplified integration of construction steps, and the installation of a lining, as well as the application of loads and rounds, was added. Recently, rock bolt installation length and spacing were incorporated into the tunnel design, allowing users to conduct more convenient engineering analyses.

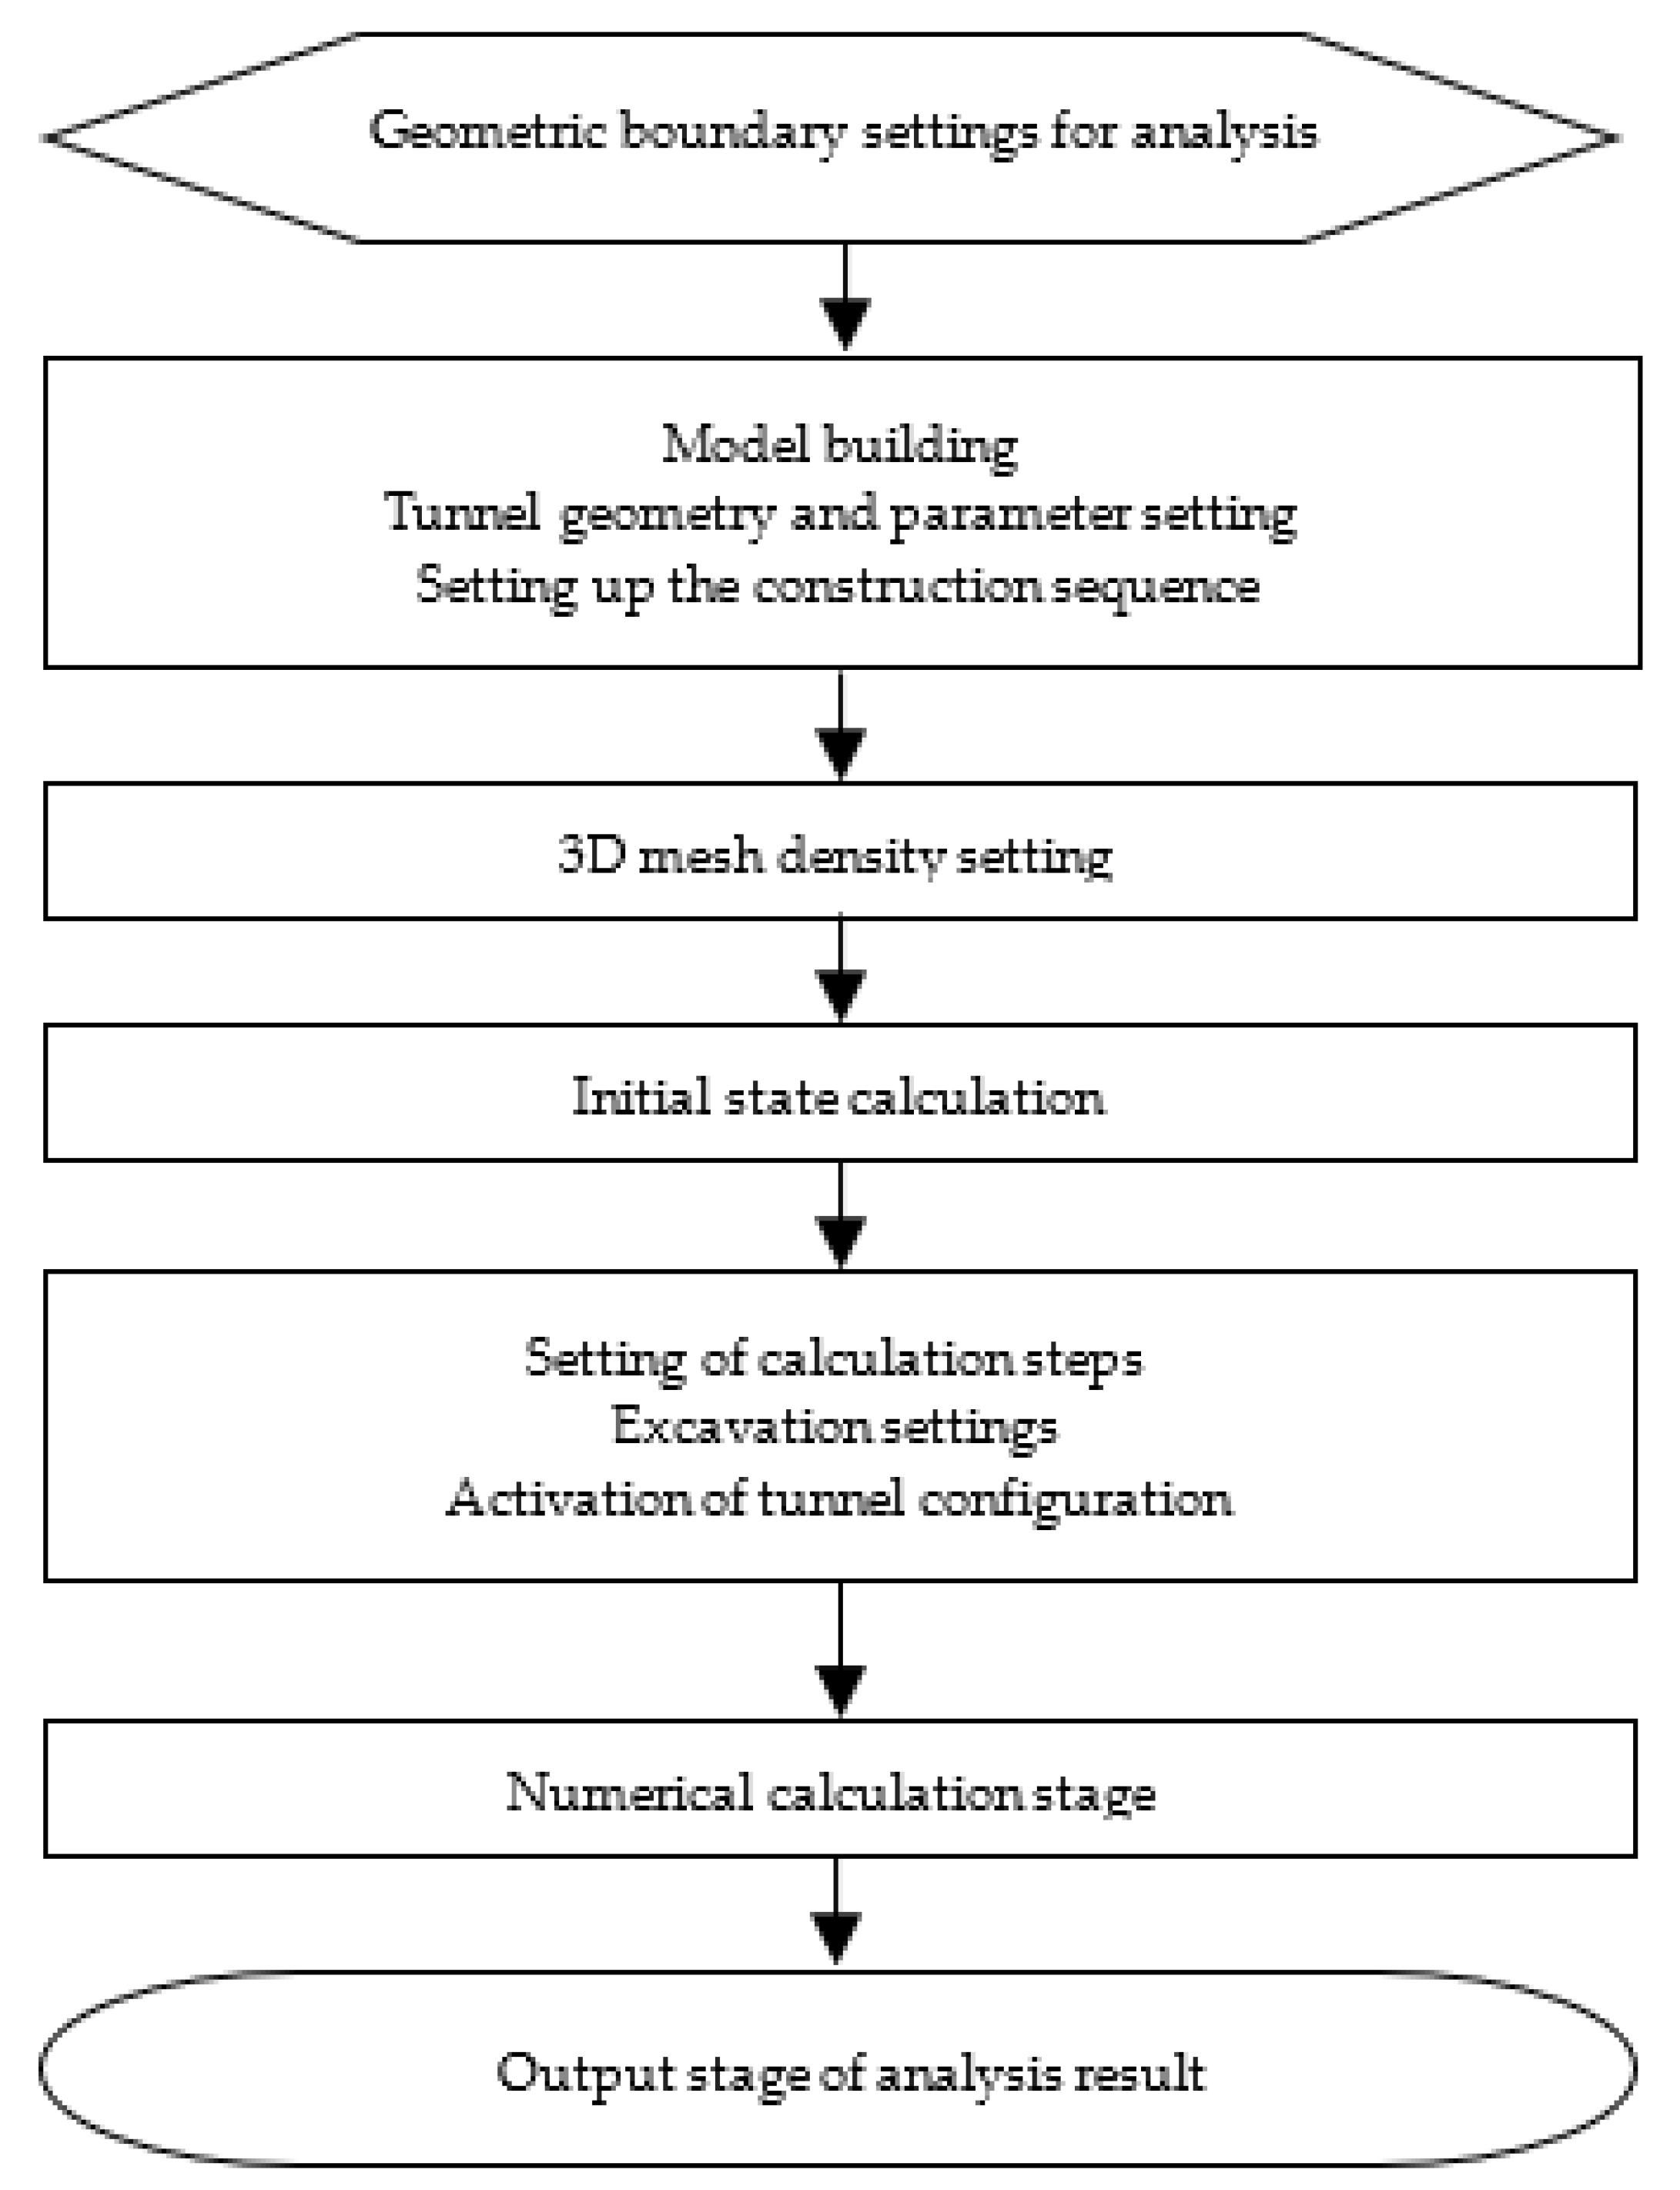
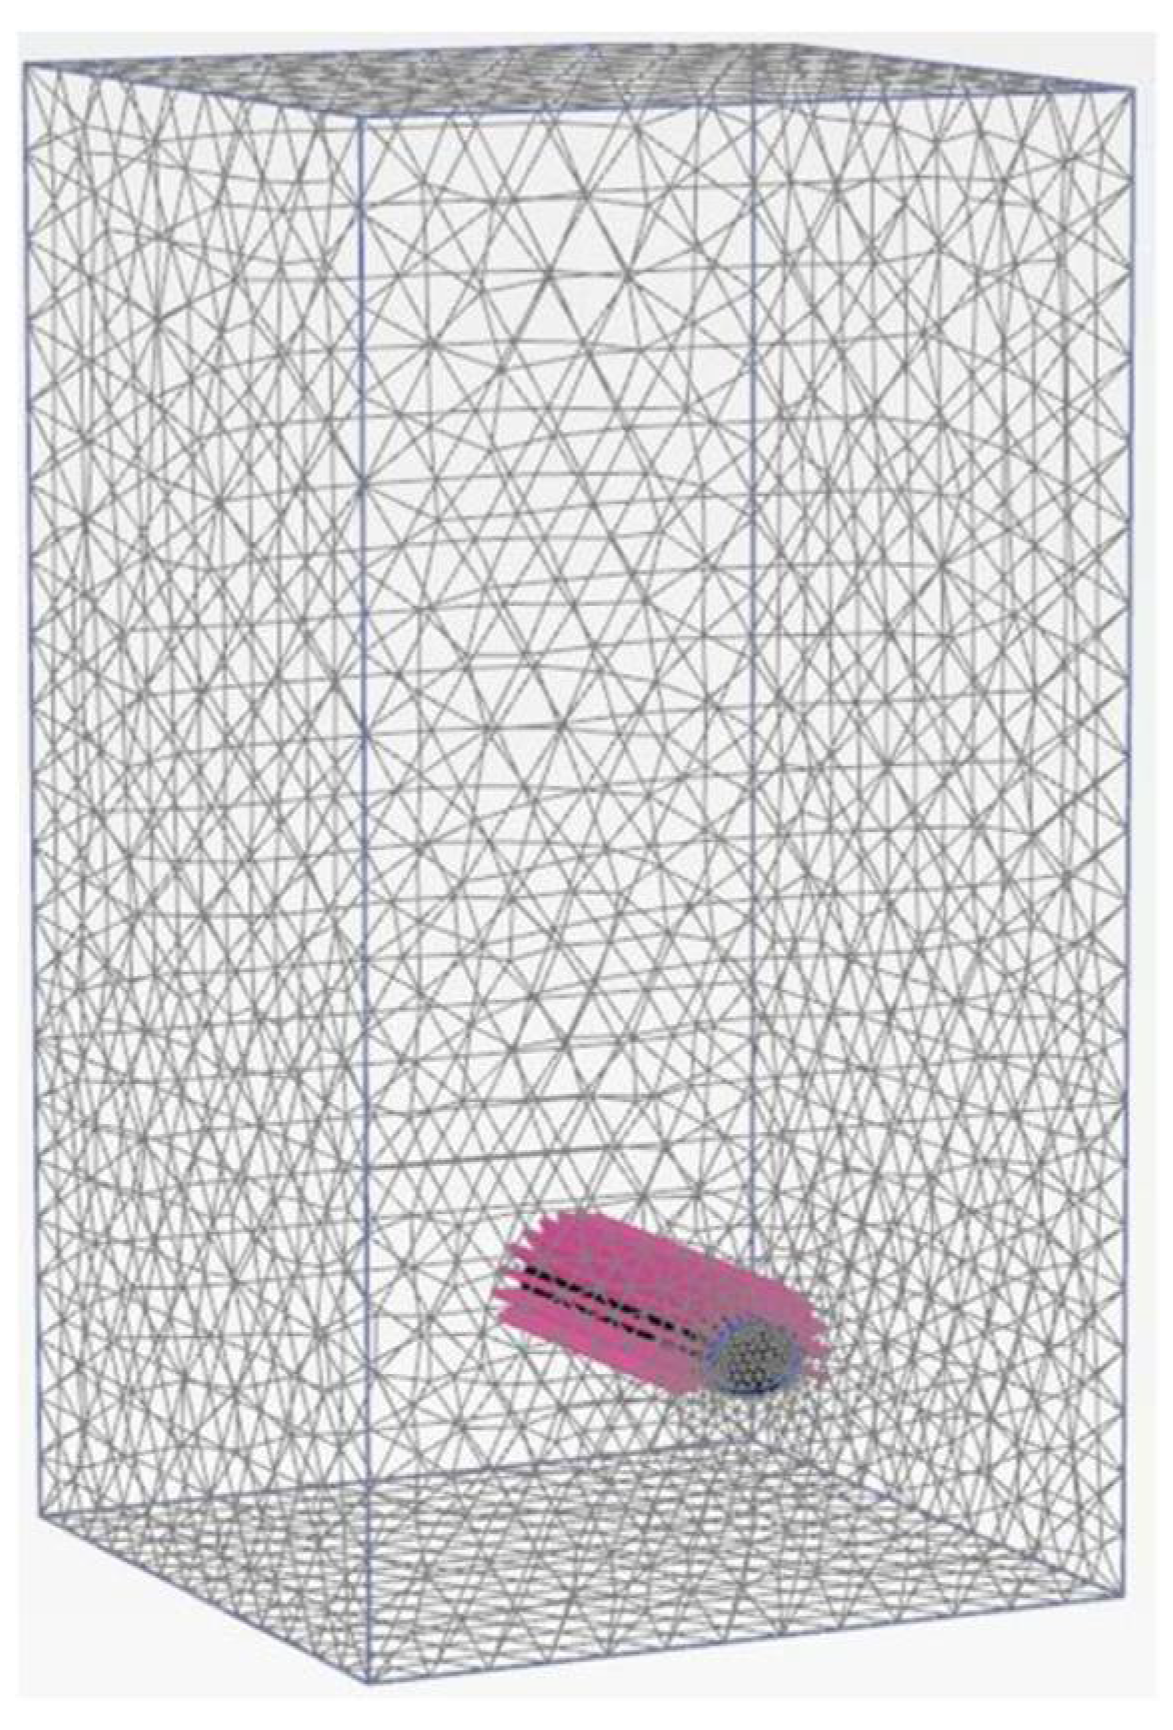
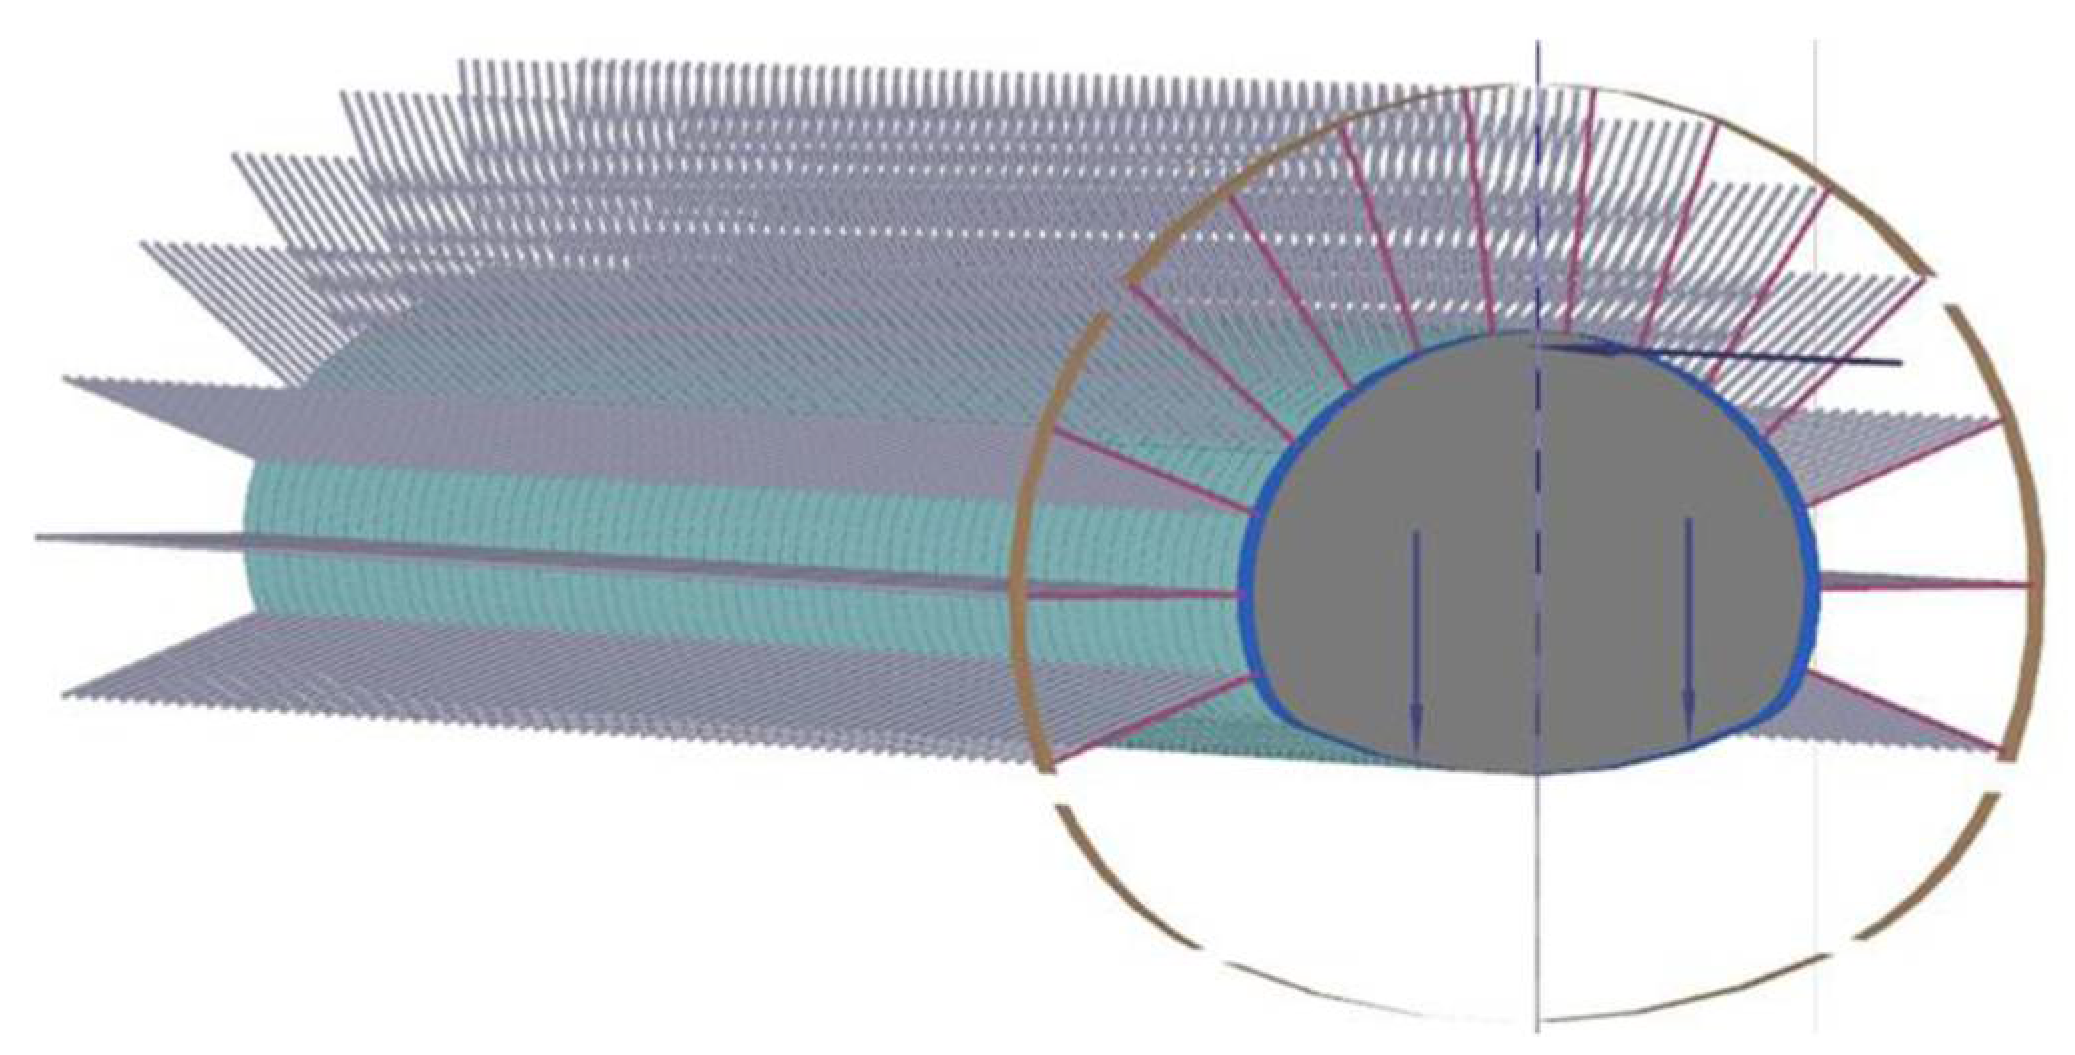
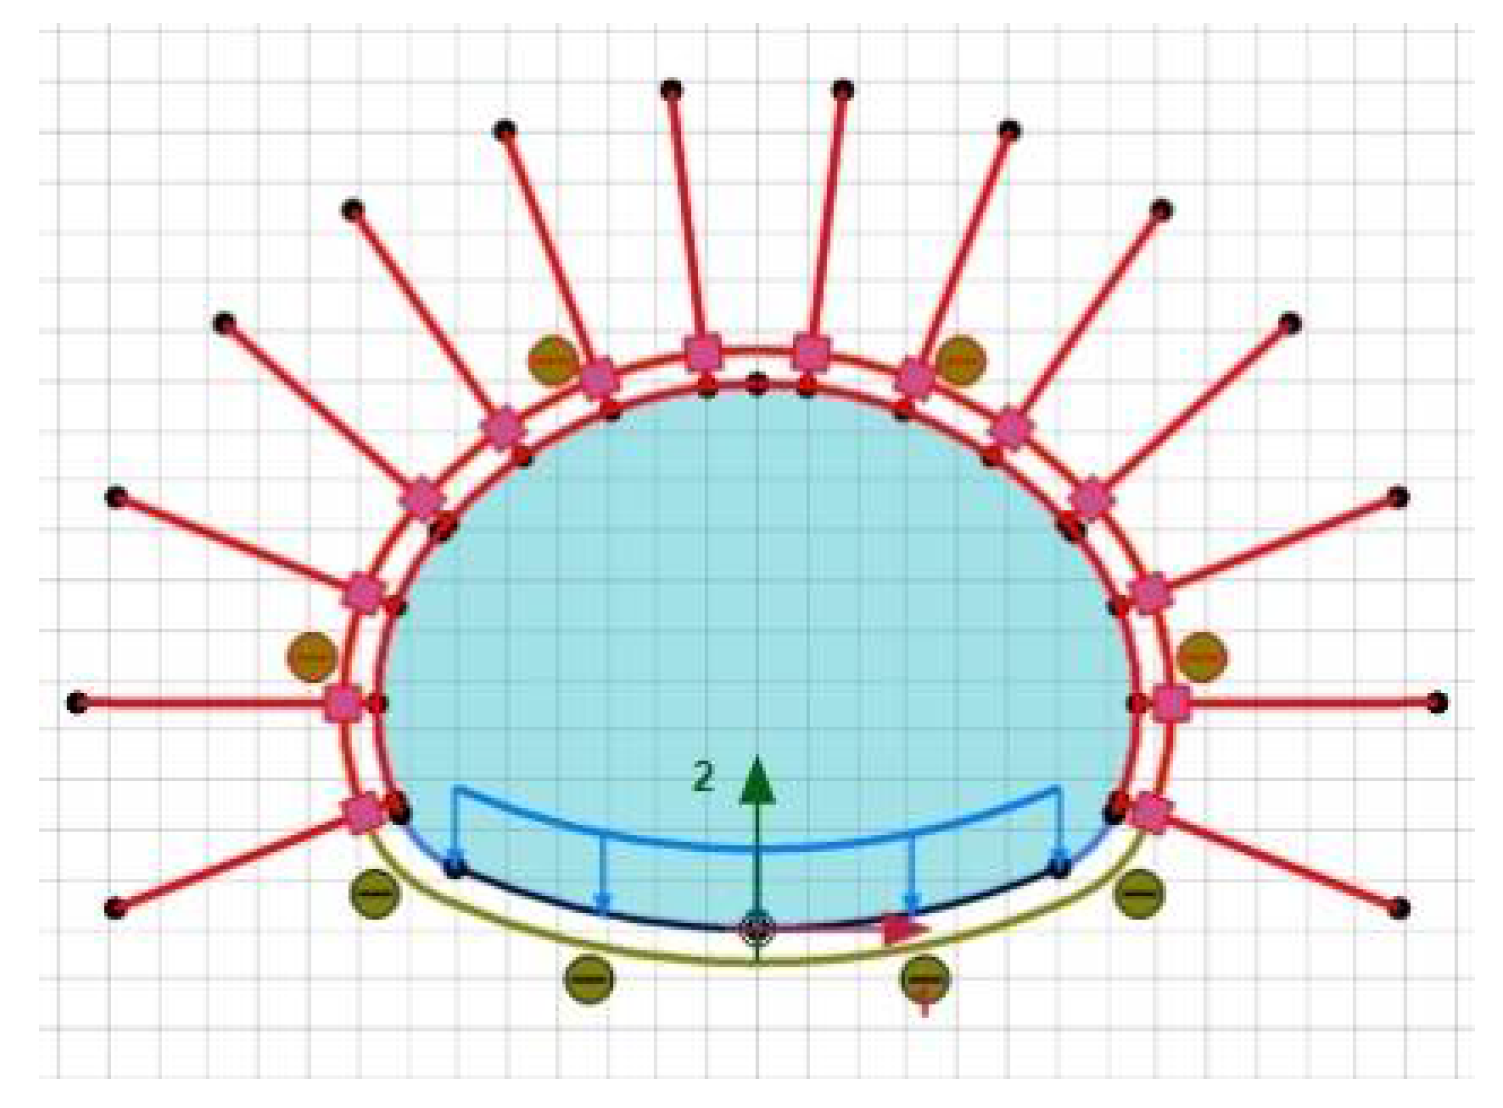
4.1. Tunnel Numerical Analysis Process

The flow chart for the steps of the PLAXIS 3D tunnel excavation simulation is shown in Figure 7, including the geometric boundary settings for the analysis, model building, material setting, tunnel structure setting, mesh generation, numerical calculation, analysis results output, etc.

4.2. Mohr–Coulomb Model

The Mohr–Coulomb model is one of the most basic and widely used rock material models in the numerical analysis of tunnel engineering. Its stress–strain relationship considers linear elasticity and complete plasticity. The linear elasticity part follows Hooke’s law and the stiffness parameters required are the Young’s modulus E and the Poisson’s ratio v . The plasticity part follows the Mohr–Coulomb failure criterion, which specifies the minimum principal stress ( σ 3 ) vs. the maximum principal stress ( σ 1 ), as shown in Equation (14), which is a principle of non-associated plasticity [37]. The required strength parameters are the cohesion c, the angle of internal friction φ, and the dilatancy angle ψ. The parameters required for rock masses in the Mohr–Coulomb model are listed in Table 3.
σ 1 = 2 c cos φ 1 sin φ + 1 + sin φ 1 sin φ σ 3

4.3. Hoek–Brown Model

The Hoek–Brown model is based on a large number of rock experiments and in situ tests. The principal stresses are nonlinearly related [38] and are different from those of the commonly used Mohr–Coulomb model [39]. The failure criterion of the Hoek–Brown model is given in Equation (15), where m b is the reduction from the intact rock parameter m i , and s and a are the geological strength index (GSI) and degree of disturbance D, respectively [40]. Ignoring the unit weight of rock mass (γ) and the interfacial strength reduction coefficient (Rinter), various parameters are needed for the Hoek–Brown model [40], including the rock’s Young’s modulus (Em), the Poisson’s ratio ( v ), the uniaxial compressive strength of the intact rock ( σ ci ), the intact rock index ( m i ), the geological strength index (GSI), the degree of disturbance (D), the dilatancy angle (ψmax) when σ 3 = 0, and the confining pressure ( σ 3 ) when ψ = 0°. The rock parameters are listed in Table 4.
σ 1 = σ 3 + σ ci ( m b σ 3 σ ci + s ) a

4.4. Linear Elasticity Model

Shotcrete and rock bolt materials show greater stiffness compared to rock mass or soil. The stress–strain relationship follows the linear elasticity model of Hooke’s law. For tunnels, the parameters required are the shotcrete thickness, the unit weight, the Young’s modulus, and the Poisson’s ratio, as shown in Table 5. The length, unit weight, Young’s modulus, and diameter of the rock bolts are provided in Table 6.
The horizontal boundary (X-axis) of the analysis area in this study extended to five times the tunnel diameter (5 Dequ) on the left and right sides of the tunnel from along the centerline. In the longitudinal direction of the tunnel (Y-axis), the length of the excavation was assumed to be four times the diameter, and the excavation advanced in rounds. To investigate the pre-deformation behavior of the tunnel, a further extension of five times the tunnel diameter was added to the Y-axis from the excavation face of the final round, giving nine times the diameter (9 Dequ) for the boundaries in the longitudinal direction of the tunnel. On the Z-axis, a 200 m deep overburden was assumed for the tunnels studied. To prevent impacts from the boundary effect, the boundary in the Z-direction was extended 30 m further downwards from the invert, making the boundary length 230 m in the Z-direction. Using the T3P rock bolt tunnel as an example, the tunnel model grids were as shown in Figure 8. The tunnel excavation is shown in Figure 9, a schematic diagram of the tunnel section with rock bolts is provided in Figure 10, and the vertical displacement of the tunnel is provided in Figure 11 using a color scale. Due to the symmetry of the geometry and boundary conditions, only one half of the tunnel and the surrounding medium were considered.
The calculation outputs in the output window provided the distributions of displacements, stress, and strain, using a color vector scale. Additionally, the outputs were displayed for various cross sections. The data analysis results were tabulated, and the clipboard function provided in the window was used to extract the data to an Excel spreadsheet for processing and sorting, allowing the comparison between the crown displacement and empirical data analysis.

5. Numerical Analysis Results

This study was focused solely on the vertical displacement of the tunnel crown uz. The results obtained from both the Mohr–Coulomb and Hoek–Brown rock material models were as follows.

5.1. Analysis Results of the Mohr–Coulomb Rock Material Model

The analysis results obtained using the Mohr–Coulomb (MC) model indicate that the greater the tunnel cross section, the greater the displacement. For the same cross section, the poorer the geology, the greater the displacement. Table 7 lists the displacement of each tunnel along the longitudinal axis (y-axis), including the maximum displacement (uz-max), 10% of the maximum displacement (0.1 × uz-max), 90% of the maximum displacement (0.9 × uz-max), and the displacement at the excavation face (uz-f). In addition, Table 7 also lists the excavation face displacement ratio (uz-f/uz-max) and the distance between each detection point and the excavation face. It is clear from the results shown in Table 7 that the maximum displacement was between 2.6 and 4.1 times the equivalent diameter (Dequ) for all the tunnels studied. Moreover, the excavation face displacement ratio (uz-f/uz-max) was between 0.33 and 0.56. The displacement dropped to 10% of the maximum displacement at approximately 0.9 to 3.9 times the tunnel diameter ahead of the excavation face, and this distance increased as the geology worsened.

5.2. Analysis Results of the Hoek–Brown Rock Material Model

For the Hoek–Brown (HB) analysis of the rock mass, the numerical analysis results for each tunnel were as shown in Table 8. For each tunnel, the maximum displacement (uz-max) was located at roughly 2.5 to 4.1 times the equivalent diameter (Dequ). In addition, the excavation face displacement ratio (uz-f/uz-max) was between 0.32 and 0.52 and varied with the geology of the rock mass, i.e., the poorer the geology, the higher the ratio. The displacement dropped to 10% of the maximum displacement at approximately 0.8 to 3.8 times the tunnel diameter ahead of the excavation face. Overall, the LDP of the HB model was roughly similar to that of the MC model.

5.3. Rock Bolt Benefit Analysis

In this section, each of the tunnels studied was analyzed using both the Mohr–Coulomb (MC) and Hoek–Brown (HB) models with the presence of rock bolts. Table 9 provides the MC model displacements, while Table 10 lists those of the HB model.
According to the size of the cross section, the results obtained for the vertical crown displacement were as shown in Figure 12, Figure 13 and Figure 14. For good rock masses (G) and medium rock masses (M), the order of the overall vertical displacement from large to small was as follows: MC rock bolt > MC > HB rock bolt > HB. For poor rock masses (P), the order of the overall vertical displacement from large to small was as follows: MC > HB > MC rock bolt > HB rock bolt. Given the same tunnel conditions, as far as the analysis model is concerned, the overall displacement in the MC mode was larger than that in the HB mode. In the absence of rock bolts, the excavation face displacement ratios (uz-f/uz-max) of the Mohr–Coulomb model for different geological conditions were 0.41 (G), 0.42 (M), and 0.50 (P). In cases where there were rock bolts, the excavation face displacement ratios (uz-f/uz-max) of the Mohr–Coulomb model under different geological conditions were 0.37 (G), 0.35 (M), and 0.46 (P). As a result, taking the average value of each G, M, and P rock mass in the two analysis modes, the excavation face displacement ratios were approximately 0.39, 0.39, and 0.49 for the three rock ratings.
The vertical crown displacement that took place at 2.5 Dequ behind the excavation face and the displacement reduction ratio (DRR) after the installation of the rock bolts were also investigated. For the Mohr–Coulomb model analysis, the vertical crown displacements were as shown in Table 11. For the cross sections with rock bolts installed, the DRR was between 0% and 2.96%, as shown in Table 11. The trends were consistent across all three rock ratings for the different tunnel cross sections. The vertical crown displacements of the Hoek–Brown model are listed in Table 12. The DRR was between 0.56% and 4.65%, as shown in Table 12. In addition, as shown in the vertical crown displacement figure, it was shown that the displacement was clearly smaller in tunnels where rock bolts were installed compared to the surroundings, indicating the significant influence of rock bolts. Particularly for tunnels with a poor rock mass, a carefully arranged installation of rock bolts should enable good control of the crown displacement to be achieved.

5.4. Normalized Displacement Analysis

The following normalizes the displacement data by dividing the horizontal distance by the equivalent diameter of each cross section and dividing the displacement of the ordinate by the maximum displacement of each tunnel. That is, the unit of the horizontal coordinate is Dequ, and the unit of the vertical coordinate is uz/uz-max. Normalization is used to remove the effects of elastic properties, initial stress, and tunnel diameter. The normalized displacements of the MC model are shown in Table 13, with the horizontal coordinate in Dequ and the longitudinal coordinate in uz/uz-max, while the normalized displacements of the HB model are presented in Table 14. The excavation face displacement ratio (uz-f/uz-max) was between 0.31 and 0.57, and the poorer the geology, the higher the ratio. The uz/uz-max ratio, on the other hand, increased dramatically within half a diameter (−0.5 Dequ) behind the excavation face (the excavated section) and approached 1 beyond twice the tunnel diameter (−2 Dequ) behind the excavation face. The uz/uz-max ratio was greater than 0.2 at a quarter of the diameter (0.25 Dequ) ahead of the excavation face. The displacement ratio at half a diameter (0.5 Dequ) ahead of the excavation face was still greater than 0.17. The displacement ratio decreased to 0.07–0.12 at twice the diameter (2 Dequ) ahead of the excavation face. The displacement ratio at three times the diameter (3 Dequ) ahead of the excavation face converged to 0.07–0.1, depending on the rock mass strength. For the excavation of rocky tunnels, the displacements at this location have no significant influence on neighboring regular structures.

5.5. Validation of the Constructed Models

Unlu and Gercek [23] used the FLAC3D finite difference method software to analyze the relationship between the radial deformation and the Poisson’s ratio (ν) of the rock mass under the elastic range condition for tunnels with a circular section. As previously mentioned, the displacement distribution curve ( U a ) ahead of the excavation face (unexcavated section) and the deformation distribution curve ( U b ) behind the excavation face (excavated section) were as shown in Equations (7) and (8), respectively. In order to compare the results with the prediction formulas suggested by Unlu and Gercek [23], in this study, the rock mass was classified into three grades: good, medium, and poor. We also considered whether the tunnel cross section was equipped with rock bolts. Then, the numerical analysis results of the Mohr–Coulomb and Hoek–Brown modes were discussed.
In the case of a good rock mass, except in the range of 0.2 Dequ–2.8 Dequ ahead of the excavation face, the numerical analysis values obtained for both modes were larger than the values calculated using the formulas suggested by Unlu and Gercek, as shown in Figure 15. Similarly, in the case of a medium rock mass, except in the range of 0.3 Dequ–2.5 Dequ ahead of the excavation face, the numerical analysis values of both modes were larger than the values calculated using the formulas suggested by Unlu and Gercek, as shown in Figure 16. In the case of a poor rock mass, except in the range of 0.8 Dequ–1.8 Dequ ahead of the excavation face, the numerical analysis values of both modes were larger than the values calculated using the formulas suggested by Unlu and Gercek, but the difference was not obvious, as shown in Figure 17. The Unlu and Gercek predictions assumed a circular tunnel section and were analyzed using a linear elastic model, regardless of the rock mass type involved. Overall, the displacement ratios in the excavated section were smaller than those found in the numerical analysis, and the distance to the excavation face based on the maximum displacement derived by Unlu and Gercek’s prediction formula was four times greater than the tunnel diameter. At the excavation face, the displacement ratio derived according to the prediction formula of Unlu and Gercek was also smaller than the numerical analysis result, and the difference between the two became larger as the rock mass became worse. Within a distance of about 0.25 to 2.5 diameters ahead of the excavation face, the numerical results tended to fall into a lower range than the ratios predicted by Unlu and Gercek.

6. Conclusions

In this paper, the deformation behaviors associated with tunnel excavation were investigated using 3D finite element analysis. Single-lane, two-lane, and three-lane cross sections were studied, with the geology rated as good, medium, or poor. Numerical calculations were performed with two different material models (Mohr–Coulomb and Hoek–Brown) for comparison. The influence of rock bolts on tunnels was also investigated. The following conclusions were reached:
(1)
The numerical analysis results did not show any distinct difference between the Mohr–Coulomb and Hoek–Brown models. The distribution of longitudinal deformation profiles along the tunnels was generally similar. Therefore, the careful selection of analytic methods and parameters should result in either model being suitable for numerical analysis.
(2)
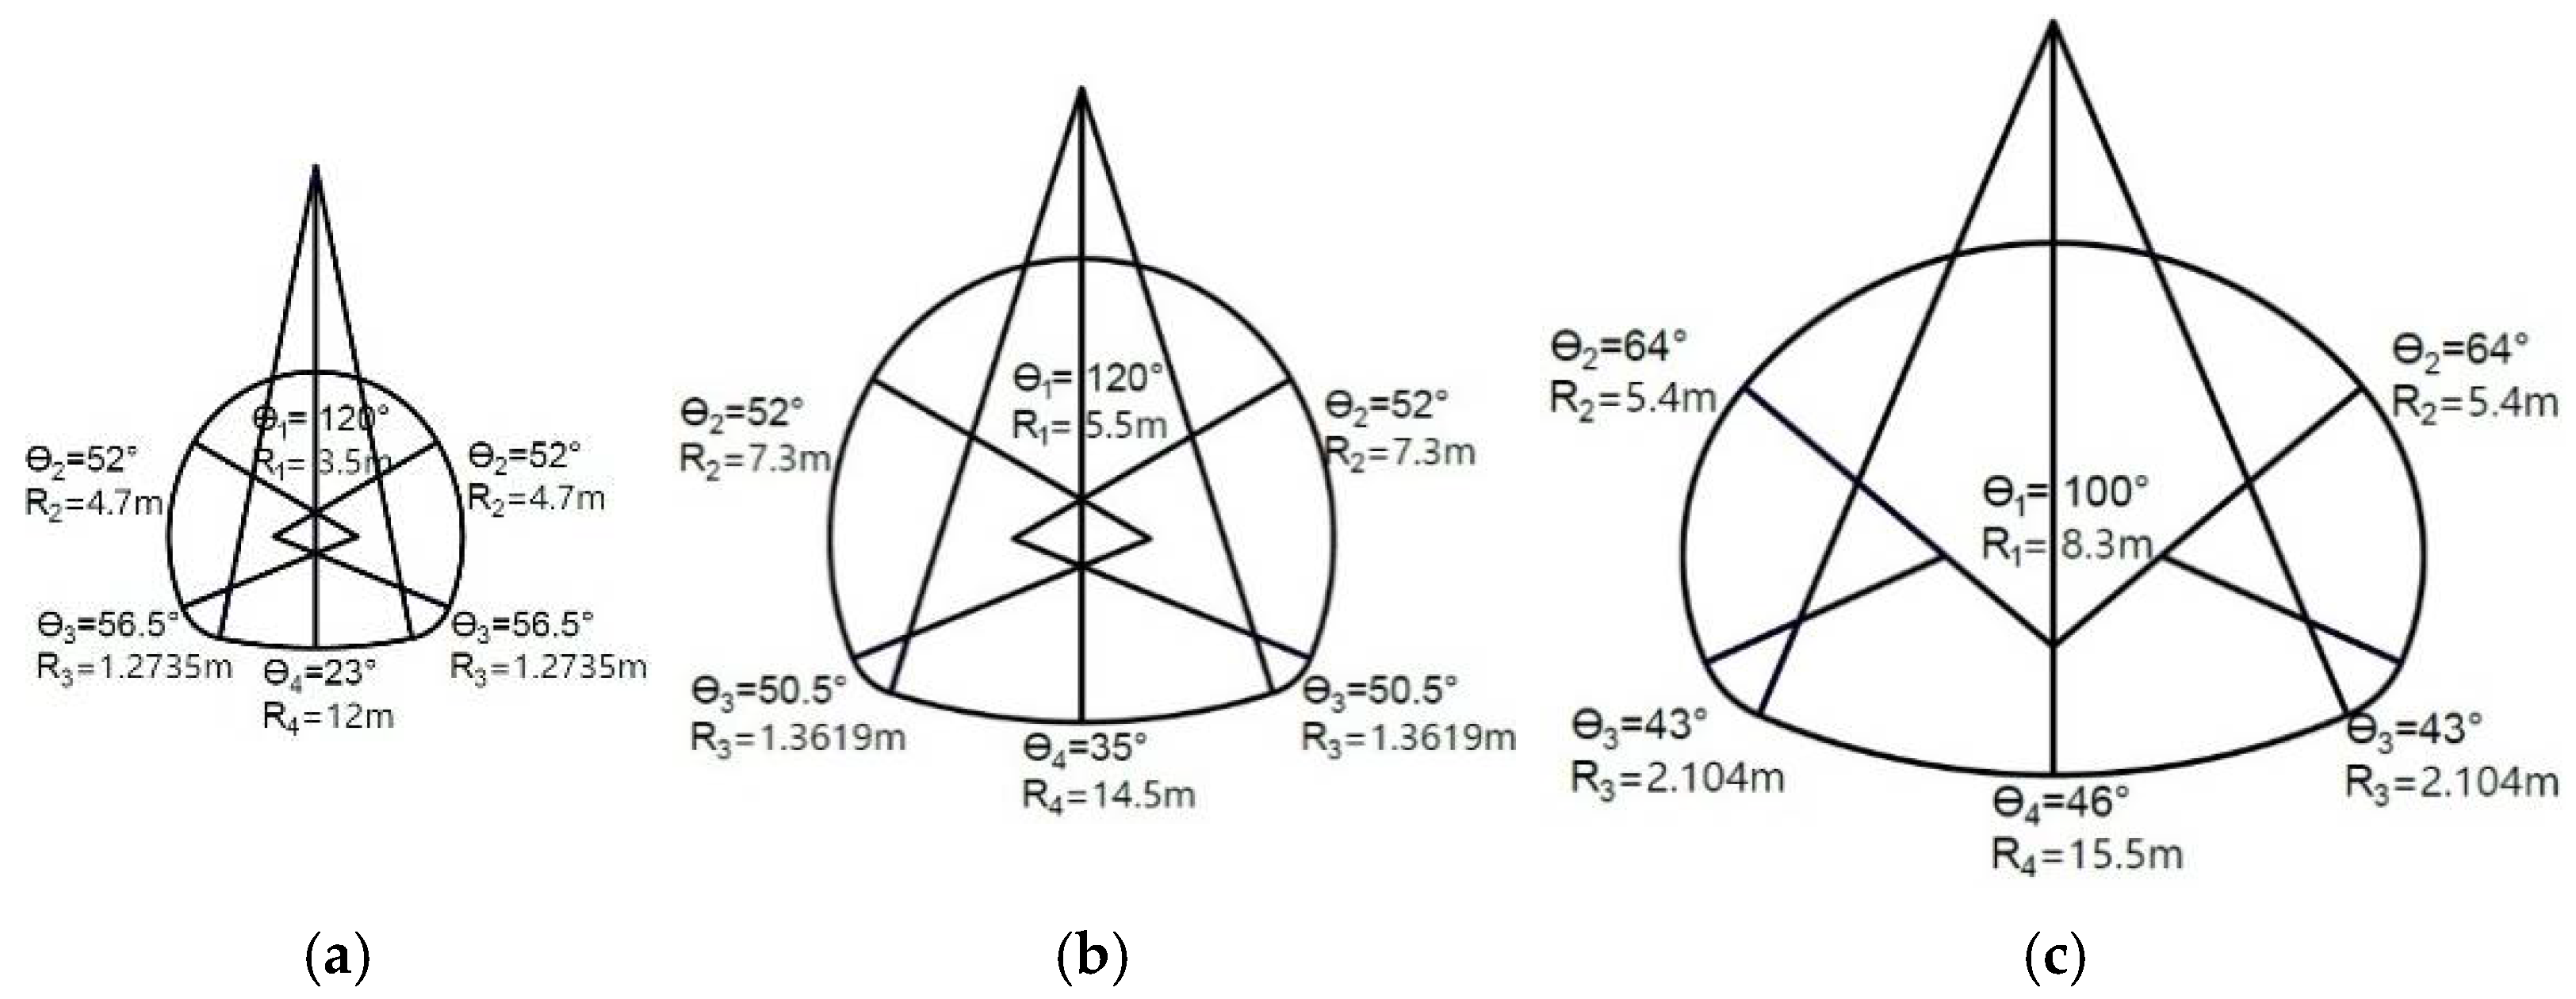
The tunnel cross section and the geology play significant roles in the tunnel excavation deformation behavior. In general, tunnels with large cross sections located in poor rock masses tended to exhibit large displacements due to excavation; in contrast, the displacements tended to be smaller for tunnels with small cross sections located in good rock masses. Moreover, the poorer the rock mass, the more significant the reduction effect caused by the installation of rock bolts for the displacements in tunnels with large cross sections.
(3)
It is extremely difficult to analyze rock bolts in a model. As the modeling of rock bolts is so complex, they are generally ignored. In this study, the actual on-site construction situation was considered, and the built model included comparisons of tunnels with and without rock bolts. In general, it is rare for research to explore the differences between these types of tunnels and provide specific comparative results.
(4)
The excavation face displacement ratio (uz-f/uz-max) depends on the quality of the rock mass. In the case of this study, the values of uz-f/uz-max were 0.39, 0.39, and 0.49 for good, medium, and poor rock masses, respectively.
(5)
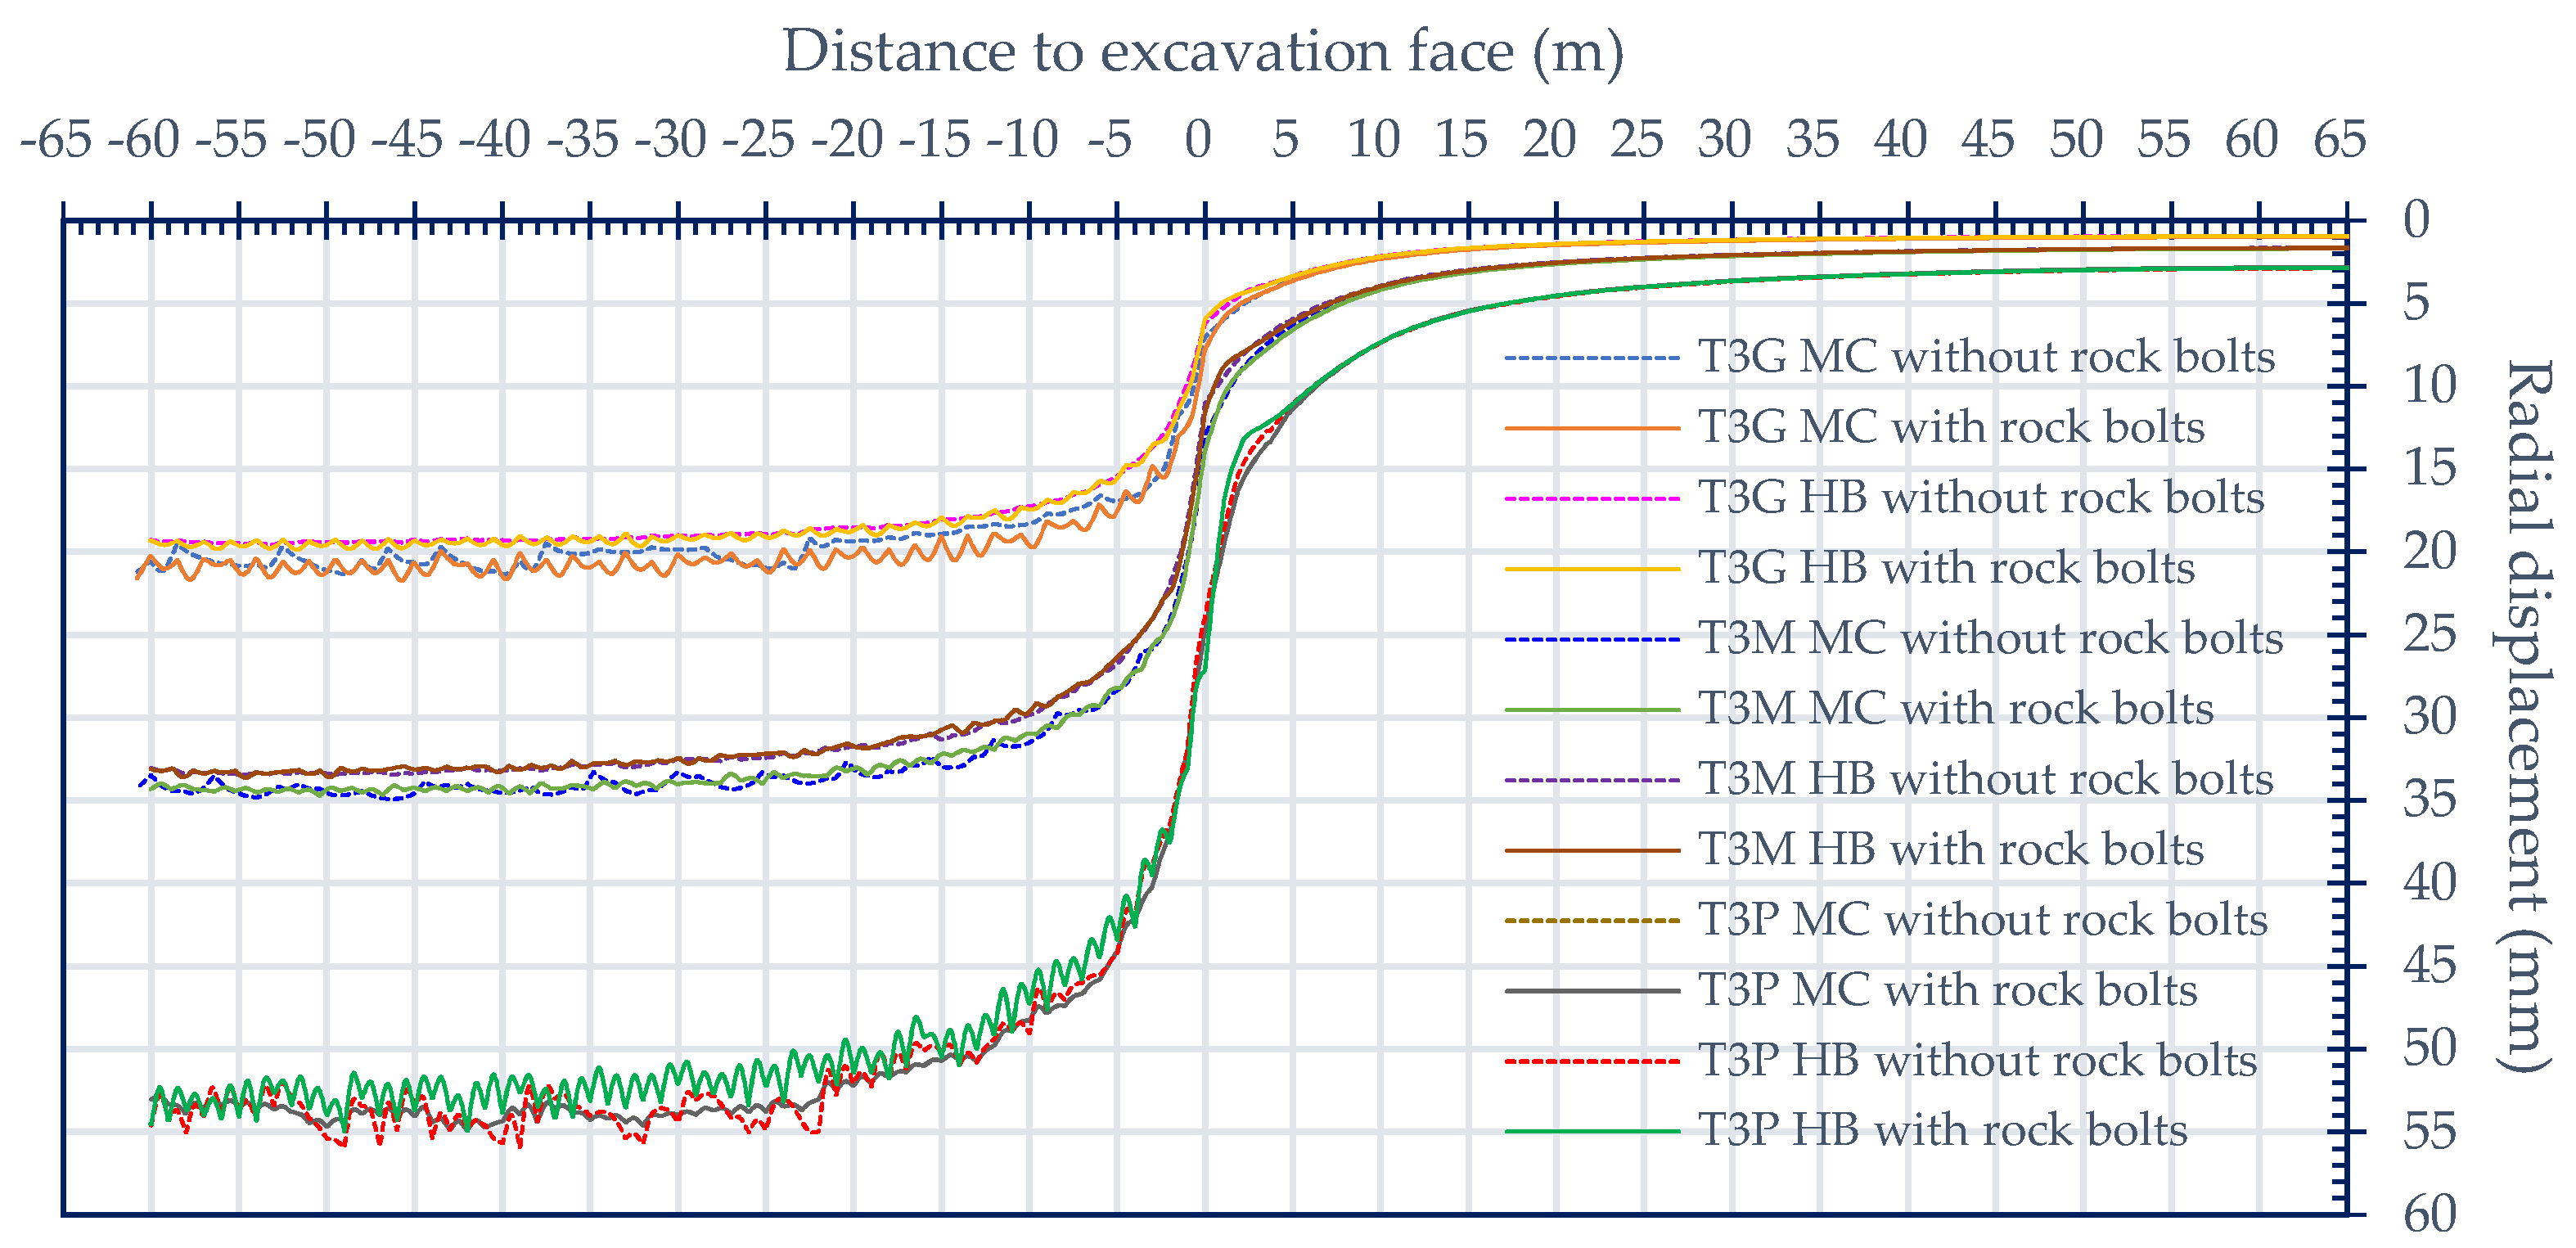
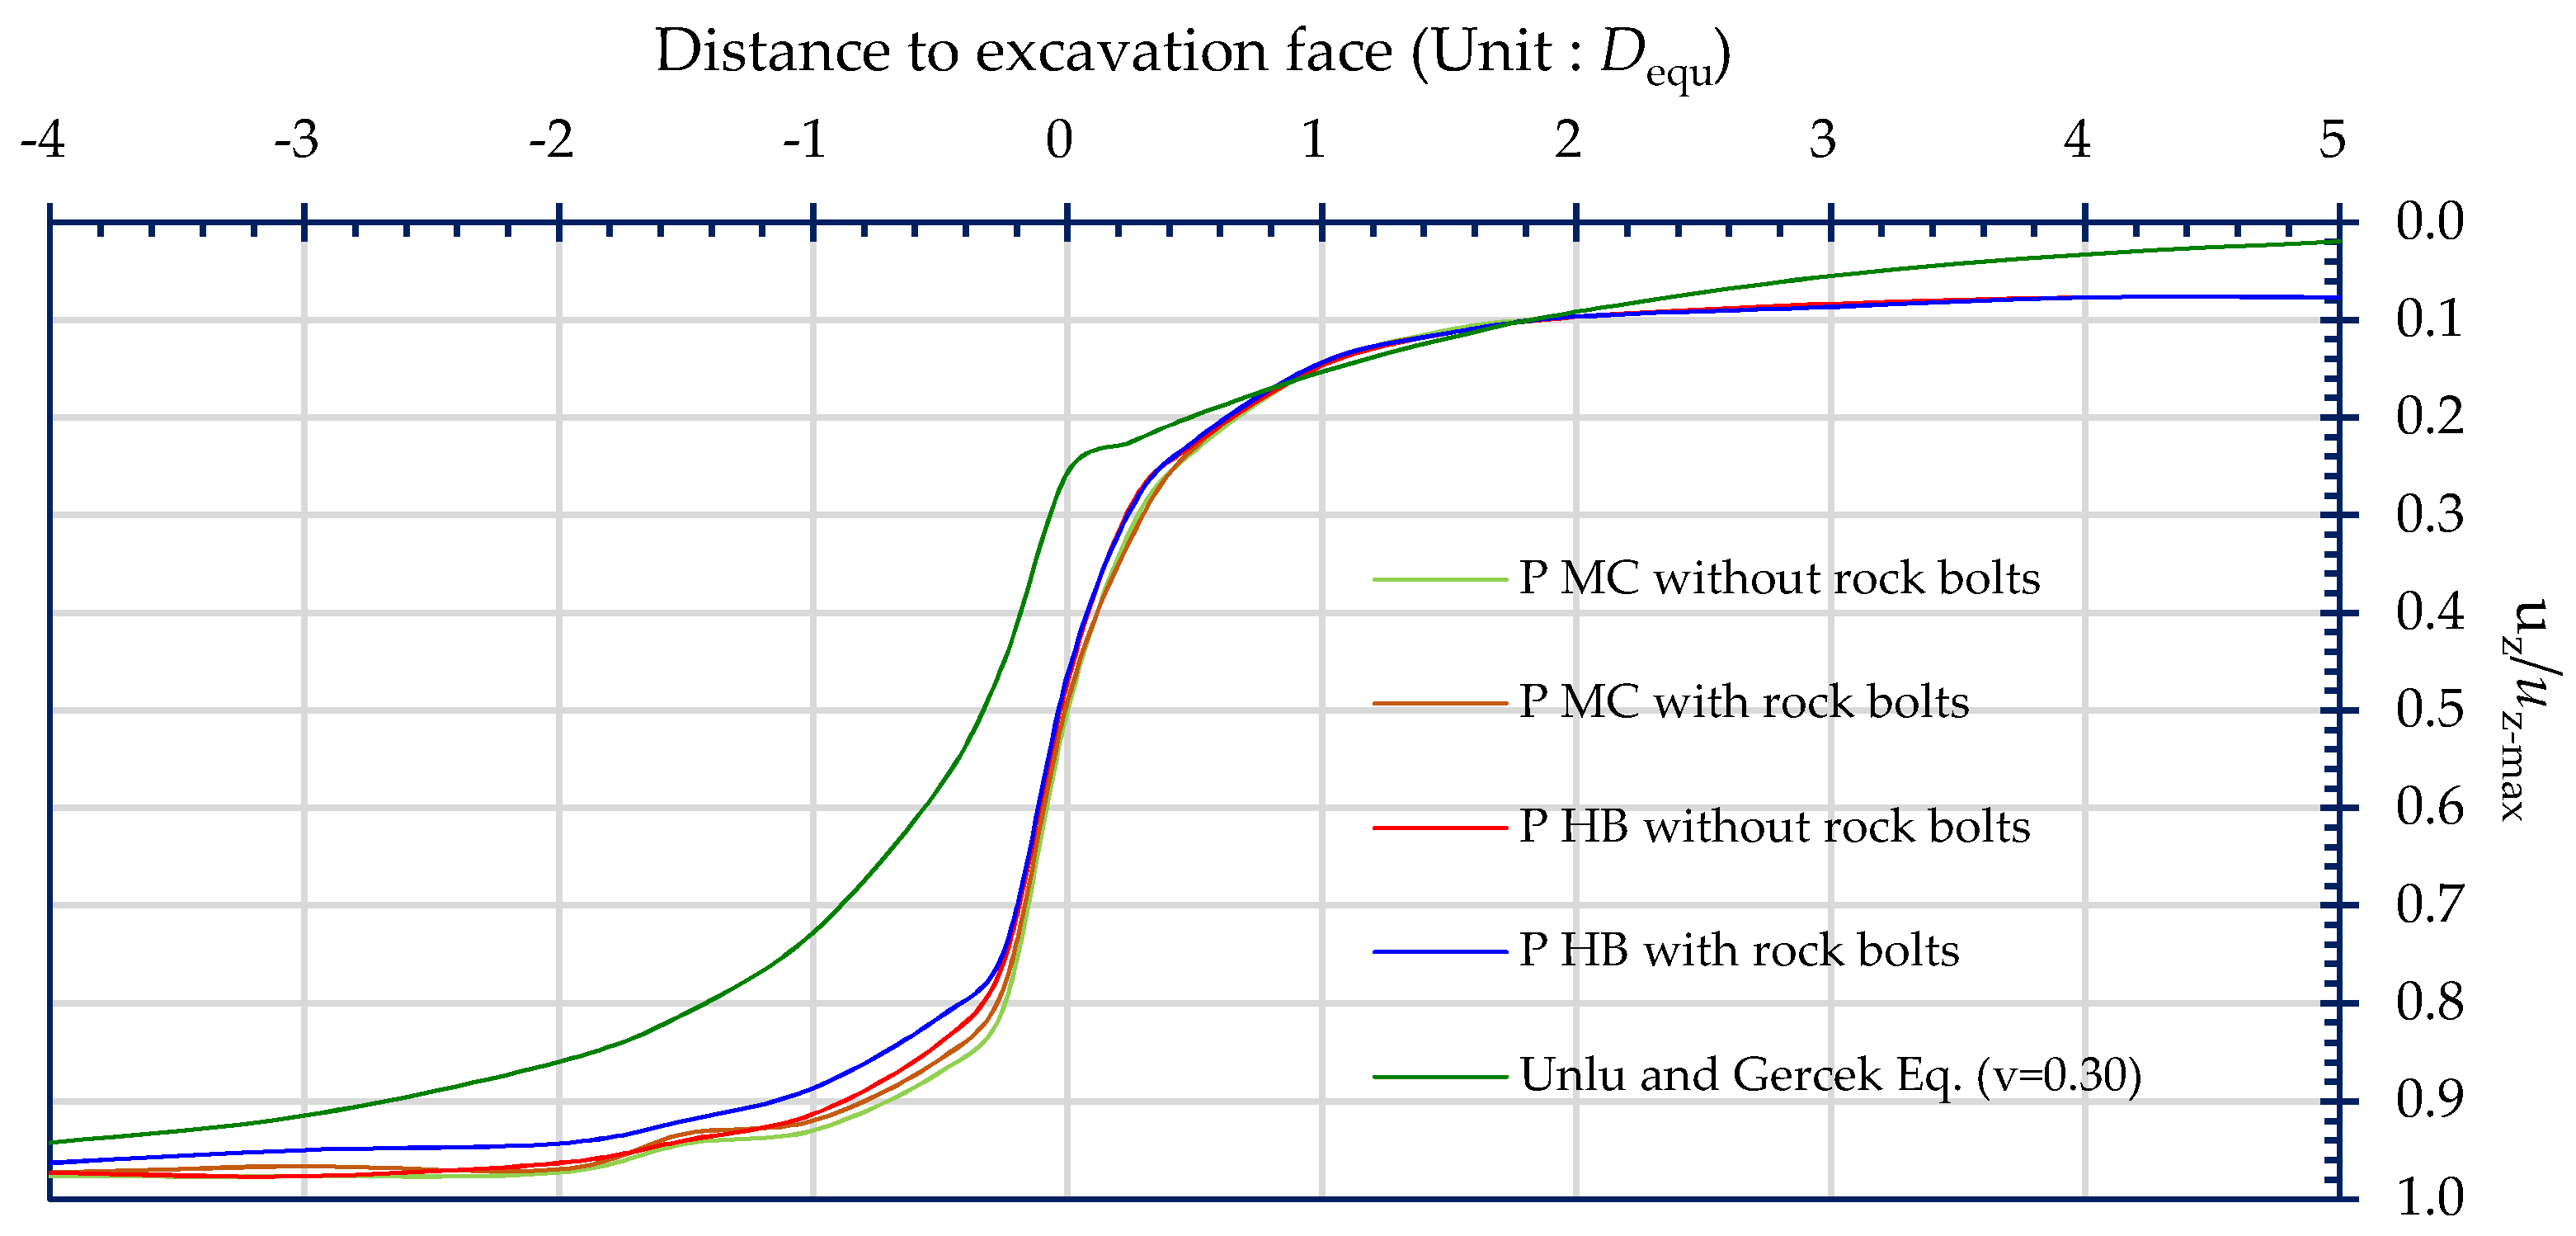
Ignoring time-dependent factors, the excavation face displacement ratio (uz-f/uz-max) was between 0.31 and 0.57 for the tunnels studied, and the poorer the geology, the higher the ratio. The displacement ratio increased dramatically within a distance of half the diameter (−0.5 Dequ) behind the excavation face (the excavated section), and the excavation-induced displacement reached its maximum at twice the diameter (−2 Dequ) behind the excavation face, with the displacement ratio approaching 1.
(6)
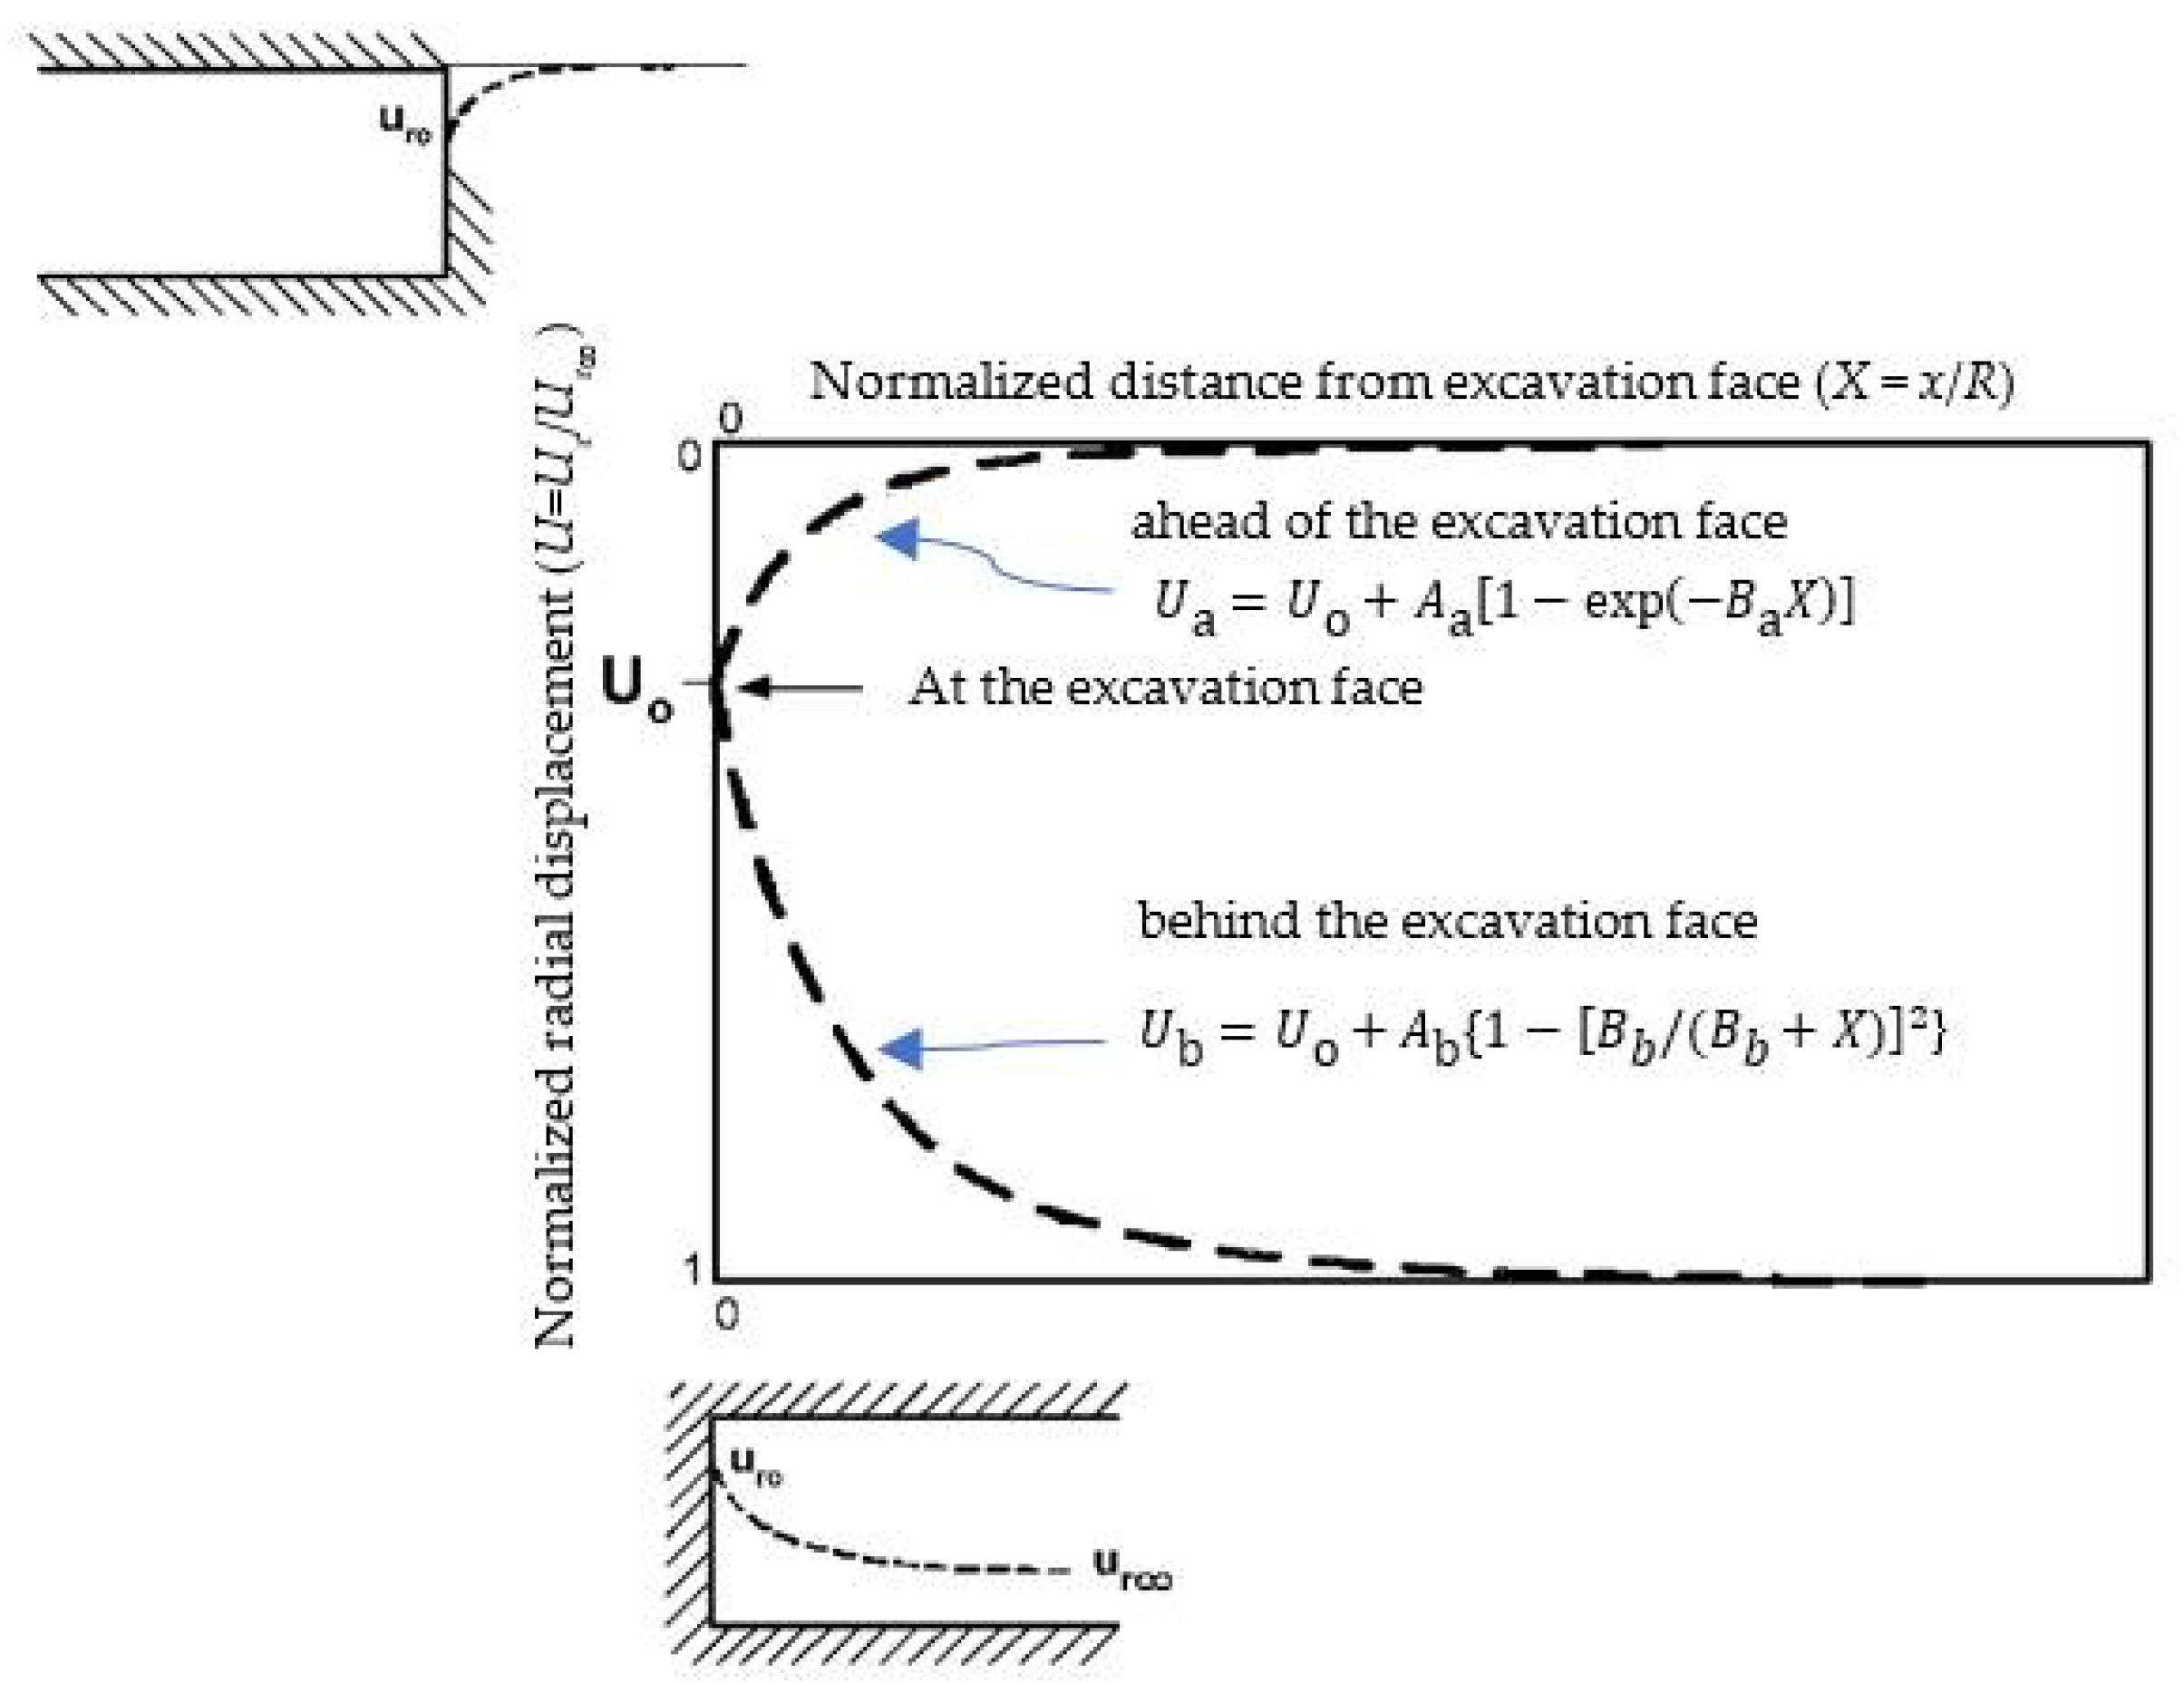
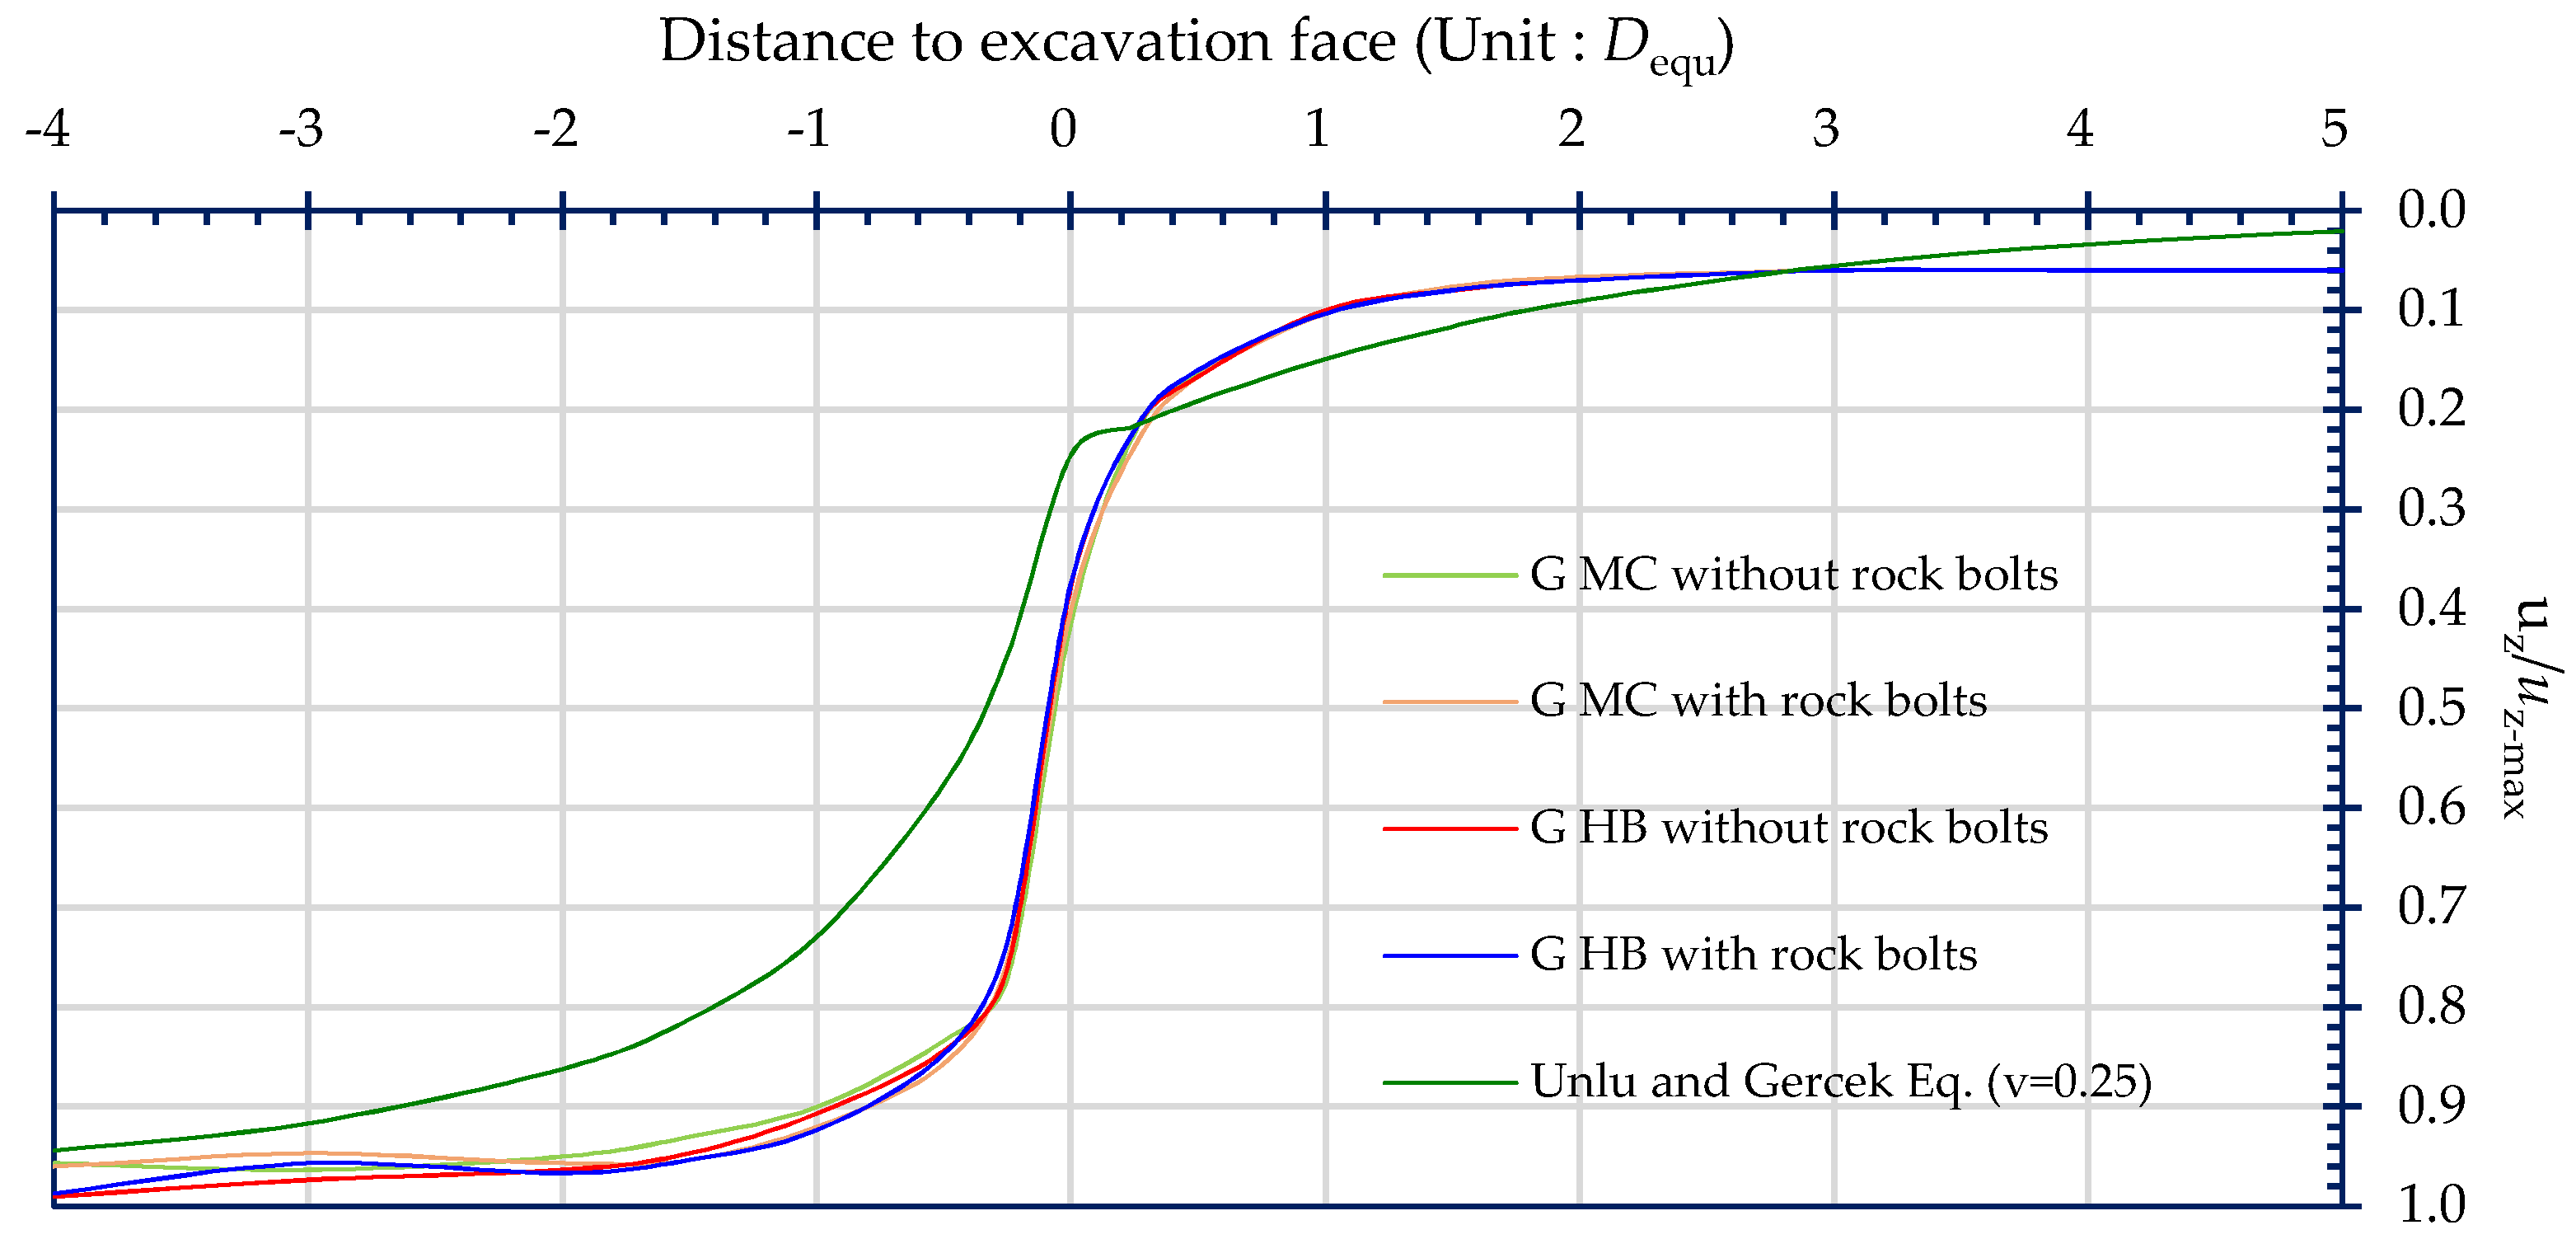
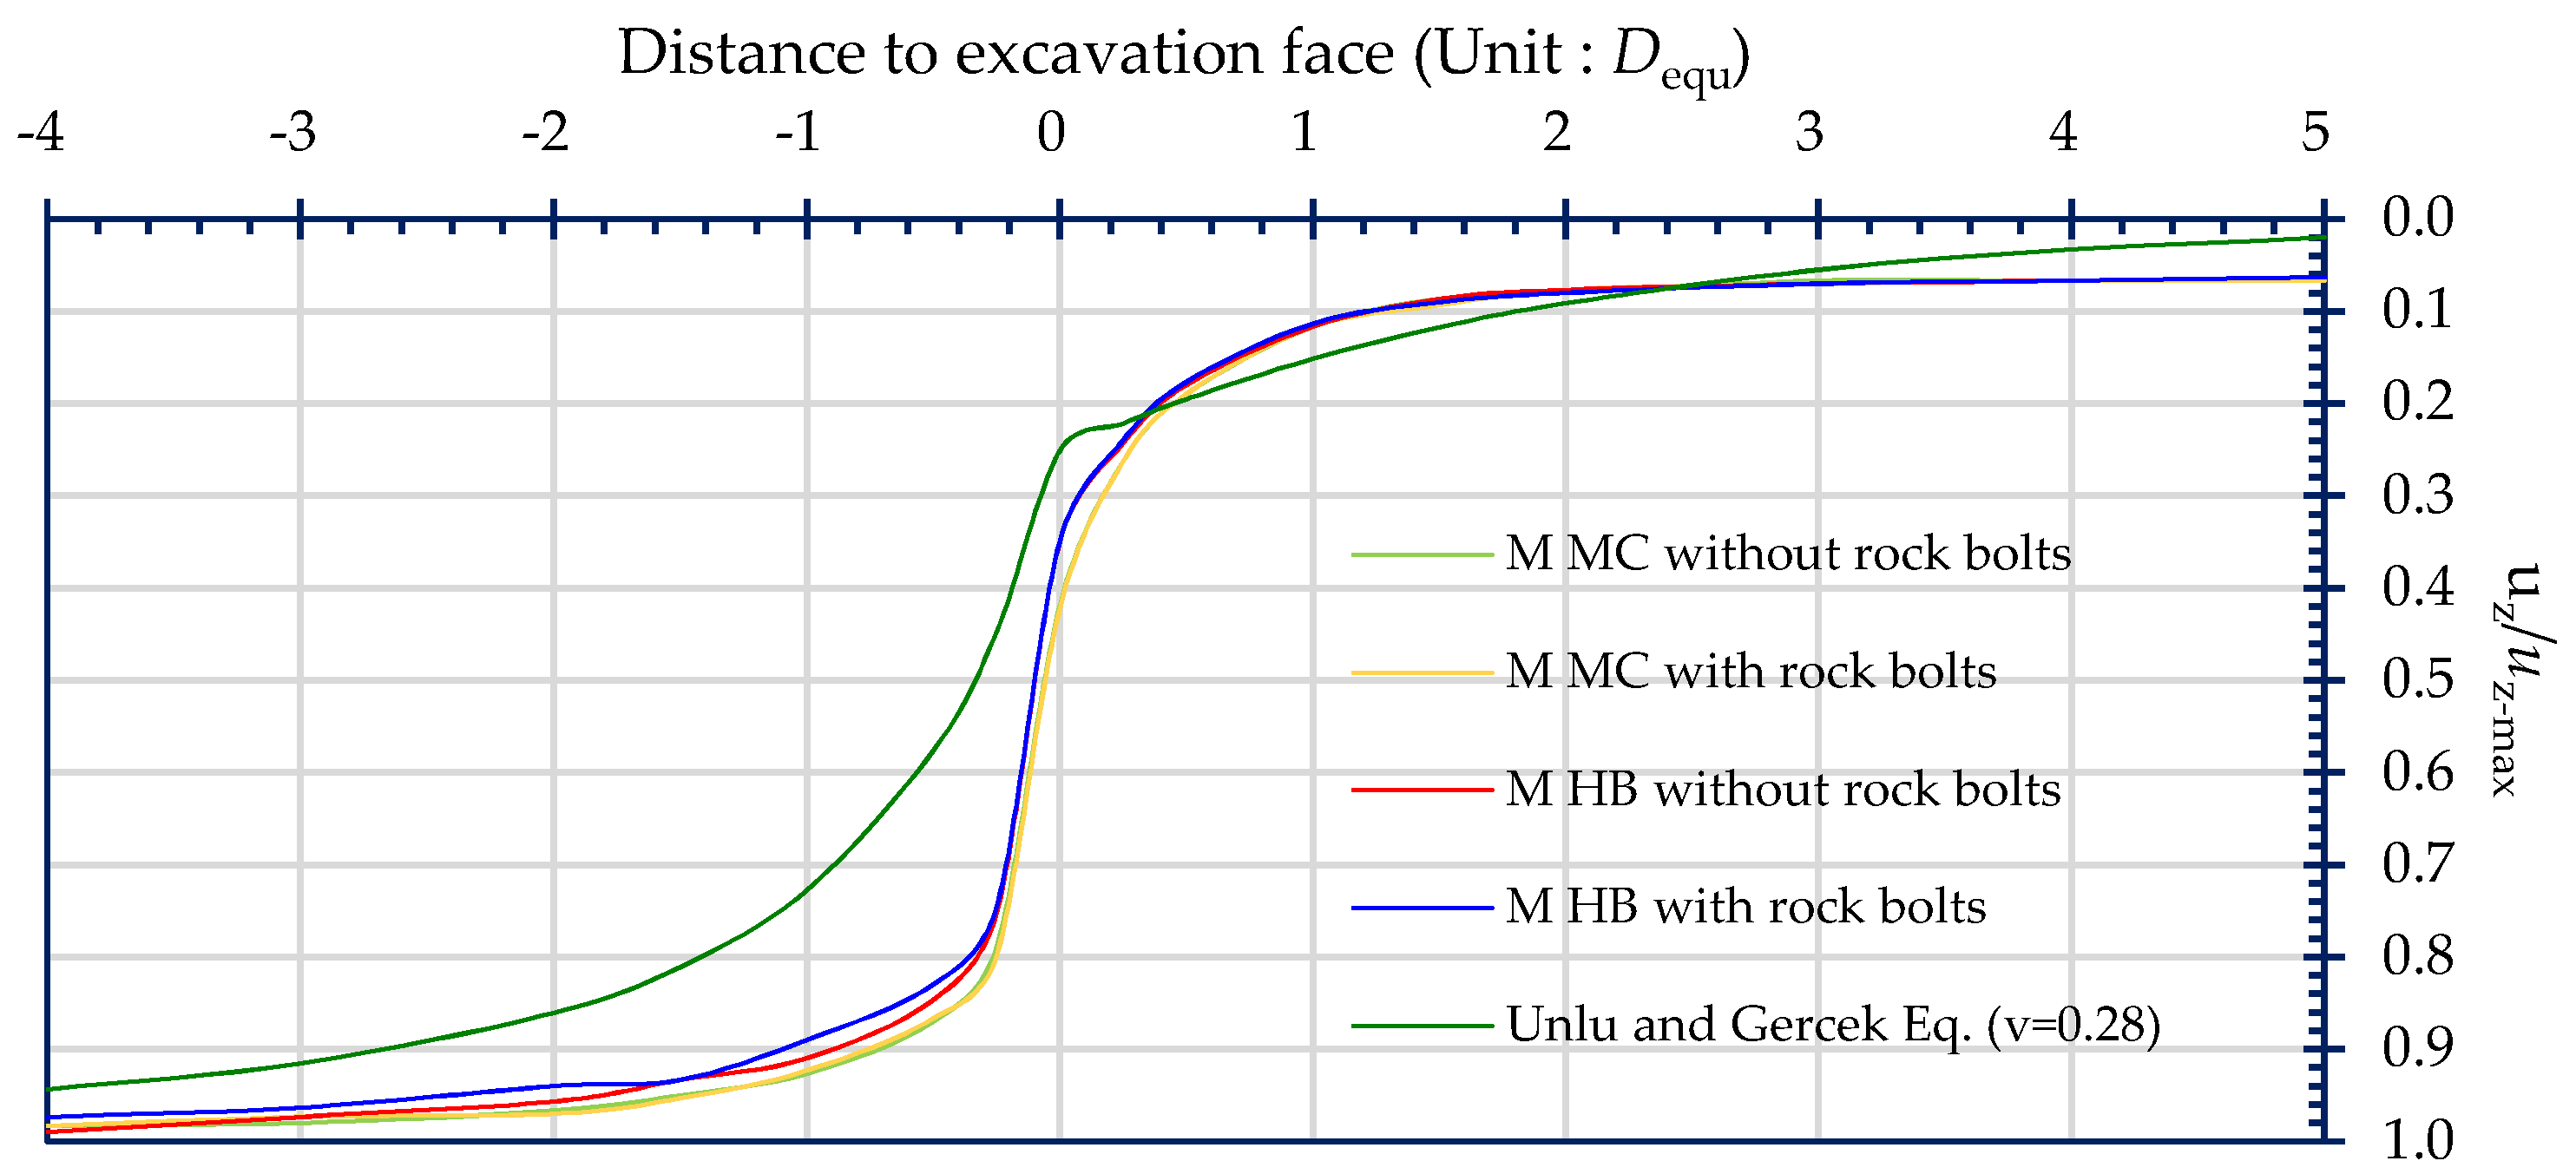
In the excavated section, the displacement ratio derived according to the prediction formula of Unlu and Gercek was smaller than the numerical analysis result, and the distance of the estimated maximum displacement to the excavation face was greater than 4 times the diameter of the tunnel. At the excavation face, the displacement ratio derived according to the formula of Unlu and Gercek was also smaller than the numerical analysis result, and the difference between the two became larger as the rock mass decreased in quality. Within a distance of about 0.25 to 2.5 diameters ahead of the excavation face, the numerical results tended to fall into a lower range than the ratios predicted by the formula of Unlu and Gercek.
(7)
Geology is one of the most important factors to consider in the excavation of a tunnel. In addition to the geological knowledge of engineers, the job site survey carried out before engineering planning and design should be performed as carefully as possible. Relevant rock mass classification and measurement operations should also establish standard operating procedures to maintain a good construction quality.
This study made some assumptions to facilitate the numerical analysis. Overburden depths at the tops of expressway tunnels in Taiwan vary from a few meters to 750 m, and this study assumed an overburden depth of 200 m. In addition, the groundwater level was assumed to be lower than the inner bottom of the tunnel, in order to allow the influence of groundwater to be ignored. Geotechnical stresses vary by location, and this study assumed a horizontal stress factor of 1.0. Tunnels are excavated in practice in steps, that is, in steps the size of the upper half of the cross section, bench, and invert. For the purposes of this study, all the studied tunnels were excavated with a full face.

Author Contributions

Conceptualization, S.-L.C.; methodology, C.-W.T.; software, K.-J.H. and X.-L.Z.; validation, C.-H.L. and K.-J.H.; formal analysis, C.-W.T. and C.-H.L.; investigation, S.-L.C. and K.-J.H.; resources, S.-L.C.; and X.-L.Z.; data curation, C.-W.T. and K.-J.H.; writing—original draft preparation, C.-W.T.; writing—review and editing, C.-W.T.; visualization, S.-L.C.; supervision, C.-W.T. and C.-H.L.; project administration, S.-L.C.; funding acquisition, S.-L.C. All authors have read and agreed to the published version of the manuscript.

Funding

The research was supported by the Ministry of Science and Technology of Taiwan, under grant number MOST 110-2221-E-027-025-MY2.

Institutional Review Board Statement

Not applicable.

Informed Consent Statement

Not applicable.

Data Availability Statement

The data presented in this study are available upon request from the corresponding author.

Acknowledgments

The authors sincerely thank the Ministry of Science and Technology of Taiwan for funding this research.

Conflicts of Interest

The authors declare no conflict of interest.

References

  1. Zheng, H.; Li, P.; Ma, G.; Zhang, Q. Experimental investigation of mechanical characteristics for linings of twins tunnels with asymmetric crosssection. Tunn. Undergr. Space Technol. 2021, 119, 104209. [Google Scholar] [CrossRef]
  2. Chen, H.; Li, L.; Li, J.; Sun, D. A Generic Analytical Elastic Solution for Excavation Responses of an Arbitrarily Shaped Deep Opening under Biaxial In Situ Stresses. Int. J. Geomech. 2022, 22, 04022023. [Google Scholar] [CrossRef]
  3. Weng, X.; Yu, H.; Niu, H.; Hu, J.; Han, W.; Huang, X. Interactive effects of crossing tunnel construction on existing tunnel: Three-dimensional centrifugal test and numerical analyses. Transp. Geotech. 2022, 35, 100789. [Google Scholar] [CrossRef]
  4. Liu, X.; Zeng, Y.; Fan, L.; Peng, S.; Liu, Q. Investigation on Rupture Initiation and Propagation of Traffic Tunnel under Seismic Excitation Based on Acoustic Emission Technology. Sensors 2022, 22, 4553. [Google Scholar] [CrossRef]
  5. Zeng, G.S.; Wang, H.N.; Jiang, M.J.; Luo, L.S. Analytical solution of displacement and stress induced by the sequential excavation of noncircular tunnels in viscoelastic rock. Int. J. Rock Mech. Min. Sci. 2020, 134, 104429. [Google Scholar] [CrossRef]
  6. Cao, C.; Shi, C.; Lei, M.; Yang, W.; Liu, J. Squeezing failure of tunnels: A case study. Tunn. Undergr Space Technol. 2018, 77, 188–203. [Google Scholar] [CrossRef]
  7. Duenser, C.; Beer, G. Simulation of sequential excavation with the boundary element method. Comput. Geotech. 2012, 44, 157–166. [Google Scholar] [CrossRef]
  8. Luo, Y.; Chen, J.; Chen, Y.; Diao, P.; Qiao, X. Longitudinal deformation profile of a tunnel in weak rock mass by using the back analysis method. Tunn. Undergr. Space Technol. 2018, 71, 478–493. [Google Scholar] [CrossRef]
  9. Riedel, C.; Mahmoudi, E.; Trapp, M.; Lamert, A.; Hölter, R.; Zhao, C.; Musayev, K.; Baitsch, M.; König, M.; Hackl, K.; et al. A hybrid exploration approach for the prediction of geological changes ahead of mechanized tunnel excavation. J. Appl. Geophys. 2022, 203, 104684. [Google Scholar] [CrossRef]
  10. Hoek, E.; Marinos, P.; Benissi, M. Applicability of the geological strength index (GSI) classification for very weak and sheared rock masses. The case of the Athens Schist Formation. Bull. Eng. Geol. Environ. 1998, 57, 151–160. [Google Scholar] [CrossRef]
  11. Hoek, E.; Brown, E.T. Empirical strength criterion for rock masses. J. Geotech. Eng. Div. 1980, 106, 1013–1035. [Google Scholar] [CrossRef]
  12. Cheng, X.; Hong, T.; Lu, Z.; Cheng, X. Characterization of Underlying Twin Shield Tunnels Due to Foundation-Excavation Unloading in Soft Soils: An Experimental and Numerical Study. Appl. Sci. 2021, 11, 10938. [Google Scholar] [CrossRef]
  13. Huang, X.; Schweiger, H.F.; Huang, H.W. Influence of deep excavations on nearby existing tunnels. Int. J. Geomech. 2013, 13, 170–180. [Google Scholar] [CrossRef]
  14. Zhang, J.F.; Chen, J.J.; Wang, J.H.; Zhu, Y.F. Prediction of tunnel displacement induced by adjacent excavation in soft soil. Tunn. Undergr. Space Technol. 2013, 36, 24–33. [Google Scholar] [CrossRef]
  15. Zhang, X.; Wei, G.; Jiang, C. The study for longitudinal deformation of adjacent shield tunnel due to foundation pit excavation with consideration of the retaining structure deformation. Symmetry 2020, 12, 2103. [Google Scholar] [CrossRef]
  16. Han, K.; Wang, X.; Hou, B.; Lin, X.; Cao, C. Analysis of Instability Mode and Limit Support Pressure of Shallow Tunnel Face in Sands. Symmetry 2020, 12, 2067. [Google Scholar] [CrossRef]
  17. Carranza-Torres, C.; Fairhurst, C. Application of the convergence-confinement method of tunnel design to rock masses that satisfy the Hoek-Brown failure criterion. Tunn. Undergr. Space Technol. 2000, 15, 187–213. [Google Scholar] [CrossRef]
  18. Song, S.G.; Li, S.C.; Li, L.P.; Zhang, Q.Q.; Wang, K.; Zhou, Y.; Liu, H.L. Study on longitudinal deformation profile of rock mass in a subsea tunnel. Mar. Georesour. Geotechnol. 2016, 34, 376–383. [Google Scholar] [CrossRef]
  19. Basarir, H.; Genis, M.; Ozarslan, A. The analysis of radial displacements occurring near the face of a circular opening in weak rock mass. Int. J. Rock Mech. Min. Sci. 2010, 47, 771–783. [Google Scholar] [CrossRef]
  20. Brady, B.H.G.; Brown, E.T. Rock Mechanics for Underground Mining, 2nd ed.; Chapman and Hall: London, UK, 1993. [Google Scholar]
  21. Unlu, T.; Gercek, H. Effect of Poisson’s ratio on the normalized radial displacements occurring around the face of a circular tunnel. Tunn. Undergr. Space Technol. 2003, 18, 547–553. [Google Scholar] [CrossRef]
  22. Prassetyo, S.H.; Gutierrez, M. Axisymmetric alternating direction explicit scheme for efficient coupled simulation of hydro-mechanical interaction in geotechnical engineering—Application to circular footing and deep tunnel in saturated ground. J. Rock Mech. Geotech. Eng. 2018, 10, 259–279. [Google Scholar] [CrossRef]
  23. Panet, M. Understanding Deformations in Tunnels. In Comprehensive Rock Engineering; Pergamon: London, UK, 1993; Volume 1, pp. 663–690. [Google Scholar]
  24. Ziaei, A.; Ahangari, K. The Effect of Topography on Stability of Shallow Tunnels Case Study: The Diversion and Conveyance Tunnels of Safa Dam. Transp. Geotech. 2018, 14, 126–135. [Google Scholar] [CrossRef]
  25. Carranza-Torres, C.; Fairhurst, C. The elasto-plastic response of underground excavations in rock masses that satisfy the Hoek±Brown failure criterion Tunn. Int. J. Rock Mech. Min. Sci. 1999, 36, 777–809. [Google Scholar] [CrossRef]
  26. Kavvadas, M.; Litsas, D.; Vazaios, I.; Fortsakis, P. Development of a 3D finite element model for shield EPB tunnelling. Tunn. Undergr. Space Technol. 2017, 65, 22–34. [Google Scholar] [CrossRef]
  27. Deng, H.; Cao, P.; Liu, Y.; Liu, Z.; Meng, G.; Fan, Z.; Xie, W. Numerical Analysis of Ground Settlement Patterns Resulting from Tunnel Excavation in Composite Strata. Appl. Sci. 2022, 12, 5479. [Google Scholar] [CrossRef]
  28. Abdelkader, E.M.; Al-Sakkaf, A.; Elshaboury, N.; Alfalah, G. Hybrid Grey Wolf Optimization-Based Gaussian Process Regression Model for Simulating Deterioration Behavior of Highway Tunnel Components. Processes 2021, 10, 36. [Google Scholar] [CrossRef]
  29. National Expressway Engineering Bureau, Ministry of Transportation and Communications. Technical Practice of National Highway Geoengineering; National Expressway Engineering Bureau, Ministry of Transportation and Communications: Taipei, Taiwan, 2013; pp. 87–140. (In Chinese)
  30. National Expressway Engineering Bureau, Ministry of Transportation and Communications. Second Highway Construction Album-Tunnel and Geoengineering; National Expressway Engineering Bureau, Ministry of Transportation and Communications: Taipei, Taiwan, 2004; pp. 68–72. (In Chinese)
  31. Lee, S.; Tseng, D. Review and perspective of expressway tunnels in Taiwan. J. Rock Mech. Geotech. Eng. 2011, 3, 385–387. [Google Scholar]
  32. Bieniawski, Z.T. Engineering Rock Mass Classification; John Wiley & Sons: New York, NY, USA, 1989; pp. 51–68. [Google Scholar]
  33. Chen, S.; Lee, S.; Gui, M.W. Effect of rock pillar width on the excavation behavior of parallel tunnels. Tunn. Undergr. Space Technol. 2009, 24, 148–154. [Google Scholar] [CrossRef]
  34. Chen, S.L.; Lee, S.C. An investigation on tunnel deformation behavior of expressway tunnels. Geomech. Eng. 2020, 21, 215–226. [Google Scholar]
  35. Lai, C.H. Three-Dimensional Numerical Analysis of Mountain Tunnels-Simulation of Crown Arch Displacement Using Data from Existing Tunnels in Taiwan. Master’s Thesis, National Taipei University of Technology, Taipei, Taiwan, 2020. (In Chinese). [Google Scholar]
  36. PLAXIS 3D Reference Manual. 2018. Available online: https://pdfcoffee.com/plaxis-3d-reference-manual-2018-pdf-free.html (accessed on 20 May 2021).
  37. National Expressway Engineering Bureau, Ministry of Transportation and Communications. Beiyi Expressway Construction Special (Technical Edition)-Tunnel Engineering; National Expressway Engineering Bureau, Ministry of Transportation and Communications: Taipei, Taiwan, 2006; pp. 59–60. (In Chinese)
  38. Brinkgreve, R.B.J.; Kumarswamy, S.; Swolfs, W.M. Plaxis Material Models Manual; Plaxis B.V.: Delft, The Netherlands, 2017; pp. 35–53. [Google Scholar]
  39. Erik, E. The Hoek-Brown failure criterion. Rock Mech. Rock Eng. 2012, 45, 981–988. [Google Scholar]
  40. Hoek, E.; Carranza, C.; Corkum, B. Hoek-Brown failure criterion-2002 edition. Proc. NARMS-Tac. 2002, 1, 267–273. [Google Scholar]
Figure 1. The radial displacement of the front and rear sections of the tunnel face along the tunnel axis [8].
Symmetry 14 01508 g001
Figure 2. FLAC simulation curve [24,25].
Symmetry 14 01508 g002
Figure 3. The 3D boundary settings used for TBM simulation [26].
Symmetry 14 01508 g003
Figure 4. Statistical models of the normalized radial displacements occurring around the excavation face [21].
Symmetry 14 01508 g004
Figure 5. Examples of tunnel cross sections: (a) single-lane cross section, (b) two-lane cross section, and (c) three-lane cross section [29].
Symmetry 14 01508 g005
Figure 6. Geometries of 3 types of cross sections: (a) single-lane cross section, (b) two-lane cross section, and (c) three-lane cross section [30,31].
Symmetry 14 01508 g006
Figure 7. Flow chart for PLAXIS 3D tunnel excavation simulation.
Symmetry 14 01508 g007
Figure 8. Model grids for T3P.
Symmetry 14 01508 g008
Figure 9. Schematic diagram of the configuration of rock bolts in T3P.
Symmetry 14 01508 g009
Figure 10. Schematic diagram of the tunnel section of T3P with rock bolts.
Symmetry 14 01508 g010
Figure 11. Shading distribution diagram of the vertical displacement for T3P with rock bolts.
Symmetry 14 01508 g011
Figure 12. Vertical crown displacements for each rock mass rating, with and without the installation of rock bolts, for both the MC and HB models (single-lane cross section).
Symmetry 14 01508 g012
Figure 13. Vertical crown displacements for each rock mass rating, with and without the installation of rock bolts, for both the MC and HB models (two-lane cross section).
Symmetry 14 01508 g013
Figure 14. Vertical crown displacements for each rock mass rating, with and without the installation of rock bolts, for both the MC and HB models (three-lane cross section).
Symmetry 14 01508 g014
Figure 15. Comparison of the displacement ratio between the numerical analysis results and the prediction formulas suggested by Unlu and Gercek (in the case of a good rock mass).
Symmetry 14 01508 g015
Figure 16. Comparison of the displacement ratio between the numerical analysis results and the prediction formulas suggested by Unlu and Gercek (in the case of a medium rock mass).
Symmetry 14 01508 g016
Figure 17. Comparison of the displacement ratio between the numerical analysis results and the prediction formulas suggested by Unlu and Gercek (in the case of a poor rock mass).
Symmetry 14 01508 g017
Table 1. Tunnel rock mass ratings.
Rock Mass RatingIIIIIIIVVVI
RMR100–8180–6160–4140–2120–1110–0
Rock QualityGoodMediumPoor
Table 2. Tunnel symbols and associated data.
Tunnel Cross SectionCross-Sectional Area
(m2)
Equivalent Diameter
(m)
Rock
Condition
Tunnel SymbolRound Length
(m)
Shotcrete Thickness
(m)
Single-lane41.697.29GoodT1G2.00.12
MediumT1M1.80.15
PoorT1P1.50.25
Two-lane100.3511.3GoodT2G1.80.15
MediumT2M1.50.20
PoorT2P1.20.30
Three-lane133.7613.05GoodT3G1.50.20
MediumT3M1.20.25
PoorT3P1.00.35
Table 3. Rock mass parameters used for the Mohr–Coulomb model.
ParameterUnitRock Condition
Good (G)Medium (M)Poor (P)
Dry unit weight of rock, γdrykN/m3232323
Wet unit weight of rock, γwetkN/m3252525
Deformation modulus of rock, EmkN/m22,000,0001,000,000500,000
Poisson s   ratio ,   v 0.250.280.3
Cohesion, ckN/m2300150100
Angle of friction, φ°332926
Dilatancy angle, ψ°300
Lateral stress coefficient, K0 111
Table 4. Rock mass parameters for the Hoek–Brown model.
ParameterUnitGood (G)Medium (M)Poor (P)
Unsaturated unit weight of rock, γunsatkN/m3232323
Saturated unit weight of rock, γsatkN/m3252525
Young’s modulus of rock mass, EmkN/m22,000,0001,000,000500,000
Poisson s   ratio ,   v -0.250.280.30
Uniaxial   compressive   strength   of   rock ,   σ ci kN/m224,00018,00012,000
Intact   rock   index ,   m i -12108
Geological strength index, GSI-604530
Rock disturbance index, D-0.40.30.2
Dilatancy   angle   when   σ 3 = 0, ψmax°300
Confining   pressure   when   ψ = 0 ,   σ 3 kN/m2115000
Reduction factor for interfacial strength, Rinter-0.80.80.8
Lateral stress coefficient, K0-111
Table 5. Shotcrete support parameters.
Tunnel SymbolT1GT1MT1PT2GT2MT2PT3GT3MT3P
Shotcrete thickness (m)0.120.150.250.150.200.300.200.250.35
Unit weight (kN/m3)24
Young’s modulus (kN/m2)2.4 × 107
Poisson s   ratio ,   v 0.17
Table 6. Rock bolt parameters.
Tunnel SymbolT1GT1MT1PT2GT2MT2PT3GT3MT3P
Length (m)444555666
Unit weight (kN/m3)77
Young’s modulus (kN/m2)2.1 × 108
Diameter (m)0.05
Table 7. Numerical analysis results for each tunnel (the Mohr–Coulomb model).
Tunnel SymbolDequ
(m)
uz-max (mm)uz-max to Excavation Face (m)0.9 × uz-max (mm)0.9 × uz-max to Excavation Face (m)uz-f (mm)uz-f /uz-max0.1 × uz-max (mm)0.1 × uz-max to Excavation Face (m)
T1G7.297.74−21.006.97−5.003.320.430.778.92
(−2.88 Dequ)(−0.69 Dequ)(1.22 Dequ)
T1M7.2911.49−19.1110.34−3.815.030.441.1511.83
(−2.62 Dequ)(−0.52 Dequ)(1.62 Dequ)
T1P7.2914.41−22.2612.97−4.998.100.561.4428.69
(−3.05 Dequ)(−0.68 Dequ)(3.93 Dequ)
T2G11.3014.06−47.1012.65−15.606.940.441.4112.11
(−4.14 Dequ)(−1.38 Dequ)(1.07 Dequ)
T2M11.3020.46−32.2518.41−8.258.960.482.0514.78
(−2.85 Dequ)(−0.73 Dequ)(1.31 Dequ)
T2P11.3026.45−38.4023.81−6.3012.730.492.6523.92
(−3.4 equ)(−0.56 Dequ)(2.12 Dequ)
T3G13.0521.33−48.7619.20−17.263.320.332.1311.09
(−3.74 Dequ)(−1.32 Dequ)(0.85 Dequ)
T3M13.0534.90−46.2131.41−12.015.050.373.4912.29
(−3.54 Dequ)(−0.92 Dequ)(0.94 Dequ)
T3P13.0554.89−42.0149.40−11.988.100.455.4914.79
(−3.22 Dequ)(−0.92 Dequ)(1.13 Dequ)
Table 8. Numerical analysis results for each tunnel (the Hoek–Brown model).
Tunnel SymbolDequ
(m)
uz-max (mm)uz-max to Excavation Face (m)0.9 × uz-max (mm)0.9 × uz-max to Excavation Face (m)uz-f (mm)uz-f /uz-max0.1 × uz-max (mm)0.1 × uz-max to Excavation Face (m)
T1G7.297.52−29.016.77−6.412.580.340.758.24
(−3.98 Dequ)(−0.88 Dequ)(1.13 Dequ)
T1M7.2911.06−19.119.95−5.64.090.371.1111.36
(−2.62 Dequ)(−0.77 Dequ)(1.56 Dequ)
T1P7.2914.42−18.5112.98−7.267.540.521.4427.96
(−2.54 Dequ)(−1.00 Dequ)(3.84 Dequ)
T2G11.312.94−47.111.65−9.36.030.471.2912.09
(−4.17 Dequ)(−0.82 Dequ)(1.07 Dequ)
T2M11.319.36−45.7517.42−9.426.850.351.9414.78
(−4.05 Dequ)(−0.83 Dequ)(1.31 Dequ)
T2P11.326.35−31.823.72−8.6211.720.442.6424.53
(−2.81 Dequ)(−0.76 Dequ)(2.17 Dequ)
T3G13.0519.55−53.2817.6−11.646.170.321.9611.48
(−4.08 Dequ)(−0.89 Dequ)(0.88 Dequ)
T3M13.0533.43−54.5930.09−10.511.030.333.3412.29
(−4.18 Dequ)(−0.80 Dequ)(0.94 Dequ)
T3P13.0555.95−3950.36−12.7723.810.435.614.48
(−2.99 Dequ)(−0.98 Dequ)(1.11 Dequ)
Table 9. Numerical analysis results for tunnels with rock bolts (the Mohr–Coulomb model).
Tunnel SymbolDequ
(m)
uz-max (mm)uz-max to Excavation Face (m)0.9 × uz-max (mm)0.9 × uz-max to Excavation Face (m)uz-f (mm)uz-f /uz-max0.1 × uz-max (mm)0.1 × uz-max to Excavation Face (m)
T1G7.298.04−23.007.24−6.502.780.350.808.61
(−3.16 Dequ)(−0.89 Dequ)(1.18 Dequ)
T1M7.2911.68−24.5010.51−5.604.840.411.1711.18
(−3.36 Dequ)(−0.77 Dequ)(1.53 Dequ)
T1P7.2914.17−25.2512.75−4.987.880.561.4227.19
(−3.46 Dequ)(−0.68 Dequ)(3.73 Dequ)
T2G11.3014.07−47.1012.66−8.408.040.571.4112.90
(−4.17 Dequ)(−0.74 Dequ)(1.14 equ)
T2M11.3020.45−42.0018.41−6.759.700.472.0515.83
(−3.72 Dequ)(−0.60 Dequ)(1.40 Dequ)
T2P11.3026.60−39.0023.94−7.8012.420.472.6623.36
(−3.45 Dequ)(−0.69 Dequ)(2.07 Dequ)
T3G13.0521.73−45.7719.56−16.557.700.352.1711.12
(−3.51 Dequ)(−1.27 Dequ)(0.85 Dequ)
T3M13.0534.69−50.4031.22−11.4213.860.403.4712.97
(−3.86 Dequ)(−0.88 Dequ)(0.99 Dequ)
T3P13.0554.17−49.0048.75−11.9824.500.455.4215.03
(−3.75 Dequ)(−0.92 Dequ)(1.15 Dequ)
Table 10. Numerical analysis results for tunnels with rock bolts (the Hoek–Brown model).
Tunnel SymbolDequ
(m)
uz-max (mm)uz-max to Excavation Face (m)0.9 × uz-max (mm)0.9 × uz-max to Excavation Face (m)uz-f (mm)uz-f /uz-max0.1 × uz-max (mm)0.1 × uz-max to Excavation Face (m)
T1G7.297.69−29.006.92−8.022.370.310.778.58
(−3.98 Dequ)(−1.10 Dequ)(1.18 Dequ)
T1M7.2911.40−28.1110.26−10.103.750.331.1410.22
(−3.86 Dequ)(−1.39 Dequ)(1.40 Dequ)
T1P7.2914.09−27.5012.68−7.637.070.501.4127.19
(−3.77 Dequ)(−1.05 Dequ)(3.73 Dequ)
T2G11.3012.98−47.1011.68−10.206.620.511.3012.10
(−4.17 Dequ)(−0.90 Dequ)(1.07 Dequ)
T2M11.3019.83−42.7517.85−8.257.340.371.9815.12
(−3.78 Dequ)(−0.73 Dequ)(1.34 Dequ)
T2P11.3027.80−39.0025.02−12.6011.330.412.7822.25
(−3.45 Dequ)(−1.12 Dequ)(1.97 Dequ)
T3G13.0519.86−51.7317.87−13.535.950.301.9911.90
(−3.96 Dequ)(−1.04 Dequ)(0.91 Dequ)
T3M13.0533.63−54.6330.27−12.5711.530.343.3612.68
(−4.19 Dequ)(−0.96 Dequ)(0.97 Dequ)
T3P13.0554.96−49.0049.46−12.4526.650.485.5015.03
(−3.75 Dequ)(−0.95 Dequ)(1.15 Dequ)
Table 11. Crown displacement at 2.5 Dequ behind the excavation face for each tunnel (the Mohr–Coulomb model).
Tunnel SymbolDisplacement, |u| (m)Tunnel SymbolDisplacement, |u| (m)DRR
T1G0.0073T1G rock bolt0.00721.37%
T1M0.0108T1M rock bolt0.01061.85%
T1P0.0137T1P rock bolt0.01332.92%
T2G0.0128T2G rock bolt0.01280.00%
T2M0.0192T2M rock bolt0.01901.04%
T2P0.0249T2P rock bolt0.02432.41%
T3G0.0189T3G rock bolt0.01890.00%
T3M0.0324T3M rock bolt0.03181.85%
T3P0.0507T3P rock bolt0.04922.96%
Note: DRR = (displacement with rock bolt—displacement without rock bolt)/displacement without rock bolt.
Table 12. Crown displacement at 2.5 Dequ behind the excavation face for each tunnel (the Hoek–Brown model).
Tunnel SymbolDisplacement, |u| (m)Tunnel SymbolDisplacement, |u| (m)DRR
T1G0.0073T1G rock bolt0.00721.37%
T1M0.0103T1M rock bolt0.01011.94%
T1P0.0129T1P rock bolt0.01234.65%
T2G0.0128T2G rock bolt0.01270.78%
T2M0.019T2M rock bolt0.01881.05%
T2P0.0247T2P rock bolt0.02412.43%
T3G0.0179T3G rock bolt0.01780.56%
T3M0.0309T3M rock bolt0.03031.94%
T3P0.0508T3P rock bolt0.04923.15%
Table 13. Normalized tunnel analysis results (the Mohr–Coulomb model).
Tunnel SymbolDistance to Excavation Face (in Dequ)
−4.00−3.00−2.00−1.50−1.00−0.50−0.250.000.250.501.001.502.003.004.005.00
T1G0.991.000.970.970.940.860.820.430.220.180.110.090.080.070.070.07
T1G rock bolt0.930.930.940.980.910.840.770.350.250.180.110.080.070.070.070.07
T1M0.990.960.970.950.920.890.840.450.300.220.140.100.090.080.080.08
T1M rock bolt0.960.950.960.940.920.880.810.410.290.210.130.100.090.080.080.08
T1P0.970.970.970.940.930.880.850.570.360.280.170.130.120.100.100.10
T1P rock bolt0.990.980.980.960.920.890.810.560.390.280.170.140.120.110.100.10
T2G0.961.000.970.970.940.860.820.330.220.180.110.090.080.070.070.07
T2G rock bolt0.990.930.940.980.910.840.770.350.250.180.110.080.070.070.070.07
T2M0.980.960.970.950.920.890.840.450.300.220.140.100.090.080.080.08
T2M rock bolt1.000.950.960.940.920.880.810.410.290.210.130.100.090.080.080.08
T2P0.980.970.970.940.930.880.850.570.360.280.170.130.120.100.100.10
T2P rock bolt0.960.980.980.960.920.890.810.560.390.280.170.140.120.110.100.10
T3G0.921.000.970.970.940.860.820.330.210.180.110.090.080.070.070.07
T3G rock bolt0.960.930.940.980.910.840.770.350.210.180.110.080.070.070.070.07
T3M0.980.960.970.950.920.890.840.450.230.220.140.100.090.080.080.08
T3M rock bolt0.990.950.960.940.920.880.810.410.230.210.130.100.090.080.080.08
T3P0.980.970.970.940.930.880.850.570.250.280.170.130.120.100.100.10
T3P rock bolt0.970.980.980.960.920.890.810.560.250.280.170.140.120.110.100.10
Table 14. Normalized tunnel analysis results (the Hoek–Brown model).
Tunnel SymbolDistance to Excavation Face (in Dequ)
−4.00−3.00−2.00−1.50−1.00−0.50−0.250.000.250.501.001.502.003.004.005.00
T1G0.990.980.970.960.920.840.800.340.240.180.110.090.080.070.070.07
T1G rock bolt0.990.930.970.970.940.840.730.310.230.170.110.090.080.070.070.07
T1M0.980.940.940.920.900.860.770.370.270.210.130.090.080.080.080.08
T1M rock bolt0.950.920.920.910.870.830.740.330.250.190.120.100.090.080.080.08
T1P0.980.950.950.960.900.840.780.530.330.260.170.140.120.100.100.10
T1P rock bolt0.990.970.950.940.870.850.800.500.360.270.170.140.120.110.100.10
T2G0.990.980.970.960.920.840.800.340.240.180.110.090.080.070.070.07
T2G rock bolt0.990.930.970.970.940.840.730.310.230.170.110.090.080.070.070.07
T2M0.990.940.940.920.900.860.770.350.270.210.130.090.080.080.080.08
T2M rock bolt0.980.920.920.910.870.830.740.370.250.190.120.100.090.080.080.08
T2P0.990.950.950.960.900.840.780.530.330.260.170.140.120.100.100.10
T2P rock bolt0.950.970.950.940.870.850.800.500.360.270.170.140.120.110.100.10
T3G0.990.980.970.960.920.840.800.320.200.180.110.090.080.070.070.07
T3G rock bolt0.980.930.970.970.940.840.730.310.200.170.110.090.080.070.070.07
T3M1.000.940.940.920.900.860.770.330.220.210.130.090.080.080.080.08
T3M rock bolt0.990.920.920.910.870.830.740.340.220.190.120.100.090.080.080.08
T3P0.950.950.950.960.900.840.780.530.220.260.170.140.120.100.100.10
T3P rock bolt0.950.970.950.940.870.850.800.500.230.270.170.140.120.110.100.10
Publisher’s Note: MDPI stays neutral with regard to jurisdictional claims in published maps and institutional affiliations.

