
Automatic Assessment of Abdominal Exercises for the Treatment of Diastasis Recti Abdominis Using Electromyography and Machine Learning


 ,
, 
Abstract
:1. Introduction
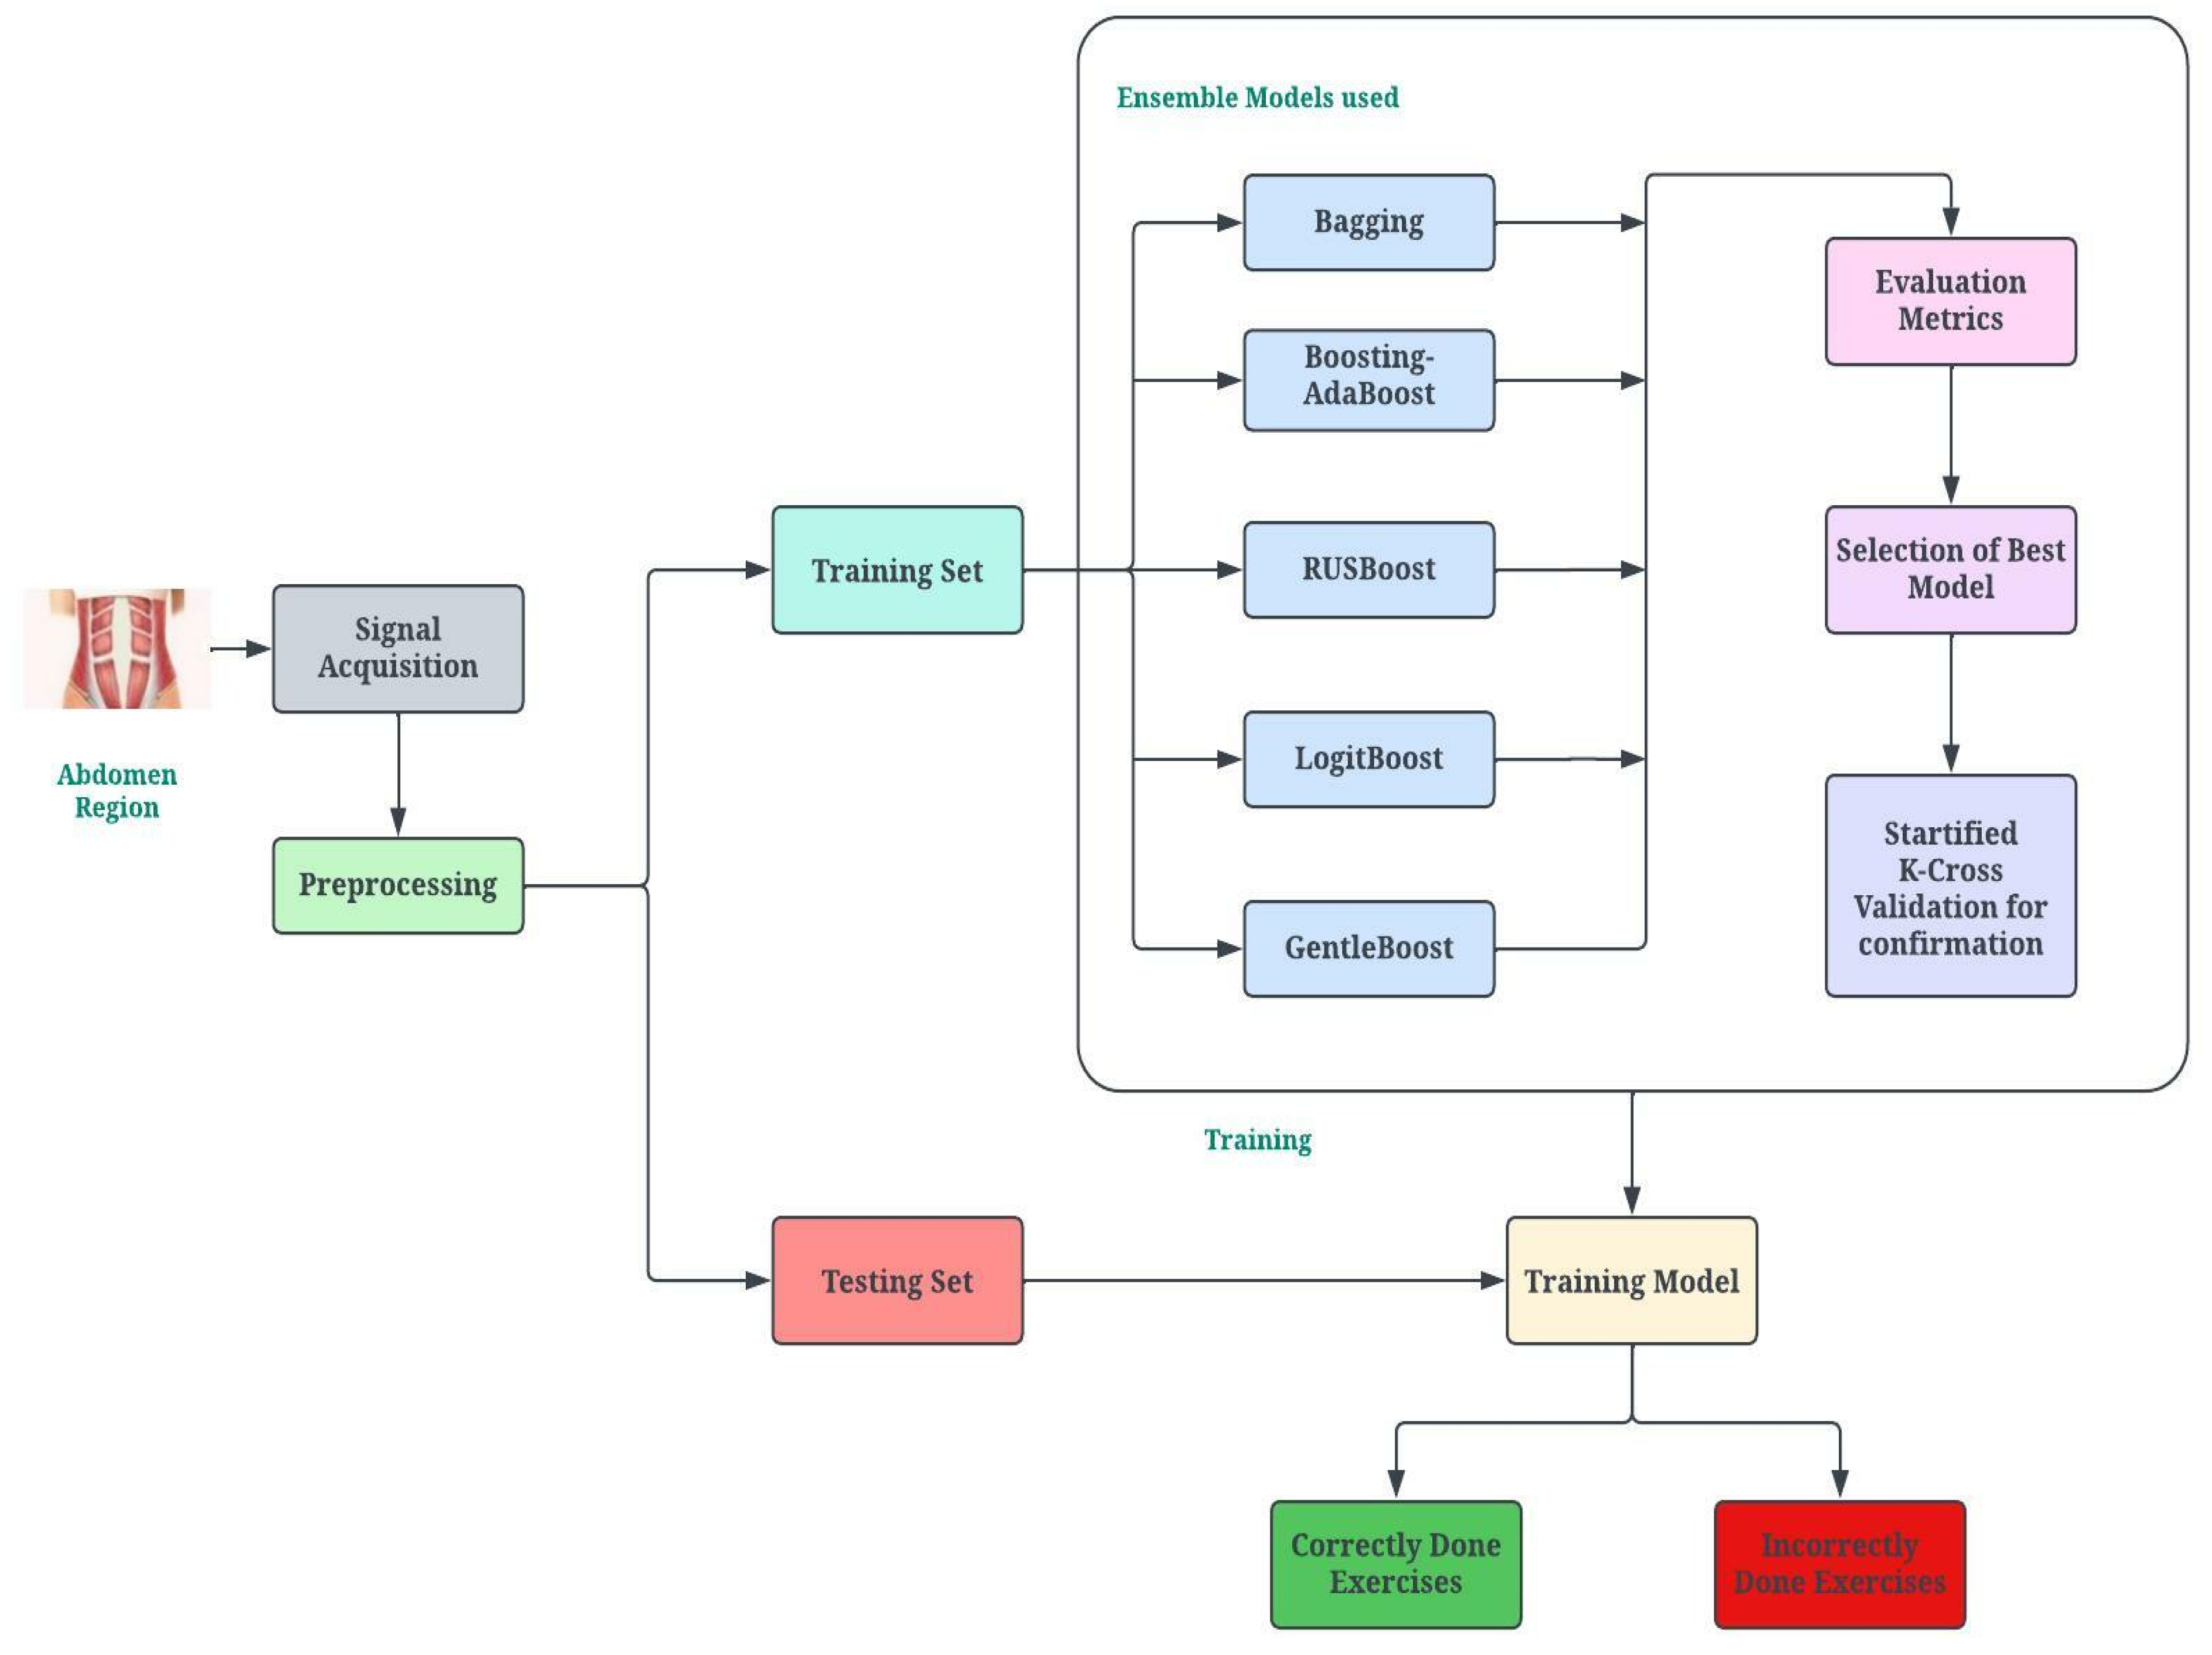
2. Proposed Methodology
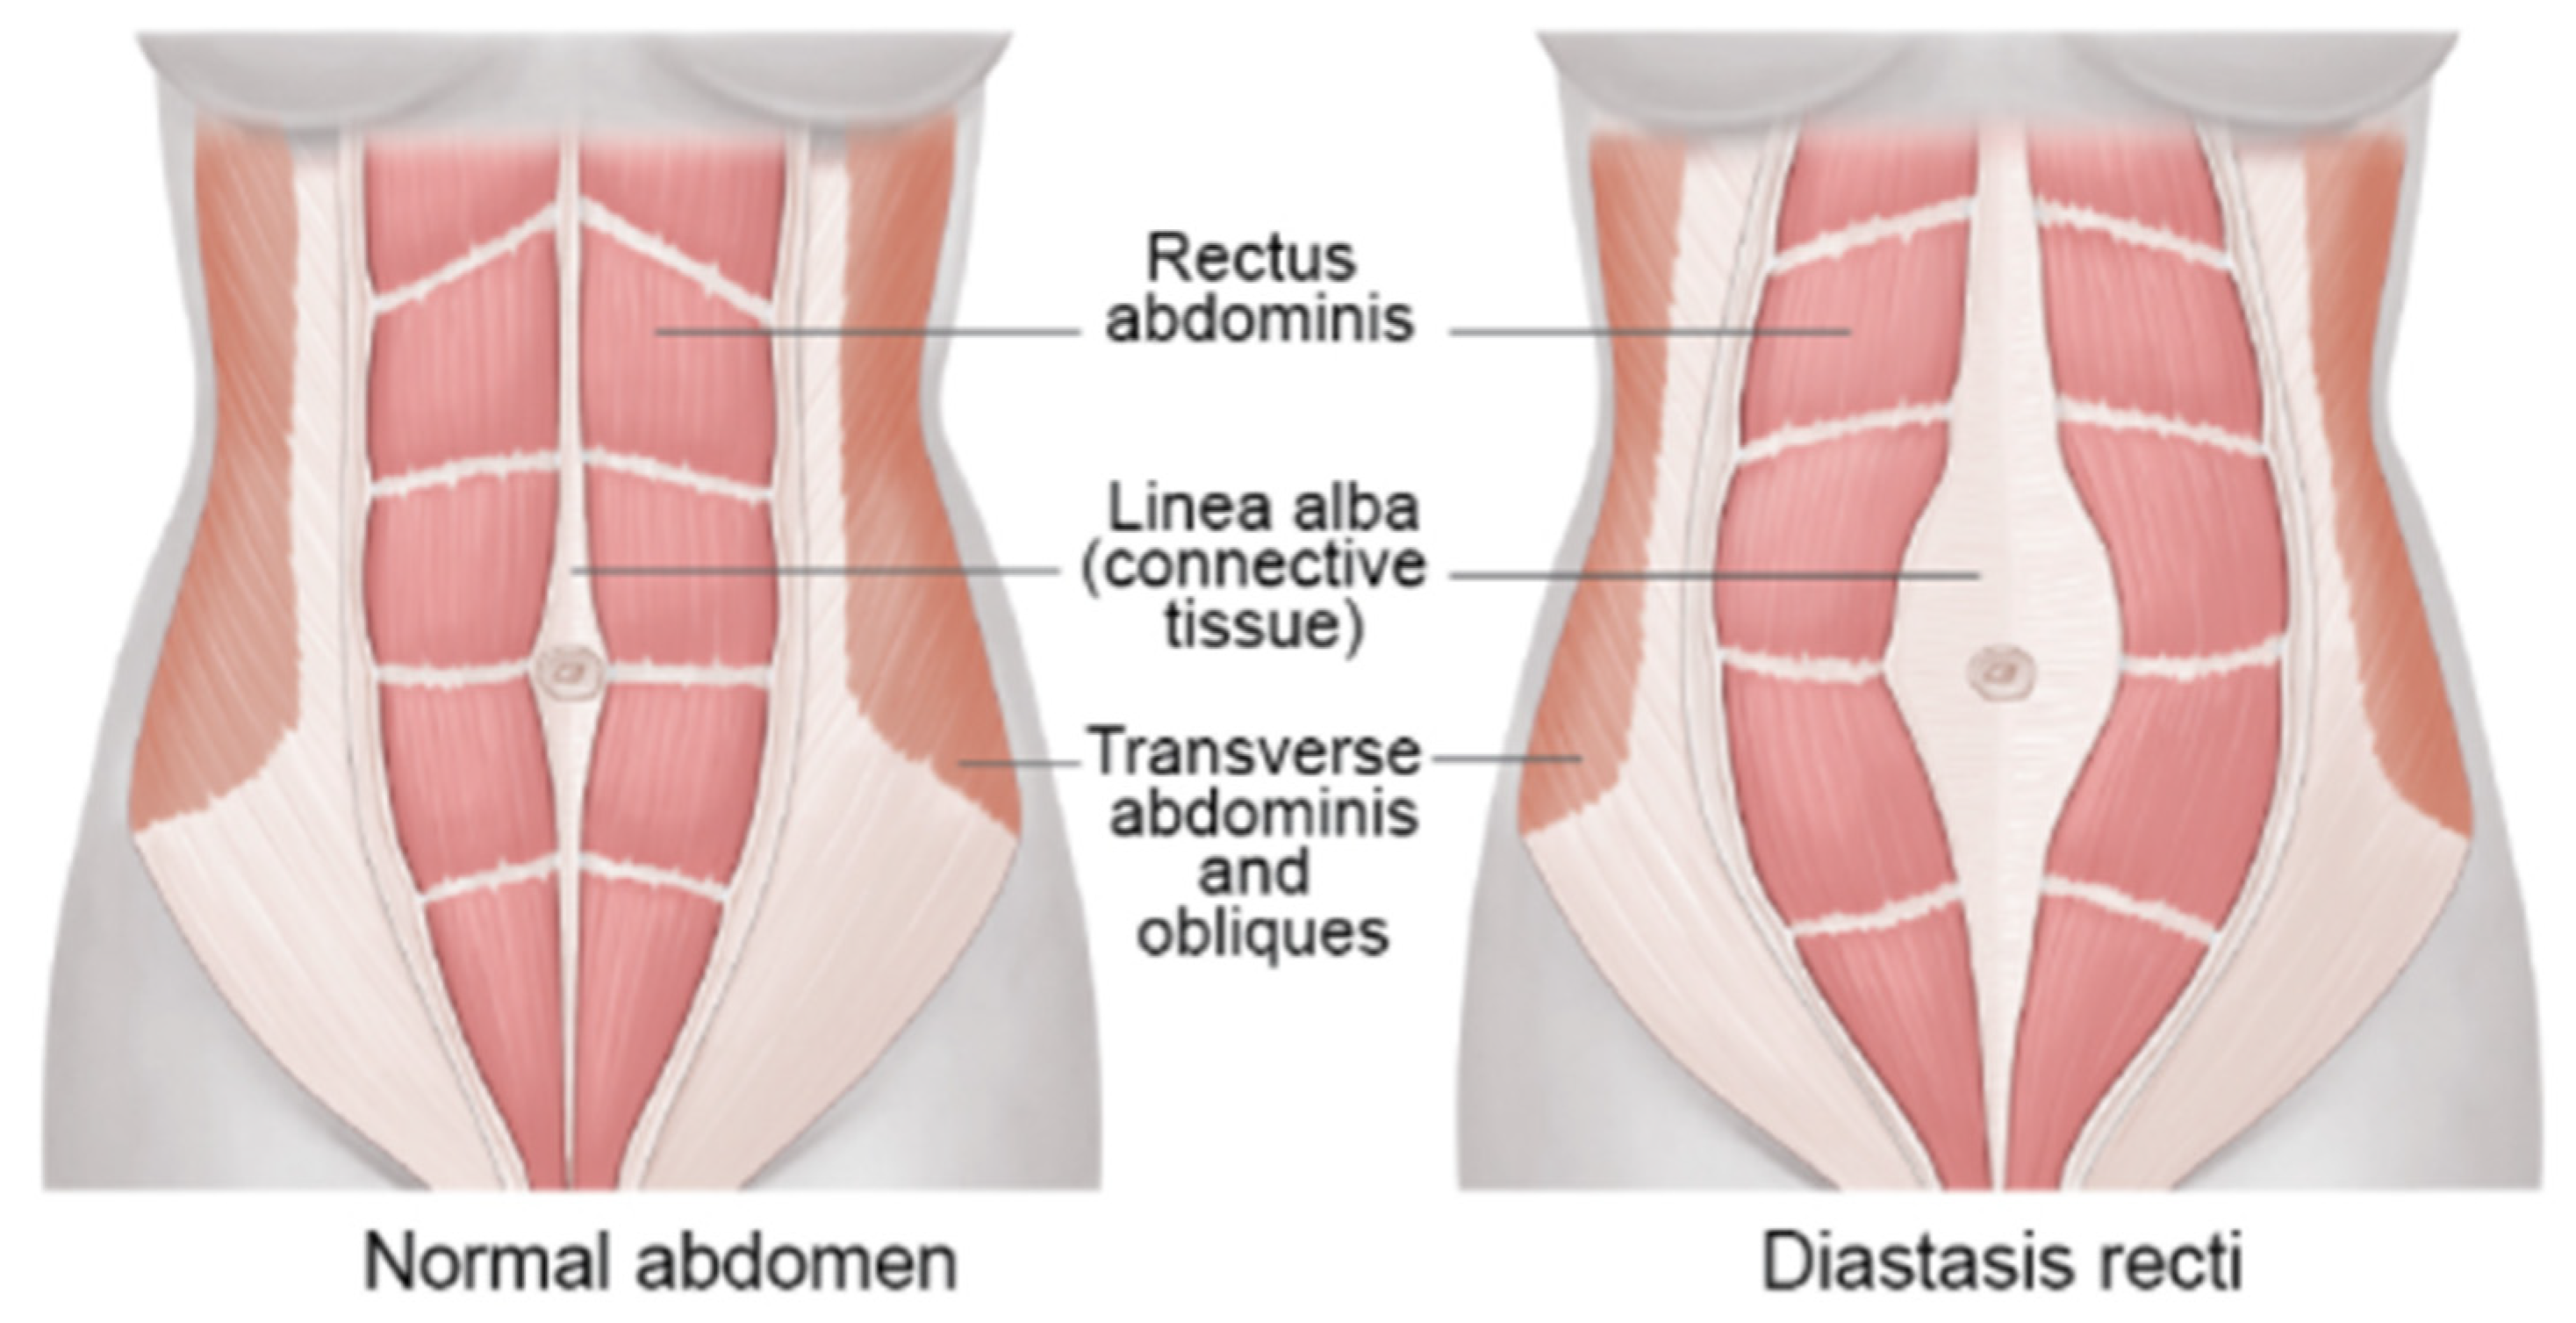
2.1. Muscle Anatomy of DRA
2.2. Role of Therapeutic Exercises
- SIT-UPS (SU)
- 2.
- CURL-UPS (CU)
- 3.
- TRANSVERSE ABDOMINIS WITH SIT-UPS (TASU)
- 4.
- TRANSVERSE ABDOMINIS WITH CURL-UPS (TACU)
- 5.
- TRANSVERSE ABDOMINIS, PELVIC FLOOR MUSCLES AND CURL-UP (TAPF-CU)
- 6.
- STRAIGHT LEG-RAISE (SLR)
- 7.
- REVERSE CURL-UP (RCU)
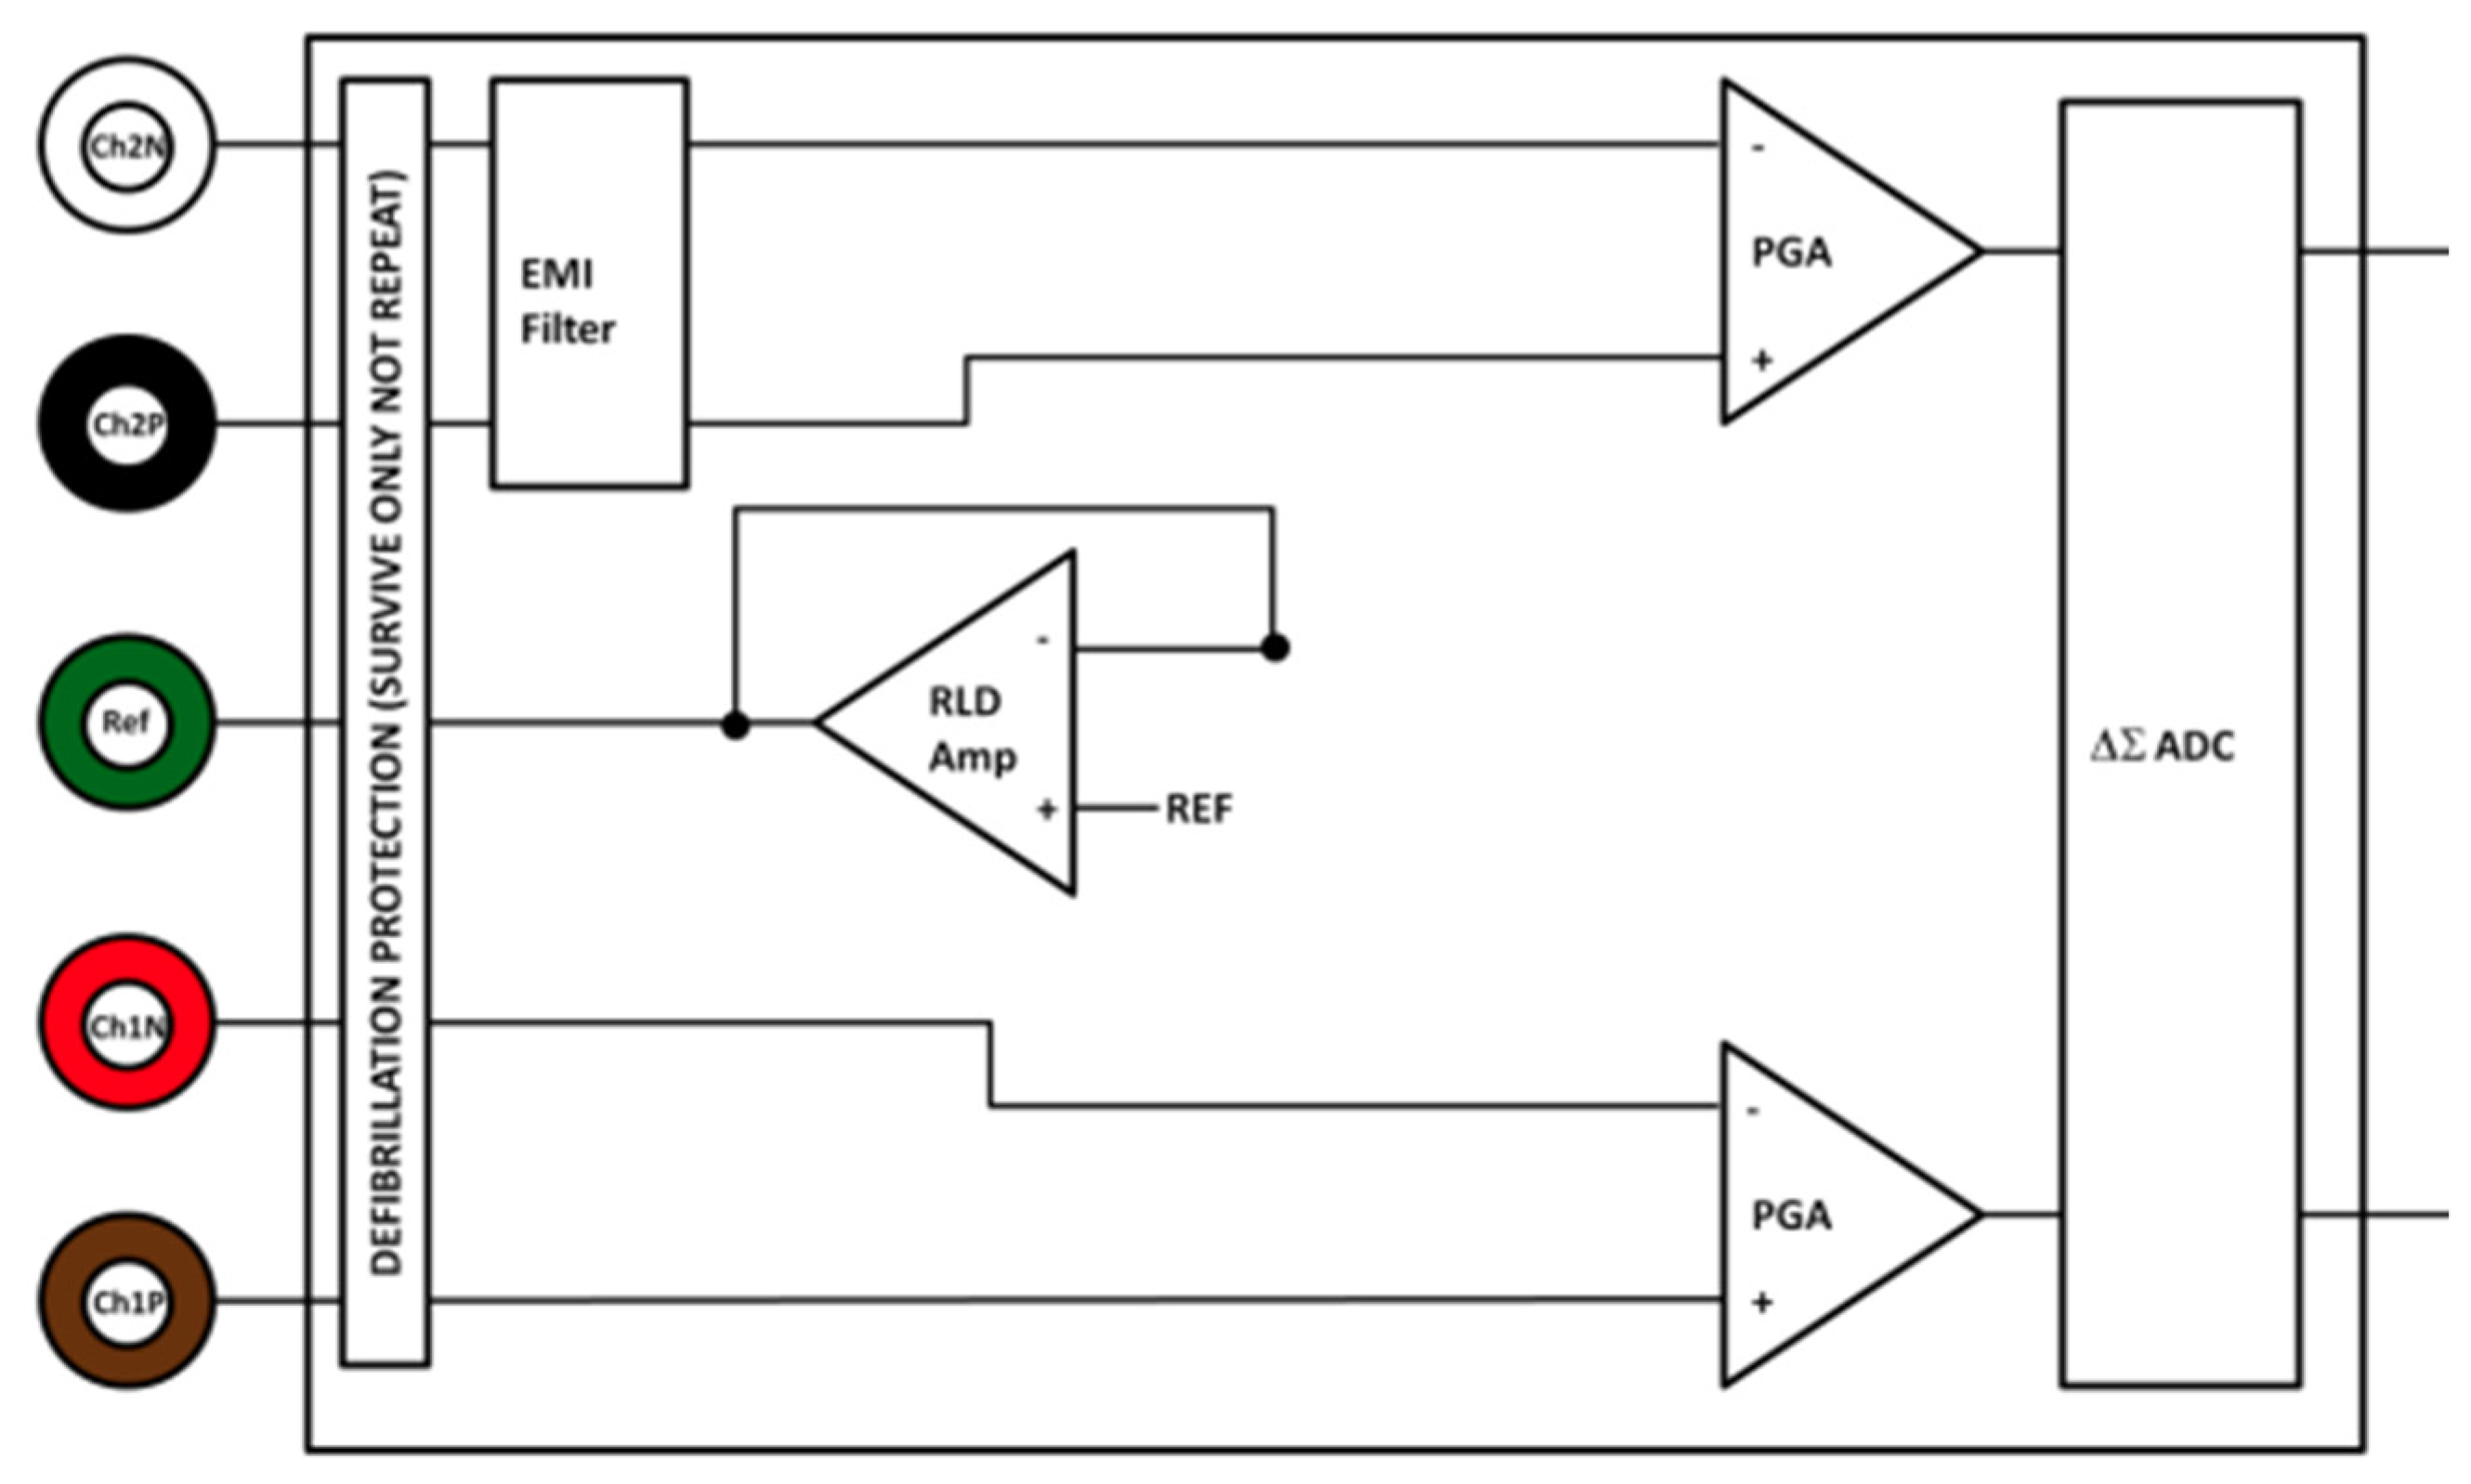
2.3. Data Acquisition and Experimental Setup
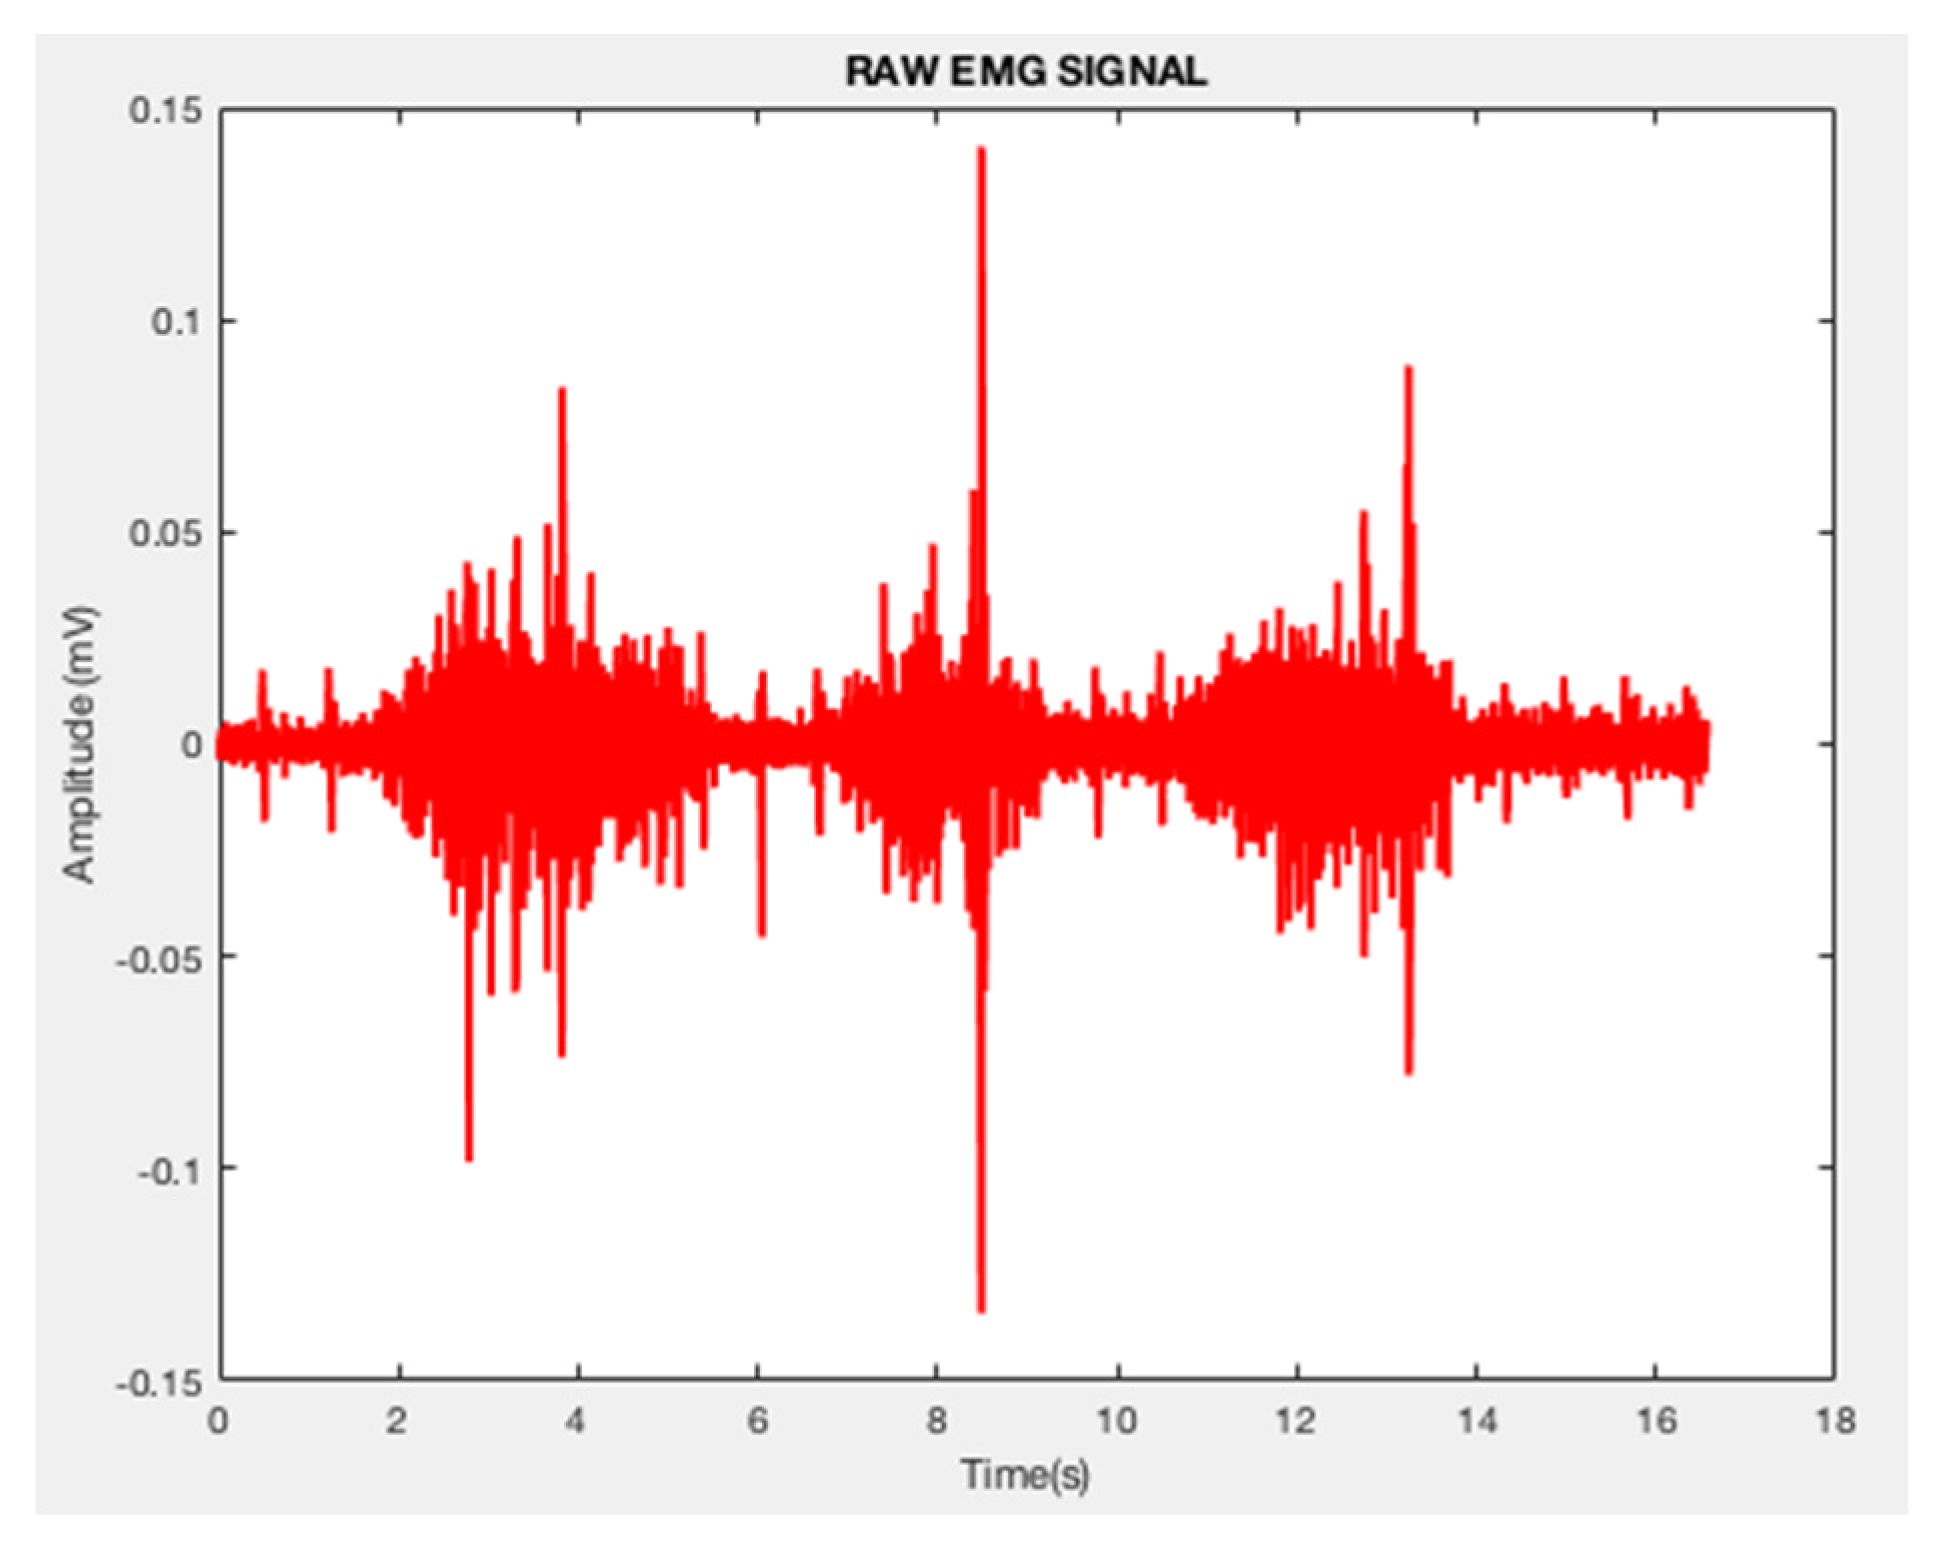
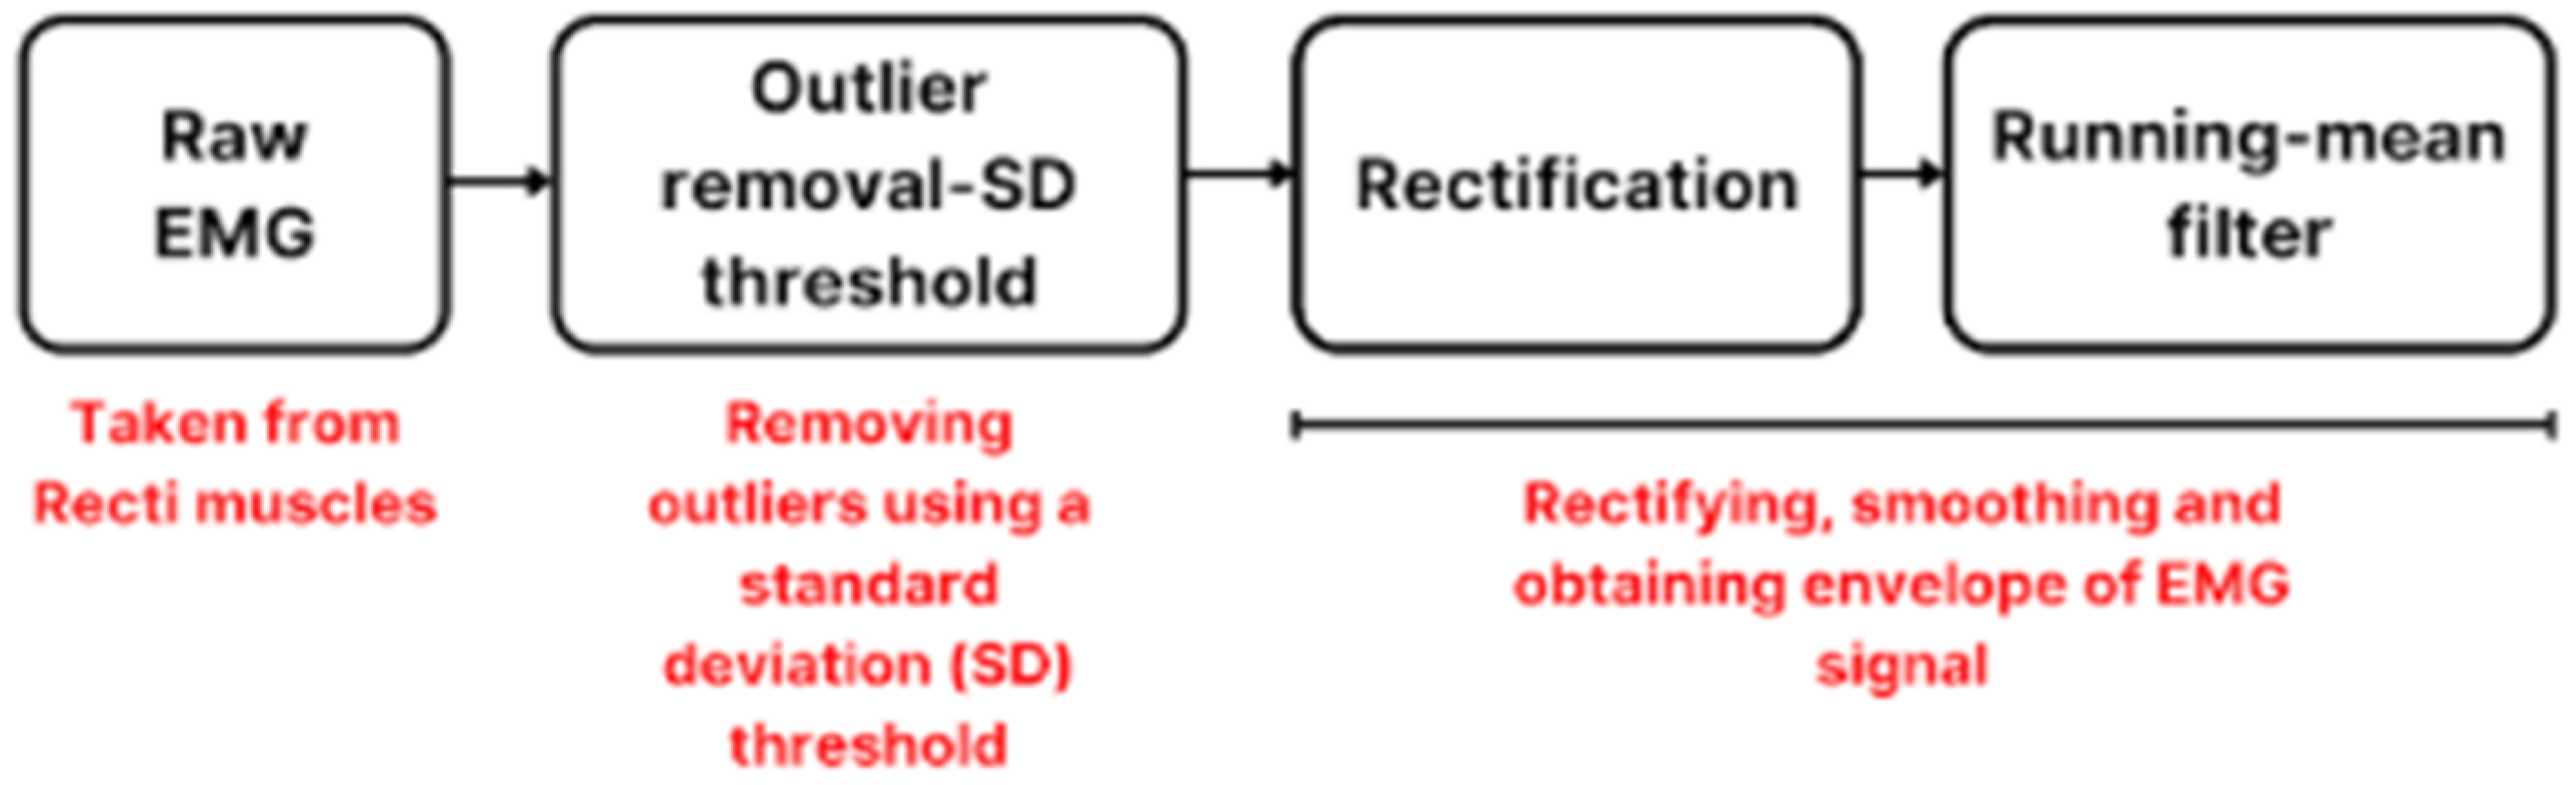
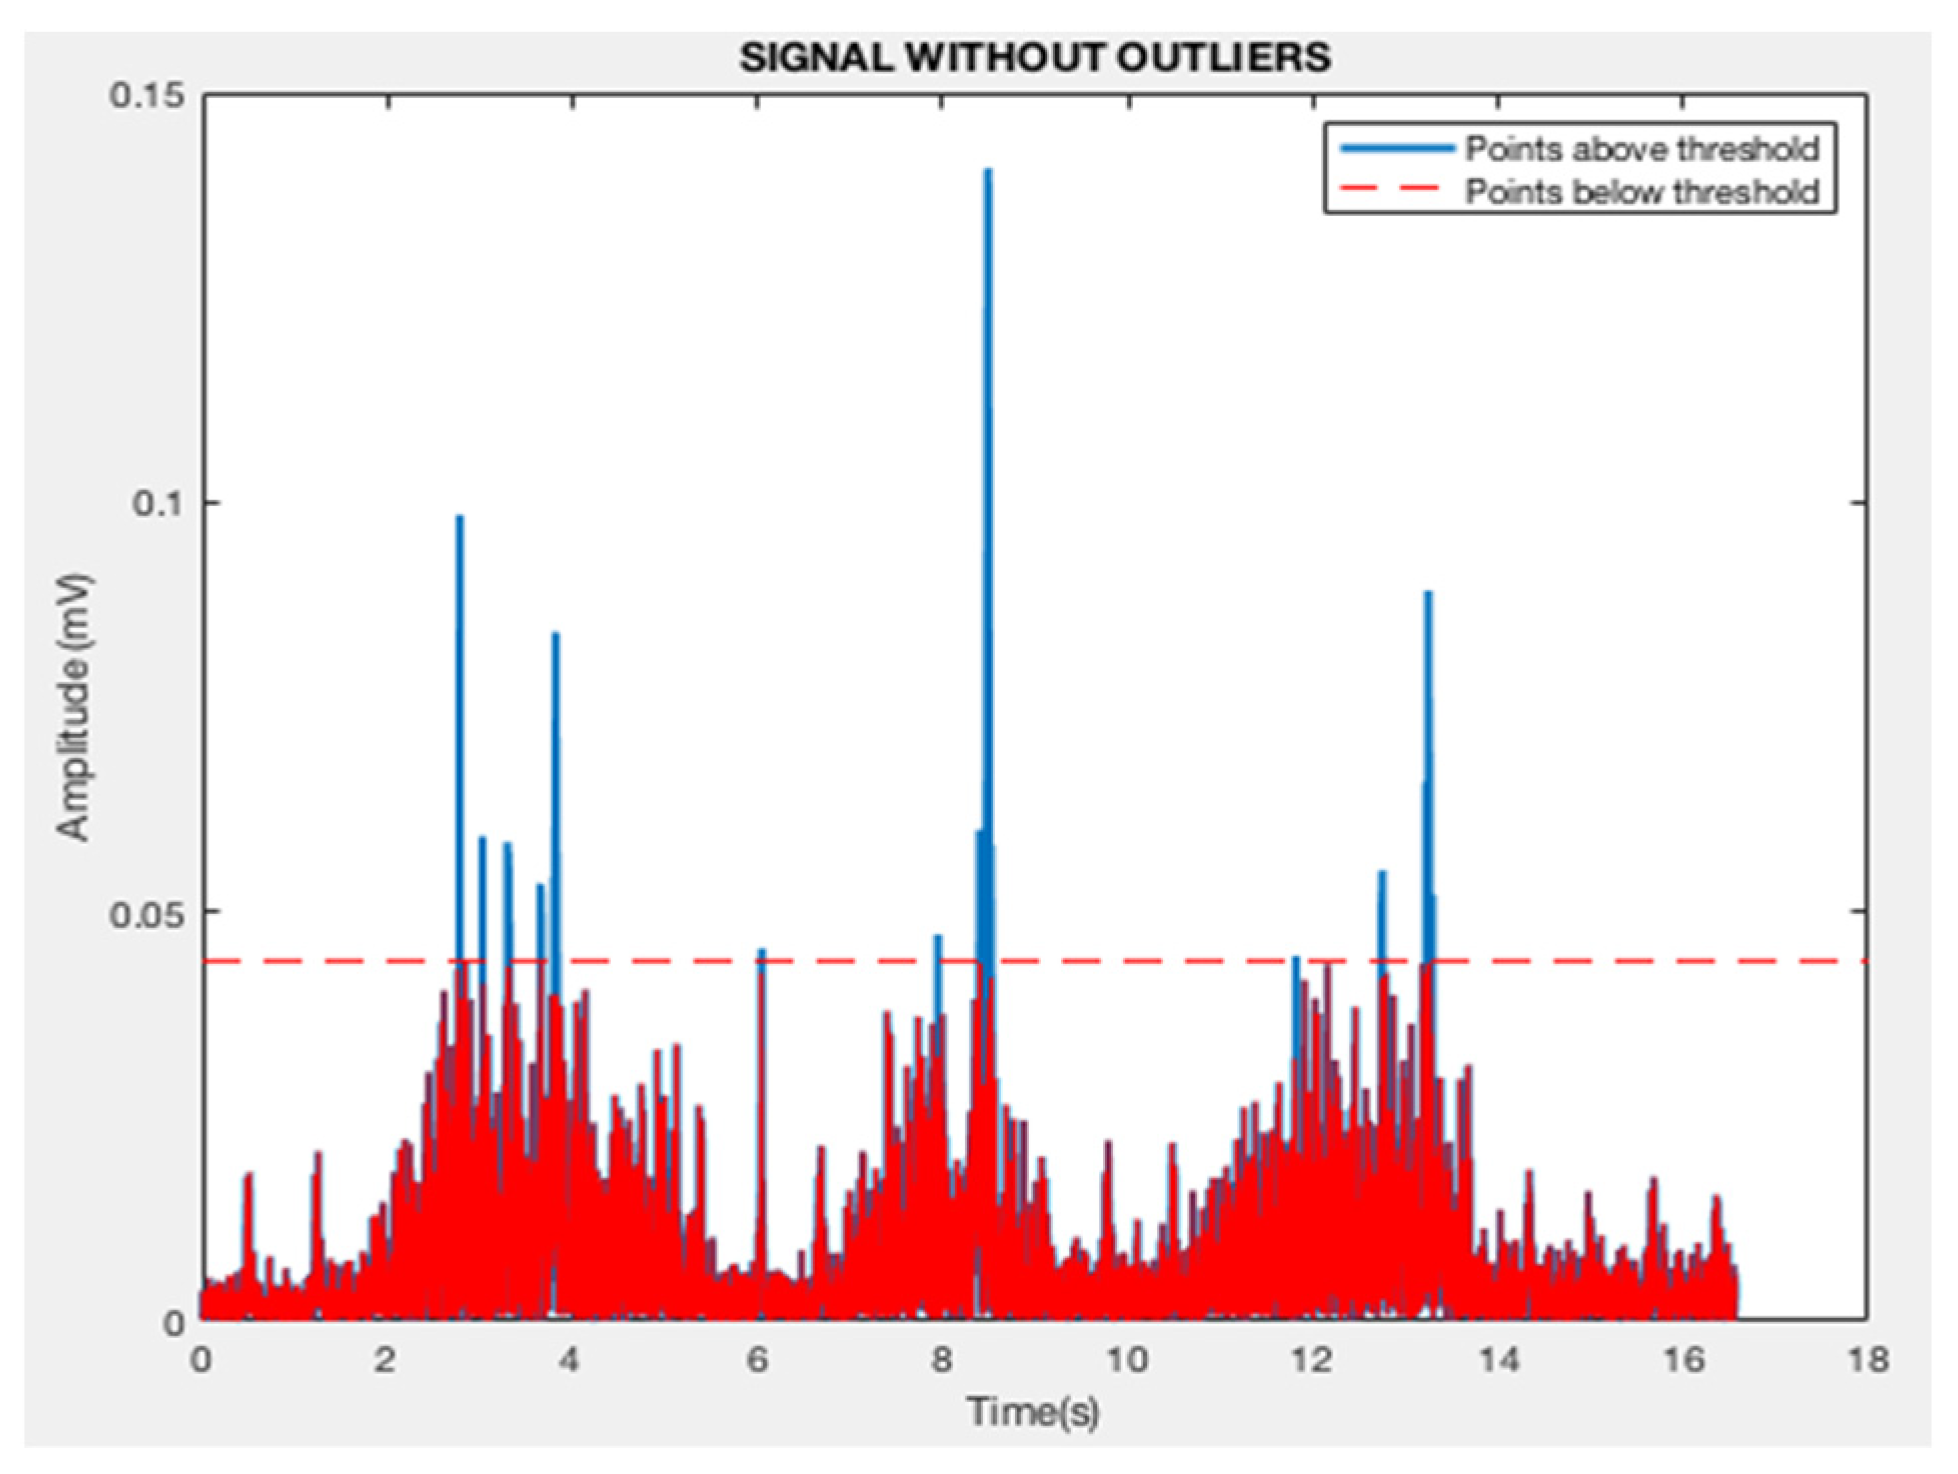
2.4. Preprocessing of EMG Signals
2.5. Feature Extraction
- 1.
- Energy
- 2.
- Kurtosis
- 3.
- Power
- 4.
- Mean frequency
- 5.
- Median frequency
- 6.
- Discrete Wavelet Transform
- 7.
- Entropy
- 8.
- Detrended Fluctuation Analysis (DFA)
- 9.
- Largest Lyapunov’s Exponent
2.6. Feature Selection
2.7. Classification
3. Results and Discussion
3.1. Graphical Analysis of Features
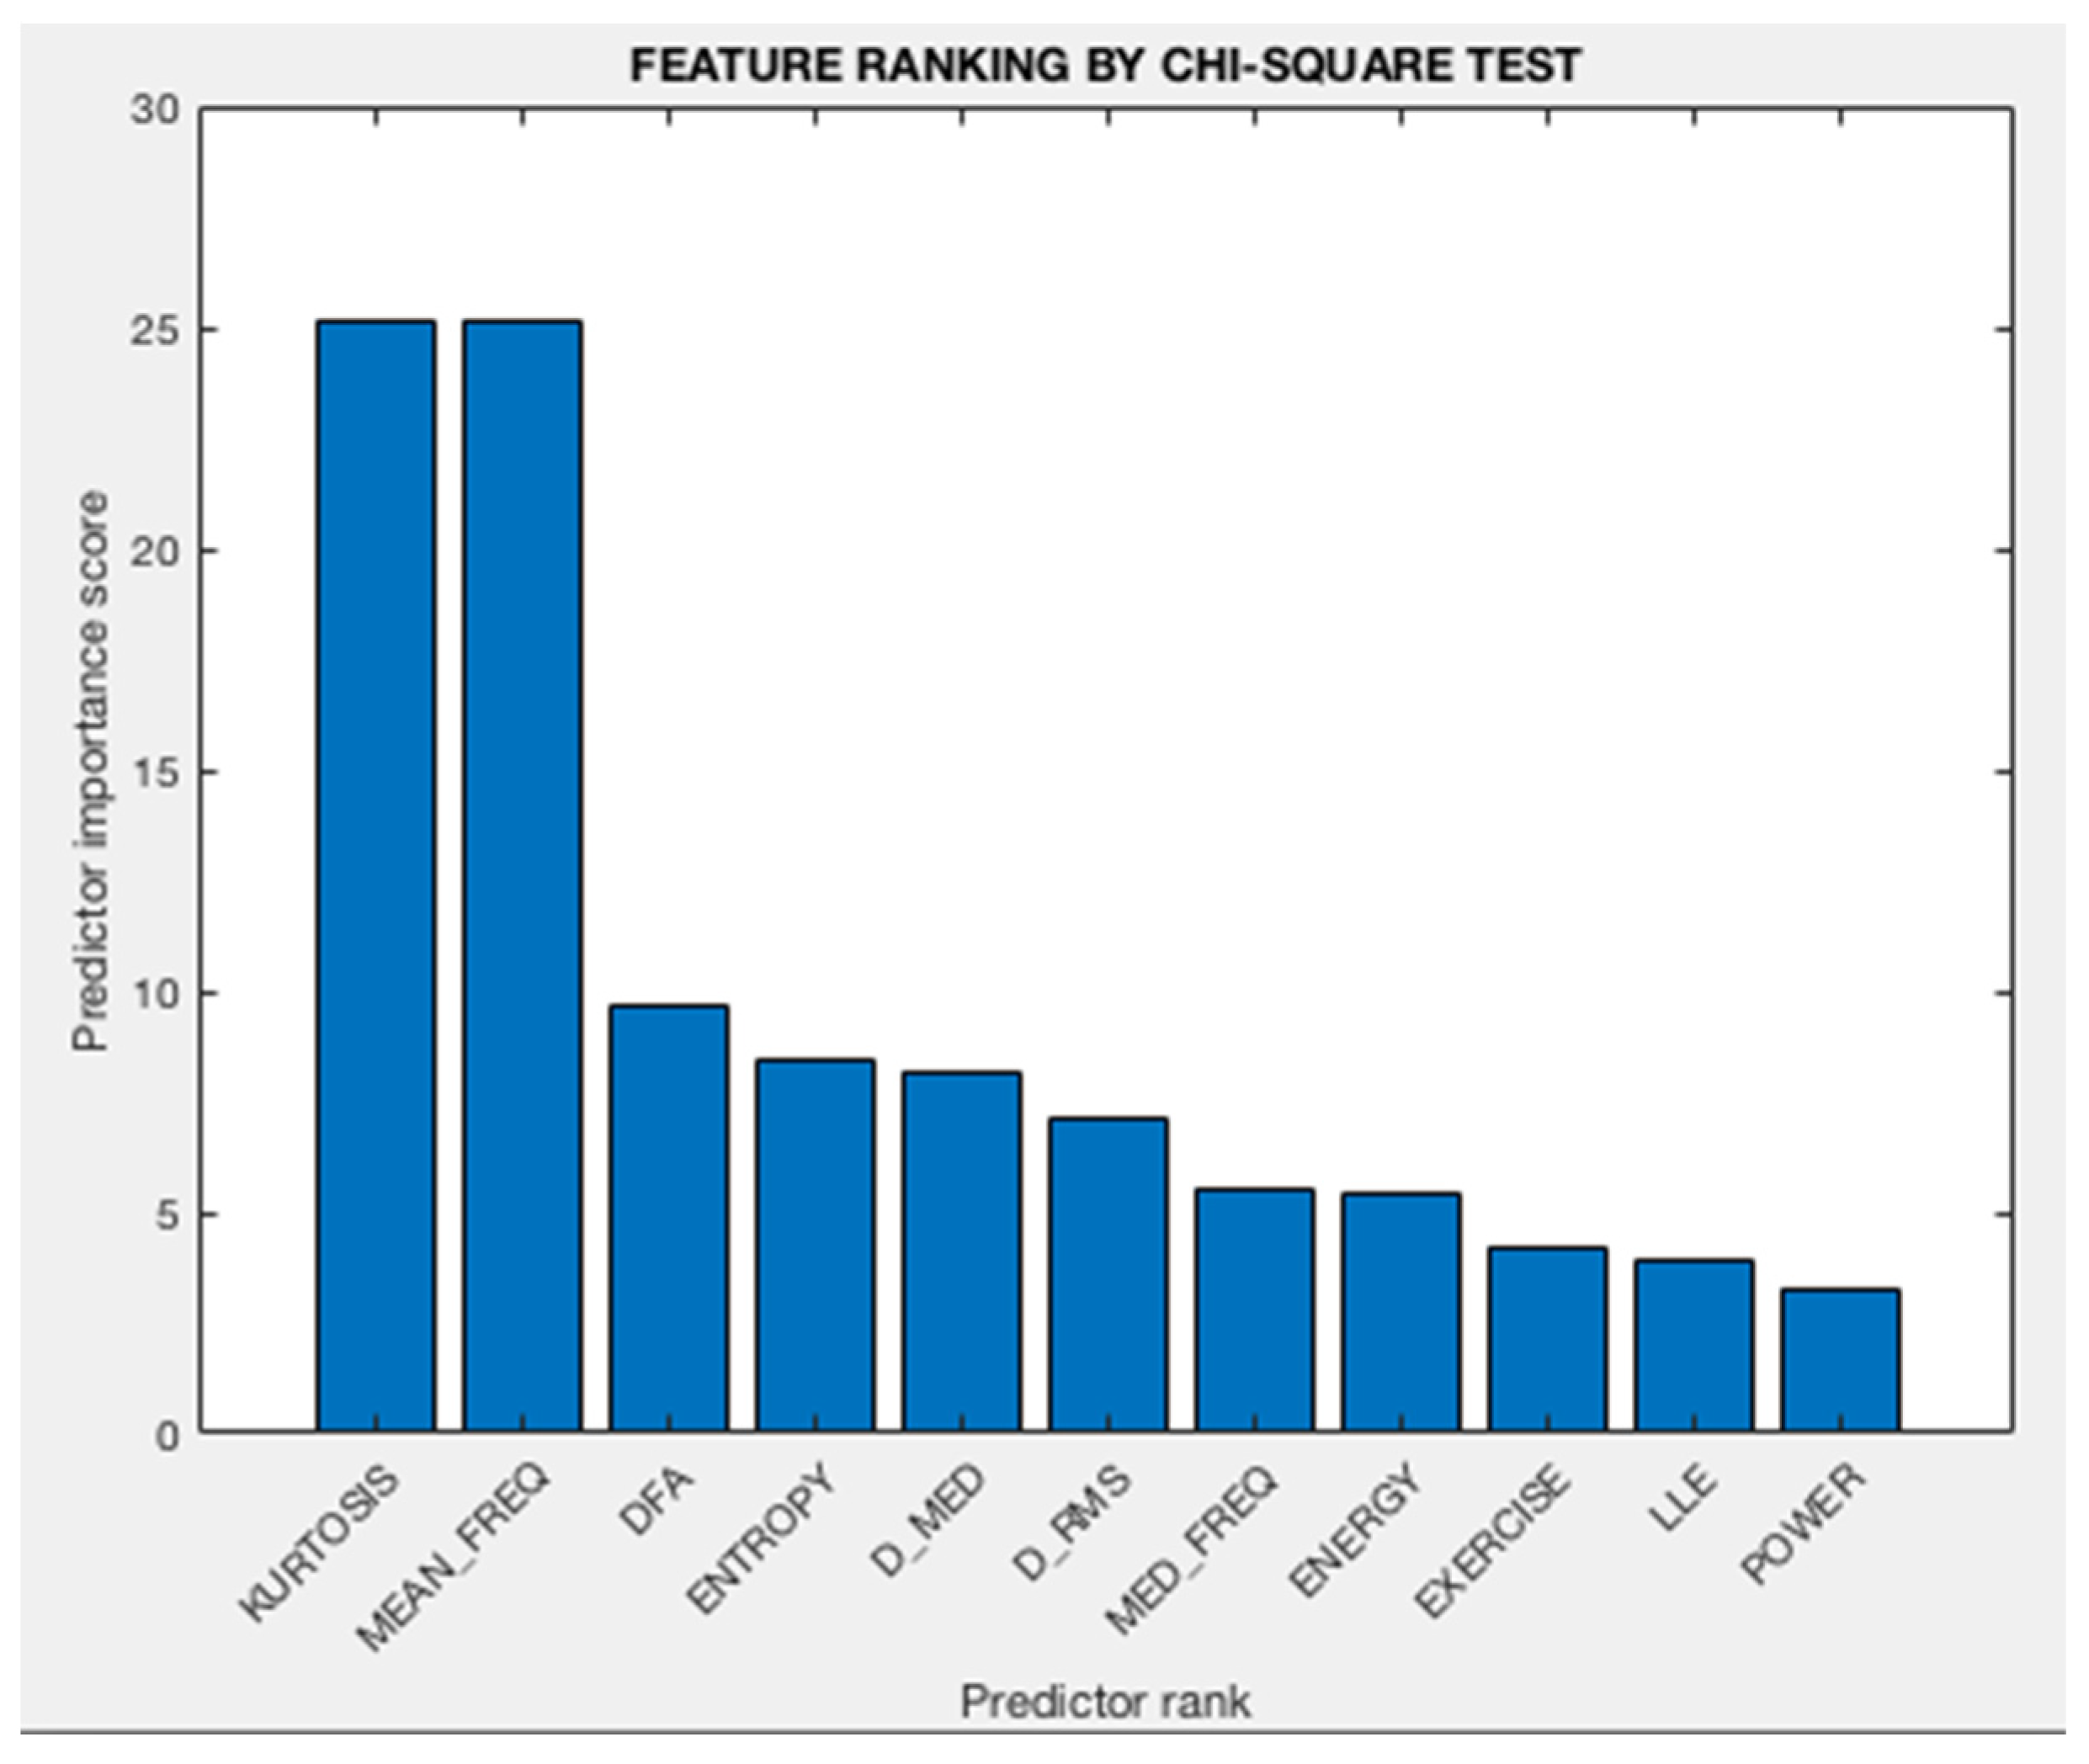
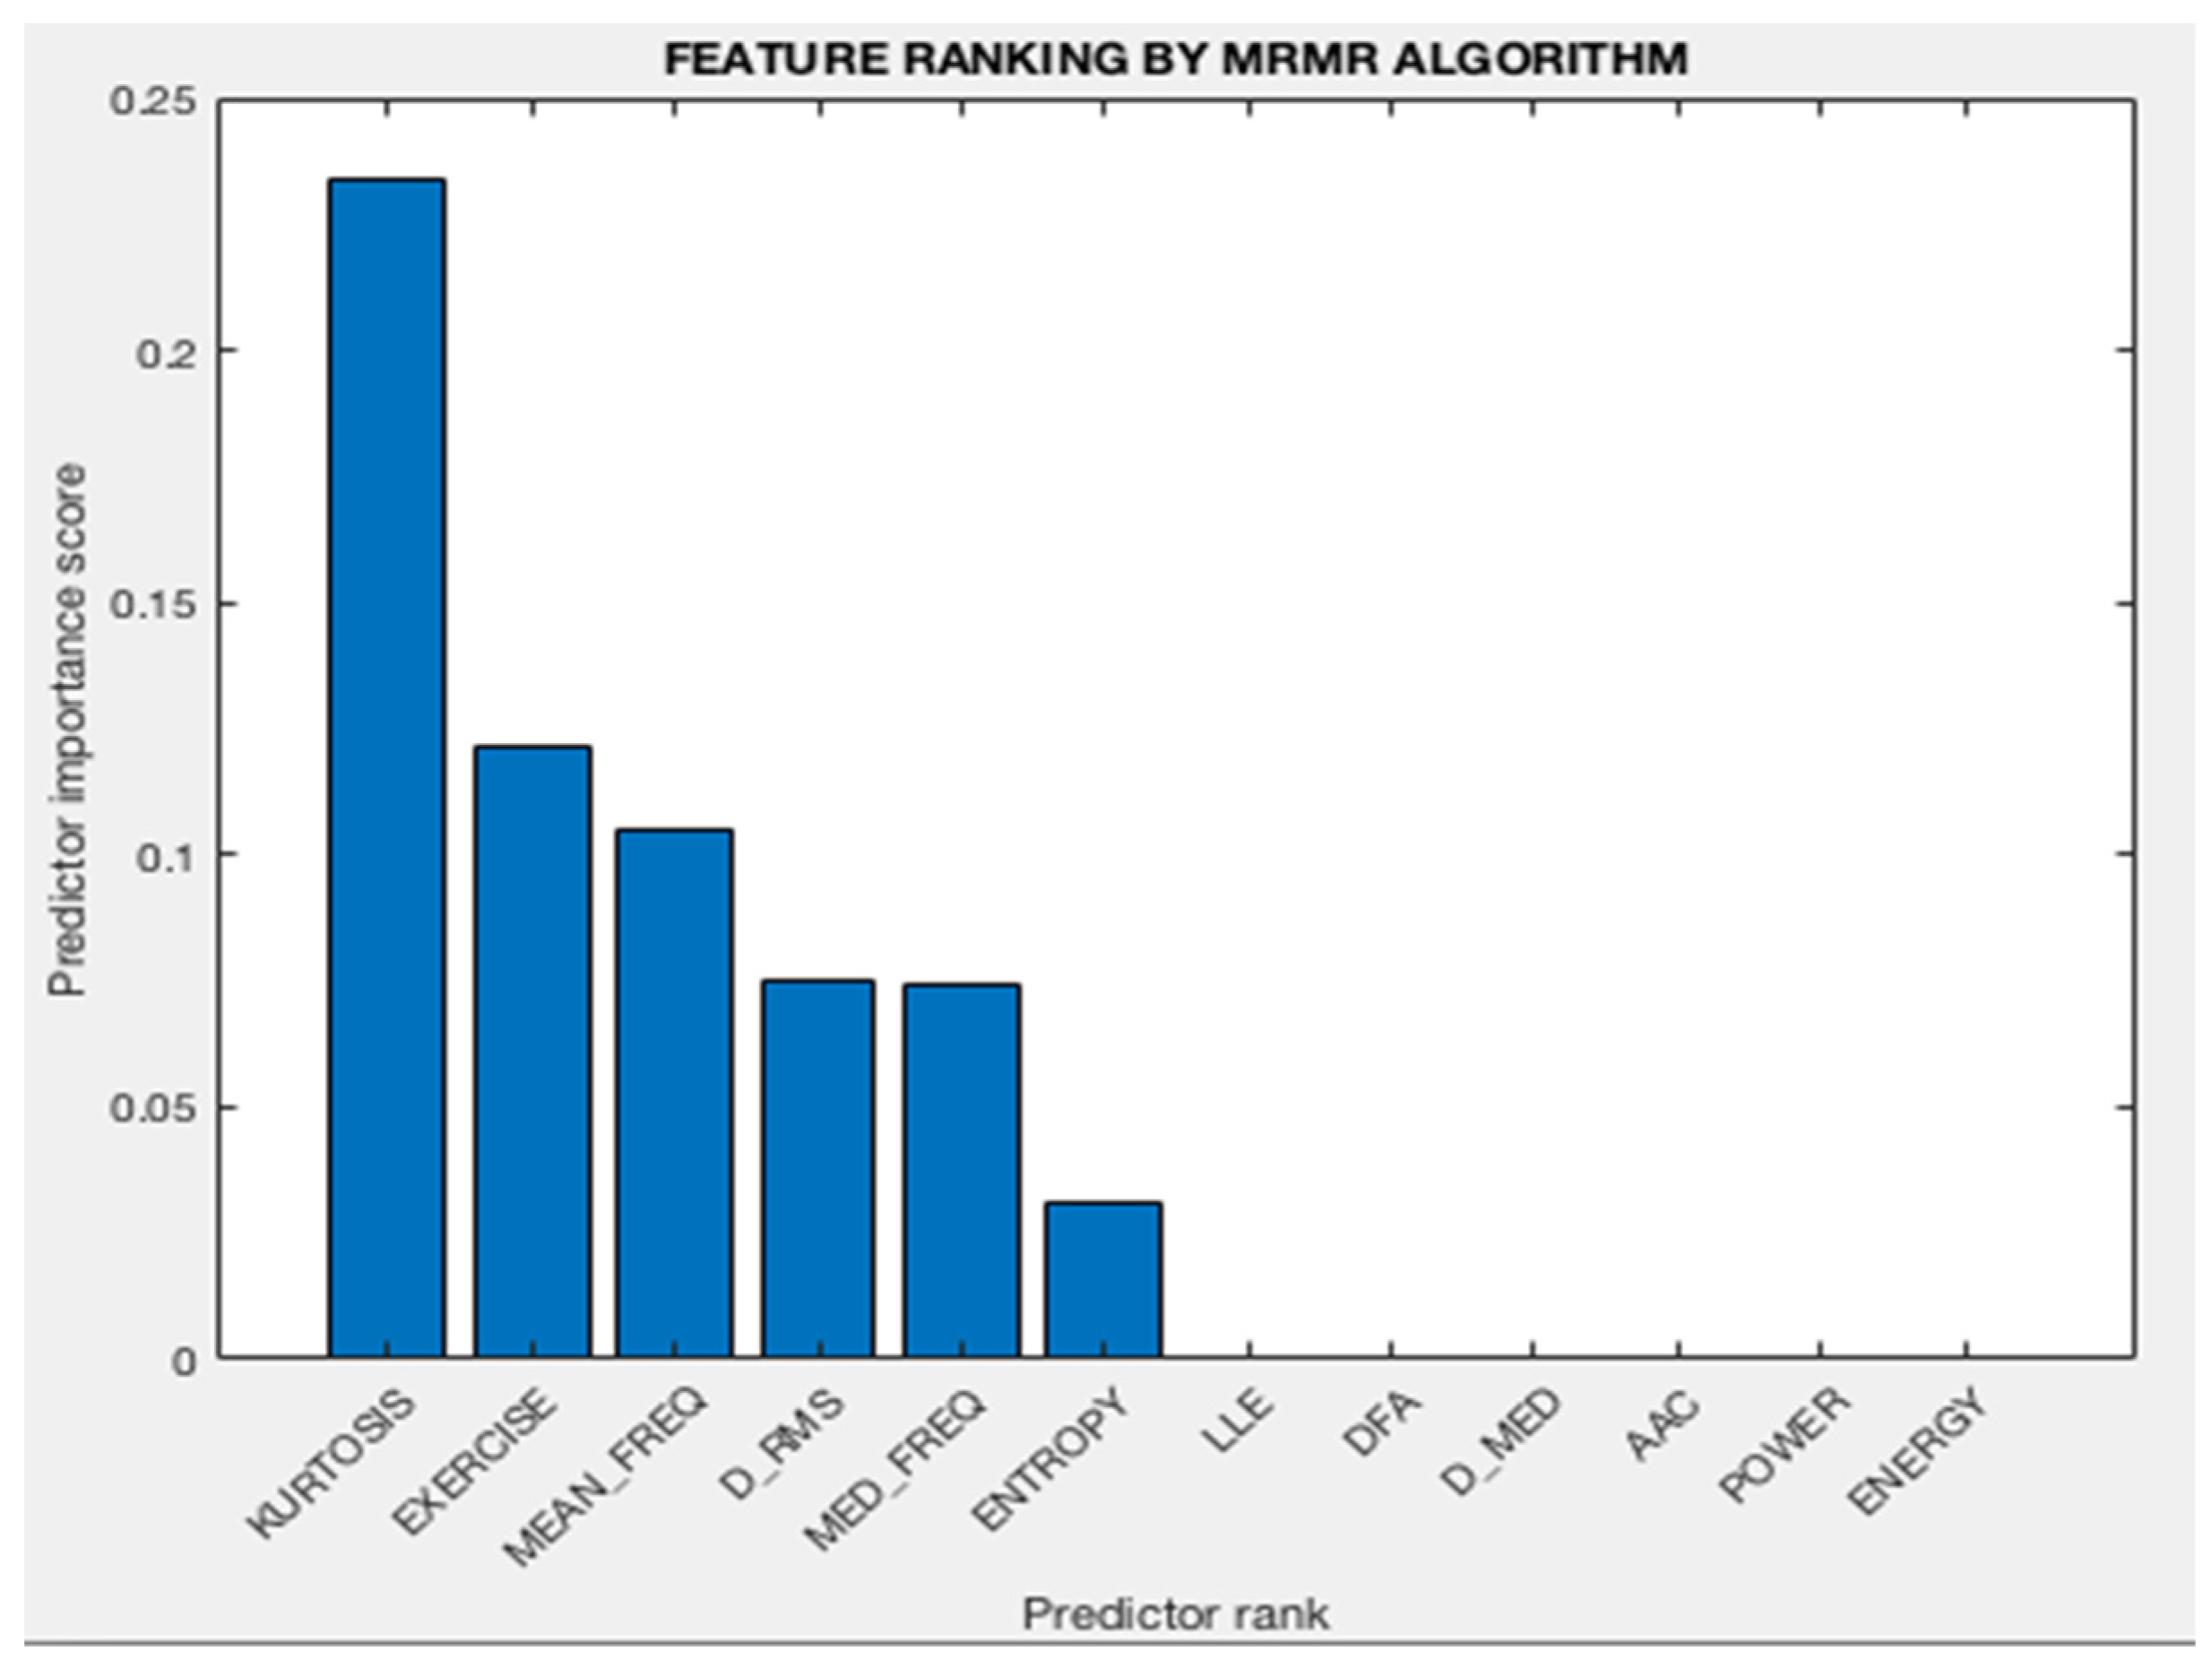
3.2. Analysis of Feature Selection
- Kurtosis
- Mean frequency
- DFA (Hurst exponent)
- Entropy
- D_med
- Median Frequency
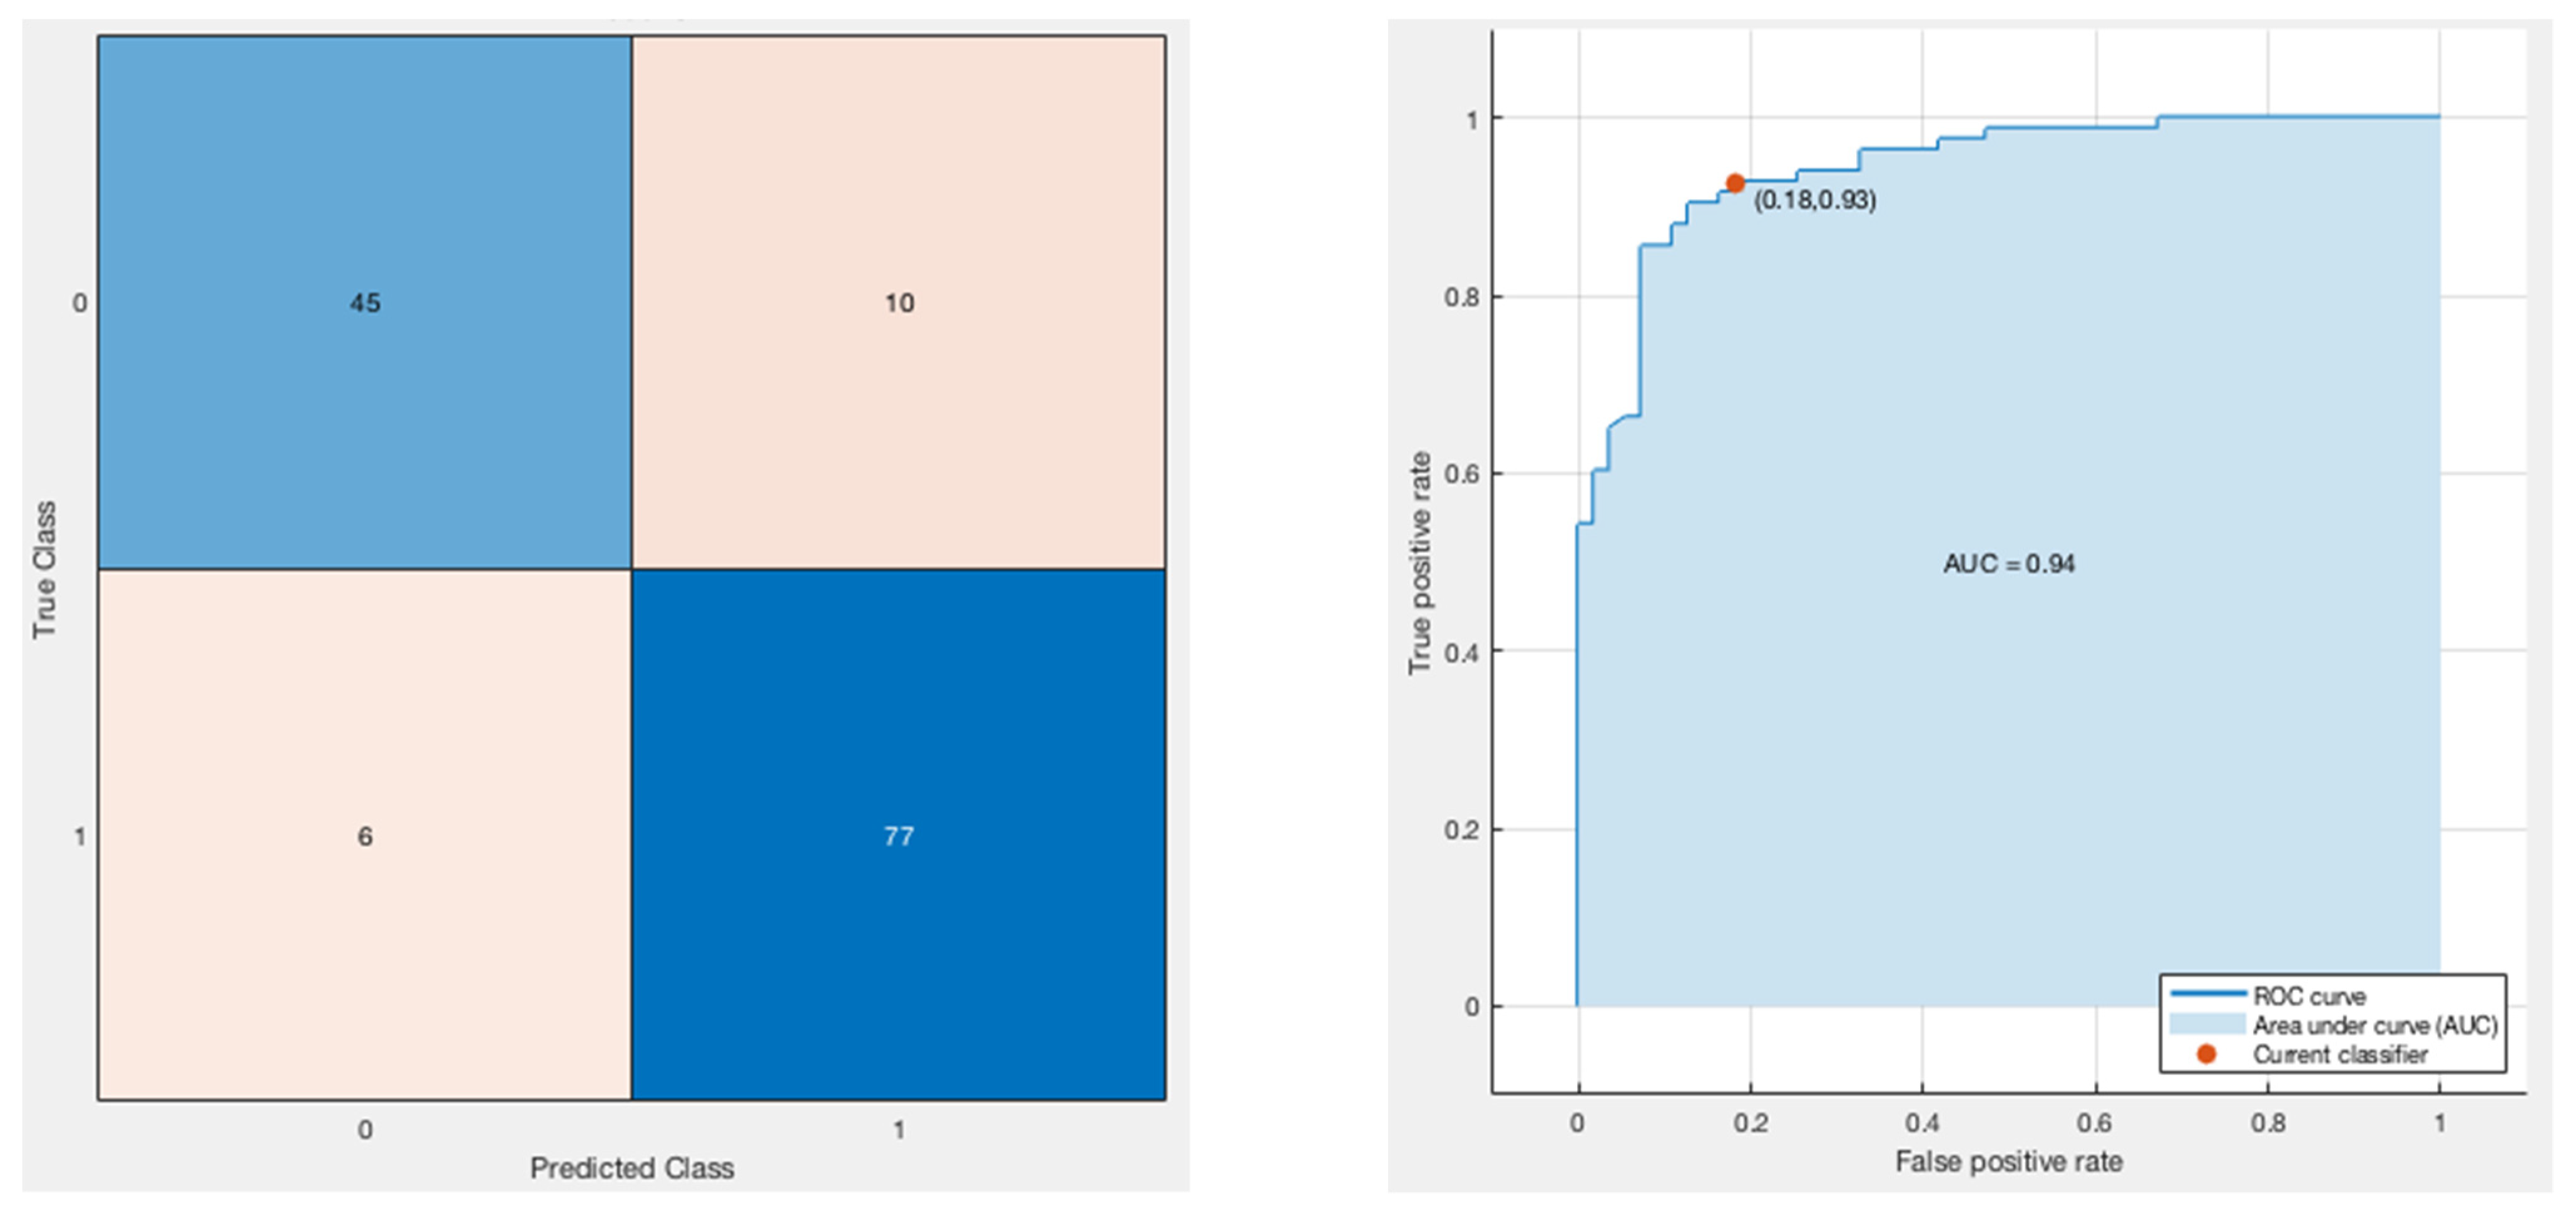
3.3. Classification Model
3.4. Discussion
4. Conclusions
Author Contributions
Funding
Institutional Review Board Statement
Informed Consent Statement
Data Availability Statement
Conflicts of Interest
References
- Eriksson Crommert, M.; Petrov Fieril, K.; Gustavsson, C. Women’s experiences of living with increased inter-recti distance after childbirth: An interview study. BMC Women’s Health 2020, 20, 260. [Google Scholar] [CrossRef] [PubMed]
- Gluppe, S.; Engh, M.E.; Bø, K. What is the evidence for abdominal and pelvic floor muscle training to treat diastasis recti abdominis postpartum? A systematic review with meta-analysis. Braz. J. Phys. Ther. 2021, 25, 664–675. [Google Scholar] [CrossRef] [PubMed]
- Romero Avila, E.; Junker, E.; Disselhorst-Klug, C. Introduction of a sEMG Sensor System for Autonomous Use by Inexperienced Users. Sensors 2020, 20, 7348. [Google Scholar] [CrossRef]
- Piucco, T.; Diefenthaeler, F.; Prosser, A.; Bini, R. Validity of different EMG analysis methods to identify aerobic and anaerobic thresholds in speed skaters. J. Electromyogr. Kinesiol. 2020, 52, 102425. [Google Scholar] [CrossRef] [PubMed]
- Taborri, J.; Keogh, J.; Kos, A.; Santuz, A.; Umek, A.; Urbanczyk, C.; van der Kruk, E.; Rossi, S. Sport Biomechanics Applications Using Inertial, Force, and EMG Sensors: A Literature Overview. Appl. Bionics Biomech. 2020, 23, 2041549. [Google Scholar] [CrossRef]
- Zhao, S.; Liu, J.; Gong, Z.; Lei, Y.; OuYang, X.; Chan, C.C.; Ruan, S. Wearable Physiological Monitoring System Based on Electrocardiography and Electromyography for Upper Limb Rehabilitation Training. Sensors 2020, 20, 4861. [Google Scholar] [CrossRef]
- Jeong, J.W.; Lee, W.; Kim, Y.J. A Real-Time Wearable Physiological Monitoring System for Home-Based Healthcare Applications. Sensors 2021, 22, 104. [Google Scholar] [CrossRef]
- Cappellini, G.; Sylos-Labini, F.; Assenza, C.; Libernini, L.; Morelli, D.; Lacquaniti, F.; Ivanenko, Y. Clinical Relevance of State-of-the-Art Analysis of Surface Electromyography in Cerebral Palsy. Front. Neurol. 2020, 11, 583296. [Google Scholar] [CrossRef]
- Rodriguez-Falces, J.; Place, N. Muscle fiber conduction velocity varies in opposite directions after short- vs. long-duration muscle contractions. Eur. J. Appl. Physiol. 2021, 121, 1315–1325. [Google Scholar] [CrossRef]
- Beretta-Piccoli, M.; Cescon, C.; Barbero, M.; D’Antona, G. Reliability of surface electromyography in estimating muscle fiber conduction velocity: A systematic review. J. Electromyogr. Kinesiol. 2019, 48, 53–68. [Google Scholar] [CrossRef]
- Brambilla, C.; Pirovano, I.; Mira, R.M.; Rizzo, G.; Scano, A.; Mastropietro, A. Combined Use of EMG and EEG Techniques for Neuromotor Assessment in Rehabilitative Applications: A Systematic Review. Sensors 2021, 21, 7014. [Google Scholar] [CrossRef] [PubMed]
- Lee, S.S.M.; Lam, T.; Pauhl, K.; Wakeling, J.M. Quantifying muscle coactivation in individuals with incomplete spinal cord injury using wavelets. Clin. Biomech. 2020, 73, 101–107. [Google Scholar] [CrossRef]
- Cavalli, M.; Aiolfi, A.; Bruni, P.G.; Manfredini, L.; Lombardo, F.; Bonfanti, M.T.; Bona, D.; Campanelli, G. Prevalence and risk factors for diastasis recti abdominis: A review and proposal of a new anatomical variation. Hernia 2021, 25, 883–890. [Google Scholar] [CrossRef] [PubMed]
- He, K.; Zhou, X.; Zhu, Y. Muscle elasticity is different in individuals with diastasis recti abdominis than healthy volunteers. Insights Imaging 2021, 12, 87. [Google Scholar] [CrossRef] [PubMed]
- Gormley, J.; Copeland, A.; Augustine, H.; Axelrod, C.; McRae, M. Impact of Rectus Diastasis Repair on Abdominal Strength and Function: A Systematic Review. Cureus 2020, 12, e12358. [Google Scholar] [CrossRef] [PubMed]
- Gluppe, S.B.; Engh, M.E.; Bø, K. Immediate Effect of Abdominal and Pelvic Floor Muscle Exercises on Interrecti Distance in Women with Diastasis Recti Abdominis Who Were Parous. Phys. Ther. 2020, 100, 1372–1383. [Google Scholar] [CrossRef] [PubMed]
- McManus, L.; De Vito, G.; Lowery, M.M. Analysis and Biophysics of Surface EMG for Physiotherapists and Kinesiologists: Toward a Common Language with Rehabilitation Engineers. Front. Neurol. 2020, 11, 576729. [Google Scholar] [CrossRef]
- Chapter 4—Advanced Time-Frequency Signal and System Analysis. In Time-Frequency Signal Analysis and Processing, 2nd ed.; Boashash, B. (Ed.) Academic Press: Cambridge, MA, USA, 2016; pp. 141–236. [Google Scholar] [CrossRef]
- Mousmoulis, G.; Yiakopoulos, C.; Aggidis, G.; Antoniadis, I.; Anagnostopoulos, I. Application of Spectral Kurtosis on vibration signals for the detection of cavitation in centrifugal pumps. Appl. Acoust. 2021, 182, 108289. [Google Scholar] [CrossRef]
- Freeborn, T.J. Chapter 21—Fatigue monitoring techniques using wearable systems. In Wearable Sensors, 2nd ed.; Sazonov, E., Ed.; Academic Press: Cambridge, MA, USA, 2021; pp. 575–592. [Google Scholar] [CrossRef]
- Morozumi, K.; Ohsugi, H.; Morishita, K.; Yokoi, Y. Fundamental research on surface electromyography analysis using discrete wavelet transform-an analysis of the central nervous system factors affecting muscle strength. J. Phys. Ther. Sci. 2021, 33, 63–68. [Google Scholar] [CrossRef]
- Popov, D.; Gapochkin, A.; Nekrasov, A. An Algorithm of Daubechies Wavelet Transform in the Final Field When Processing Speech Signals. Electronics 2018, 7, 120. [Google Scholar] [CrossRef] [Green Version]
- Pakniyat, N.; Namazi, H. Complexity-Based Analysis of the Variations of Brain and Muscle Reactions in Walking and Standing Balance While Receiving Different Perturbations. Front. Hum. Neurosci. 2021, 15, 749082. [Google Scholar] [CrossRef] [PubMed]
- Carpena, P.; Gómez-Extremera, M.; Bernaola-Galván, P.A. On the Validity of Detrended Fluctuation Analysis at Short Scales. Entropy 2021, 24, 61. [Google Scholar] [CrossRef] [PubMed]
- Hekmatmanesh, A.; Wu, H.; Handroos, H. Largest Lyapunov Exponent Optimization for Control of a Bionic-Hand: A Brain Computer Interface Study. Front. Rehabil. Sci. 2022, 2, 802070. [Google Scholar] [CrossRef]
- Laborda, J.; Ryoo, S. Feature Selection in a Credit Scoring Model. Mathematics 2021, 9, 746. [Google Scholar] [CrossRef]
- Jo, I.; Lee, S.; Oh, S. Improved Measures of Redundancy and Relevance for mRMR Feature Selection. Computers 2019, 8, 42. [Google Scholar] [CrossRef] [Green Version]
- Chowdhury, A.; Rosenthal, J.; Waring, J.; Umeton, R. Applying Self-Supervised Learning to Medicine: Review of the State of the Art and Medical Implementations. Informatics 2021, 8, 59. [Google Scholar] [CrossRef]
- Pintelas, P.; Livieris, I.E. Special Issue on Ensemble Learning and Applications. Algorithms 2020, 13, 140. [Google Scholar] [CrossRef]
- Taser, P.Y. Application of Bagging and Boosting Approaches Using Decision Tree-Based Algorithms in Diabetes Risk Prediction. Proceedings 2021, 74, 6. [Google Scholar] [CrossRef]
- Tsai, J.-K.; Hung, C.-H. Improving AdaBoost Classifier to Predict Enterprise Performance after COVID-19. Mathematics 2021, 9, 2215. [Google Scholar] [CrossRef]
- Adil, M.; Javaid, N.; Qasim, U.; Ullah, I.; Shafiq, M.; Choi, J.-G. LSTM and Bat-Based RUSBoost Approach for Electricity Theft Detection. Appl. Sci. 2020, 10, 4378. [Google Scholar] [CrossRef]
- Panigrahi, R.; Borah, S.; Bhoi, A.K.; Ijaz, M.F.; Pramanik, M.; Jhaveri, R.H.; Chowdhary, C.L. Performance Assessment of Supervised Classifiers for Designing Intrusion Detection Systems: A Comprehensive Review and Recommendations for Future Research. Mathematics 2021, 9, 690. [Google Scholar] [CrossRef]


| Feature | Specifications |
|---|---|
| Input protection | Radio Frequency and Electromagnetic Interference filter (3 MHz) Defibrillation protection |
| Analog-to-Digital Convertor (ADC) | 24-bit ADC |
| Firmware for wireless transmission | LogAndStream v0.6.0 |
| Transmission bandwidth | 8.4 kHz |
| Sampling frequency | 512 Hz |
| Weight | 31 g |
| Dimensions | 63 mm × 32 mm × 12 mm |
| EEPROM memory | 2048 bytes |
| Ground | Wilson Type Driven Ground |
| Gain (configurable) | 1, 2, 3, 4, 6, 8, 12 |
| Input differential dynamic range (for gain 6) | 800 mV |
| Connections (Input sensor electrodes) | Channel 1 positive—Ch1P Channel 1 negative—Ch1N Channel 2 positive—Ch2P Channel 2 negative—Ch2N Reference electrode—Ref |
| Feature | Description | Inference |
|---|---|---|
| Energy | The area under the squared magnitude of signal. | Tells us about how much energy is contained within the signal. Goal was to see if correctly performed exercises had more/less energy. |
| Kurtosis | Kurtosis is a measure of how outlier-prone a distribution is. The kurtosis of the normal distribution is 3. | In spite of outlier detection and removal, some outliers are inevitable in analysis. The goal was to exploit that to see if this could be a suitable feature for classification. |
| Power | Maximum power of signal is related to spectrum analysis and is calculated using STFT. | It tells us about the maximum power contained in a correct/incorrect EMG signal and helps in analysis. |
| Mean Frequency | The average value of the normalized frequency taken in the frequency domain after computing power spectral density (PSD). | Mean and median frequencies are useful in estimating muscle fatigue. |
| Median Frequency | The median value of the normalized frequency taken in the frequency domain after computing the power spectral density (PSD). | Mean and median frequencies are useful in estimating muscle fatigue. |
| D_median | Median of detailed coefficients of the 10th level, 1st order Daubechies wavelet decomposition | WT reduces crosstalk between different muscles. In the 10th level of WT and decomposition, it tells us if the median of the EMG signal shows characteristics that can differentiate between correct and incorrect. |
| D_rms | RMS of detailed coefficients of the 10th level, 1st order Daubechies wavelet decomposition | WT reduces crosstalk between different muscles. In the 10th level of WT and decomposition, it tells us if the RMS of the EMG signal shows characteristics that can differentiate between correct and incorrect. |
| Approximate Entropy | Approximate entropy is a regularity statistic that quantifies the unpredictability of fluctuations in a time series. High value indicates that similar patterns are not followed by the same. | EMG signals are nonstationary signals that vary erratically with time. Such a time series signal is prone to fluctuations. Here the goal is to see whether correct and incorrect exercises produce differentiable EMG in terms of predictability. |
| DFA—Hurst exponent | A nonlinear feature that tells us about the degree of self-affinity in a signal. | EMG signals are nonstationary signals, and their characteristics vary with time. DFA tells us about the predictability of the latter part of a signal in comparison to its initial parts. |
| Largest Lyapunov’s Exponent | It quantifies the rate of divergence or convergence of close trajectories in phase space. positive indicates divergence, negative indicates convergence. | In the phase space, the goal was to analyze whether or not correct and incorrect exercises produce convergence/divergence. |
| Feature | Box Plots |
| Kurtosis | 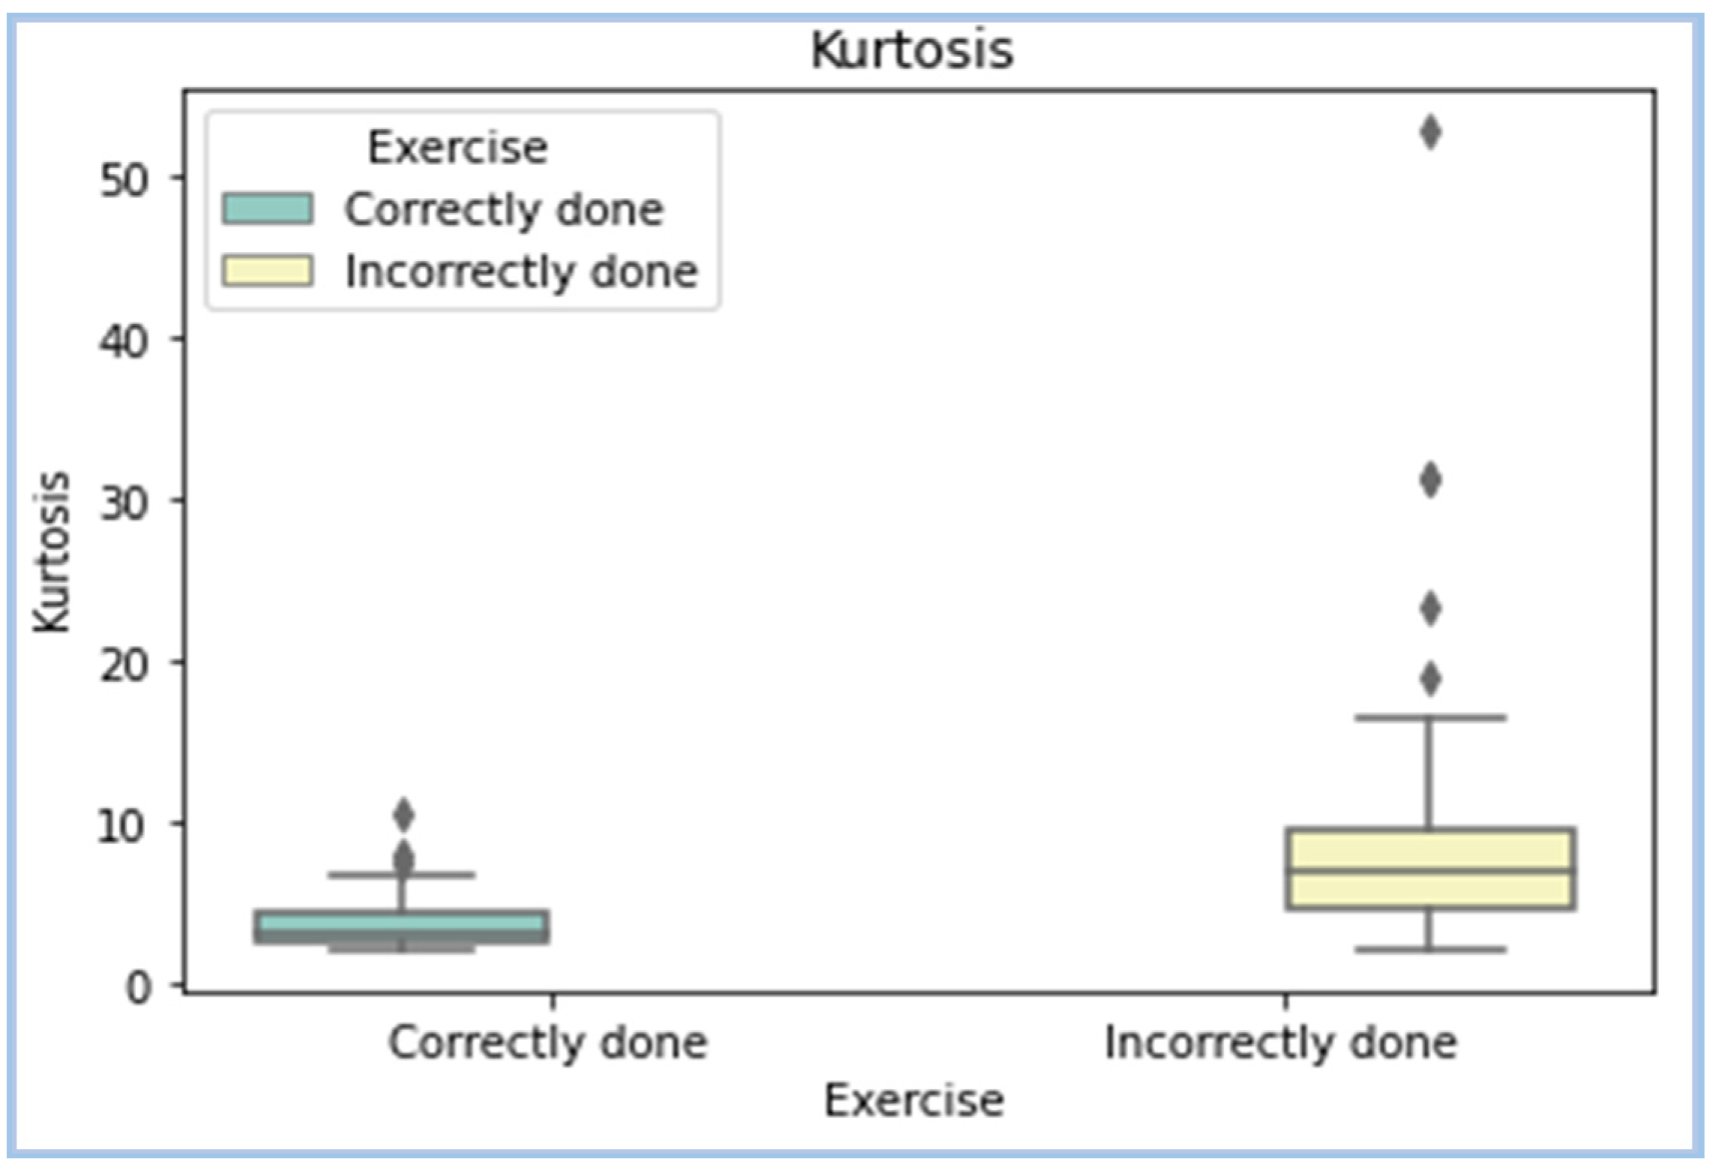 |
| Mean Frequency | 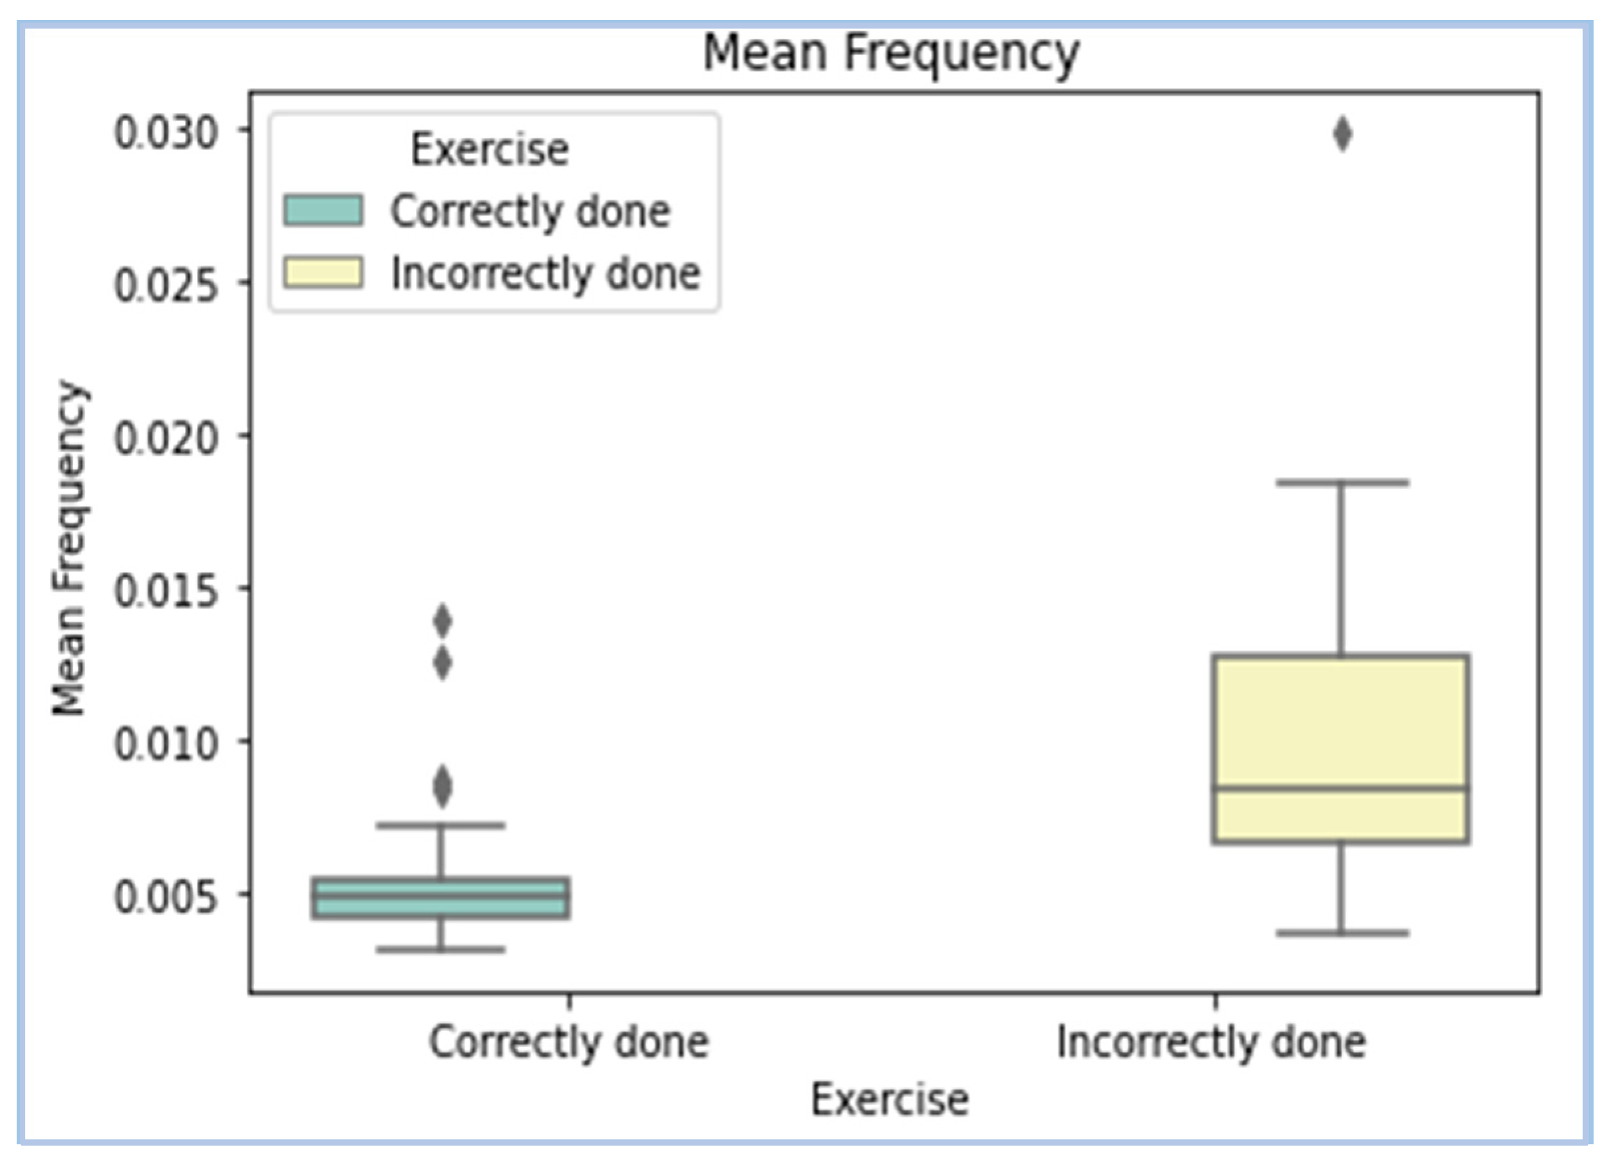 |
| DFA—Hurst Exponent | 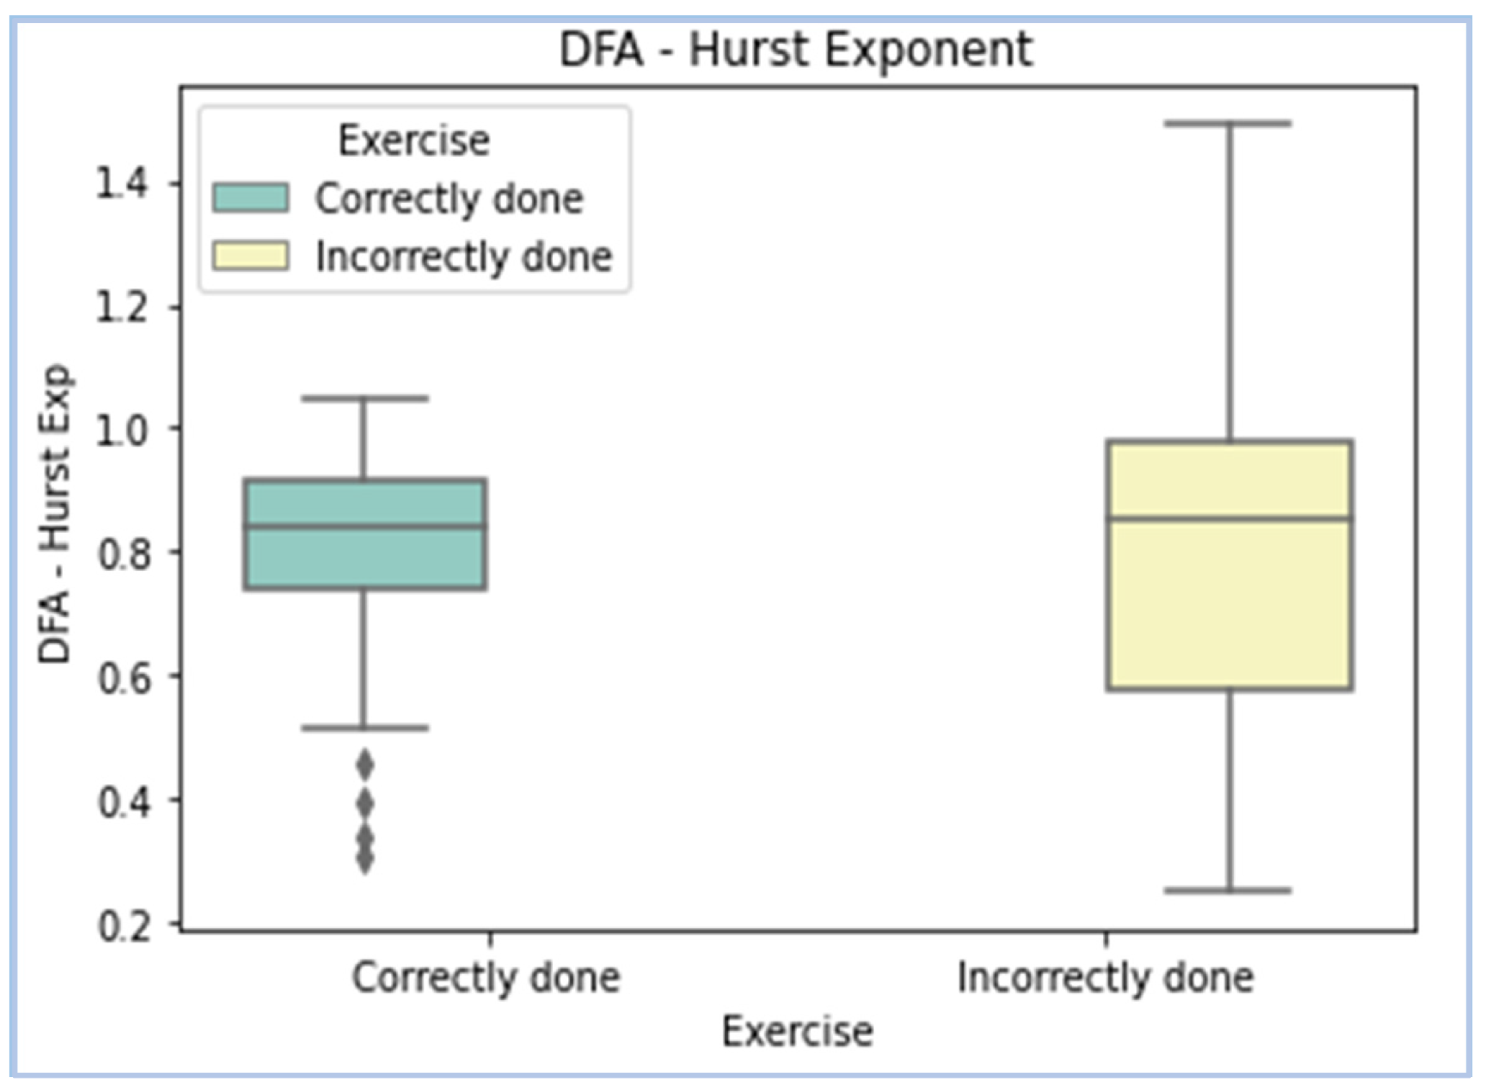 |
| Chi-Square Algorithm | MRMR Algorithm |
|---|---|
| Kurtosis | Kurtosis |
| Mean frequency | Exercise performed |
| DFA (Hurst Exponent) | Mean frequency |
| Entropy | D_rms |
| D_med | Median frequency |
| D_rms | Entropy |
| Model | Parameters | Training Accuracy (%) | Testing Accuracy (%) |
|---|---|---|---|
| Bagged Trees | Maximum number of splits: 20 Number of Learners: 5 Learning rate: 0.1 | 97 | 84.6 |
| AdaBoost | Maximum number of splits: 20 Number of Learners: 30 Learning rate: 0.1 | 60.1 | 53.8 |
| RUSBoosted | Maximum number of splits: 20 Number of Learners: 30 Learning rate: 0.1 | 100 | 76.9 |
| RUSBoosted | Maximum number of splits: 35 Number of Learners: 35 Learning rate: 0.01 | 98.47 | 92.3 |
| LogitBoost | Maximum number of splits: 20 Number of Learners: 25 Learning rate: 0.01 | 94.9 | 84.6 |
| GentleBoost | Maximum number of splits: 20 Number of Learners: 30 Learning rate: 0.1 | 100 | 92.3 |
Publisher’s Note: MDPI stays neutral with regard to jurisdictional claims in published maps and institutional affiliations. |
© 2022 by the authors. Licensee MDPI, Basel, Switzerland. This article is an open access article distributed under the terms and conditions of the Creative Commons Attribution (CC BY) license (https://creativecommons.org/licenses/by/4.0/).
Share and Cite
Radhakrishnan, M.; Ramamurthy, K.; Kothandaraman, A.; Premkumar, V.J.; Ramesh, N. Automatic Assessment of Abdominal Exercises for the Treatment of Diastasis Recti Abdominis Using Electromyography and Machine Learning. Symmetry 2022, 14, 1654. https://doi.org/10.3390/sym14081654
Radhakrishnan M, Ramamurthy K, Kothandaraman A, Premkumar VJ, Ramesh N. Automatic Assessment of Abdominal Exercises for the Treatment of Diastasis Recti Abdominis Using Electromyography and Machine Learning. Symmetry. 2022; 14(8):1654. https://doi.org/10.3390/sym14081654
Chicago/Turabian StyleRadhakrishnan, Menaka, Karthik Ramamurthy, Avantika Kothandaraman, Vinitha Joshy Premkumar, and Nandita Ramesh. 2022. "Automatic Assessment of Abdominal Exercises for the Treatment of Diastasis Recti Abdominis Using Electromyography and Machine Learning" Symmetry 14, no. 8: 1654. https://doi.org/10.3390/sym14081654
APA StyleRadhakrishnan, M., Ramamurthy, K., Kothandaraman, A., Premkumar, V. J., & Ramesh, N. (2022). Automatic Assessment of Abdominal Exercises for the Treatment of Diastasis Recti Abdominis Using Electromyography and Machine Learning. Symmetry, 14(8), 1654. https://doi.org/10.3390/sym14081654