Article

Spectral Intensity of Electron Cyclotron Radiation Emerging from the Plasma to the First Wall in ITER

by
Pavel V. Minashin
1 and
Alexander B. Kukushkin
1,2,3,*
1
National Research Center “Kurchatov Institute”, 123182 Moscow, Russia
2
National Research Nuclear University MEPhI (Moscow Engineering Physics Institute), 115409 Moscow, Russia
3
Moscow Institute of Physics and Technology, National Research University, 141700 Dolgoprudny, Russia
*
Author to whom correspondence should be addressed.
Symmetry 2023, 15(1), 118; https://doi.org/10.3390/sym15010118
Submission received: 4 November 2022 / Revised: 19 December 2022 / Accepted: 26 December 2022 / Published: 31 December 2022
(This article belongs to the Section Physics)

Abstract

:
It is predicted that in ITER, due to high values of electron temperature and magnetic field strength, electron cyclotron (EC) radiation emitted by plasma will be a significant source (together with external EC radiation injected for auxiliary plasma heating and non-inductive current drive) of additional thermal and electromagnetic loads for microwave and optical diagnostics. The spectral distribution of plasma EC radiation is particularly important to consider in millimeter-wave diagnostics, namely for high- and low-magnetic-field side reflectometry, plasma position reflectometry, and collective Thomson scattering diagnostic, because the transmission lines of these diagnostics yield the transport of EC waves emitted by the plasma. The development of semi-analytical methods used to describe the spectral distribution of plasma-generated EC radiation in tokamaks, starting from the work of S. Tamor, is based on the dominance of multiple reflections of this radiation from the first wall in a toroidal axially symmetric vacuum chamber. Here, we present calculations using the CYNEQ code of the spectral intensity of the EC radiation emerging from the plasma to the first wall and port plugs for five scenarios of ITER operation. This code uses the symmetry-based effect of approximate isotropy and homogeneity of radiation intensity in a substantial part of the phase space and has been successfully tested by comparison with first-principles codes. The energy flux density in the range of 30–200 kW/m2 is predicted for wall reflectance in the range of 0.6–0.95. The possible effect of this radiation on in-vessel components and diagnostics is assessed by calculating the surface density of the energy absorbed by various materials of the ITER first wall.

1. Introduction

Electron cyclotron (EC) radiation in ITER is expected to play an important role in electron-power-loss balance due to the high electron temperature and strong magnetic field [1,2]. This radiation is also a source of additional thermal and electromagnetic loads for microwave and optical diagnostics [3,4]. The EC radiation generated in the plasma dominates over the stray radiation from electron cyclotron resonance heating (ECRH) and current drive (ECCD) microwave power sources in high-performance discharges at the flat-top stage of discharge, so its effect on diagnostics should be investigated [3]. This is especially important for millimeter-wave diagnostics in ITER, such as microwave reflectometers and the collective Thomson scattering system, whose transmission lines yield the transport of EC waves emitted by the plasma and, in principle, additional measurements of EC radiation spectra [5]. Transmission lines for high field side (HFS) reflectometry are planned to be used as waveguides to observe the radiation of extraordinary waves (X-mode) in the frequency range of 12–90 GHz and of ordinary waves (O-mode) in the 18–140 GHz frequency range. These diagnostics have an operating frequency range that lies significantly below the main cyclotron frequency on the toroidal axis of the vacuum chamber (148 GHz) and the operating frequency of the additional heating and non-inductive current generation (170 GHz) in ITER. However, the antennas and waveguides of the discussed diagnostics are susceptible to the entire spectrum of electromagnetic radiation at frequencies above 10 GHz. Because the absorption of the energy of electromagnetic waves by the metal walls of waveguides and other elements of diagnostic systems increases noticeably with an increase in the frequency of the waves, the EC radiation from the plasma can be the cause of their strong heating.
This paper is structured as follows. In Section 2, “Materials and Methods”, we describe the CYNEQ code [2,6,7], which is used to simulate the transport of the EC radiation in the plasma at moderate and high harmonics of the EC fundamental frequency, and briefly describe the algorithm [8,9] used to calculate the EC radiation spectrum from low to high harmonics of the EC frequency. Section 3, “Results”, presents detailed calculations of the spectral intensity of the EC radiation and its properties for five reference scenarios of ITER operation, obtained by the simulation of the discharges using the free-boundary transport modelling code CORSICA [10]. Compared to previous works [8,9], which describe the calculation algorithm and provide calculations of the plasma-generated EC radiation intensity in ITER and DEMO (in a baseline scenario predicted using the ASTRA [11] and CRONOS [12] codes, respectively), the present calculations are made for the reference ITER scenarios, which are modeled with CORSICA to cover a wide range of ITER operation parameters. Additionally, the present work includes a comparison of the EC radiation energy flux density and the absorbed energy density for two different sources, namely the plasma-generated EC radiation and the stray radiation produced by the reflection of the radiation injected by ECH/ECCD systems. Section 4 contains a discussion and the conclusions on the results obtained for the absorption of the EC radiation by various materials of the ITER first wall in the view of its possible effect on in-vessel components and diagnostics.

2. Materials and Methods

2.1. CYNEQ Code for EC Radiation Transport in Tokamak Reactors at High and Moderate Harmonics

The current state of the art in modeling the transport of plasma-generated EC radiation in tokamaks with high-temperature plasma and highly reflecting vacuum chamber walls is described in detail in a recent review [13]. Under tokamak reactor conditions (high-temperature plasma with a volume average electron temperature < Te >V≥ 10 keV; non-circular poloidal cross-section of the torus; moderate values of aspect ratio A~3; and multiple reflections of radiation from the vacuum chamber wall), the transport of EC radiation appears to be non-local (non-diffusive), i.e., most of the EC radiation energy is carried by electromagnetic waves, for which plasma is optically thin for one pass between the reflections from the wall. The CYNEQ code [2,6,7] provides a semi-analytical solution to the EC-radiation-transport problem in tokamak reactors, using the assumption of the angular isotropy of the intensity of EC radiation, proposed by the advanced first-principles simulations of EC radiation transport using the SNECTR code [14,15].
In [16,17], it was shown that under tokamak reactor conditions, the results of the CYNEQ code are in good agreement with other EC radiation transport codes: (1) the SNECTR code [14,15], which is based on the Monte Carlo simulation of the EC wave emission and absorption in an axisymmetric toroidal plasma with specular or diffuse reflection of waves from the walls of a vacuum chamber; and (2) the RAYTEC code [18], which integrates the radiative transfer equation along the trajectories of EC waves, taking into account the reflection of radiation from the wall.
The approach of the CYNEQ code to solve the problem of the EC-radiation-transfer equation in tokamak reactors is close to the CYTRAN code [19] but, at the same time, improves it by using the escape probability method developed for radiation transfer in spectral lines of atoms and ions in the case of radiation transfer by free electrons (the relations between CYTRAN and CYNEQ are discussed in detail in [13] in Section 2.2).
The conclusion of the benchmarking [2,16,17] was that the modified codes CYNEQ [7] and CYTRAN [19,20] (in the version that participated in the benchmarking [16]) are suitable for use in global transport codes (e.g., ASTRA [11]) for self-consistent 1.5D transport simulations of plasma evolution in tokamak reactors because they provide good approximation and computational efficiency. A comparison between the CYNEQ and CYTRAN results and the latest results [21] from RAYTEC simulations of ECR power loss density for DEMO-like high-temperature plasmas in [13] confirmed this conclusion. Therefore, the use of the CYNEQ code is acceptable in estimating the thermal loads on the first wall in ITER.
Within the CYNEQ code approach, the plasma is divided into an optically thick inner region and an optically thin outer region. In the optically thin region, the intensity of the outgoing EC radiation, J, assuming its angular isotropy, is a function of the wave frequency and wave mode and is given by a simple equation, which in the case of neglecting the conversion of the EC wave modes in wall reflections takes the following form:
J ( ν , ζ ) = d Ω n V t h i n d V q ( ϕ , r ) d Ω n ( n d S ) > 0 ( n d S ) ( 1 R w ( ϕ , r ) ) + d Ω n V t h i n d V κ ( ϕ , r )
where ϕ = [ν, n, ζ] is the set of the wave parameters in which ν is the wave frequency, n is the wave direction, ζ is the wave mode (polarization) (O: ordinary wave; X: extraordinary wave), r is the spatial coordinate (which, due to the toroidal symmetry of magnetic confinement systems, is reduced to the dimensionless radial coordinate, ρ, which is the square root of the normalized toroidal magnetic flux and, in fact, a label of the magnetic flux surface), q and κ are the coefficients of emission and absorption of the EC waves, and Rw is the reflection coefficient of the EC radiation from the wall of the vacuum chamber. Note that the absorption and emission coefficients in Equation (1) are averaged over the angles of wave propagation, Ωn, and the volume, Vthin, of the optically thin plasma region. In the CYNEQ code, the coefficients of absorption and emission of the EC waves are calculated using the Schott–Trubnikov formulas as described in [22,23] (Equations 3.13 and 6.15, respectively) and [24] (Equation 2.2.24). A simplification of the calculations using Equation (1) is made: instead of the exact value of the integral with an average of the reflection coefficient over the area of the chamber surface, S, a constant value of surface-averaged Rw is used, which is a free-input parameter in our simulations. We do not take into account the polarization scrambling of EC waves in reflections from the wall because, for the considered high values of Rw and the domination of the frequency range of moderate and high harmonics in EC radiation intensity, this effect is not important [25].
The non-local nature of the EC radiation transfer in the optically transparent region manifests itself in Formula (1) in the fact that the intensity of this radiation is a function of the integral characteristics of the plasma (namely, volume-averaged coefficients of emission and absorptions of the EC waves). Energy losses are due to the escape of photons from the device with a free path of EC waves in relation to their absorption by the plasma, significantly exceeding the characteristic width of the toroidal plasma column in its poloidal cross-section. The latter is due to the strong reflection of EC radiation from the wall of the vacuum chamber.
The optically thin outer plasma layer used in Equation (1) is defined by the following equation:
ρ t h i n 1 a κ ( ρ , ν , ζ ) d ρ τ crit
where a is the effective minor radius of toroidal plasma (considering the ellipticity of the last closed magnetic-flux surface) and τcrit is an effective value of the optical thickness (which was chosen as equal to 1.5, so that the semi-analytical approach of the CYNEQ code better matches the first-principles modelling of the SNECTR code). For tokamak reactor conditions, this region dominates moderate and high EC harmonics with harmonic number n ≥ 3 of the fundamental EC wave frequency, νc0 = e B0/(2π me), where e is the electron charge, B0 is the vacuum magnetic field on the torus axis, and me is the electron mass (see, e.g., Figure 3 in [13] for an illustration of the size of the optically thick region of plasma for an ITER-like scenario of operation). The optically thick inner region of the plasma is the region where diffusive transport dominates. For this part of the phase space, EC radiation intensity is assumed to be equal to the blackbody intensity. To improve accuracy, the boundary between intensity (1) and blackbody intensity can be smoothed by interpolation between these two regions (see Equation (10) in [2]).

2.2. Estimation of EC Radiation Outgoing from Plasma at Low Harmonics

While for the modeling of the EC radiation spectrum at the moderate and high harmonics of the fundamental EC wave frequency, n ≥ 3, we use the approach of the CYNEQ code, to estimate the outgoing radiation at low harmonics, n = 1 and n = 2, we use the following simplified model. For EC waves at harmonics n = 1 and n = 2, the plasma in ITER will be optically thick. In this case, the local values of the EC radiation intensity are close to those of blackbody radiation with a temperature equal to that of the local electron temperature. This yields a relationship between (in a reasonable approximation) the spectral intensity of the outgoing EC radiation and the spatial profile of the electron temperature Te along the chord of observation. We assume that the radiation temperature is defined in the standard way:
T rad ( ν ) = c 2 ν 2 J ( ν )
For harmonics n = 1 and n = 2, the radiation temperature is equal to the electron temperature in the resonance region of the wave–particle interaction:
T rad ( ν ) = T e ( r r e s ( ν ) ) , ν = n e B ( r r e s ) 2 π m e ,
where rres is the radial coordinate (in the torus poloidal cross-section) of the wave–particle resonance region for the propagation of the EC wave perpendicular to the magnetic field and B(r) is the local magnetic field (in which the tokamak is proportional to 1/R, where R is the torus radial coordinate in the poloidal cross-section). The spectral intensity of the EC radiation, differential in solid angle, can be calculated by Equations (3) and (4). The accuracy of this approach can be estimated from the comparison in Figure 3 in [26] of two angles of the observation/collection of EC radiation, which shows the simulation of EC emission spectra at low harmonics in ITER using the SPECE code [27] and calculations using Equations similar to (3) and (4). From the results of [26] and the present work, it is clear that the accuracy of Equations (3) and (4) in estimating the frequency-integrated thermal loads is satisfactory.
Note that the EC radiation intensity at low harmonics coming from the optically thick (for a given frequency) region of plasma is isotropic. When the direction of the observation chord deviates from the direction perpendicular to the magnetic field, and when the chord crosses the toroidal plasma column in a short section near the plasma surface, Equation (4) is no longer applicable, and a detailed calculation is required for the spectral–angular distribution of the outgoing radiation intensity in the corresponding range of angles and frequencies. In general, for the simulation of the EC radiation spectra at low harmonics, it is necessary to consider all the features of the propagation of EC waves in plasma, including the reflection of waves from cut-off zones, polarization scrambling at wall reflections, etc. Accurate modelling of the EC radiation spectra from plasma at low harmonics is performed using the following methods: single-pass ray-tracing calculations using the SPECE code [26,27]; and the approach described in [28], which relies on the ensemble-averaging of rays traced through many randomized wall reflections. However, the details of the spectrum of the outgoing EC radiation at low harmonics, as we will see below, are not critical for the assessment of the possible contribution of plasma-generated EC radiation to the thermal and electromagnetic loads on various diagnostics, on the first wall, and in regions behind the blankets and in the port plugs.
To analyze the effect of EC radiation on in-vessel components, it is convenient to use the total (i.e., integrated over frequencies and angles) EC radiation energy flux density, emerging from the plasma to the first wall, which is calculated by the following formula:
F = π ζ = X , O J ( ν , ζ ) d ν

2.3. Calculation of Stray Radiation Produced by External Injected Radiation

The energy density of the flux of the plasma-generated EC radiation on the ITER first wall can be compared with the stray microwave radiation produced by multiple reflections of the unabsorbed external radiation, injected into the plasma from the gyrotrons for ECRH/ECCD and diagnostics purposes. The energy flux density of the stray radiation from the gyrotron radiation of the collective Thomson scattering diagnostic (average power of 500 kW at 60 GHz) is in the range of 11–45 kW/m2 (see Table 4 in [4]). In the case of an isotropic and homogeneous stray radiation field from gyrotrons of the ECH system, the calculation of the respective energy flux density, Finj, from the steady-state power balance equation, without taking into account the absorption of the injected EC radiation in plasma, yields the following relation, which can also be derived from Equations (1) and (5) for negligible absorption:
F i n j = P i n j ( 1 R w ) S ,
where Pinj is the total injected power. At the start-up phase of the discharge in ITER with an input power of Pinj = 6.7 MW, and Rw in range of 0.6–0.95, the energy flux density will be in the range 19–153 kW/m2, respectively.
The way to obtain Equation (6) can be considered as a simplification (to a single resonator) of the multi-resonator model proposed in [29] and applied in [3,4] to estimate the energy flux density of stray radiation from the ECRH/ECCD system in ITER. Calculations of the stray radiation energy fluxes in 55 sectors of the ITER vacuum vessel are presented in [4]. The simplification, which uses a single resonator with an effective surface-averaged reflection coefficient, is appropriate because this coefficient can be found by solving an inverse problem using calculations with a multi-resonator model (see Section 7 in [4]), and then it can be used to estimate the energy flux density for plasma-generated EC radiation with high accuracy, which is more isotropic and homogeneous than the ECRH/ECCD-produced stray radiation.

3. Results

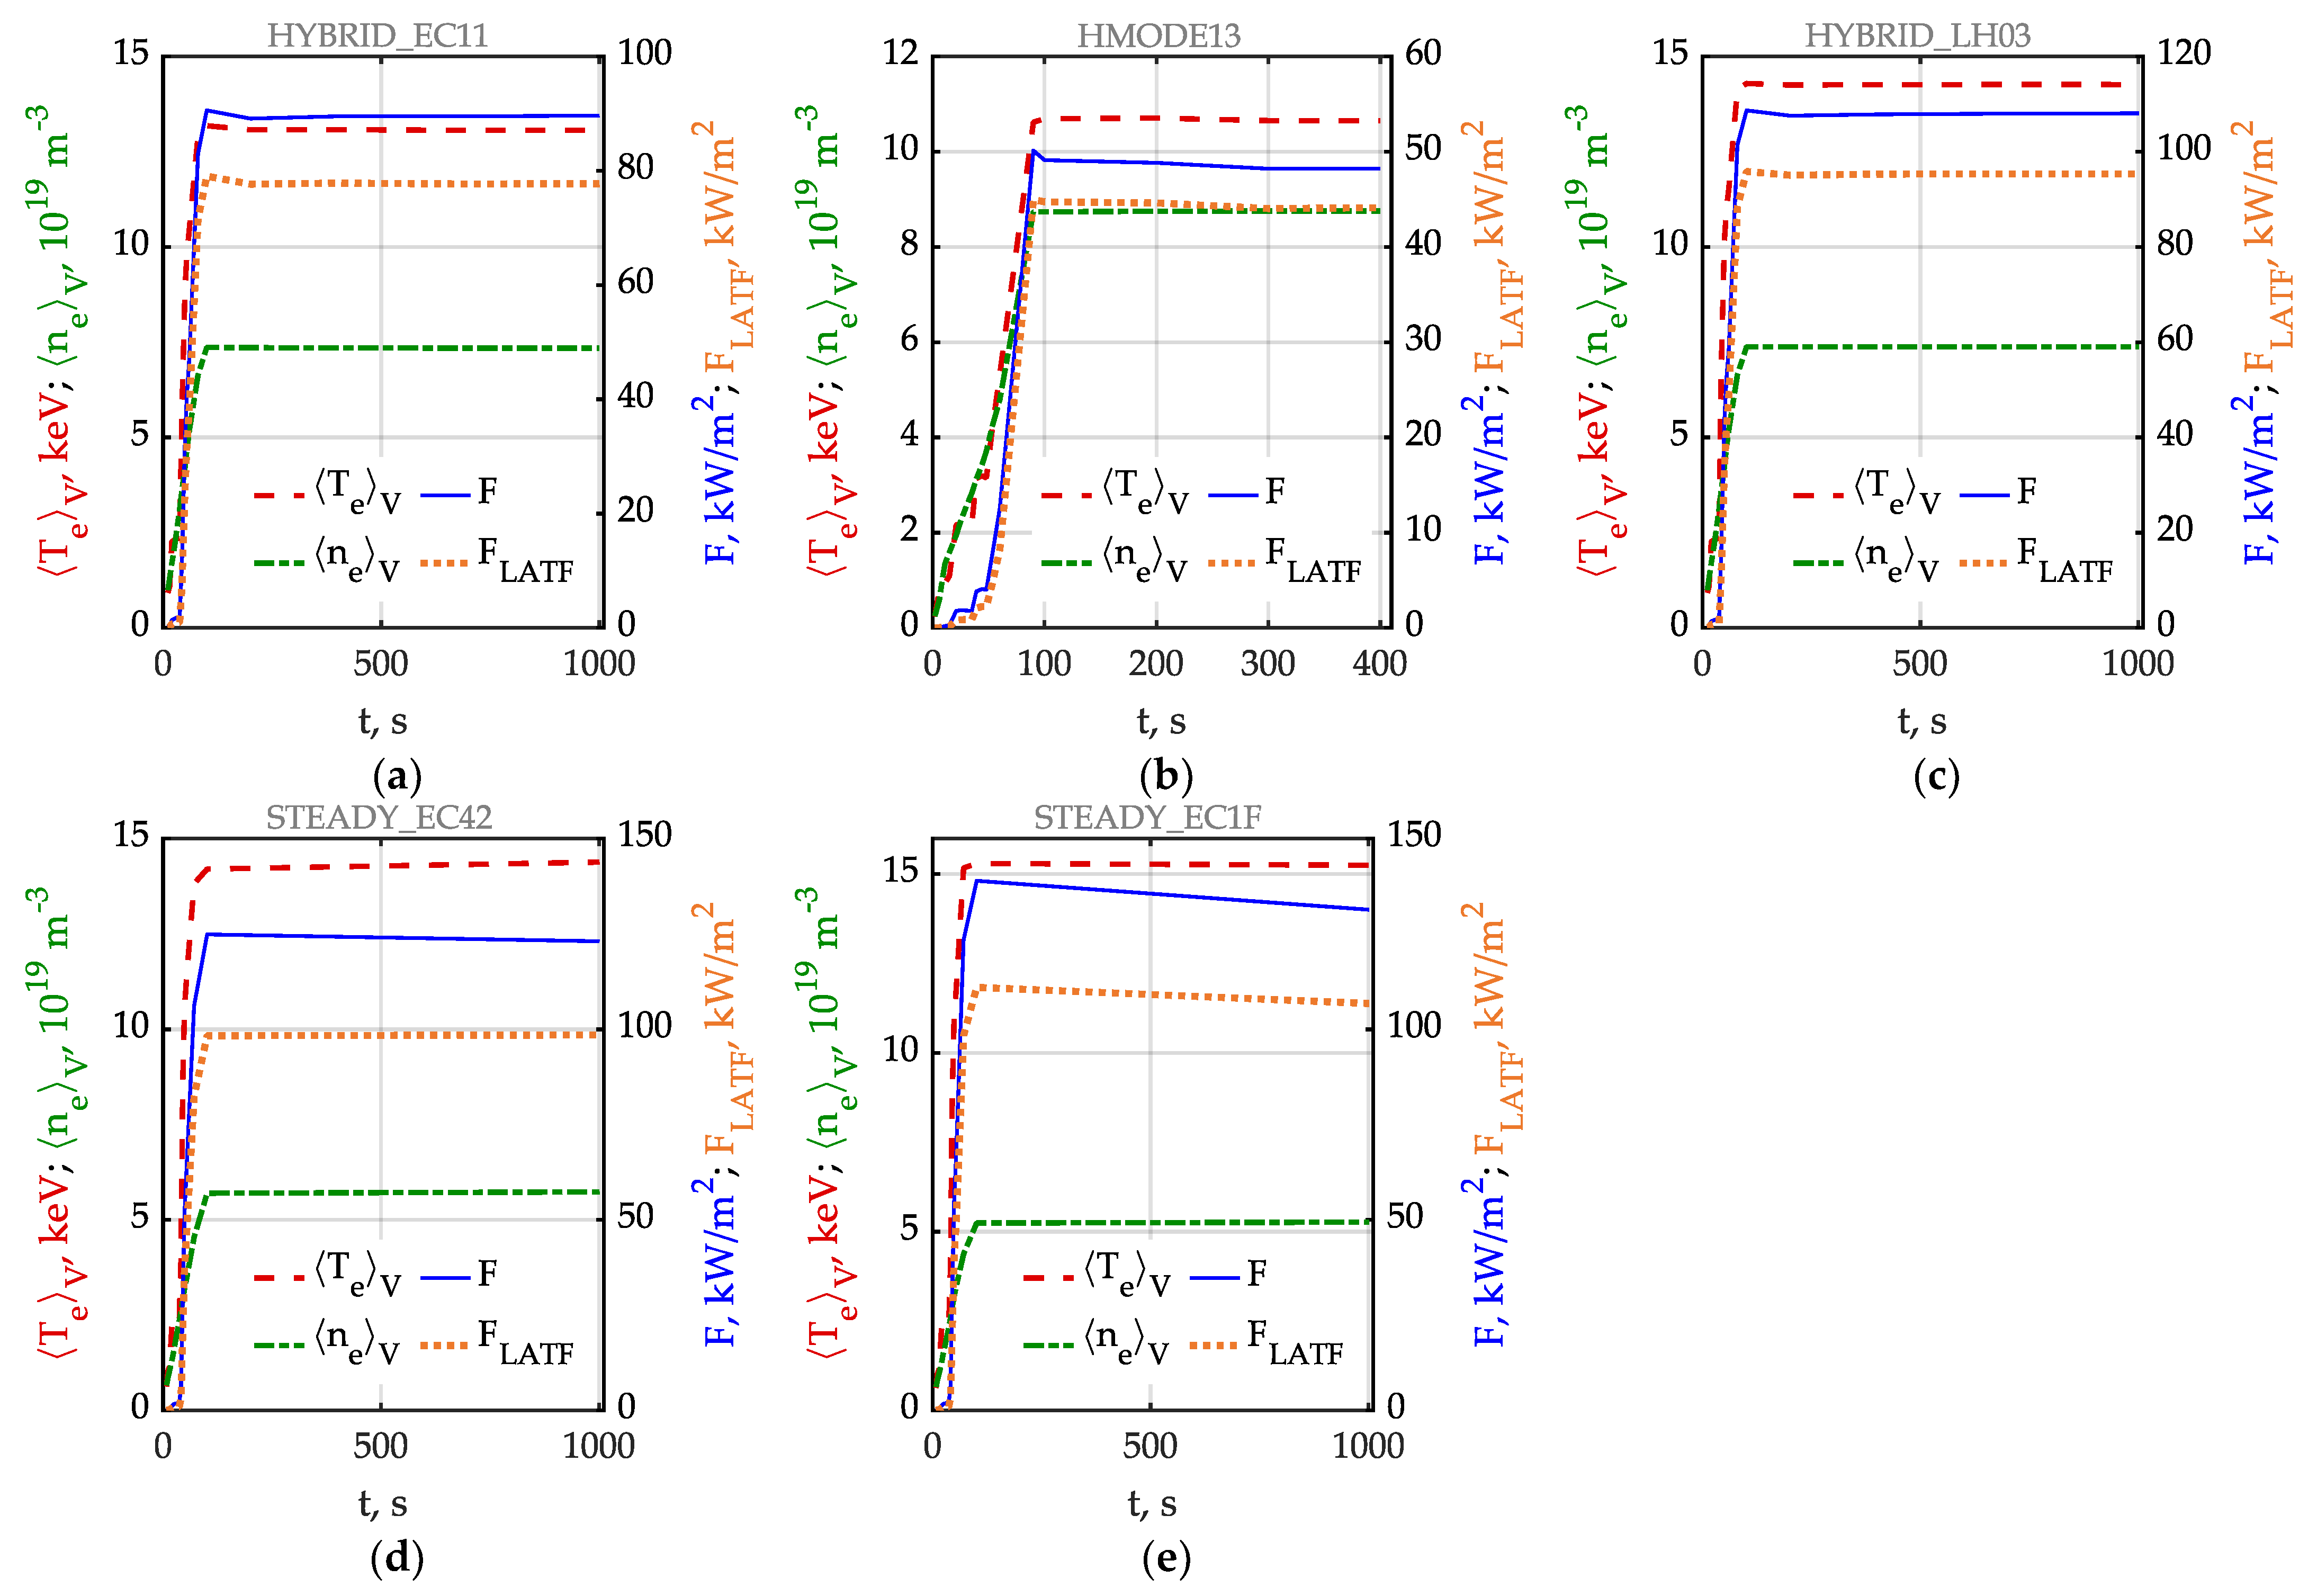
3.1. Scenarios of Tokamak Reactor ITER Operation

Tokamak reactor ITER has the following characteristic parameters: torus major and minor radii R0 = 6.2 m and a = 2.0 m, respectively; elongation kelong = 1.9; triangularity δ = 0.6 of the plasma poloidal cross-section; and magnetic field strength on the torus axis B0 = 5.3 T. Calculations of the spectral intensity of EC radiation were performed for five scenarios of ITER operation:
(1)
baseline inductive scenario, operating in high confinement mode (H-mode) with plasma current Ip = 15 MA (we use label HMODE13 for this scenario);
(2)
hybrid operation scenario with electron cyclotron heating (ECH), Ip = 12.5 MA (HYBRID_EC11);
(3)
hybrid operation scenario with ECH and lower hybrid heating, Ip = 12.5 MA (HYBRID_LH03);
(4)
steady-state operation scenario with injection of 13.3 MW of ECH power, Ip = 8.5 MA (STEADY_EC42);
(5)
steady-state scenario with injection of 20 MW ECH power, Ip = 9.0 MA (STEADY_EC1F).
These scenarios, developed in 2016–2021, were obtained by a simulation of the ITER discharges with the free-boundary transport modelling code CORSICA [10]. The ITER baseline scenario is published in [30], hybrid scenarios are presented in [31], and steady-state scenarios are given in [32]. The CORSICA-simulated scenarios used in this study have been developed and provided before the recent decision to remove the LHCD system from ITER upgrade options [33]. However, the analysis conducted in this work mainly depends on the global 0D plasma parameters and major plasma profiles, such as the temperature and density. Considering the large number of uncertainties on the assumptions applied to the ITER DT scenarios, the range of global 0D parameters and plasma profiles would still be in the foreseen ranges, and the interpretation of EC power loss analysis and the validity of the developed tool would be unchanged. Table 1 shows the comparison of the main parameters of these ITER scenarios for the flat-top stage of discharge.

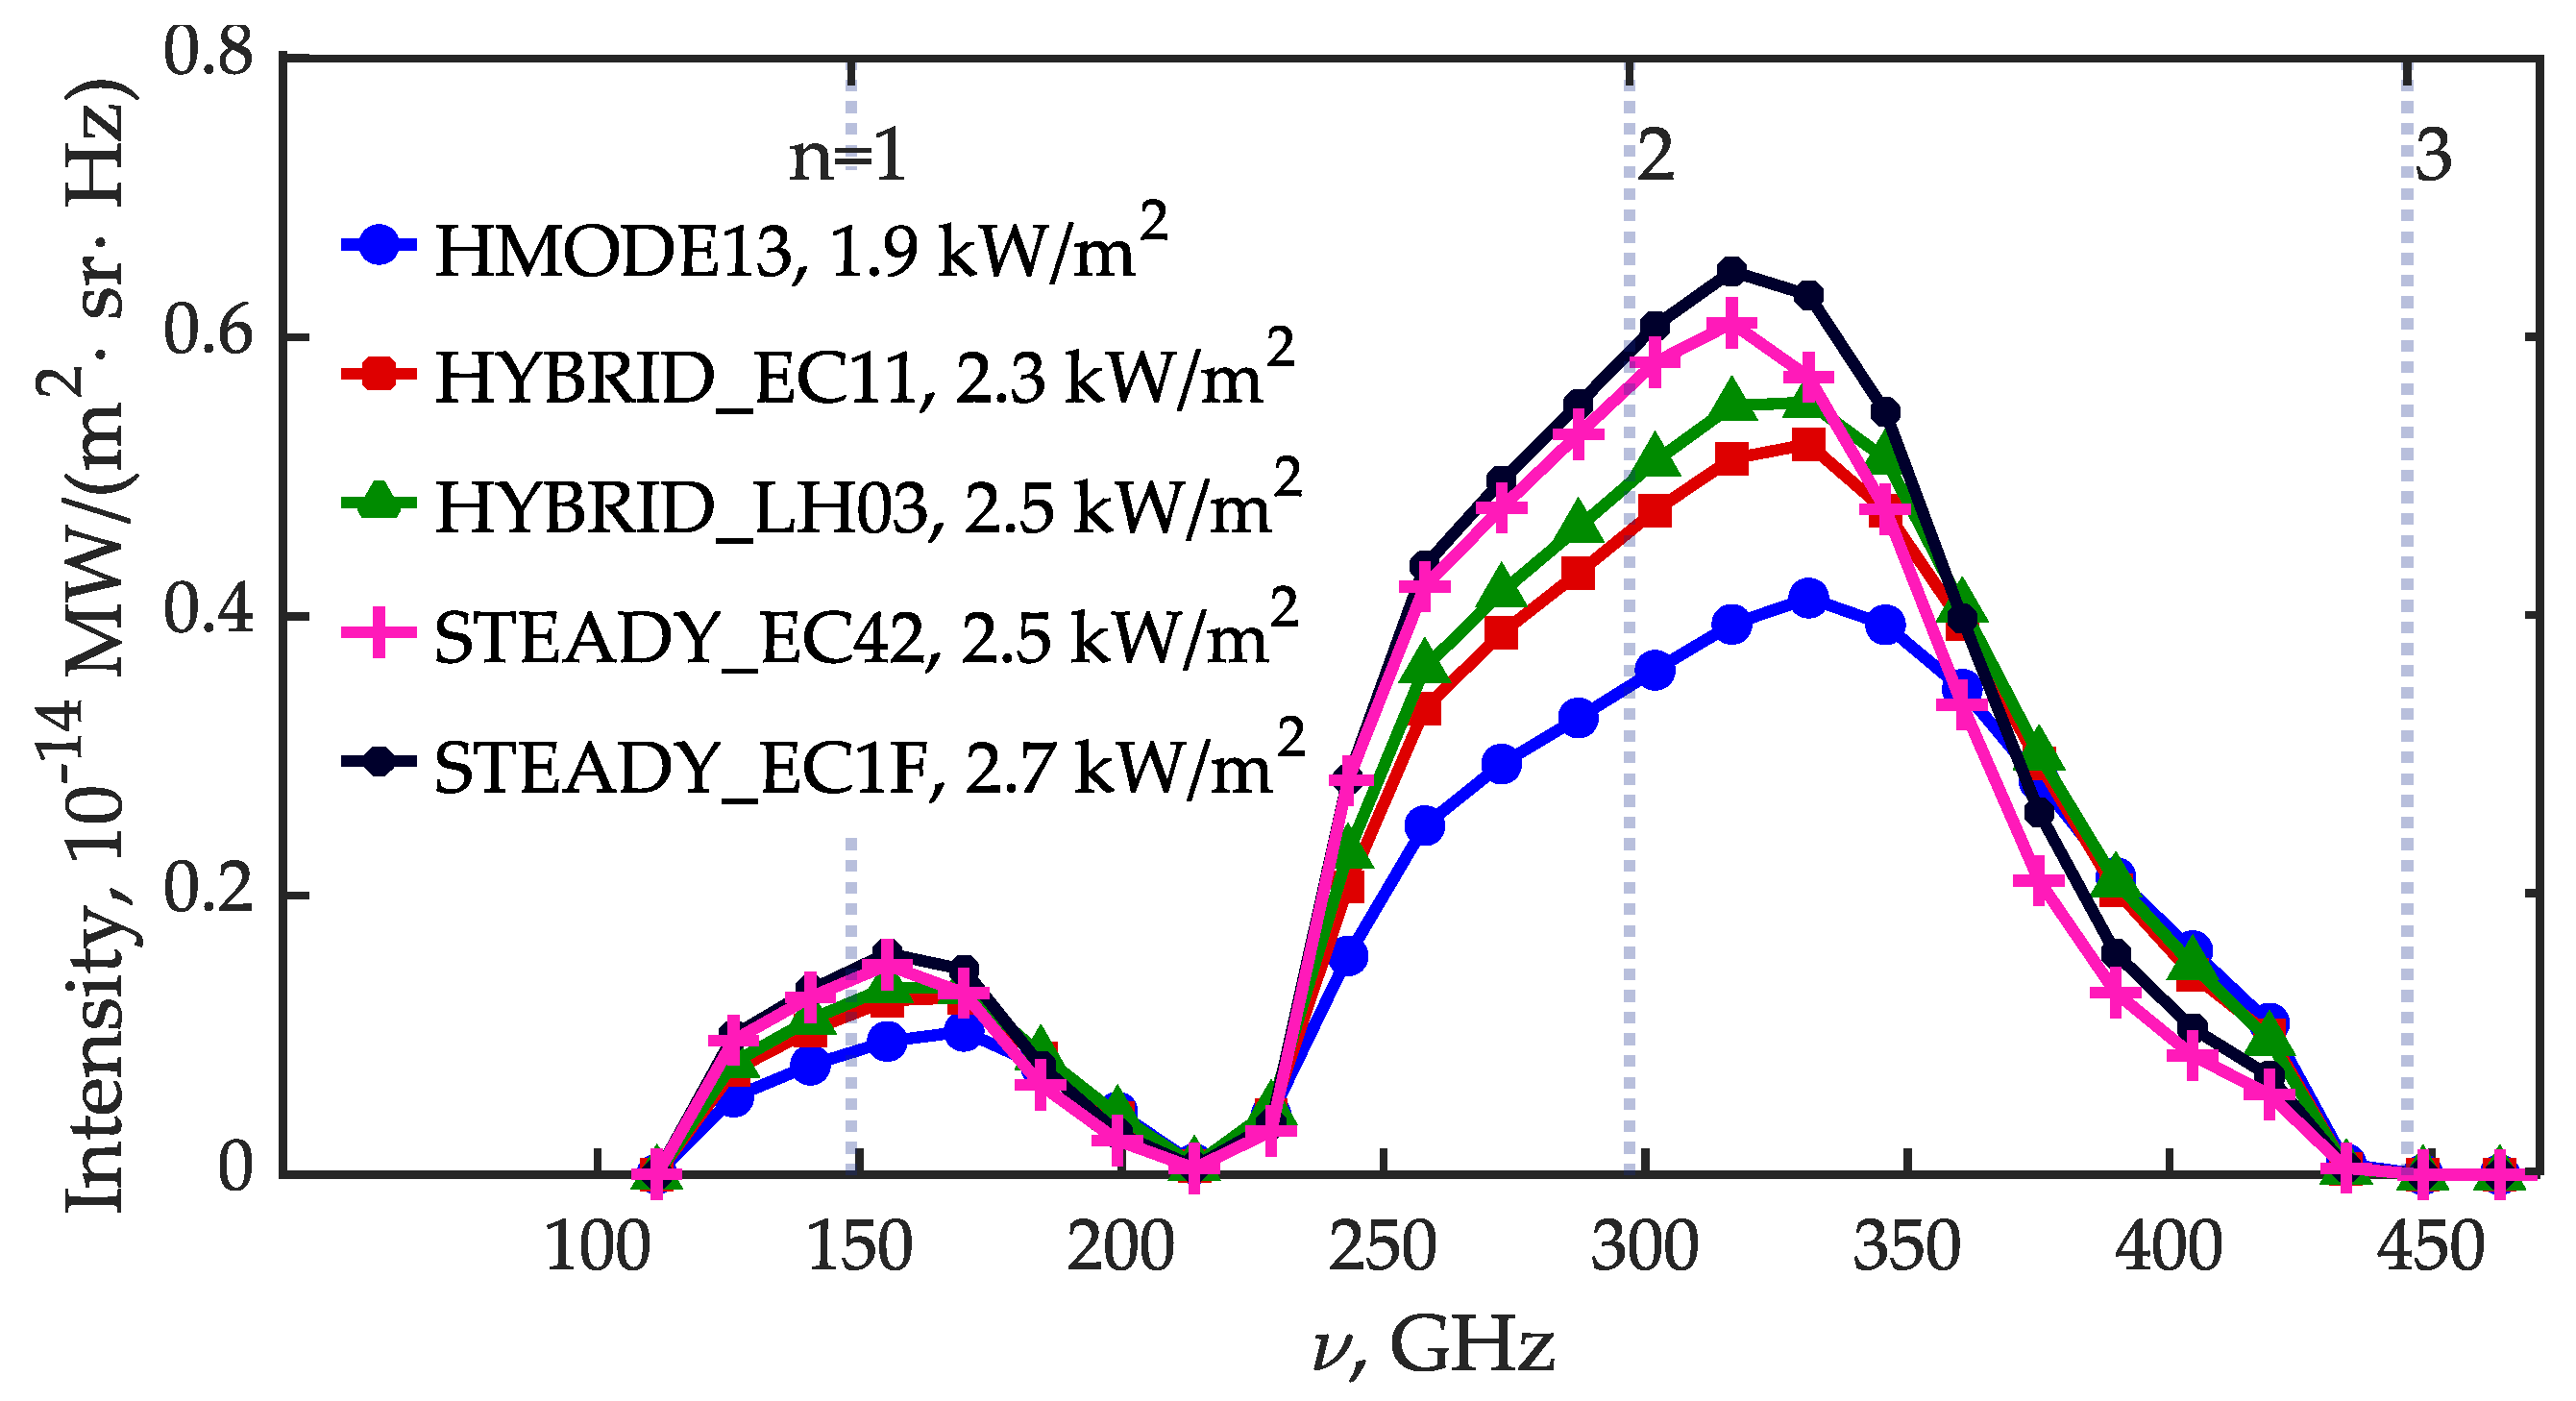
3.2. Spectral Intensity and Energy Flux Density of EC Radiation from Plasma at Low EC Harmonics

Figure 1 shows the results obtained using Formulas (3) and (4) for the spectral intensity emerging from the plasma to the first wall for low EC harmonics n = 1 and n = 2 and the corresponding EC energy flux density for all considered scenarios of ITER operation. Note that, in our calculations, the EC radiation spectrum at low EC radiation harmonics does not depend on the EC radiation reflection from the wall.

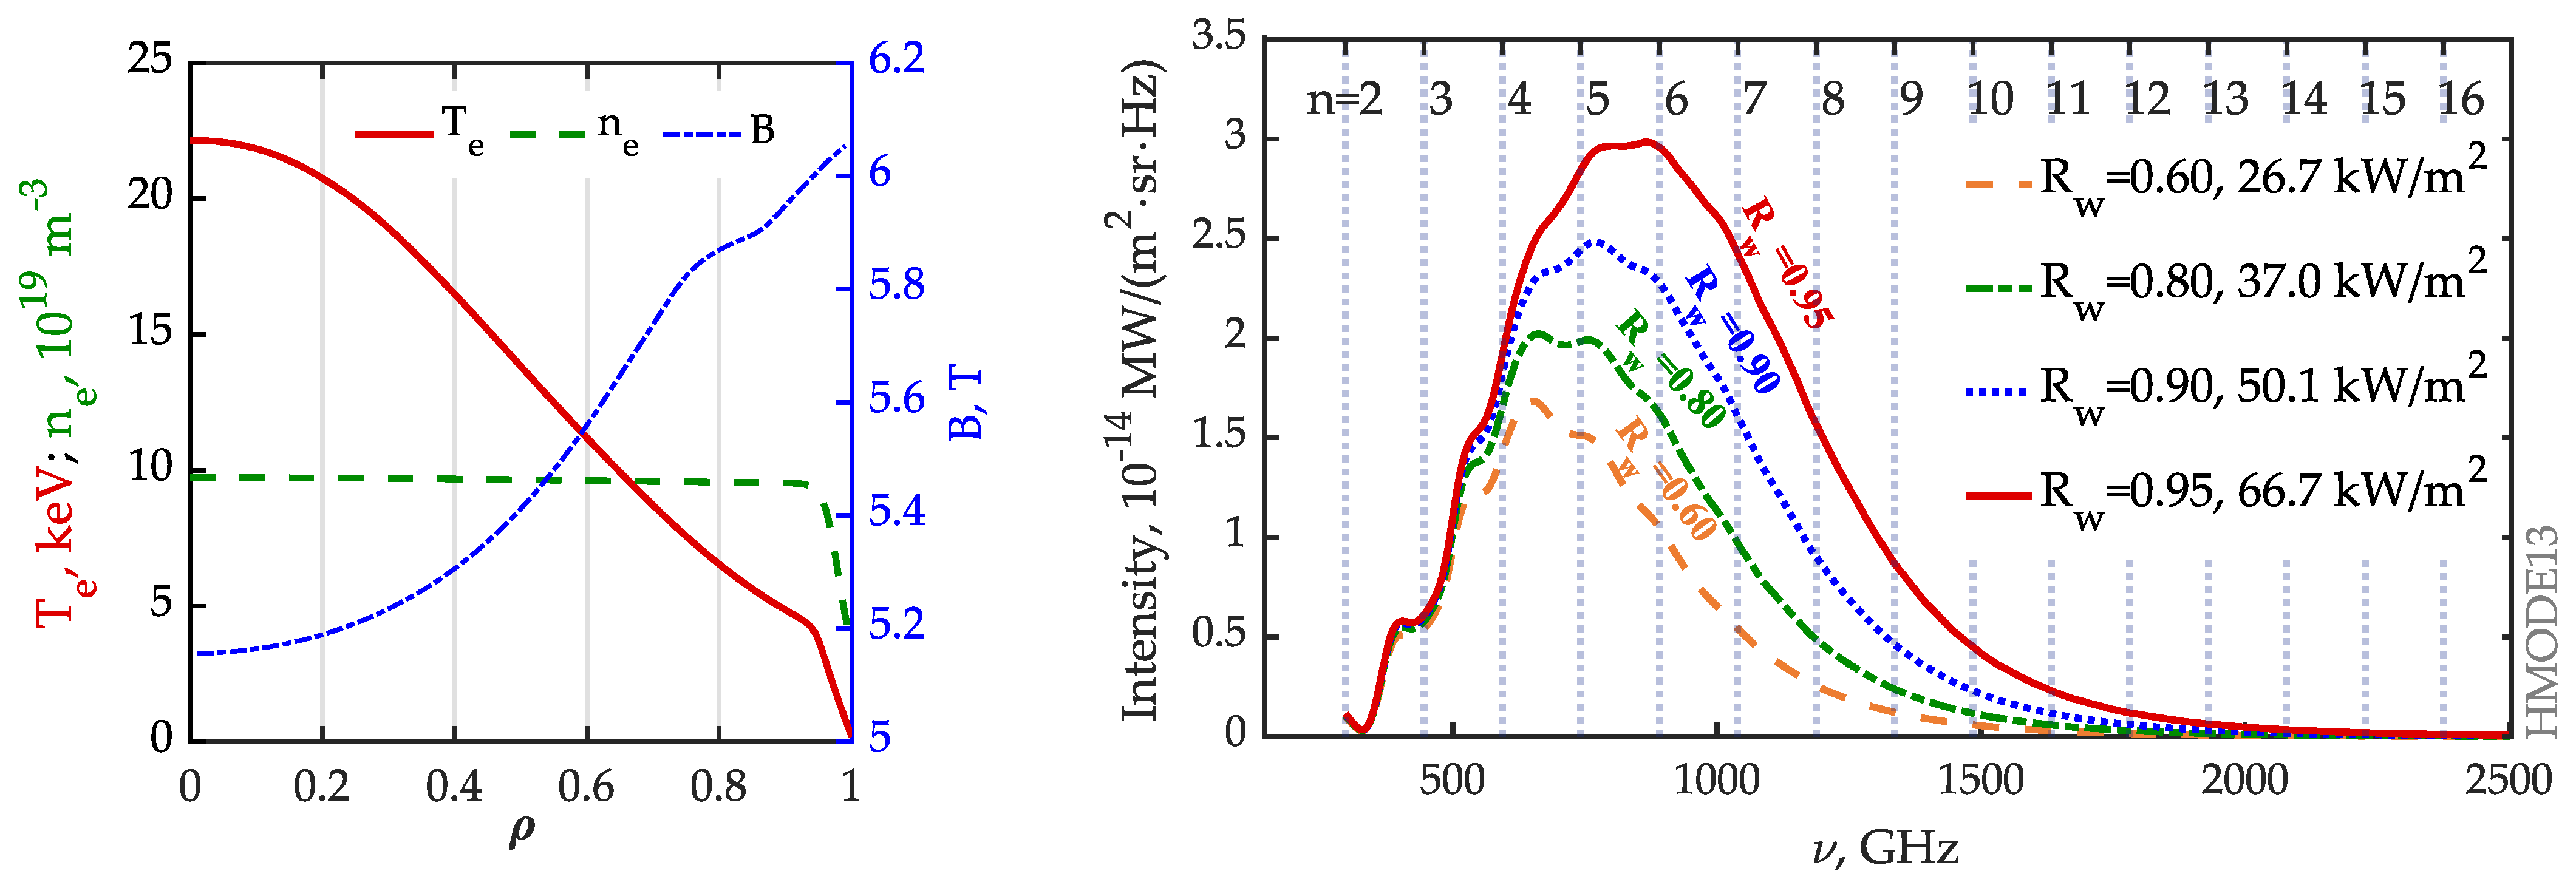
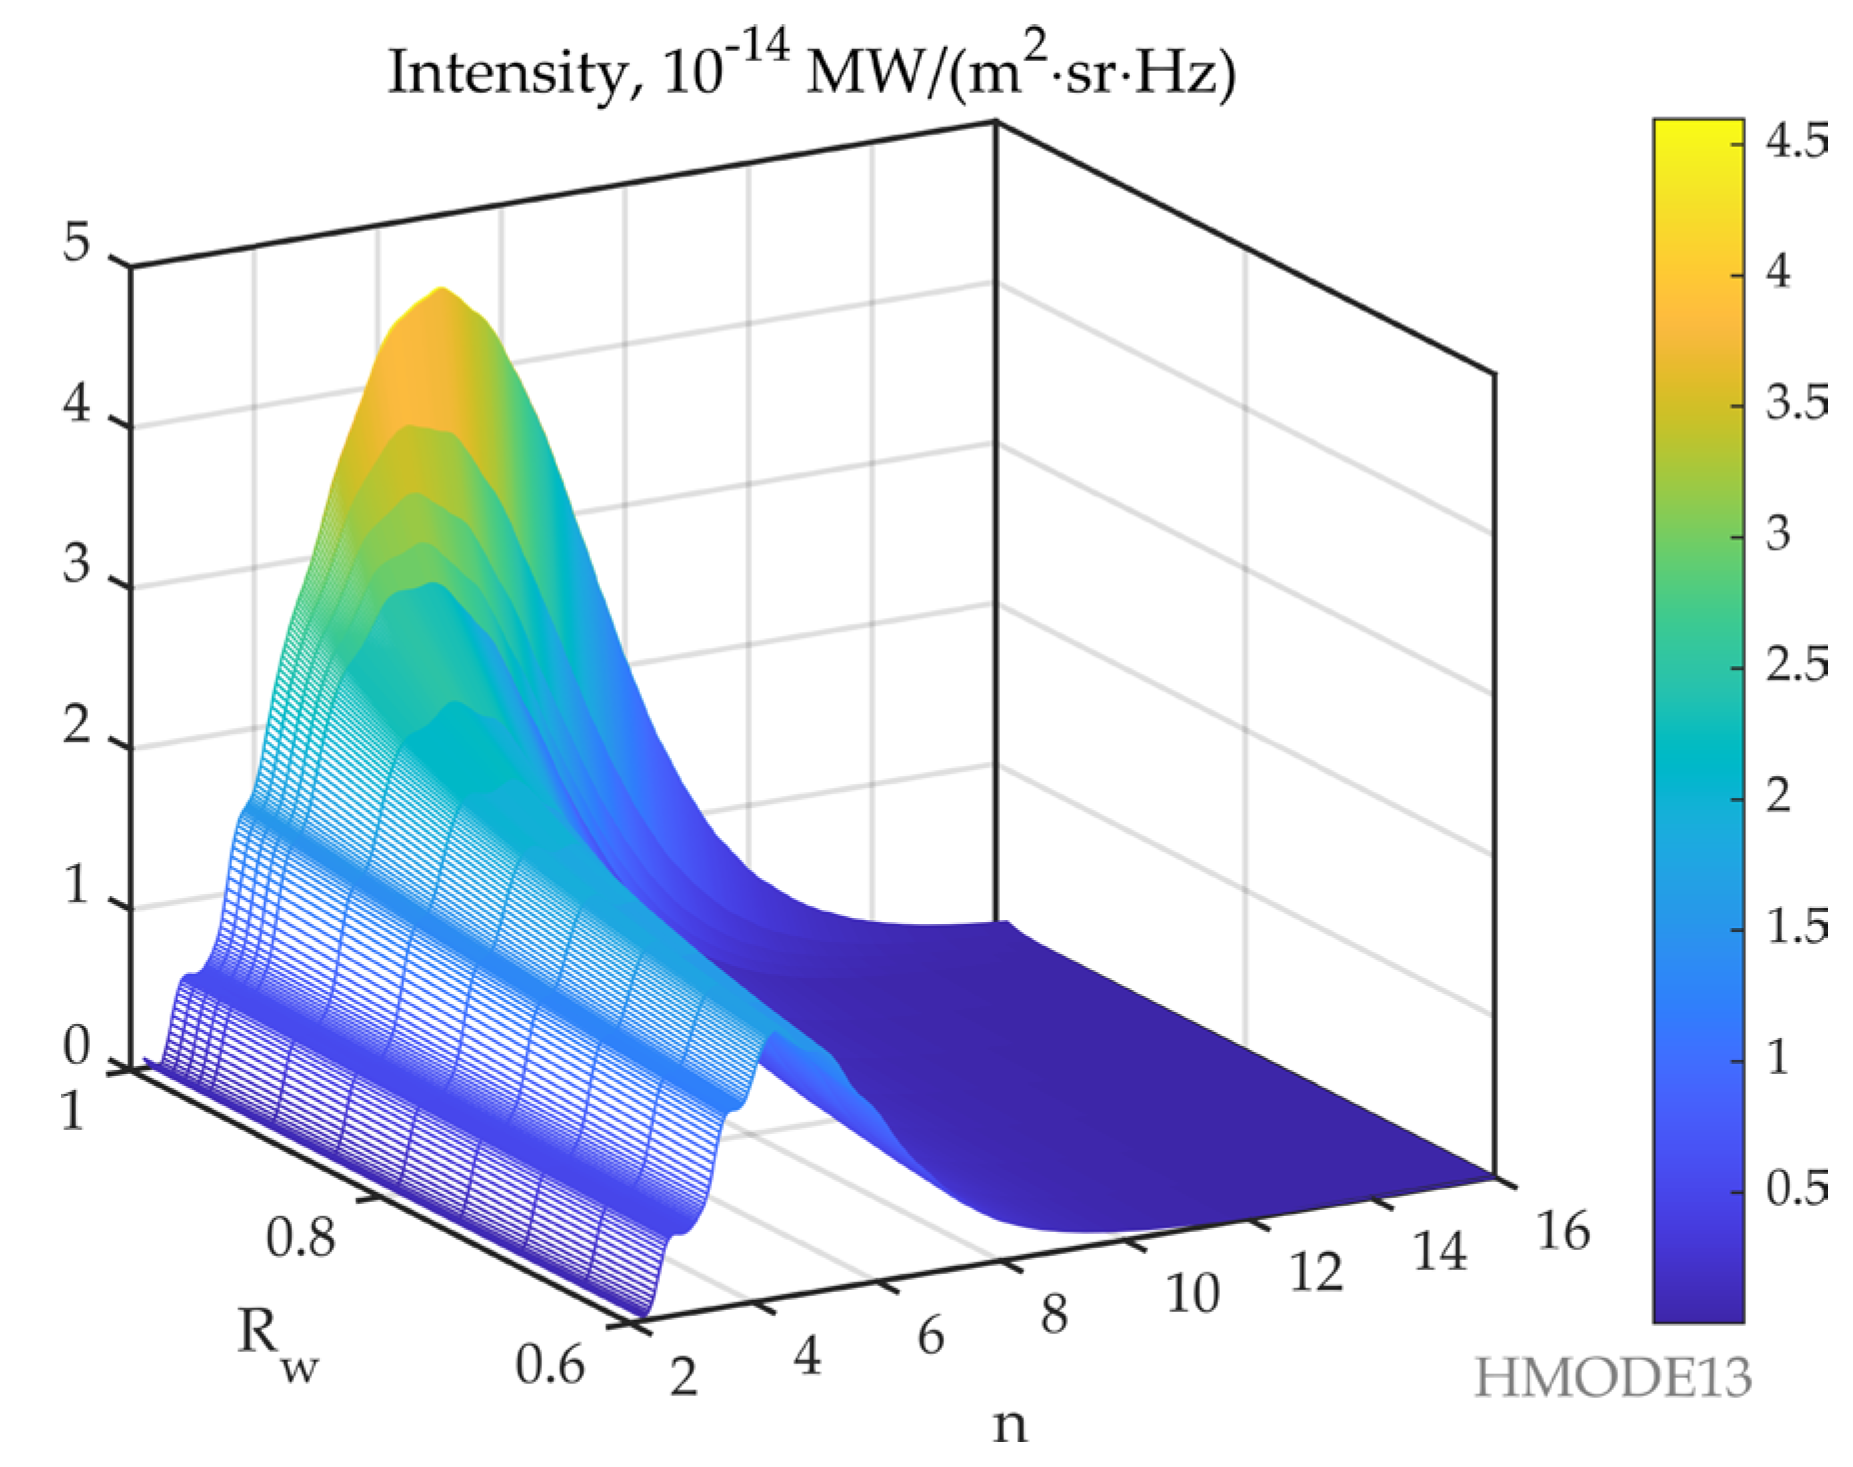
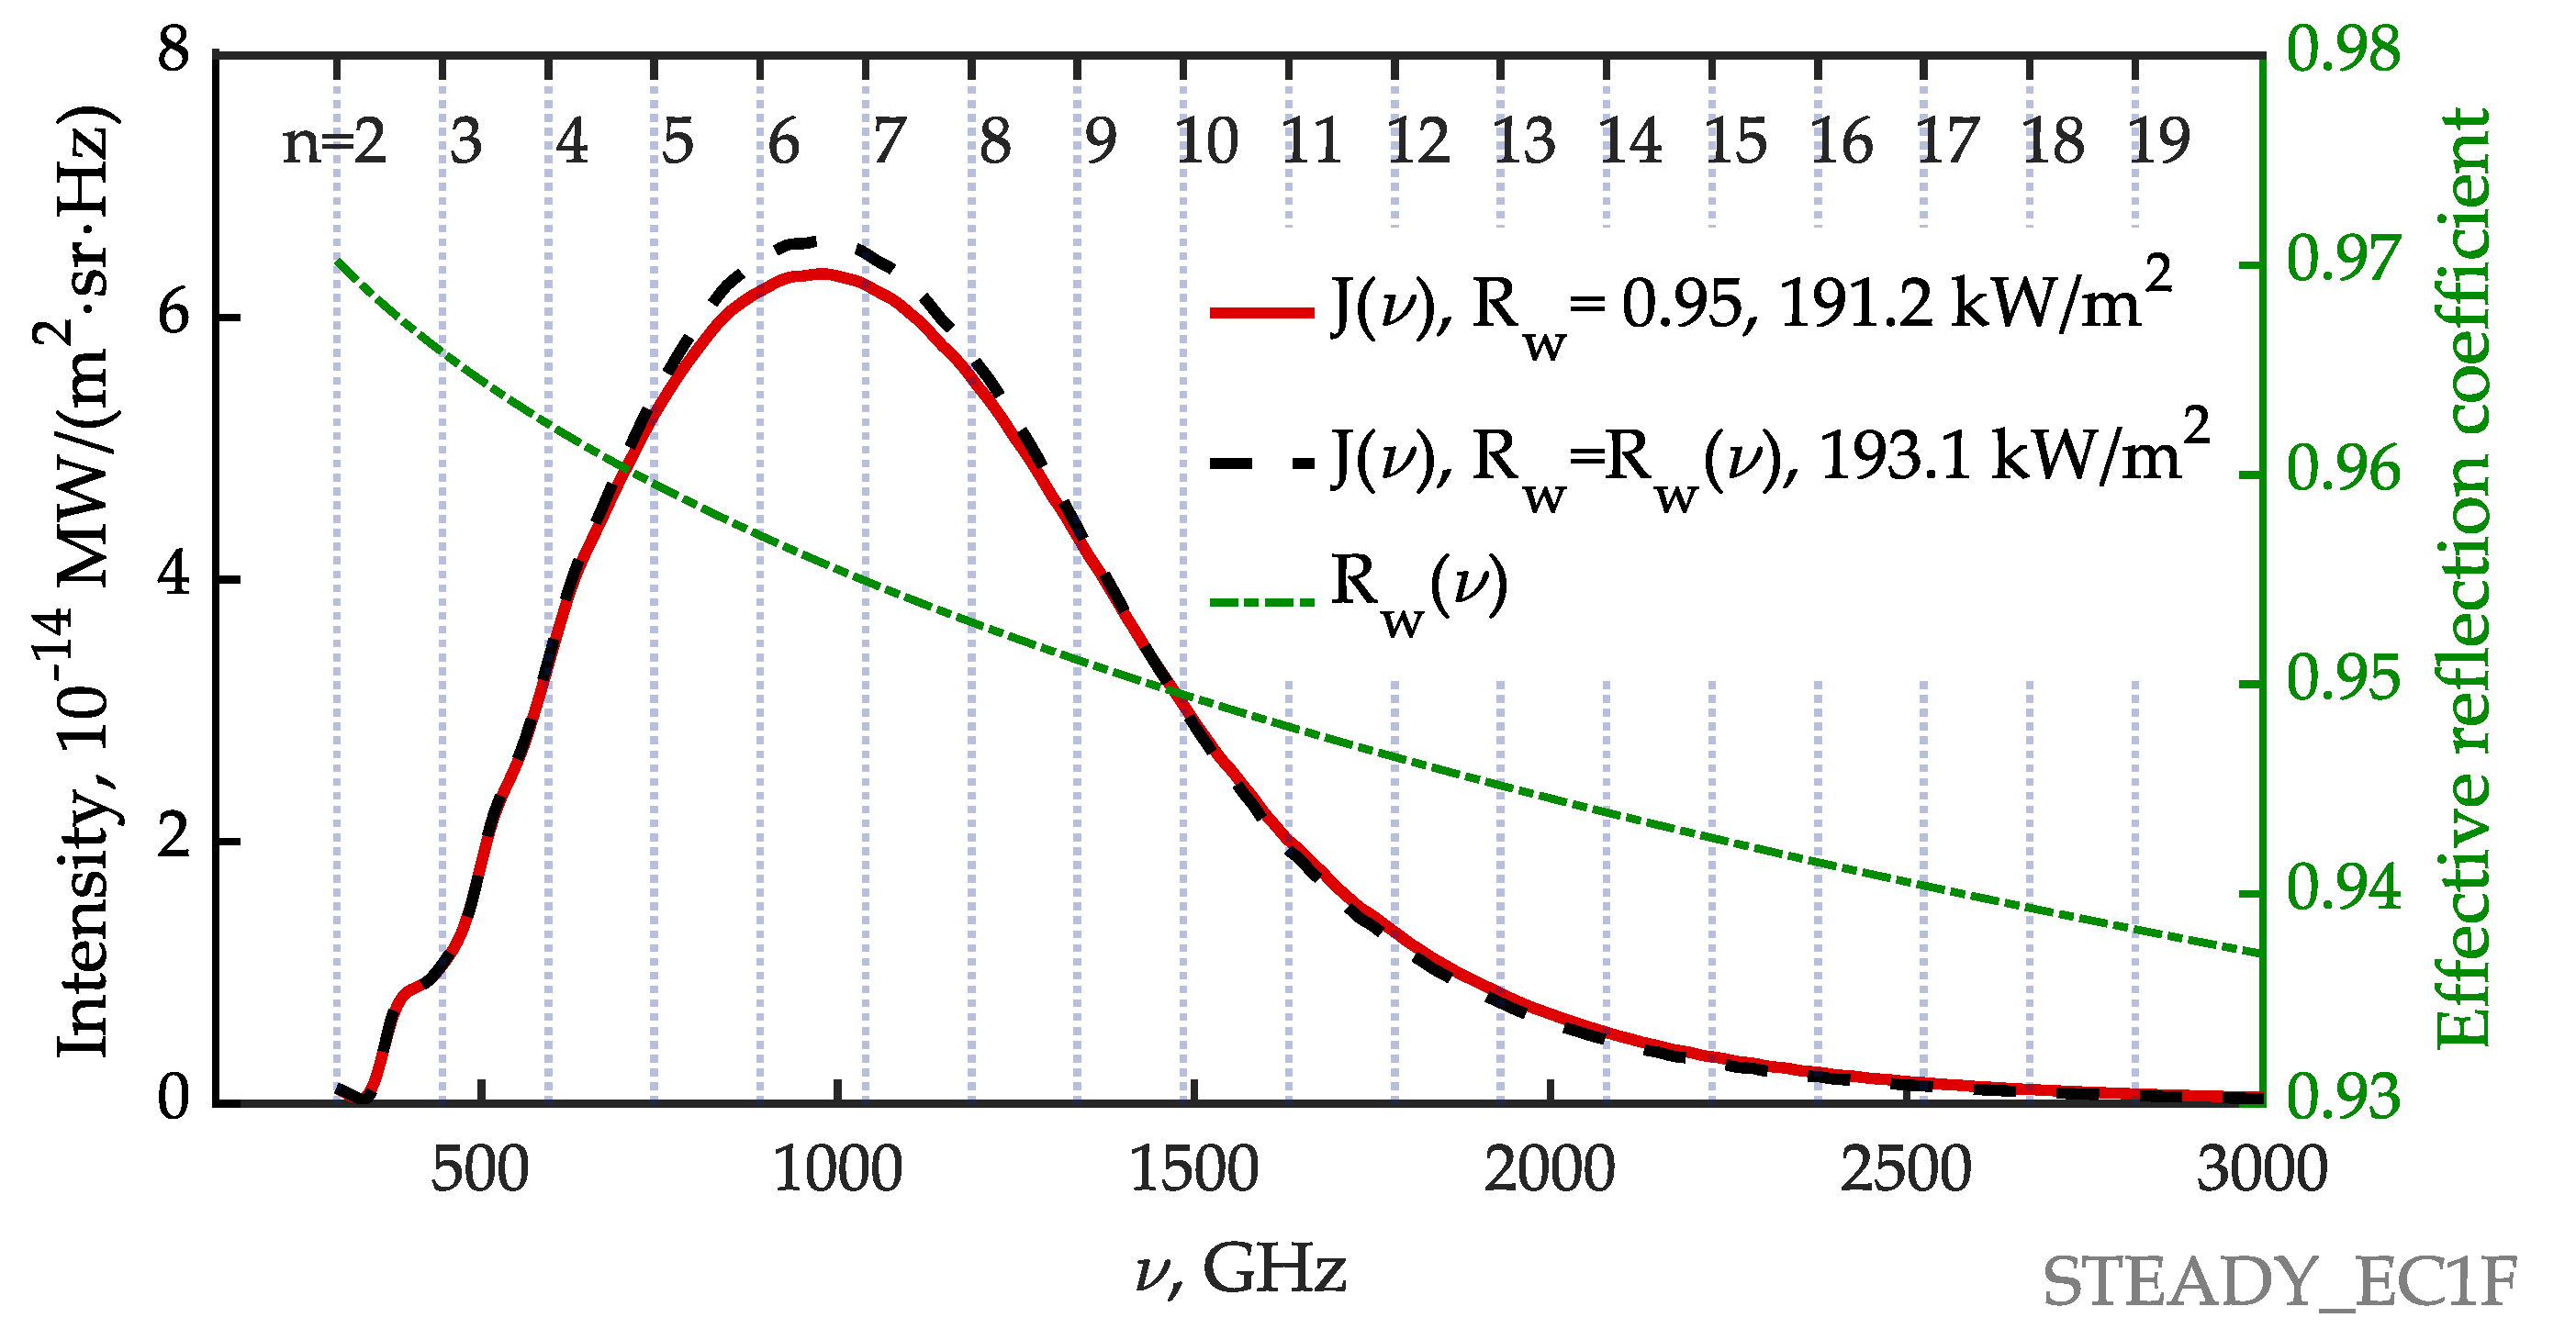
3.3. Spectral Intensity and Energy Flux Density of EC Radiation from Plasma for Moderate and High EC Harmonics

The evolution of the frequency-integrated EC radiation energy flux density for moderate and high harmonics, n ≥ 3, F, emerging from the plasma to the first wall calculated using the CYNEQ code for Rw = 0.9 is shown in Figure 2. We assume that the total surface of the wall of the vacuum chamber, excluding the internal surface of the port plugs and all other internal cavities of the chamber, is S = 876 m2. It can be seen that the energy flux density, F, strongly depends on the electron temperature profile. This behavior is in qualitative agreement with the Trubnikov scaling law for the total (i.e., integrated over the entire frequency range and over the plasma volume) EC radiation power losses from a homogeneous fusion plasma [18,34], which yields the following scaling law for the EC radiation energy flux density (also shown in Figure 2 for comparison with the CYNEQ results):
F n e T e 5 / 2 B 0 5 / 2 a 1 R w ,
where the volume-averaged values of electron temperature and density are used.
Figure 2 shows also the duration of the steady-state (“flat-top”) phase of discharge in ITER, during which the loads from the plasma-generated EC radiation prevail (by orders of magnitude), as was estimated earlier in [3] and will be shown below, over the loads from the scattered radiation from the ECRH/ECCD systems and the duration of the initial stage of discharge, during which the above-mentioned radiation (ECRH/ECCD-produced stray radiation) dominates in radiation loads.
Because the reflection coefficient of EC radiation from the wall of the vacuum chamber in ITER is not specified in the ITER database, it is reasonable to conduct an analysis with a variation in the reflection coefficient in a certain range of values. The predicted value of the effective reflection coefficient of the ITER vacuum chamber is very high Rw ≈ 0.95 (even taking into account the port plugs, the space under the divertor and the cryopumps) and is a rather weak function of the frequency of the EC wave [4] (see Figure 7 therein) but in reality, this value could be lower due to surface roughness.
Figure 3, Figure 4, Figure 5, Figure 6 and Figure 7 show the calculations of the spectral intensity emerging from the plasma to the first wall, J, for all considered scenarios at fixed values of the reflection coefficient of the EC wave from the vacuum chamber wall, Rw = [0.6, 0.8, 0.9, 0.95]. Figure 8 shows J as a function of EC cyclotron harmonic number, n, and wall reflection coefficient, Rw, in the scenario of ITER operation with improved confinement (scenario No. 1 in Table 1, HMODE13).
The neglect of the weak spectral dependence of the reflection coefficient on radiation from the wall is justified by the fact that, taking into account such a dependence in the most sensitive case, namely the largest reflection coefficient Rw = 0.95, yields a difference in the results of no more than 1% (Figure 9).
For practical purposes, it is worth obtaining the following approximate formulas for the normalized EC radiation energy flux density and normalized frequency, ν*, at which the EC radiation intensity (1), emerging from the plasma, is at a maximum. These formulas are obtained from a parametric analysis of the results of our calculations (with RMSE equal to 8% and 4%, respectively):
F ^ = F ( R w ) F ( R w = 0.8 ) 0.51 ( 1 R w ) 0.43
ν ^ = ν * ( R w ) ν * ( R w = 0.8 ) 0.83 ( 1 R w ) 0.13
The EC radiation energy flux density emerging from the plasma to the wall as a function of Rw and the scaling law for its normalized value for all considered scenarios are shown in Figure 10. Frequencies corresponding to the maximum EC radiation intensity as a function of Rw and the scaling law for the normalized frequency are shown in Figure 11.

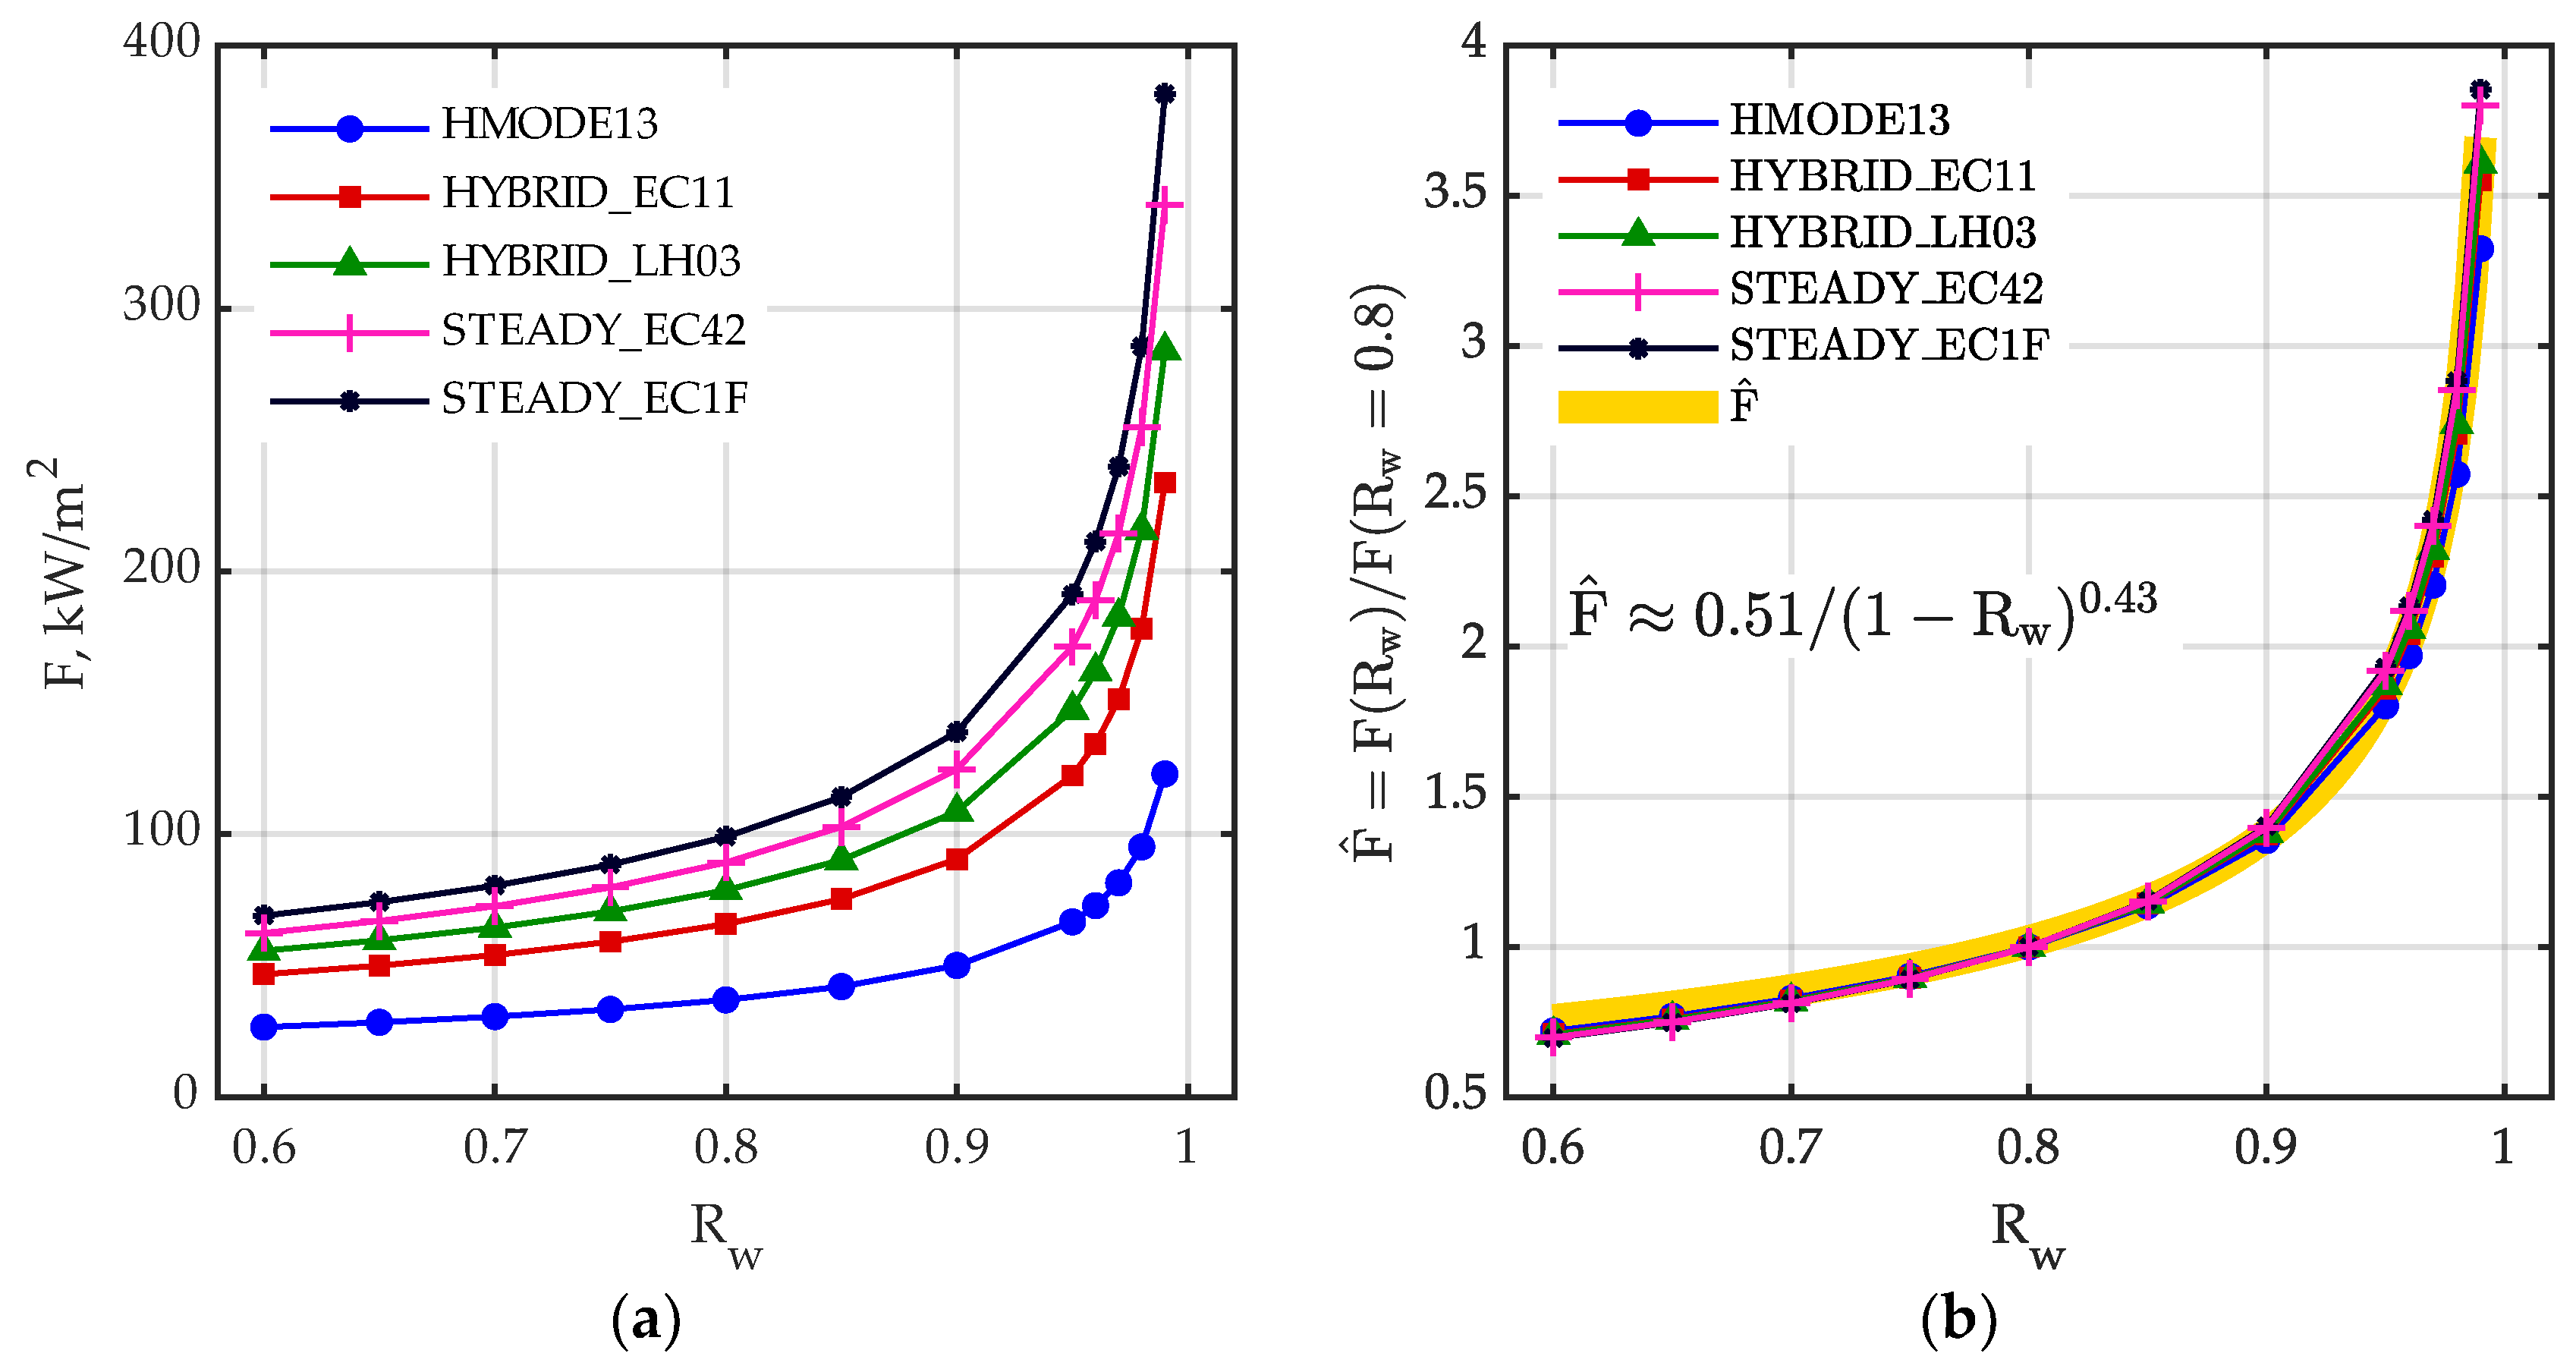
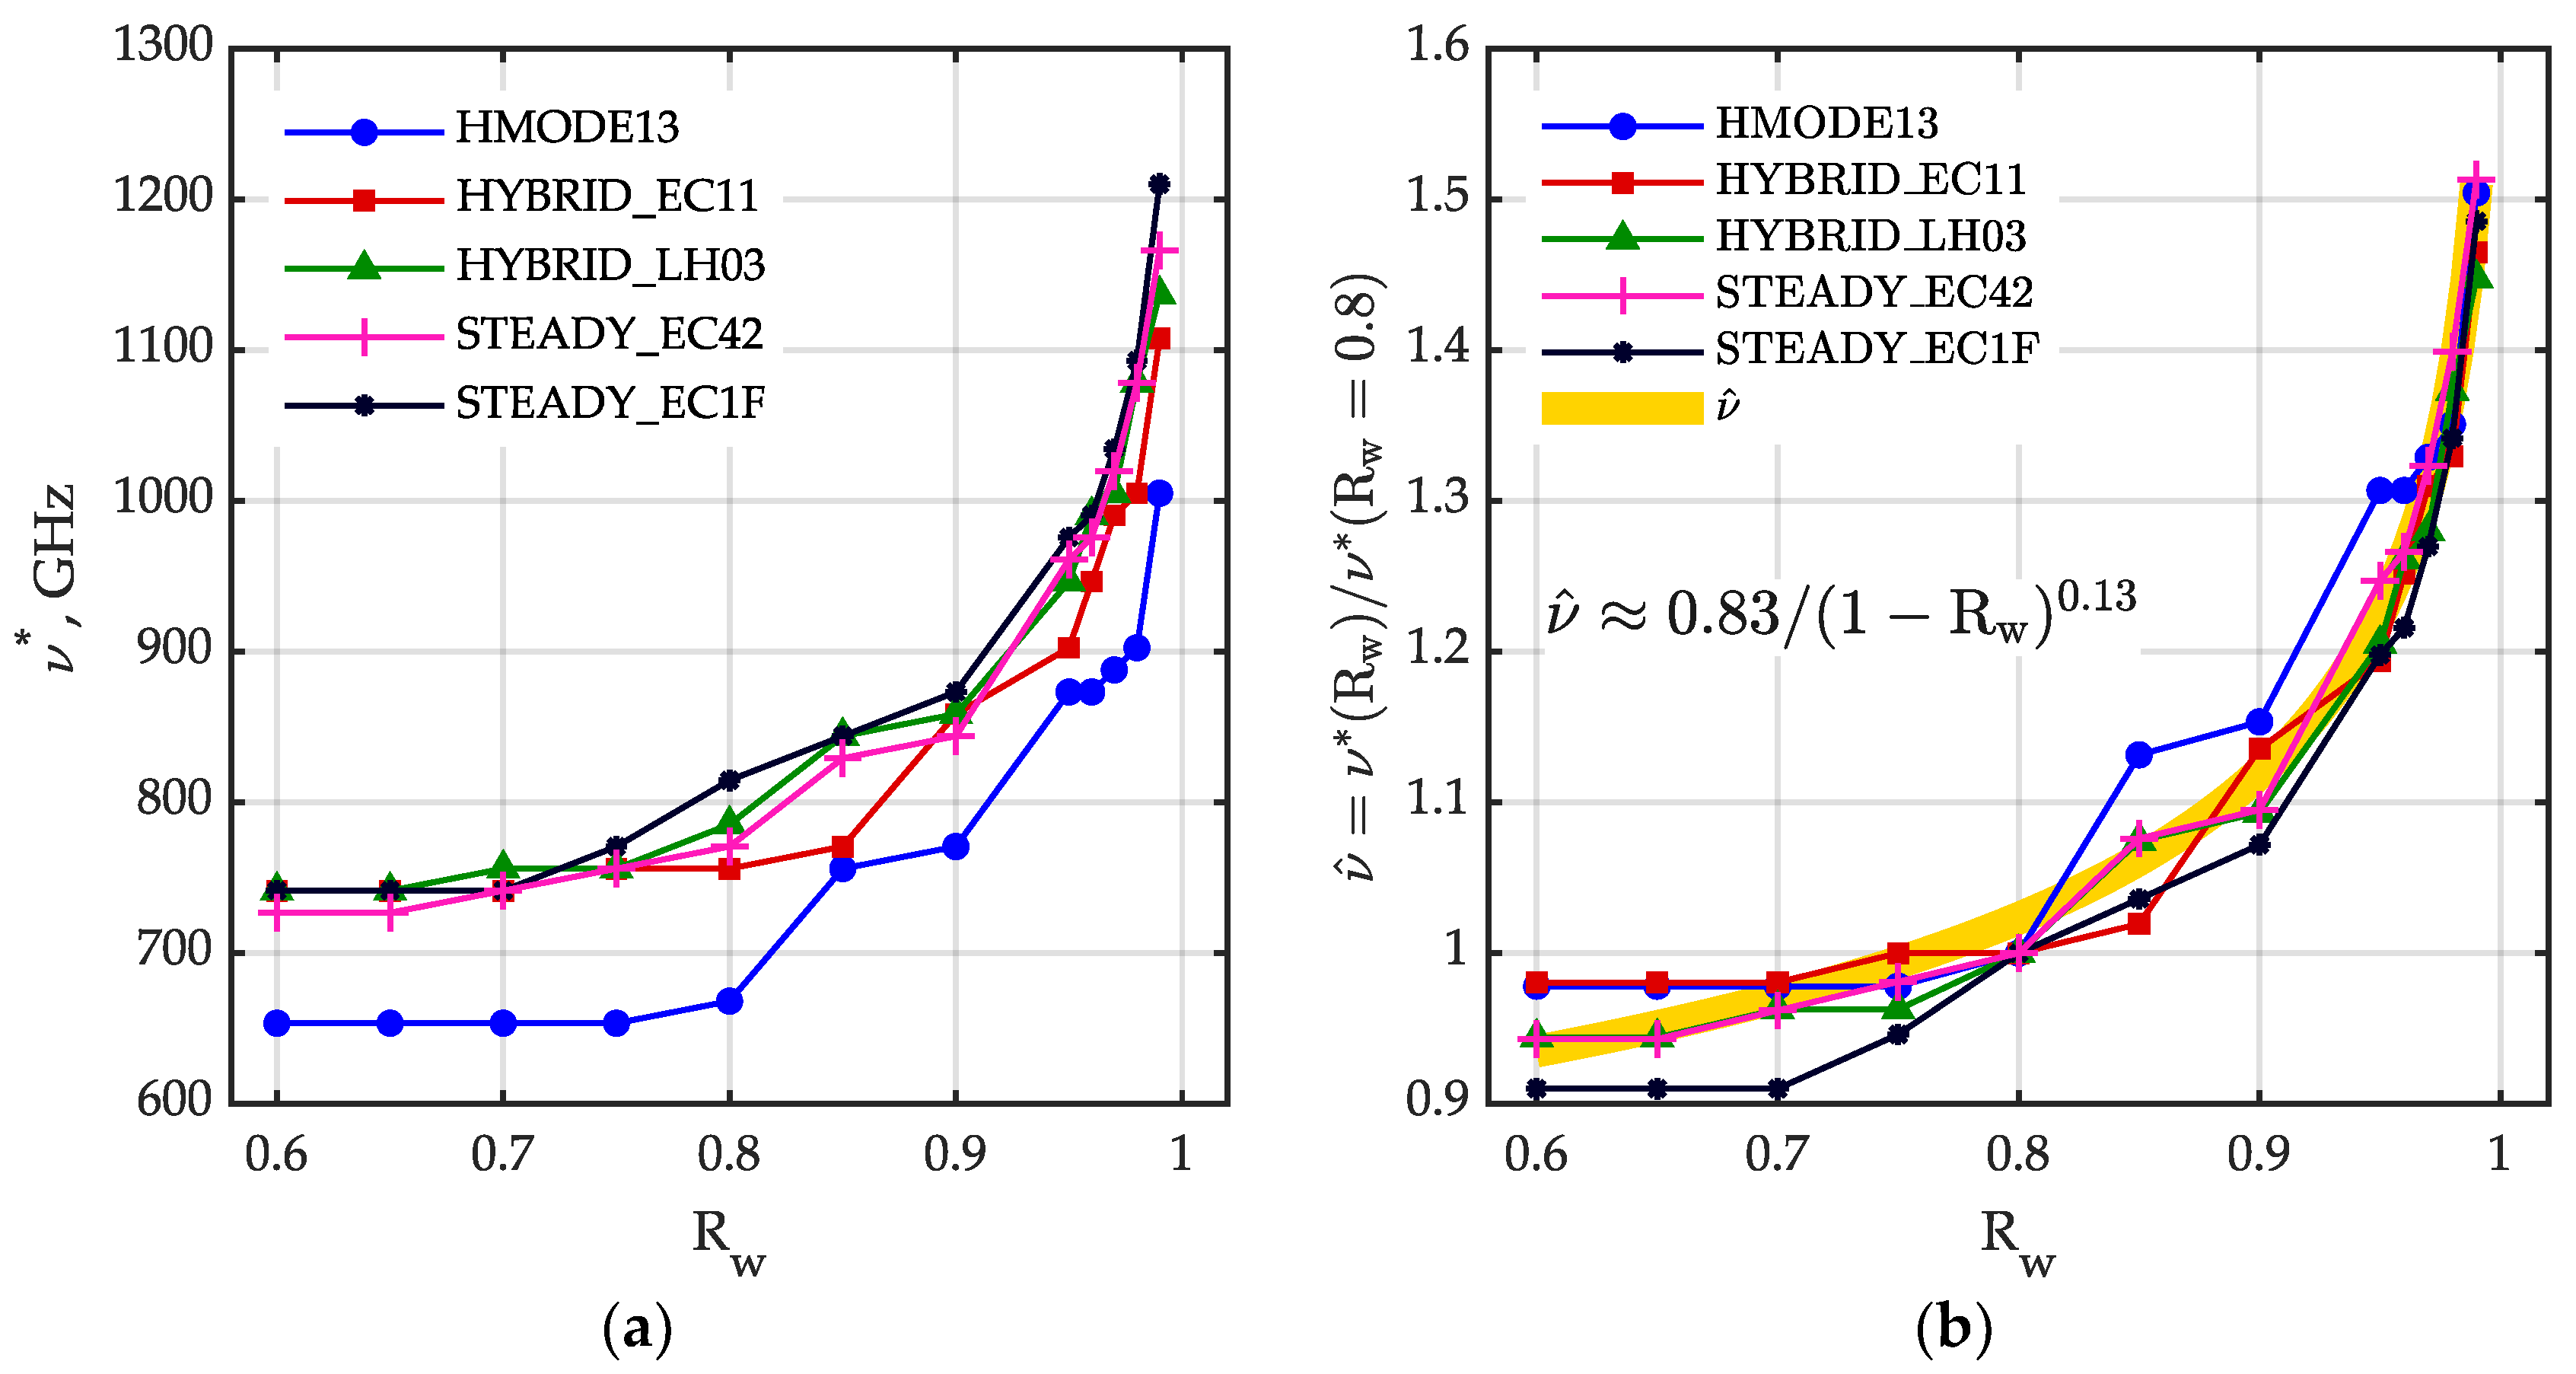
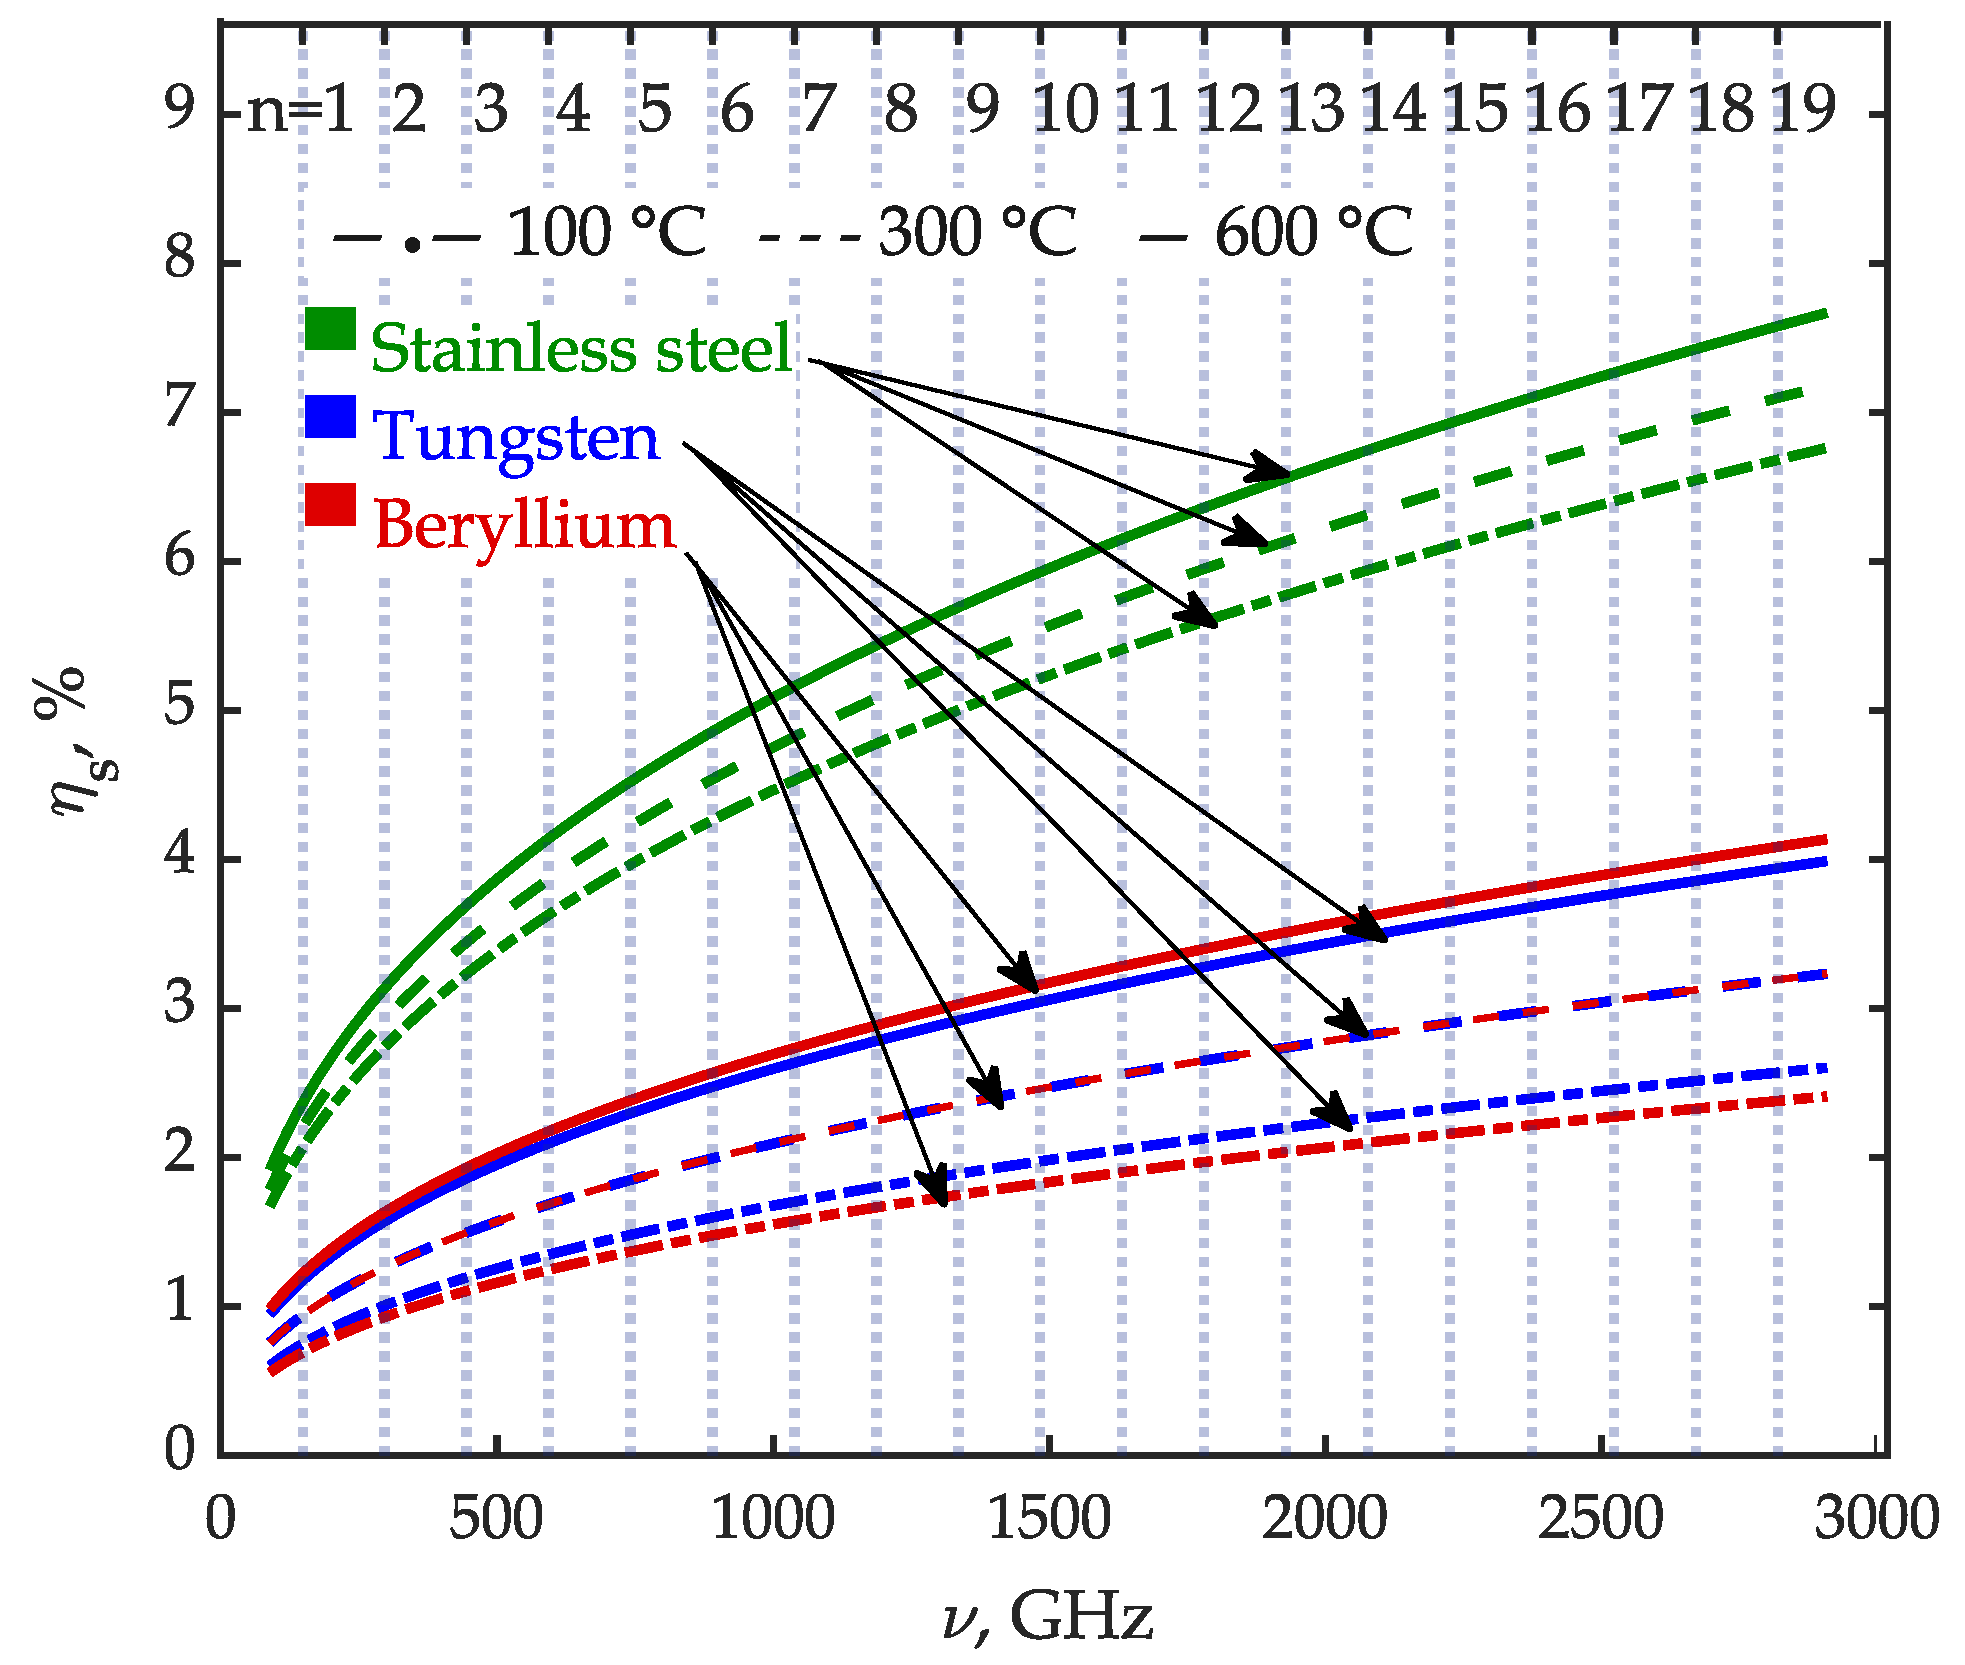
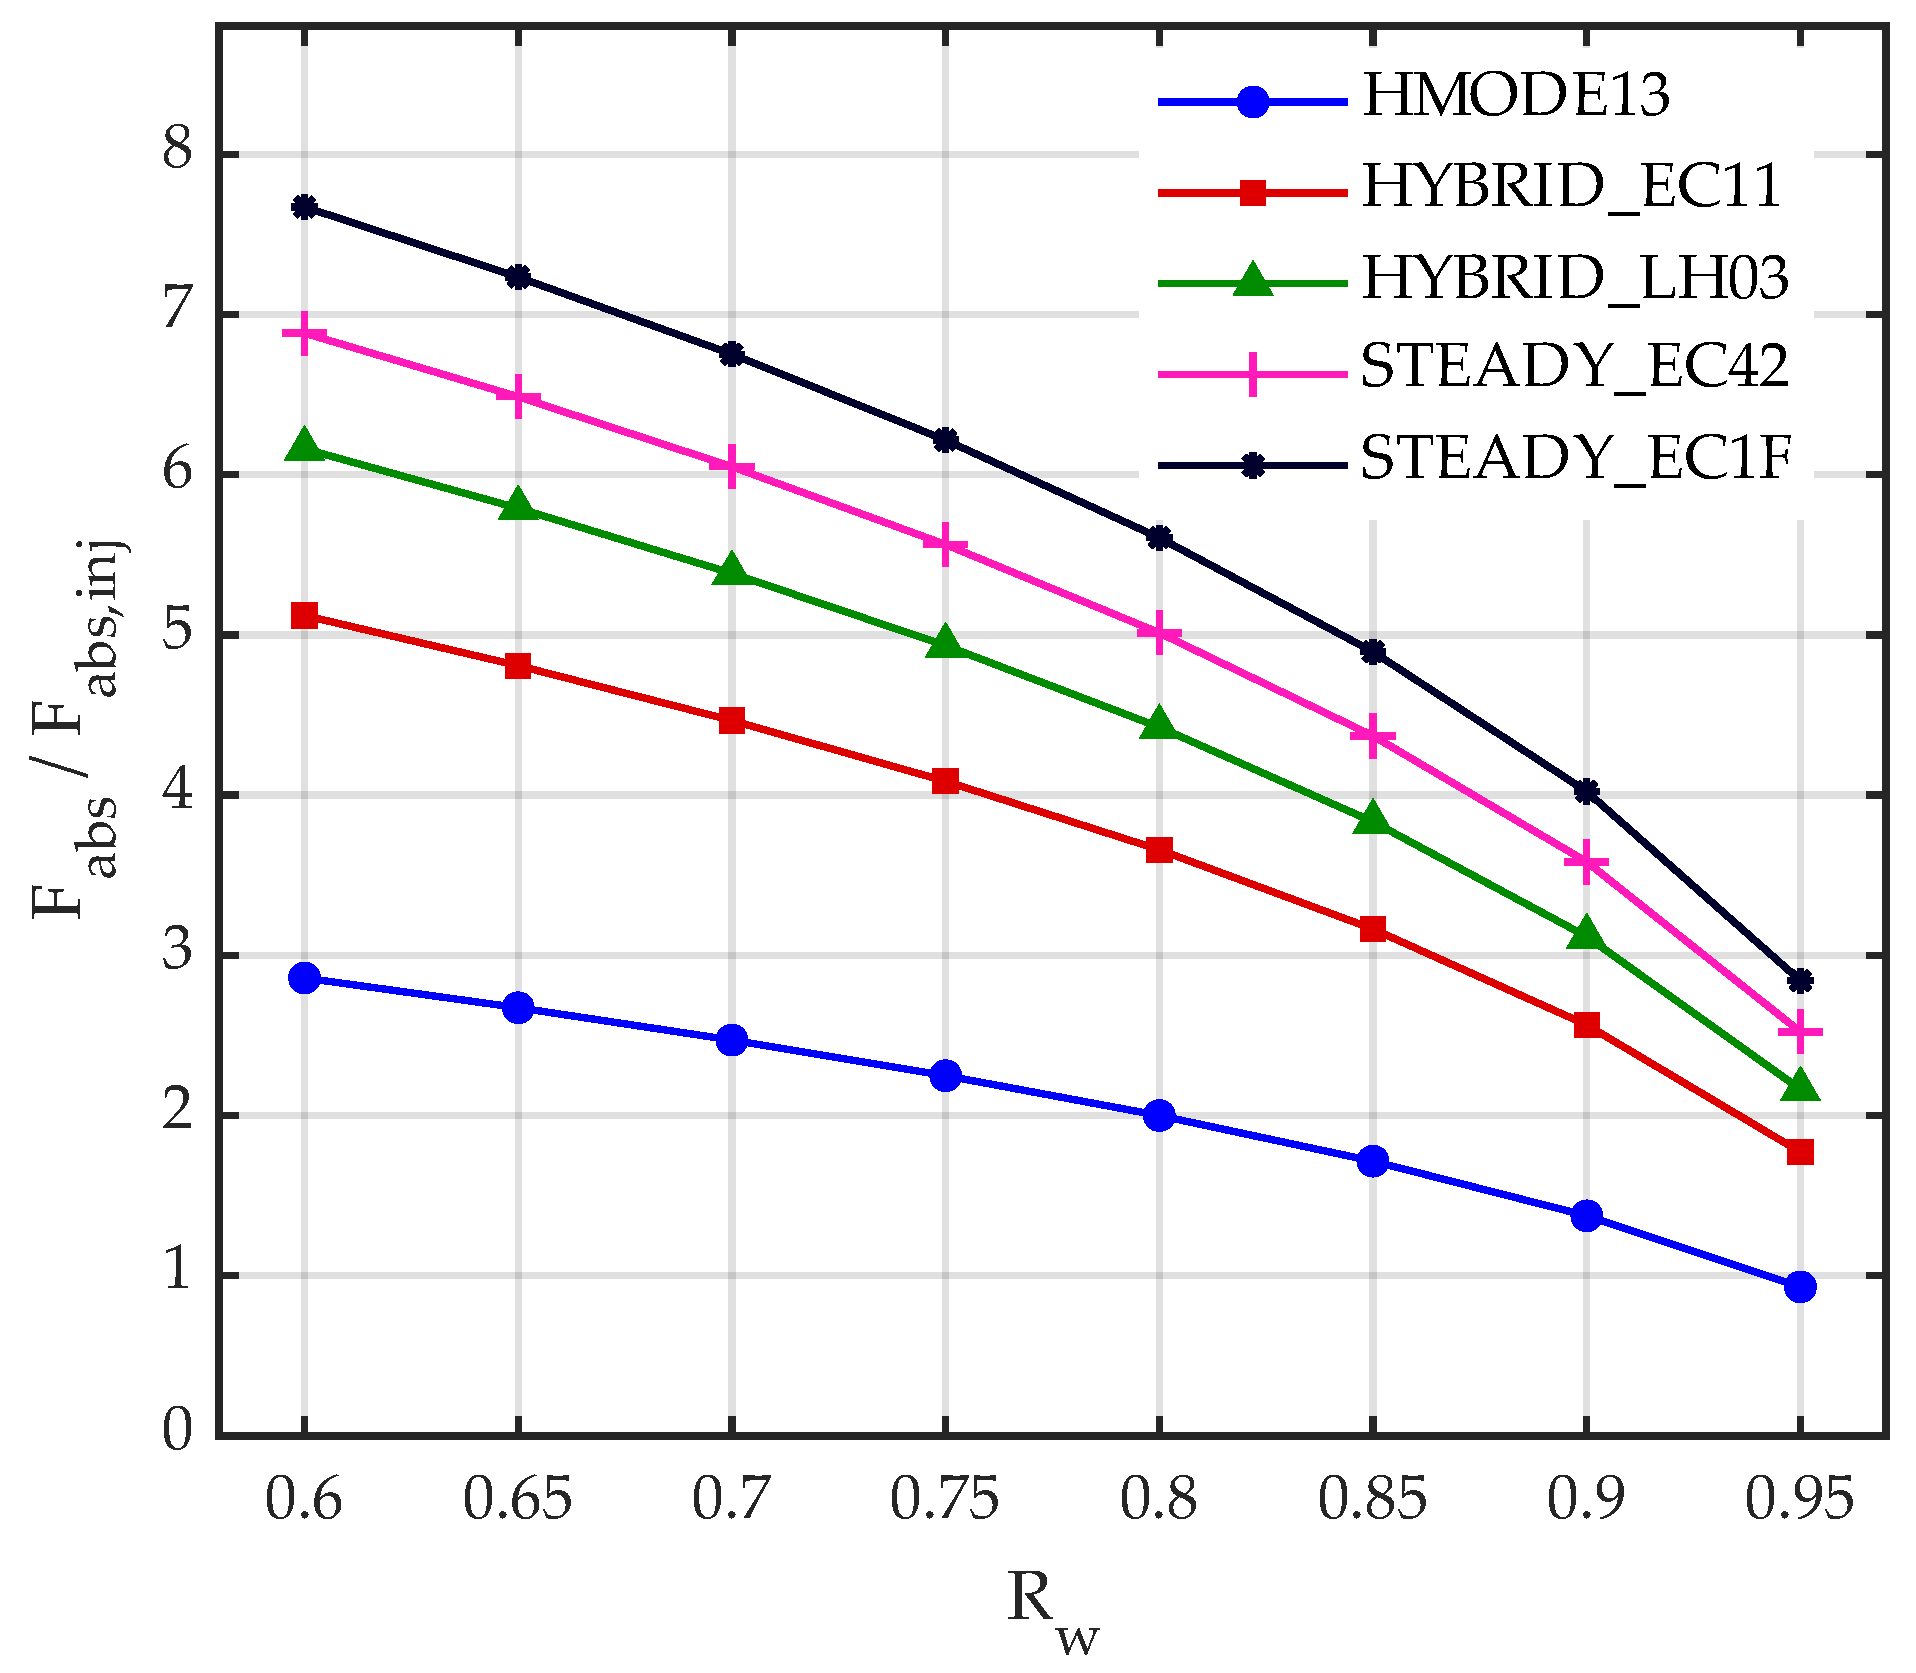
3.4. Comparison of Energy Flux Density and Thermal Loads for Plasma-Generated EC Radiation and Stray Radiation Produced by ECRH/ECCD

The characteristics of the plasma-generated EC radiation intensity and energy flux density, which were calculated with the algorithm described in Section 2, in all considered scenarios and the ECRH/ECCD-produced stray radiation energy flux density, which were calculated using Equation (6), are summarized in Table 2 and Table 3, respectively.
From the data in Table 2, it can be understood that the contribution to the energy flux density from moderate and high harmonics of the fundamental EC frequency significantly exceeds the contribution from low harmonics.
The calculations presented in Table 3 show the results for the worst case, when the conversion of the injected (and not absorbed by plasma) radiation into stray radiation is not suppressed with the help of special absorbers in the first wall. It should also be noted that, for the start-up phase of discharge in ITER, an injection of 5.87 MW of ECRH from the upper launcher is currently considered; for later phases, 6.7 MW will be injected from the equatorial launcher. In our estimations using Equation (6) for stray radiation, this difference in the total injected power of the ECRH yields a 12% difference in the estimate of the energy flux density shown in Table 3.
It is important to note that, as shown in [4], the lower the quality factor of the resonators (i.e., the lower the value of the reflection coefficient of the walls), the greater the variation in the fluxes of stray radiation in the vessel (see Figure 3 in [4]). Thus, for the real design of diagnostics, taking into account the possible deterioration of the reflectivity of the walls, it is necessary to use the results of modeling [4] of the ECRH/ECCD-produced stray radiation.
For the estimation of the thermal loads on various internal chamber elements caused by the absorption of plasma-generated EC radiation and of ECRH/ECCD-produced stray radiation, we calculated the absorption coefficient of EM waves for metal surface (using Fresnel equations), averaged over polarizations and incidence angles, for three materials (stainless steel, tungsten, beryllium) at different wall temperatures (for detailed description of this approach, see Section 5.8.5 in [35] and Equations (2)–(10) in [4]). Data on the electrical resistivity of tungsten and beryllium are taken from the table in Section 12–42 in [36], and data on the resistivity of stainless steel (type 316L(N)-IG) are taken from Table 2 in [37]. The material absorption coefficients as a function of frequency for isotropic stray radiation are shown in Figure 12. For the considered wall temperatures (100–300 °C for the start-up stage of discharge and 600 °C for the flat-top stage of discharge), the values of the absorption coefficient, ηs, for beryllium and tungsten are very close, while the absorption coefficient for stainless steel is approximately twice as high. Calculations of the absorbed energy density of plasma-generated EC radiation, Fabs, in the considered scenarios of ITER operation and of the stray radiation from ECRH/ECCD systems, Fabs,inj, at the start-up stage of the discharge in ITER are presented in Table 4 and Table 5 for stainless steel and tungsten materials. Fabs and Fabs,inj values of stainless steel are approximately twice as large as those of tungsten. The ratio of Fabs and Fabs,inj for stainless steel material is shown in Figure 13 for five scenarios of ITER operation.

4. Discussion and Conclusions

Here, we present calculations using the CYNEQ code of the spectral intensity of the EC radiation emerging from the plasma to the first wall and port plugs for five scenarios of ITER operation, which cover a wide range of basic plasma parameters. This code uses the symmetry-based effect of approximate isotropy and the homogeneity of radiation intensity in a substantial part of the phase space and has been successfully tested by comparison with first-principles codes. A detailed analysis of the spectral and frequency-integrated characteristics of the outgoing EC radiation made it possible to find the spectral range of the maximum power of this radiation and to estimate the role of radiation at low harmonics of EC frequency. It is shown that, for all considered ITER operation scenarios, the main contribution to the energy flux density of EC radiation emerging from the plasma to the first wall is made by moderate and higher harmonics of fundamental EC frequency with harmonic number n > 3. The energy flux density in the range of 30–200 kW/m2 for the wall reflection coefficient in the range of 0.6–0.95 is predicted.
An approximate formula is proposed which, with an accuracy of 10%, describes the dependence of normalized energy flux density of the plasma-generated EC radiation on the surface-averaged reflection coefficient, Rw, of EC waves from the walls of the vacuum chamber (averaging of Rw over the surface of the first wall assumes that the radiation exits only through the port plugs).
The possible effect of this radiation on in-vessel components and diagnostics is assessed by calculating the surface density of the energy absorbed by various materials of the ITER first wall. The calculations performed for the maximum possible values of the reflection coefficient show the relevance of a detailed study of the possible effect of the EC radiation of the plasma in ITER on the in-chamber elements of various diagnostics and its effect in the areas behind the blankets and in the port plugs. The presented results can be used as a boundary condition for the problem of the propagation and absorption of EM radiation in port plugs and various diagnostic elements, including, first of all, all microwave diagnostics and all other diagnostics, which, unlike the first wall, are subject to outgoing EC radiation and do not have intensive cooling.

Author Contributions

The authors equally contributed to this work. All authors have read and agreed to the published version of the manuscript.

Funding

This research received no external funding.

Institutional Review Board Statement

Not applicable.

Informed Consent Statement

Not applicable.

Data Availability Statement

Not applicable.

Acknowledgments

The authors are grateful to D.A. Shelukhin and V.A. Vershkov for formulating the task of calculating the intensity of outgoing plasma-generated EC radiation for ITER diagnostics purposes and helpful discussions, Sun Hee Kim, for providing the data of ITER scenario simulations, S.V. Mirnov, for helpful comments.

Conflicts of Interest

The authors declare no conflict of interest.

References

  1. Albajar, F.; Bornatici, M.; Cortes, G.; Dies, J.; Engelmann, F.; Garcia, J.; Izquierdo, J. Importance of electron cyclotron wave energy transport in ITER. Nucl. Fusion 2005, 45, 642–648. [Google Scholar] [CrossRef]
  2. Kukushkin, A.B.; Minashin, P.V.; Polevoi, A.R. Impact of magnetic field inhomogeneity on electron cyclotron radiative loss in tokamak reactors. Plasma Phys. Rep. 2012, 38, 211–220. [Google Scholar] [CrossRef]
  3. Oosterbeek, J.W.; Udintsev, V.S.; Gandini, F.; Hirsch, M.; Laqua, H.P.; Maassen, N.; Ma, Y.; Polevoi, A.; Sirinelli, A.; Vayakis, G.; et al. Loads due to stray microwave radiation in ITER. Fusion Eng. Des. 2015, 96–97, 553–556. [Google Scholar] [CrossRef]
  4. Moseev, D.; Oosterbeek, J.W.; Sirinelli, A.; Corre, Y.; Houry, M.; Korsholm, S.B.; Laqua, H.P.; Marsen, S.; Preynas, M.; Rasmussen, J.; et al. Stray radiation energy fluxes in ITER based on a multiresonator model. Fusion Eng. Des. 2021, 172, 112754. [Google Scholar] [CrossRef]
  5. Udintsev, V.S.; Vayakis, G.; Bora, D.; Direz, M.F.; Encheva, A.; Giacomin, T.; Henderson, M.A.; Patel, K.M.; Portalès, M.; Prakash, A.; et al. Extending the physics studied by ECE on ITER. EPJ Web Conf. 2012, 32, 03013. [Google Scholar] [CrossRef] [Green Version]
  6. Kukushkin, A.B. Heat transport by cyclotron waves in plasmas with strong magnetic field and highly reflecting walls. In Proceedings of the 14th IAEA Conference on Plasma Physics and Controlled Nuclear Fusion Research, Wuerzburg, Germany, 30 September–7 October 1992; pp. 35–45. Available online: http://www-naweb.iaea.org/napc/physics/FEC/STIPUB906_VOL2.pdf (accessed on 3 November 2022).
  7. Kukushkin, A.B.; Minashin, P.V. Influence of magnetic field inhomogeneity on electron cyclotron power losses in magnetic fusion reactor. In Proceedings of the 36th EPS Conference on Plasma Physics, Sofia, Bulgaria, 30 June–3 July 2009; p. P–4.136. Available online: http://ocs.ciemat.es/EPS2009/pdf/P4_136.pdf (accessed on 3 November 2022).
  8. Minashin, P.V.; Kukushkin, A.B. Spectral intensity of electron cyclotron radiation coming out of plasma in various regimes of ITER operation. In Proceedings of the 46th EPS Conference on Plasma Physics, Milan, Italy, 8–12 July 2019; p. P2.1010. Available online: http://ocs.ciemat.es/EPS2019PAP/pdf/P2.1010.pdf (accessed on 3 November 2022).
  9. Minashin, P.V.; Kukushkin, A.B. Spectral intensity of electron cyclotron radiation emerging from the plasma to the first wall in tokamak-reactors. Probl. At. Sci. Technol. Ser. Thermonucl. Fusion 2019, 42, 14–20. [Google Scholar] [CrossRef]
  10. Crotinger, J.A.; LoDestro, L.; Pearlstein, L.D.; Tarditi, A.; Casper, T.A.; Hooper, E.B. CORSICA: A Comprehensive Simulation of Toroidal Magnetic-Fusion Devices. Final Report to the LDRD PROGRAM; UCRL-ID-126284, ON: DE97053433; Lawrence Livermore National Lab.: Livermore, CA, USA, 1997. Available online: https://www.osti.gov/servlets/purl/522508 (accessed on 3 November 2022).
  11. Pereverzev, G.V.; Yushmanov, P.N. ASTRA—Automated System for Transport Analysis in a Tokamak; IPP 5/98; Max-Planck-Institut für Plasmaphysik: Garching, Germany, 2002; Available online: http://hdl.handle.net/11858/00-001M-0000-0027-4510-D (accessed on 3 November 2022).
  12. Artaud, J.F.; Basiuk, V.; Imbeaux, F.; Schneider, M.; Garcia, J.; Giruzzi, G.; Huynh, P.; Aniel, T.; Albajar, F.; Ané, J.M.; et al. The CRONOS suite of codes for integrated tokamak modelling. Nucl. Fusion 2010, 50, 043001. [Google Scholar] [CrossRef]
  13. Kukushkin, A.B.; Minashin, P.V. Self-Similarity of Continuous-Spectrum Radiative Transfer in Plasmas with Highly Reflecting Walls. Symmetry 2021, 13, 1303. [Google Scholar] [CrossRef]
  14. Tamor, S. SNECTR, a Cyclotron Radiation Transport Code: Current Status; SAI-76-773LJ; Science Applications, Inc.: La Jolla, CA, USA, 1976. [Google Scholar]
  15. Tamor, S. Calculation of energy transport by cyclotron radiation in fusion plasmas. Nucl. Technol. Fusion 1983, 3, 293–303. [Google Scholar] [CrossRef]
  16. Albajar, F.; Bornatici, M.; Engelmann, F.; Kukushkin, A.B. Benchmarking of codes for calculating local net EC power losses in fusion plasmas. Fusion Sci. Technol. 2009, 55, 76–83. [Google Scholar] [CrossRef]
  17. Kukushkin, A.B.; Minashin, P.V. Benchmarking of Codes for Spatial Profiles of Electron Cyclotron Losses with Account of Plasma Equilibrium in Tokamak Reactors. In Proceedings of the 24th IAEA Fusion Energy Conference, San Diego, CA, USA, 8–13 October 2012; p. TH/P6–25. Available online: http://www-naweb.iaea.org/napc/physics/FEC/FEC2012/papers/507_THP625.pdf (accessed on 3 November 2022).
  18. Albajar, F.; Bornatici, M.; Engelmann, F. RAYTEC: A new code for electron cyclotron radiative transport modelling of fusion plasmas. Nucl. Fusion 2009, 49, 115017. [Google Scholar] [CrossRef]
  19. Tamor, S. A Simple Fast Routine for Computation of Energy Transport by Synchroton Radiation in Tokamaks and Similar Geometries; SAI-023-81-189LJ/LAPS-72; Science Applications, Inc.: La Jolla, CA, USA, 1981. [Google Scholar]
  20. Houlberg, W.A. CYTRAN 2.1; Oak Ridge National Laboratory: Oak Ridge, TN, USA, 2004. Available online: https://w3.pppl.gov/ntcc/CYTRAN/ (accessed on 3 November 2022).
  21. Albajar, F.; Bornatici, M.; Engelmann, F. EC Radiative Transport and Losses in DEMO-like High-Temperature Plasmas. EPJ Web Conf. 2015, 87, 01009. [Google Scholar] [CrossRef] [Green Version]
  22. Trubnikov, B.A. Electromagnetic waves in a relativistic plasma in a magnetic field. In Plasma Physics and the Problem of Controlled Thermonuclear Reactions; Leontovich, M.A., Ed.; Pergamon Press: New York, NY, USA, 1959; Volume 3, p. 122. [Google Scholar]
  23. Bekefi, G. Radiation Processes in Plasmas; Wiley: New York, NY, USA, 1966. [Google Scholar]
  24. Bornatici, M.; Cano, R.; De Barbieri, O.; Engelmann, F. Electron cyclotron emission and absorption in fusion plasmas. Nucl. Fusion 1983, 23, 1153. [Google Scholar] [CrossRef]
  25. Albajar, F.; Bornatici, M.; Engelmann, F. Electron cyclotron radiative transfer in the presence of polarization scrambling in wall reflections. Nucl. Fusion 2005, 45, L9–L13. [Google Scholar] [CrossRef] [Green Version]
  26. De la Luna, E.; JET-EFDA contributors. Physics of ECE Temperature Measurements and Prospects for ITER. AIP Conf. Proc. 2008, 988, 63. [Google Scholar] [CrossRef]
  27. Farina, D.; Figini, L.; Platania, P.; Sozzi, C. SPECE: A code for Electron Cyclotron Emission in tokamaks. AIP Conf. Proc. 2008, 988, 128. [Google Scholar] [CrossRef]
  28. Rasmussen, J.; Stejner, M.; Figini, L.; Jensen, T.; Klinkby, E.B.; Korsholm, S.B.; Larsen, A.W.; Leipold, F.; Micheletti, D.; Nielsen, S.K.; et al. Modeling the electron cyclotron emission below the fundamental resonance in ITER. Plasma Phys. Control. Fusion 2019, 61, 095002. [Google Scholar] [CrossRef] [Green Version]
  29. Laqua, H.P.; Erckmann, V.; Hirsch, M.; W7-AS Team. Distribution of the ECRH stray radiation in fusion devices. In Proceedings of the 28th EPS Conference on Plasma Physics, Madeira, Portugal, 18–22 June 2001; pp. 1277–1280. Available online: https://www.ipfn.tecnico.ulisboa.pt/cfn/EPS2001/CD/pdfs/P3.099.pdf (accessed on 3 November 2022).
  30. Kim, S.H.; Casper, T.A.; Snipes, J.A. Investigation of key parameters for the development of reliable ITER baseline operation scenarios using CORSICA. Nucl. Fusion 2018, 58, 056013. [Google Scholar] [CrossRef]
  31. Kim, S.H.; Bulmer, R.H.; Campbell, D.J.; Casper, T.A.; Lo Destro, L.L.; Meyer, W.H.; Pearlstein, L.D.; Snipes, J.A. CORSICA modelling of ITER hybrid operation scenarios. Nucl. Fusion 2016, 56, 126002. [Google Scholar] [CrossRef]
  32. Kim, S.H.; Polevoi, A.R.; Loarte, A.; Medvedev, S.Y.; Huijsmans, G. A study of the heating and current drive options and confinement requirements to access steady-state plasmas at Q~5 in ITER and associated operational scenario development. Nucl. Fusion 2021, 61, 076004. [Google Scholar] [CrossRef]
  33. Polevoi, A.R.; Ivanov, A.A.; Medvedev, S.Y.; Huijsmans, G.T.A.; Kim, S.H.; Loarte, A.; Fable, E.; Kuyanov, A.Y. Reassessment of steady-state operation in ITER with NBI and EC heating and current drive. Nucl. Fusion 2020, 60, 096024. [Google Scholar] [CrossRef]
  34. Trubnikov, B.A. Universal coefficients for synchrotron emission from plasma configurations. In Reviews of Plasma Physics; Leontovich, M.A., Ed.; Consultants Bureau: New York, NY, USA, 1979; Volume 7, p. 345. [Google Scholar]
  35. Goldsmith, P.F. Quasioptical Systems: Gaussian Beam Quasioptical Propogation and Applications; IEEE Press: New York, NY, USA, 1998. [Google Scholar]
  36. Haynes, W.M.; Lide, D.R.; Bruno, T.J. CRC Handbook of Chemistry and Physics: A Ready-Reference Book of Chemical and Physical Data, 97th ed.; CRC Press: Boca Raton, FL, USA, 2016–2017. [Google Scholar]
  37. ITER. Materials Properties Handbook (MPH); ITER Document No. G 74 MA 16 (ITER-AA04-3201); ITER Organization, Route de Vinon-sur-Verdon,CS 90 046 13067: St. Paul-lez-Durance, France, 2001. [Google Scholar]
Figure 1. Spectral intensity emerging from the plasma to the first wall for low EC harmonics n = 1 and n = 2 and the corresponding EC energy flux density (listed in the legend) for the ITER operation scenarios indicated in Table 1. The upper x-axis shows the corresponding value of the harmonic number, n, defined relative to the fundamental EC frequency on the toroidal magnetic axis.
Symmetry 15 00118 g001
Figure 2. Evolution of the following parameters: volume-averaged values of electron temperature, <Te>V, and density, <ne>V; total (i.e., integrated over frequencies of moderate and high harmonics, n ≥ 3) EC radiation energy flux density, F, emerging from the plasma to the first wall, calculated by the CYNEQ code for wall reflection coefficient Rw = 0.9; similar value obtained from the locally applied Trubnikov formula for total power losses (Equation (A.1a) in [18]), FLATF. (a) ITER scenario with improved confinement (scenario No. 1 in Table 1); (b) hybrid operation scenario with ECH (scenario No. 2 in Table 1); (c) hybrid operation scenario with ECH+LH (scenario No. 3 in Table 1); (d) steady-state operation scenario with injection of 13.3 MW of ECH power (scenario No. 4 in Table 1); (e) steady-state scenario with injection of 20 MW ECH power (scenario No. 5 in Table 1).
Symmetry 15 00118 g002
Figure 3. The data for the ITER scenario with improved confinement (scenario No. 1 in Table 1): electron temperature and density profiles obtained by modelling the scenario using the CORSICA code, and the profile of the modulus of the total magnetic field averaged over the magnetic surface (left); spectral intensity of the outgoing plasma-generated EC radiation, calculated using the CYNEQ code, for various reflection coefficients of the EC wave from the wall of the vacuum chamber, Rw, (right). The legend shows the frequency-integrated energy flux density of the EC radiation emerging from the plasma to the first wall.
Symmetry 15 00118 g003
Figure 4. The same as in Figure 3, but for scenario No. 2 in Table 1.
Symmetry 15 00118 g004
Figure 5. The same as in Figure 3, but for scenario No. 3 in Table 1.
Symmetry 15 00118 g005
Figure 6. The same as in Figure 3, but for scenario No. 4 in Table 1.
Symmetry 15 00118 g006
Figure 7. The same as in Figure 3, but for scenario No. 5 in Table 1.
Symmetry 15 00118 g007
Figure 8. Spectral intensity of the EC radiation emerging from the plasma to the first wall, J, as a function of the harmonic number, n, and wall reflection coefficient, Rw, in the range up to Rw = 0.95, in the ITER scenario with improved confinement (scenario No. 1 in Table 1, HMODE13).
Symmetry 15 00118 g008
Figure 9. Comparison of the spectral intensity of the outgoing plasma-generated EC radiation for scenario No. 5 in Table 1, calculated using the CYNEQ code for reflection coefficient Rw = 0.95 and effective reflection coefficient Rw = Rw(ν) (see right y-axis), taken from [4] (see Figure 7 therein, red curve, wall temperature t = 300 °C). The legend shows the frequency-integrated energy flux density of the EC radiation emerging from the plasma to the first wall.
Symmetry 15 00118 g009
Figure 10. Energy flux density, F, of the plasma-generated EC radiation emerging from the plasma to the first wall in the ITER scenarios shown in Table 1: (a) total (i.e., integrated over frequencies of moderate and high harmonics, n ≥ 3) value of F; (b) comparison of the normalized value of F with the approximate Formula (8).
Symmetry 15 00118 g010
Figure 11. (a) Frequencies corresponding to the maximum value of EC radiation spectral intensity, ν* (see Figure 3, Figure 4, Figure 5, Figure 6 and Figure 7), in the ITER scenarios indicated in Table 1; (b) comparison of the normalized frequency, ν*, with the approximate Formula (9).
Symmetry 15 00118 g011
Figure 12. Material absorption coefficients as a function of frequency for isotropic stray radiation (arbitrarily polarized), calculated by angle-averaging of the Fresnel equations.
Symmetry 15 00118 g012
Figure 13. The ratio of two values of energy density absorbed by stainless steel material, the plasma-generated EC radiation emerging from the plasma at the flat-top stage of the discharge (Table 4), and ECRH/ECCD-produced stray radiation at the start-up stage of the discharge (Table 5). The ratio is shown for five scenarios of ITER operation.
Symmetry 15 00118 g013
Table 1. Parameters of ITER scenarios for the flat-top stage of discharge.
N12345
ScenariosHMODE13HYBRID EC11HYBRID_LH03STEADY_EC42STEADY_EC1F
Te(0), keV22.129.231.435.937.4
Te(1), keV0.20.10.10.10.1
<Te>V, keV10.613.214.314.215.3
ne(0), 1019 m−39.78.58.56.56.0
ne(1), 1019 m−33.93.03.02.32.1
<ne>V, 1019 m−38.77.47.45.75.2
Ip, MA15.012.512.58.59.0
Pnbi, MW32.432.832.822.617.0
Pech, MW6.520.020.013.320.0
Pich, MW9.80000
Plh, MW0020.020.020.0
Paux, MW48.752.872.856.057.0
Te(ρ) is the electron temperature profile as a function of the magnetic surface label, ρ; the label of the magnetic surface ρ is defined as the square root of the normalized toroidal magnetic flux, where ρ = 0 corresponds to the axis of nested magnetic flux surfaces, and ρ = 1 is the label of the last closed magnetic surface; ne(ρ) is the electron density profile; < >V is the result averaged over the plasma volume; Ip is the plasma (toroidal) current; Psrc is auxiliary plasma heating power from various external sources; src = nbi is the heating by neutral beam injection; src = ech is electron cyclotron resonant heating; src = ich is ion cyclotron resonant heating; src = lh is lower hybrid heating; Paux is total power of auxiliary plasma heating by all external sources.
Table 2. Characteristics of the plasma-generated EC radiation emerging from the plasma in various ITER scenarios from Table 1.
ScenarioHMODE13HYBRID_EC11HYBRID_LH03STEADY_EC42STEADY_EC1F
Frequency
range and
reflection
ν* [GHz], Jmax [1 × 10⁻¹⁵ MW m−2 sr−1 Hz−1], Fn [kW/m2]
n = 1170.00.10.2170.00.10.3155.30.10.3155.30.20.3155.30.20.3
n = 2301.80.41.7316.50.62.1301.80.62.2301.80.72.2316.50.72.4
n ≥ 3, Rw = 0.60653.51.726.7741.42.446.8741.42.755.7726.83.062.4741.43.269.0
n ≥ 3, Rw = 0.80668.12.037.0756.13.065.8785.43.478.7770.73.789.3814.74.099.0
n ≥ 3, Rw = 0.90770.72.550.1858.63.890.6858.64.3108.7844.04.7124.8873.35.1138.8
n ≥ 3, Rw = 0.95873.33.066.7902.64.6122.4946.55.3147.4961.25.9171.3975.86.3191.2
F [kW/m2]
n ≥ 1, Rw = 0.6028.649.158.264.971.8
n ≥ 1, Rw = 0.8038.968.281.291.8101.7
n ≥ 1, Rw = 0.9052.192.9111.2127.3141.6
n ≥ 1, Rw = 0.9568.6124.7149.9173.8194.0
ν* is the frequency at which the EC radiation intensity (1), emerging from the plasma, is at its maximum; Jmax is the maximum value of the EC radiation intensity for the specified frequency range; Fn is the energy flux density of the EC radiation emerging from the plasma to the first wall, for the specified frequency range, including the EC harmonics n = 1, n = 2 and n ≥ 3; F is the total (integrated over all frequencies) value of energy flux density for EC harmonics n ≥ 1. Total surface of the wall of the vacuum chamber, S = 876 m2.
Table 3. Energy flux density for the stray radiation produced by ECRH/ECCD.
Reflection
Coefficient
Finj [kW/m2],
Pinj = 6.7 MW
Rw = 0.6019.1
Rw = 0.8038.2
Rw = 0.9076.5
Rw = 0.95153.0
Finj is the energy flux density of the ECRH/ECCD-produced stray radiation incident on the first wall at the start-up stage of discharge in ITER when absorption of the EC radiation in plasma is negligible (total input heating power Pinj = 6.7 MW). Total surface of the first wall of the vacuum chamber, S = 876 m2.
Table 4. Absorbed energy density for plasma-generated EC radiation emerging from the plasma in various ITER scenarios from Table 1 for different materials at flat-top state of discharge.
ScenarioHMODE13HYBRID_EC11HYBRID_LH03STEADY_EC42STEADY_EC1F
Reflection Absorbed energy density, Fabs [kW/m2], for stainless steel and tungsten for temperature 600 °C
Rw = 0.601.30.62.31.22.71.43.11.63.41.7
Rw = 0.801.80.93.31.73.92.04.52.35.02.5
Rw = 0.902.41.24.62.35.62.86.43.37.23.7
Rw = 0.953.31.76.33.27.73.99.04.610.15.2
Table 5. Absorbed energy density for ECRH/ECCD-produced stray radiation in ITER for different materials at start-up stage of discharge.
ReflectionAbsorbed Energy Density for ECRH/ECCD-Produced Stray Radiation, Fabs,inj [kW/m2],
for Stainless Steel and Tungsten
for Temperature 300 °C (Pinj = 6.7 MW)
Rw = 0.600.40.2
Rw = 0.800.90.4
Rw = 0.901.80.8
Rw = 0.953.61.5
Disclaimer/Publisher’s Note: The statements, opinions and data contained in all publications are solely those of the individual author(s) and contributor(s) and not of MDPI and/or the editor(s). MDPI and/or the editor(s) disclaim responsibility for any injury to people or property resulting from any ideas, methods, instructions or products referred to in the content.

