Article

Multiple Pathways for Dissociative Adsorption of SiCl4 on the Si(100)-c(4×2) Surface

1
State Key Laboratory of Chemistry and Utilization of Carbon-Based Energy Resources, School of Chemical Engineering and Technology, Xinjiang University, Urumqi 830017, China
2
Department of Chemistry and Chemical Engineering & Chongqing Key Laboratory of Theoretical and Computational Chemistry, Chongqing University, Chongqing 401331, China
3
Department of Chemical Engineering, Sichuan University, Chengdu 610065, China
4
Engineering Research Center of Combustion and Cooling for Aerospace Power, Sichuan University, Chengdu 610000, China
*
Authors to whom correspondence should be addressed.
Symmetry 2023, 15(1), 213; https://doi.org/10.3390/sym15010213
Submission received: 4 December 2022 / Revised: 6 January 2023 / Accepted: 7 January 2023 / Published: 11 January 2023

Abstract

:
The adsorption of silicon tetrachloride (STC, SiCl4) on the silicon surface is a crucial process in polysilicon manufacture. However, the underlying mechanism for the adsorption remains highly uncertain. Here, new dissociative adsorption (DA) reaction pathways involving a flip of a silicon dimer in the first layer and considering physisorption are identified. Different DA patterns, inter-row (IR), inter-dimer (ID), and on-dimer (OD), are confirmed by the density functional theory (DFT) calculations at the PBE-D3(BJ)/TZVP-MOLOPT-GTH level. The stable structures for all minima are searched by global optimization through the artificial bee colony (ABC) algorithm. Findings reveal that the parent molecules dissociate first by breaking one Si-Cl bond, following which the resulting SiCl3 and Cl fragments are attached to adjacent Si-atom sites. Moreover, dimer flipping significantly reduces the energy barrier for chemisorption, mainly due to the change in electronic structure that enhances the interaction of the site with the SiCl3 radical. Physisorption may also be accompanied by dimer flipping to form a stable adsorption structure.

1. Introduction

Currently, polysilicon, as a raw material for microelectronics and photo-voltaic (PV) solar cells, has attracted increasing research attention [1]. The majority of polysilicon is produced by the Siemens process, which involves the conversion of metallurgical grade silicon (MG-Si) to a compound in the gas phase. Then, trichlorosilane (TCS, SiHCl3), produced by silicon tetrachloride (STC, SiCl4) hydrogenation, is deposited on a heated silicon rod through chemical vapor deposition (CVD) [2]. The Siemens process involves a two-phase chemically reactive system [3]. Some relevant reactions in the gas phase have been studied based on the ab initio calculations and the transition-state theory (TST) [4]. However, the detailed mechanism of STC dissociative adsorption (DA), the first reaction that occurs on the silicon surface and plays a fundamentally important role in the production of polysilicon, remains unclear [5].
Silicon crystals have a variety of surfaces, of which the Si(100) surface has been extensively investigated as a remarkably stable surface [6]. Generally, Si surfaces are prone to undergo surface reconstruction, in which two undercoordinated adjacent Si atoms on the surface are joined in pairs to form a dimer [7]. So far, many dimer reconstruction patterns on the Si(100) surface have been identified and reported. Guo et al [8] performed energetics and dynamics for four reconstructed Si(100) surfaces at different temperatures by computations at the level of density functional theory (DFT). Two dimers in the same row show an attractive effect due to the opposite electron spin direction. In contrast, two adjacent and parallel dimers have an apparent repulsive effect due to the same electron spin direction. Therefore, every four dimers on two adjacent rows easily form a stable structure, which is the well-known c(4×2) reconstruction. The c(4×2) reconstruction pattern was found to be dominant (50–60% at room temperature) and stable, consistent with the experiment by Manzano et al. [9]. Therefore, the Si(100)-c(4×2) surface is taken as the most appropriate and applicable research object for DA on the silicon surface.
The DA mechanisms of some molecules, such as H2, [10] Cl2, [11] NH3 [12], and CH3Br, [13] on the Si(100)-c(4×2) surface have been reported. Three different pathways, inter-row (IR), inter-dimer (ID), and on-dimer (OD), have been identified to be the major DA patterns of small molecules [14]. However, only a few studies have been carried out to study the STC DA on the Si(100) surface. Guo et al. [15] and Gao et al. [16] experimentally investigated electron-stimulated desorption of STC in solution adsorbed on Si(100). Theoretical simulations can provide the intimate detail of the DA mechanism, which is extremely hard to obtain by experiment. Tossell [17] and Hall et al. [18] used an artificial Si9H12 model to calculate the equilibrium structures and the binding energies for STC DA products on the Si(100) surface. The corresponding results and analysis of the Si9H12 cluster may be not convincing, as it needs to be tested to check if this cluster can reflect the reconstruction of the Si(100) surface. The slab model is more suitable for the simulation of the DA on the surface due to its consideration of the periodicity and the bulk crystal atoms. Chan et al. [19] studied the desorption mechanisms of STC on Si(100) by first-principle DFT calculations with a plane-wave basis set and pseudopotentials. In their calculations, the dangling Si-Si dimers bonds were saturated by a monolayer of chlorine, which would alter the characteristic electronic structure of the Si(100) surface significantly. Yadav and Singh [20] simulated the periodic slabs of the STC adsorption on Si(100)-c(4×2) for the OD pattern using the projector augmented wave (PAW) method with Perdew–Burke–Ernzerhof (PBE) formulation, and the minimum energy paths (MEPs) were determined by the climbing image nudged elastic band (CI-NEB) method [21]. One can see that the STC DA on the Si(100)-c(4×2) surface has not been studied thoroughly so far except for that at the OD site. In addition, no study considers physisorption.
Compared to other surfaces, the Si(100) surface is prone to dimer flipping, which allows for multiple branches of the adsorption process [13]. Numerous researchers have reported that the flipping motion plays an important role in absorption dynamics [7]. Hwang [22] reported a dimer flipping mechanism on the Si(100) surface by DFT calculations. Hata et al. [23] experimentally measured the energy barrier of 0.7~2.5 kcal/mol for a flip of a dimer by a statistical analysis of the time trace using scanning tunneling microscopy (STM). Sweetman et al. [24] revealed that the flipping motion of a dimer was influenced by both the local and non-local environment. Furthermore, some researchers studied the effect of dimer flipping on molecular DA. Buehler and Boland [25] were the first to reveal that the flipping motion could enhance the DA of H2 on adjacent Si-Si dimers by STM and spectroscopy (STS). By STM, Yu et al. [26] observed that dimer flipping caused a change in the DA selectivity of H2O on the Si(100) surface. Harikumar et al. [27] reported that the adsorption of 1,5-chloropentane on Si(100) resulted in the flipping of adjacent rows, and the flipped rows became the best adsorption sites. Therefore, the dimer flipping motion is also a crucial factor influencing the interactions of STC with the Si(100) surface, yet no relevant studies have been reported.
In the present work, different STC DA reaction pathways at Si(100)-c(4×2) are calculated using the Gaussian and Plane Waves (GPW) method based on a slab model. Two new reaction pathways, IR and ID, are found for the STC DA reaction pathways at Si(100)-c(4×2). Physisorption and dimer flipping are considered. In addition, an explanation from the perspective of the electronic structure is given for the effect of the dimer flipping motion on the DA. The interaction between the STC and the Si surface at different paths is analyzed and the results may open a window to the mechanistic study of DA with Si-Si dimer flipping. The paper is organized as follows. Section 2 describes the details of the electronic structure calculations. The results are presented and discussed in Section 3. A final summary is given in Section 4.

2. Computational Details

To determine the local minima-energy structures of the interactions between the STC and Si(100)-c(4×2), the ABCluster program [28] was adopted systematically to generate the stable structures for all the minima points using the artificial bee colony (ABC) algorithm [29]. Firstly, the ABCluster program generated 100 initial structures. Subsequently, these structures were optimized using the PBE functional [30] with long-range dispersion correction proposed by Grimme (i.e., DFT-D3BJ method) [31] as implemented in the CP2K 9.0.1 package [32]. The GPW method [33] was used to describe the interaction between the ions and the electrons. The TZVP-MOLOPT [34] basis set was chosen to reduce the basis set superposition errors (BSSE). The core electrons were modeled by the Goedecker–Teter–Hutter (GTH) pseudopotentials [35] with 1, 4, and 7 valence electrons of H, Si, and Cl, respectively. The energy threshold of the plane wave was set at 550 Ry. The self-consistent field (SCF) was calculated by the orbital transformation (OT) method [36]. The conjugate gradients (CG) minimizer [37] was employed for the optimization of all the stationary points. The MEPs and TSs evaluations were performed using the CI-NEB method. Each pathway was determined by sampling with six images. Ultimately, all reactants, TSs, intermediates (IM), and products of the STC DA were obtained.
The basic supercell used for all simulations is shown in Figure 1. A slab model was used to model the Si(100)-c(4×2) surface. The slab comprises five Si layers and a bottom H-layer. The silicon atoms in the fourth and fifth layers as well as all the hydrogen atoms were constrained, while atoms in the remaining layers could relax. A vacuum region of 15 Å was used to eliminate the periodic image interaction normal to the surface and the gamma-point approximation was employed for Brillouin Zone integration.
For the calculation results with the slab model, there are significant limitations when performing electronic structure analysis due to the complexity of the wave function (WFN) files [38]. Therefore, some studies of surface adsorption employed a combination of slab and cluster models to yield flexible and diverse electronic structure information [39]. In the present work, the Si49H40 cluster model (shown in Figure S8) was taken to approximate the slab model. The cluster model contains three kinds of adsorption sites, their surrounding atoms, and multiple layers of bulk Si atoms. The single-point calculations at the geometries optimized by the GPW method were performed at the B3LYP/def2-TZVP level with the ORCA 5.0.1 package [40] to generate the WFN files. The chain-of-spheres exchange (COSX) algorithm [41] was employed to speed up the Hartree–Fock (HF) exchange, and the resolution of the identity (RI) approximation [42] was used to calculate the Coulomb interaction of the Kohn–Sham (KS) equation. The electron localization function (ELF) [43], the Mayer bond order (MBO) [44], the independent gradient model based on Hirshfeld partition (IGMH) [45], and the interaction region indicator (IRI) [46] were characterized using the Multiwfn 3.8(dev) package [47].
In order to further verify the structures of the stable points during DA at the IR and ID sites and the reaction mechanisms, ab initio molecular dynamics (AIMD) was employed. The MD conditions were imposed by canonical sampling through the velocity rescaling (CSVR) thermostat [48]. The initial temperature was set at 823 K, the operating temperature of fluidized beds in the industrial hydrogenation of STC [4]. The MD time step was set as 1 fs. Then, the MD was run according to the microcanonical (NVE) ensemble. Considering the large size of the slab models, the gamma point was used. The TS1, TS3, TS4, and TS5 (see below) were taken as the initial structures of AIMD to obtain the dynamics trajectories of the IR and ID reactions. Furthermore, the symmetry of the surface and molecule is considered in the first principle calculation and MD simulation to save computational costs.

3. Results and Discussion

3.1. Predicting of Si(100)-c(4×2) Adsorption

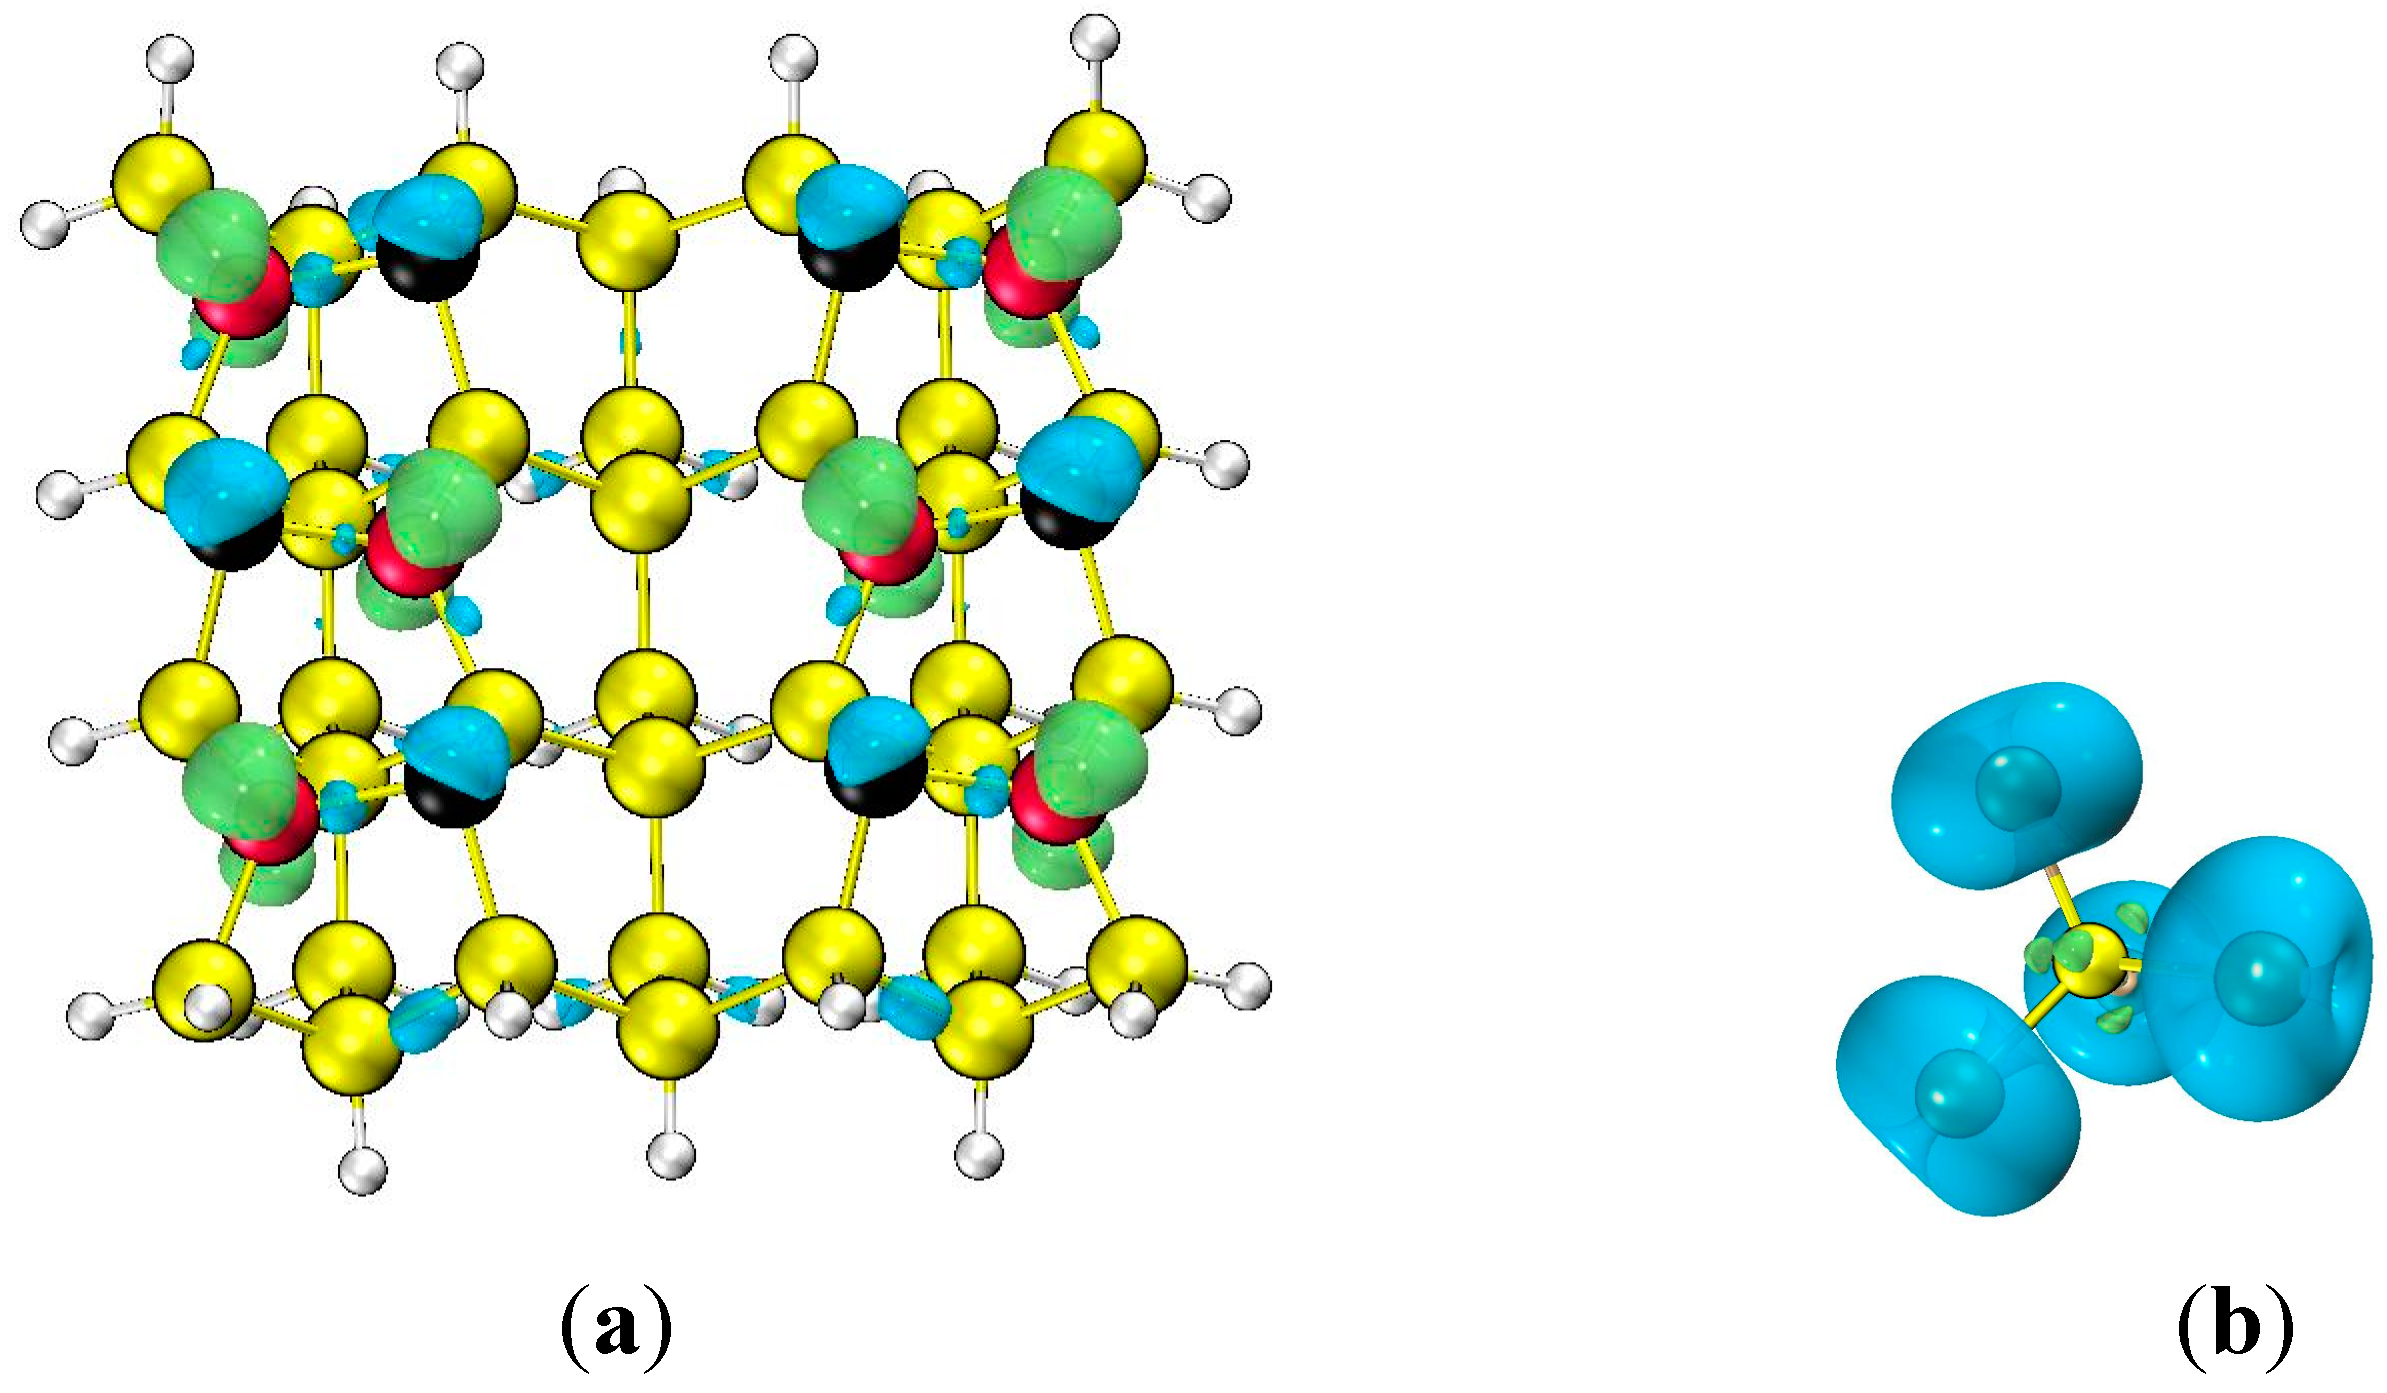
The wavefunction-based local reactivity of the system was performed to characterize the electronic structure of the Si(100)-c(4×2) surface and the STC. The Orbital-Weighted Dual Descriptor [49] was used in the description of the chemical reactivity considering the system with (quasi-) degenerate frontier molecular orbitals. Figure 2a depicts the values and surface of the dual descriptor of Si(100)-c(4×2) surface and the STC. The isosurfaces of the dual descriptor of Si(100)-c(4×2) surface have a spatial distribution consistent with the symmetry of the surface. The inner Si atoms in the first layer have a clear electrophilic character (Δfw > 0) while the outer Si atoms are nucleophilic (Δfw < 0). The isosurfaces of the dual descriptor of STC are depicted in Figure 2b. The isosurfaces are in line with the symmetry feature of the STC molecule. The nucleophilic properties are mainly located in the ring regions around the Cl-atoms. This could be an indication of a high electron density in the ring regions. Hence, it can be inferred that the main contribution to the adsorption is the interaction between the Cl atoms and the inner Si atoms in the first layer when the STC is close to the surface. Furthermore, the electrophilic characteristics of STC are not significant. Therefore, the interaction of sigma-holes of halogen atoms with nucleophilic sites, the halogen bonds, would not be present in the DA of STC [50].
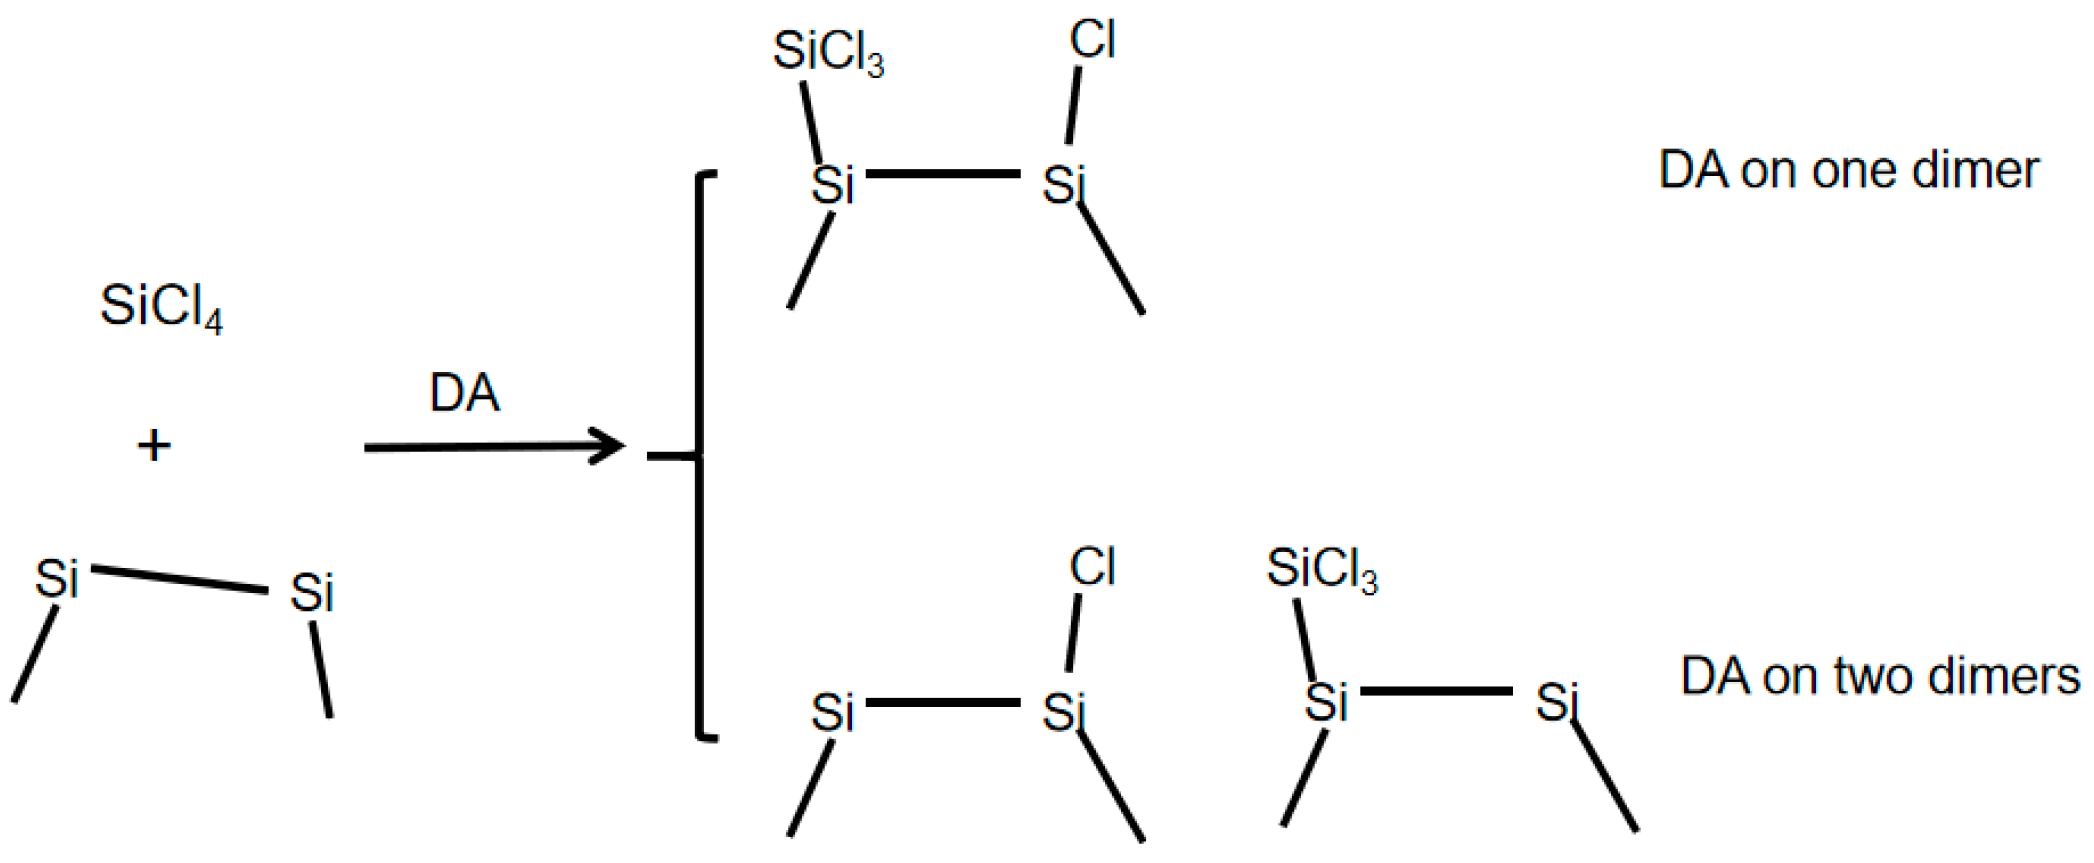
Based on the results of the dual descriptor, we speculate that the STC DA may occur on a single dimer or on two adjacent dimers. The schematic of the STC DA mechanism is shown in Figure 3.

3.2. DA at IR Sites

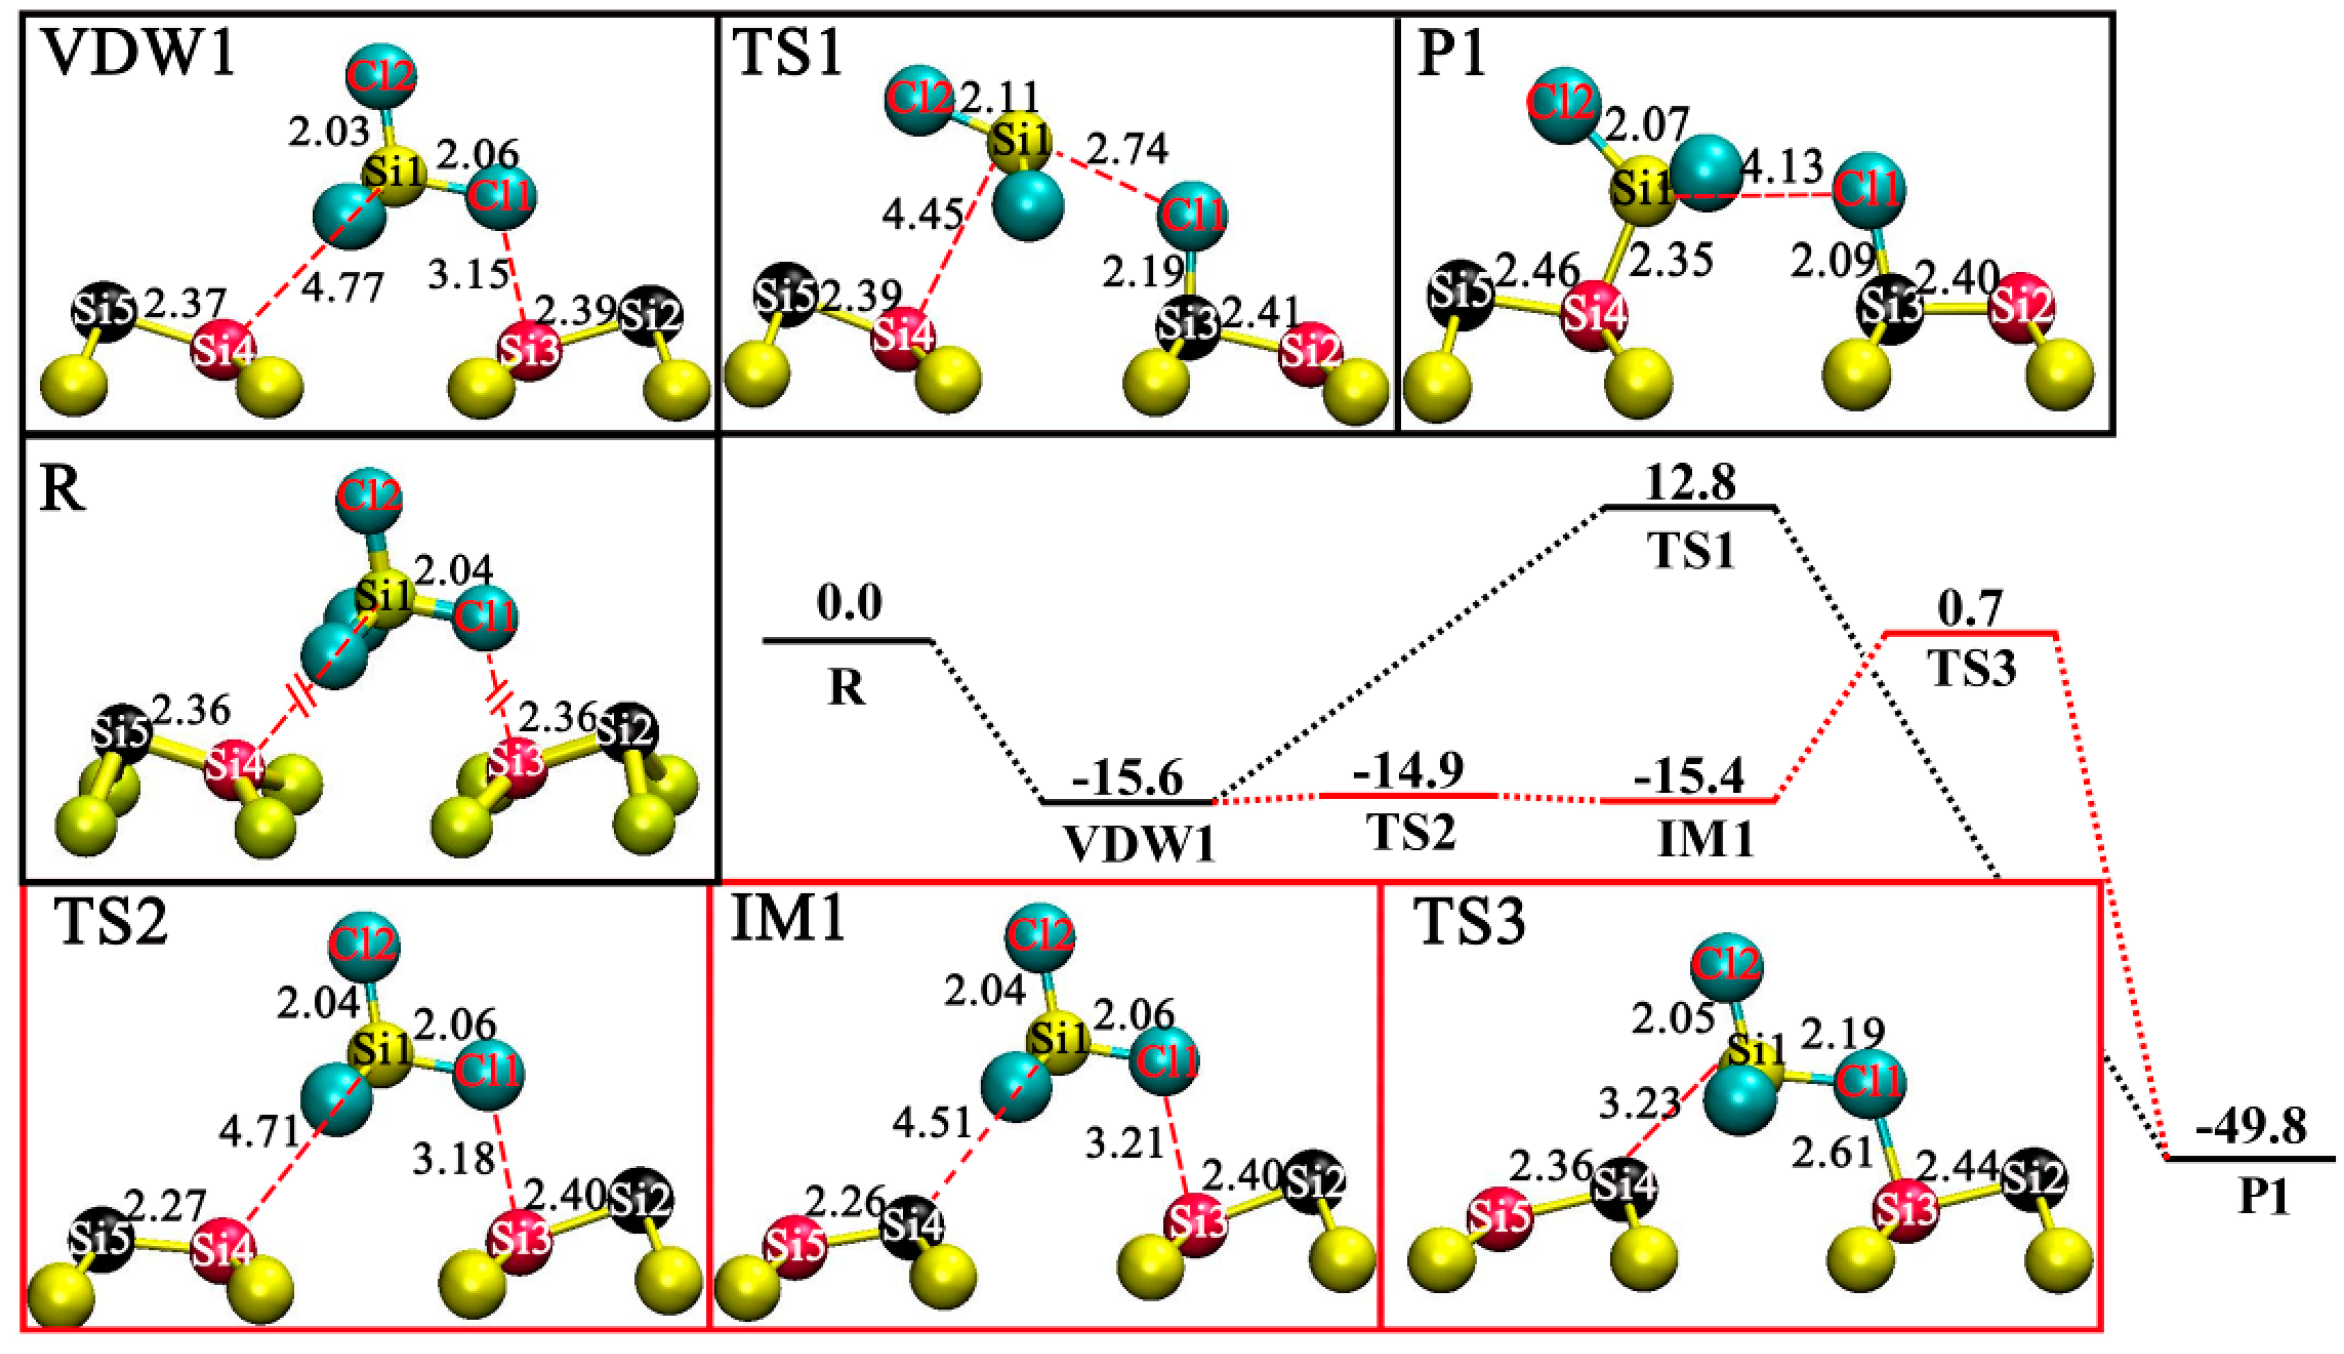
There are two distributions of adjacent dimers on the Si(100) surface, IR and ID. Figure 4 shows the DA reaction paths at the IR site. The energy profiles were calculated for DA at the IR site, using PBE-D3(BJ)/TZVP-MOLPOT-GTH. The STC and Si(100)-c(4×2) produce VDW1 without barriers. The VDW1 is -15.6 kcal/mol without zero-point vibrational energy (ZPVE). All energies hereafter are relative to the separated STC and the surface, if not specified. The Cl1-Si3 bond length is 3.15 Å and the Si1-Si4 bond length is 4.77 Å. Other bond lengths are not significantly different from those in the reactants. VDW1 can undergo direct DA via TS1 to yield P1. TS1 is located at 12.8 kcal/mol. At the beginning of the DA process, the covalent interaction between Si1-Cl1 is weakened and the dissociated Cl1 is adsorbed on the Si3 site with the Si1-Cl1 bond length being shortened from 3.06 to 2.74 Å, and the Cl1-Si3 bond length is reduced to 2.19 Å. In addition, the dimer Si2-Si3 flips from VDW1 to TS1. Consequently, the Si3 becomes the outer atom, while the Si2 becomes the inner one. Finally, there is a complete dissociation of the STC into two groups adsorbed at the IR site and the product P1, with the generation of energy of −49.8 kcal/mol. The bond strengths of Si1-Si4 and Cl1-Si3 reduce to 2.35 and 2.09 Å, respectively. The spatial position of Si4 shifts out of the surface and is synchronized with the attachment of the SiCl3 radical at the Si4 site. The bond strength of Si2-Si3 is slightly elongated to 2.4 Å. The position of the flipped Si2 is elevated to the same level as Si3. VDW1 also can undergo DA after dimer flipping. IM1 is produced via TS2 with the Si4-Si5 dimer flipping. The energy barrier relative to VDW1 for the dimer flipping is 0.7 kcal/mol, consistent with the experimental value of 0.7~2.5 kcal/mol [23]. The bond strength of Si1–Si4 is reduced from 4.77 at VDW1 to 4.51 Å at IM1. Then, STC dissociates and adsorbs on Si3 and Si4 sites via TS3, located at 0.7 kcal/mol, which is much lower than TS1.
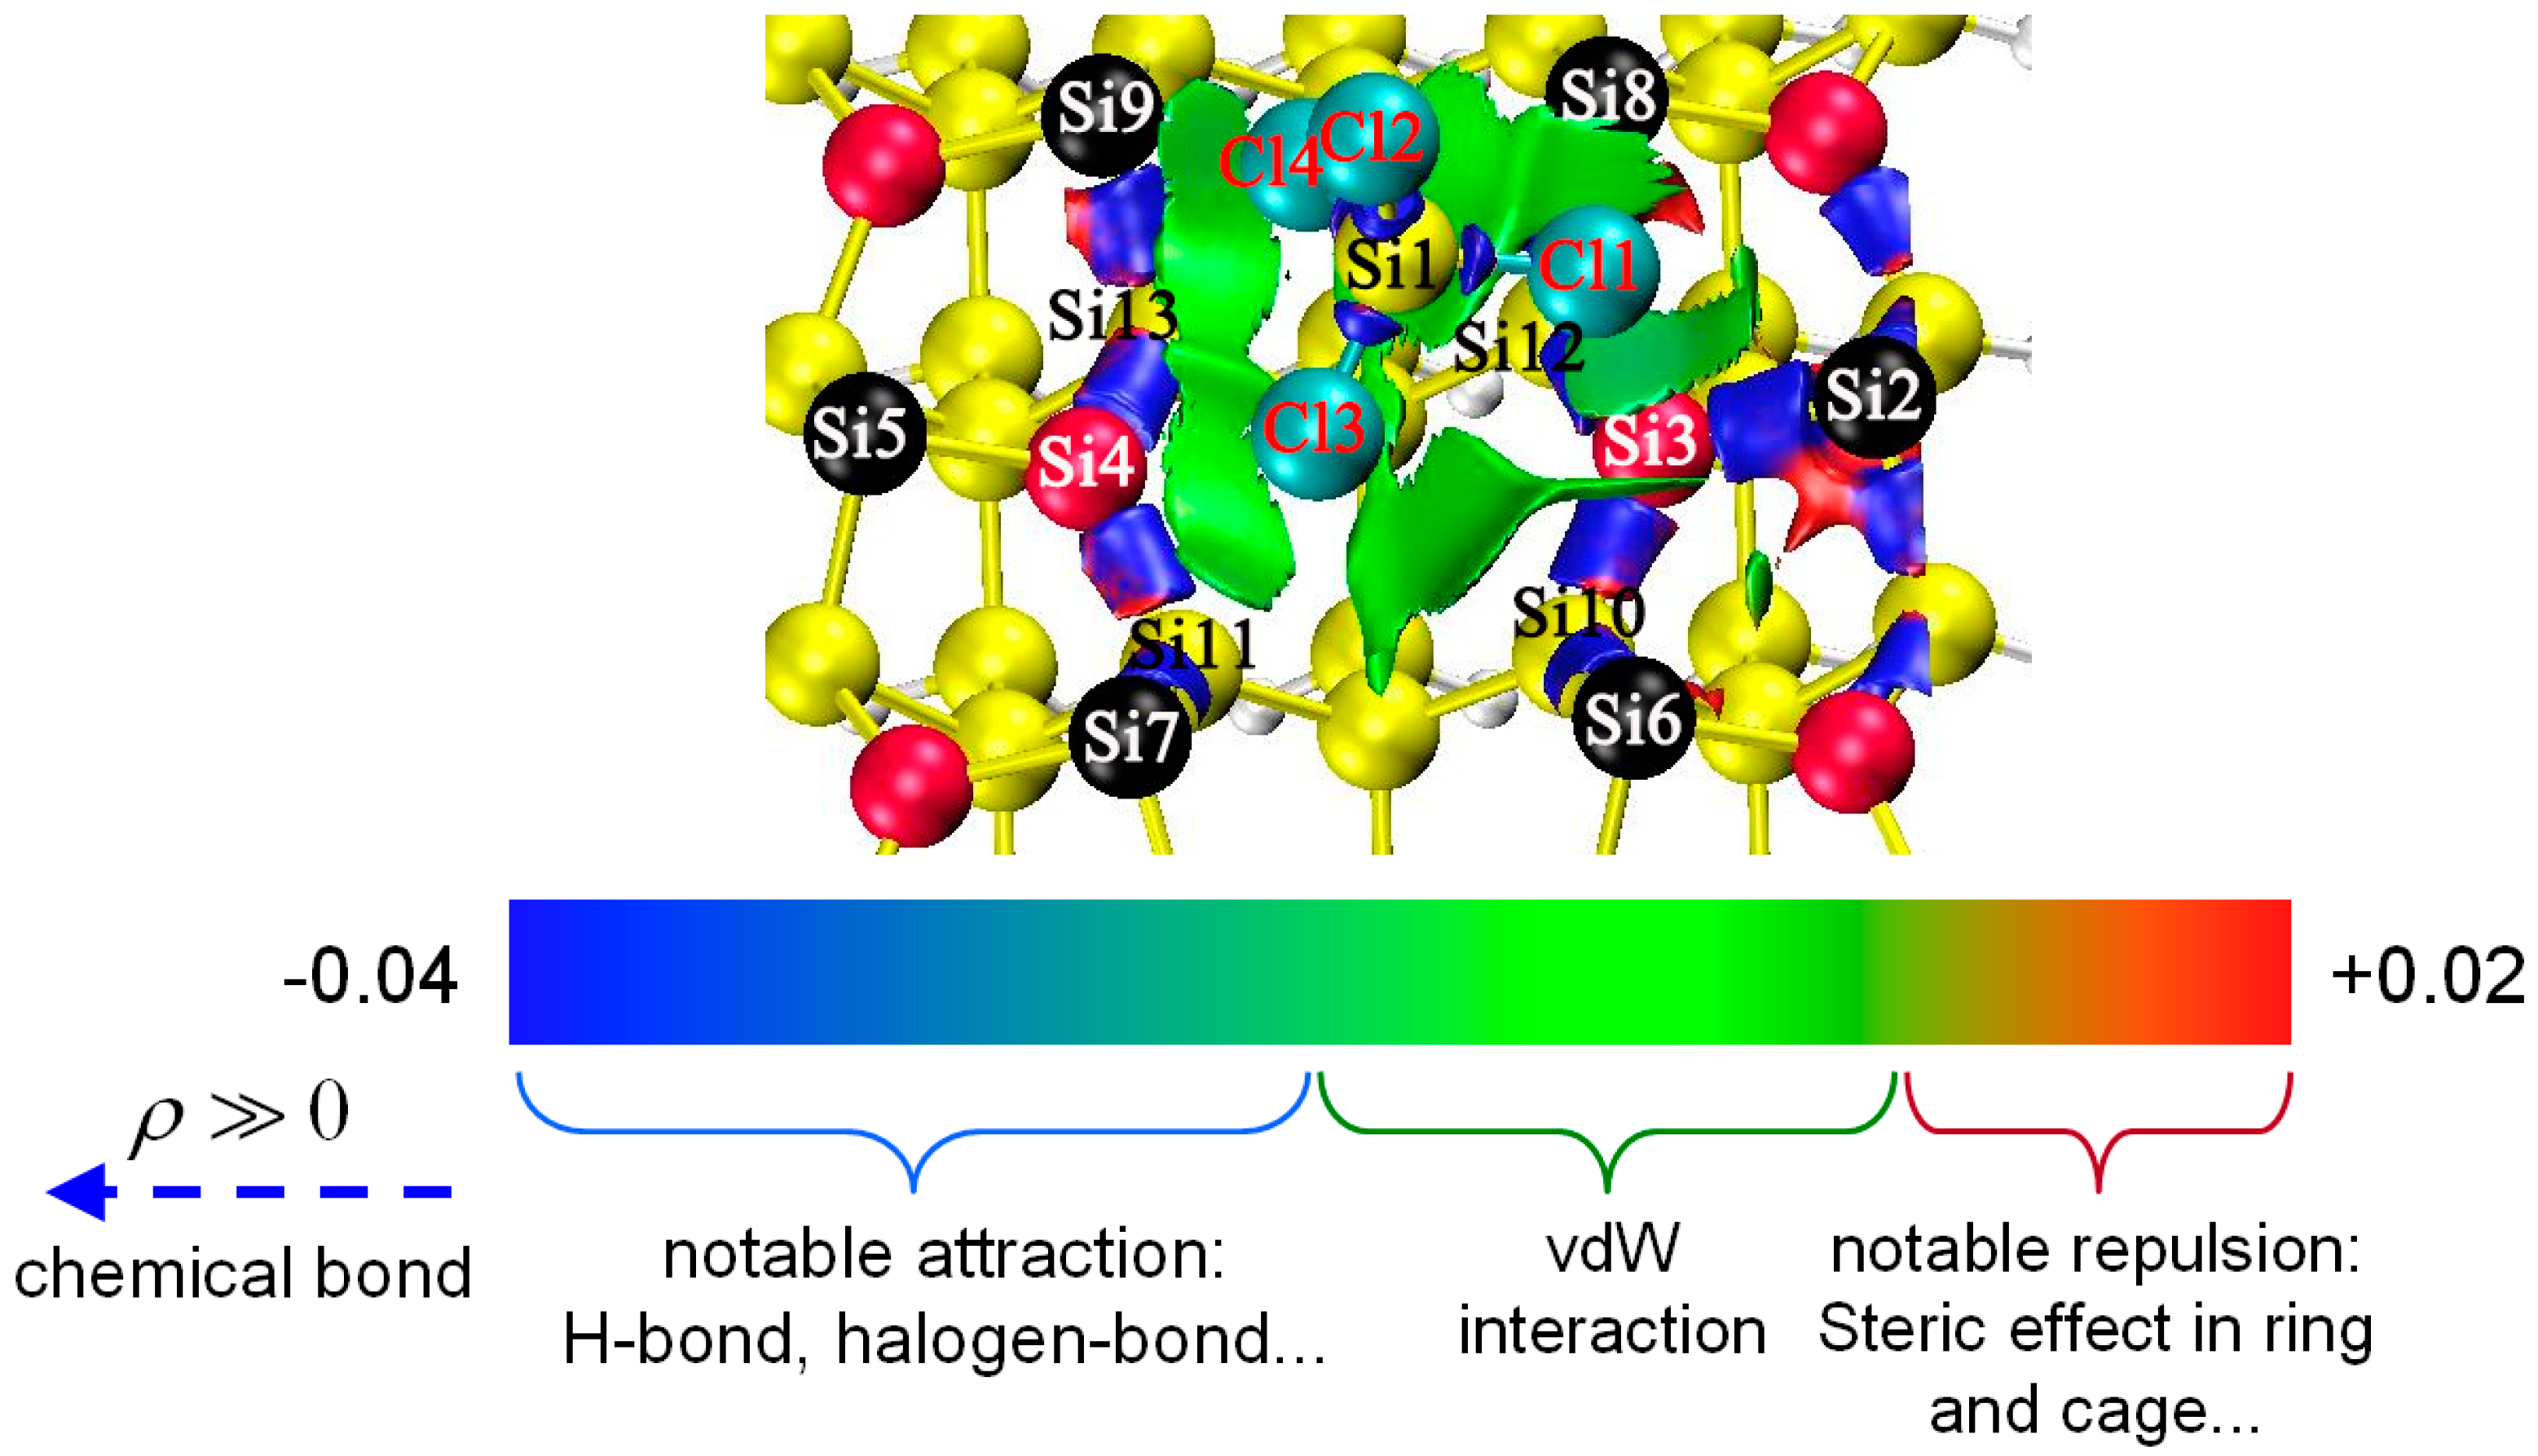
The interaction region indicator (IRI) [46], defined as ρ r / ρ r 1.1 was analyzed to reveal the interaction region of STC with Si(100)-c(4×2) surface. As shown in Figure 5, there is a significantly large green region between the STC molecule and the surface, an explicit indication that VDW1, being a product of physisorption, is formed mainly through van der Waals interaction. The surface sites that show significant interactions with the Cl1 atom are Si2, Si3, Si8, and Si9. Furthermore, the interactions of Cl1 with Si8 and Si9 are all dispersion interactions (green regions). It is worth noting that the IRI isosurface between the Cl1 and Si3 is indigo, which reveals the occurrence of stronger adsorption compared to the green regions due to the mixing of dispersion with electrostatics. The IRI isosurface between Cl1 and Si2 is brown, which means that the interaction is weak as a consequence of the significant steric effect. Moreover, the surface sites that have dispersion interactions with Cl2 and Cl4 are Si4, Si6, Si7, Si8, Si9, Si10, Si11, Si12, and Si13 atoms. There is a “strange” columnar region directly below the Cl2 and Cl3 due to the hybrid effect of the adsorption of the Si atoms of the third and fourth layers on STC and the interaction between two dimers of IR sites (e.g., Si6–Si7).
The contribution ratios of different atomic pairs to the physisorption were analyzed using an independent gradient model based on the Hirshfeld partition (IGMH) [45]. Table 1 shows that consistent with the IRI results, the interaction of Cl1-Si3 is significantly larger than all other interactions. The interaction of Si3-Si7 and Si4-Si9 also plays a non-negligible contribution to the physisorption process. The weak interaction between the Si4 atom and other atoms is not very significant, leading to no difference in the energy between the IM1 with the flipped Si4-Si5 dimer and the VDW1 with the unflipped one. The weak interactions from other atomic pairs have no significant contributions to the process.
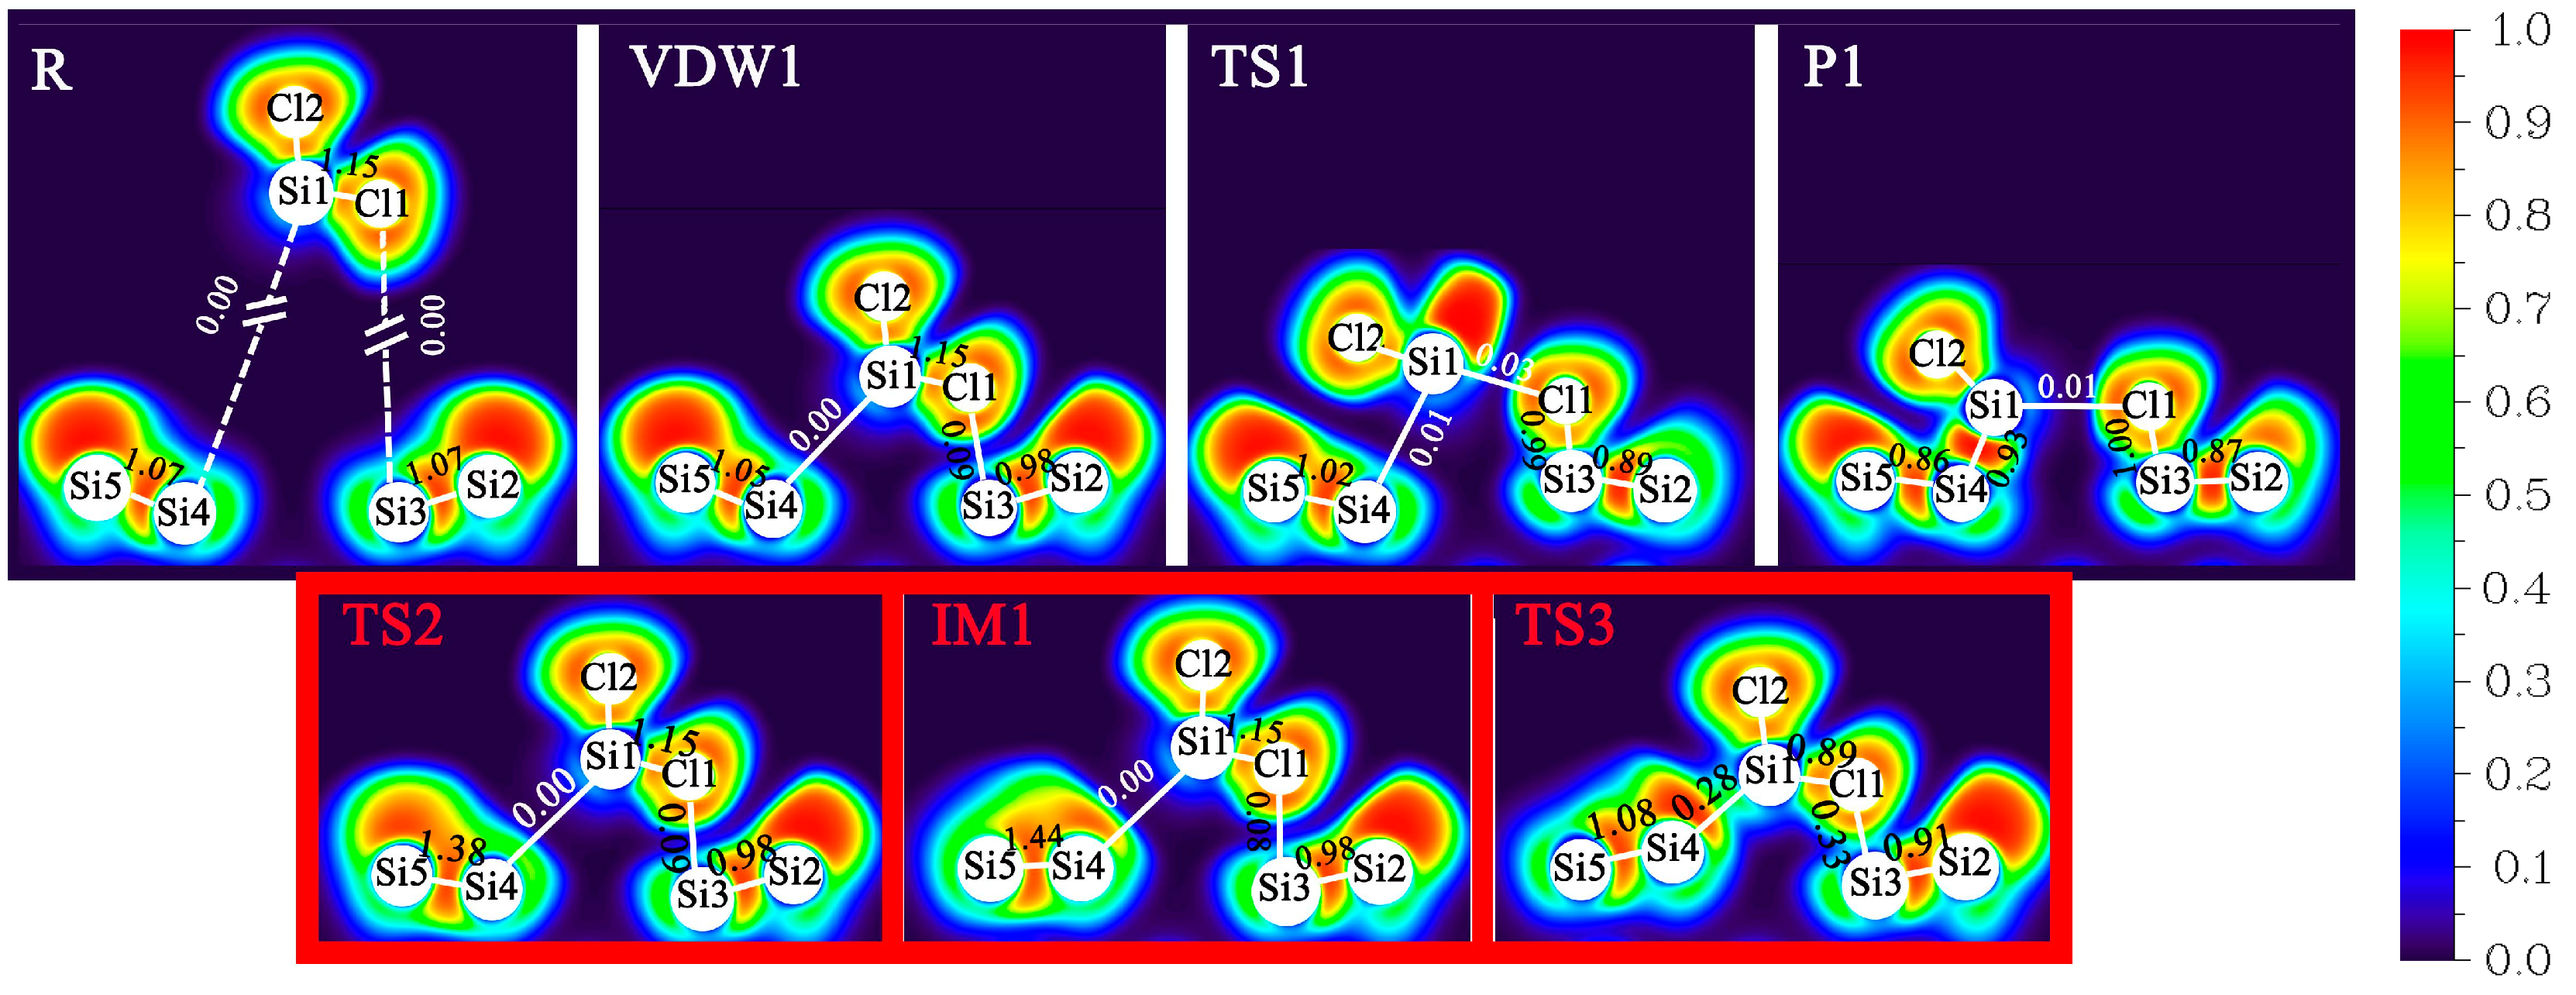
To effectively depict the change in the characteristics of the electronic structure during the DA process, the ELF and MBO were characterized for the minima and transition states along the DA pathway. As shown in Figure 6, the ELF values range from 0.0 to 1.0. A high ELF value is indicative of a high electron localization at that point, and vice versa. MBO is a quantity often used to analyze the multiplicity and the strength of covalent bonds. For the direct DA path (R-VDW1-TS1-P1), from reactant to reactant complex, the Cl1−Si3 MBO value increases from 0.0 to 0.09, an indication of the local concentration of the electrons. While there is no apparent covalent bond between Cl1 and Si3, however, there is a significant electrostatic or induced interaction, consistent with the IRI analysis results. Meanwhile, the Si2-Si3 MBO value decreases slightly due to the local concentration of the electrons between Cl1 and Si3. Then, the MBO value of the Cl1-Si3 bond increases from 0.09 to 0.99, and the ELF value in the TS1 location increases from about 0.2 to 0.8, which suggests that the Cl atoms in the STC form covalent bonds with the inner Si atoms on the surface during the dissociation of STC. Meanwhile, the MBO value of the Si1-Cl1 decreases from 1.15 to 0.03, and the corresponding ELF value of 0.9 decreases to 0.0. Moreover, the MBO and ELF values of Si1-Si4 are almost unchanged in the VDW1 to TS1 process. This can be attributed to the localization of many electrons above the SiCl3 radical during the dissociation of STC and the inability of the SiCl3 radical to interact with Si4, which has localized Lewis base properties. This can also explain the fact that the direct DA process has a high energy barrier. Eventually, the MBO value of Si1-Si4 increases from 0.01 to 0.93, and that of Si4-Si5 decreases from 1.02 to 0.86. The electron localization in Si1-Si4 is significantly enhanced due to the gradual downward movement of the locally concentrated electrons above Si1 and the formation of covalent bonds with Si4 after the disintegration of the Si1-Cl1 bond.
Regarding the DA process with dimer flipping (VDW1-TS2-IM1-TS3-P1), during the first reaction step, from VDW1 to IM1, the localized electrons above Si5 migrate gradually to the vicinity of Si4 because of the flipping of the Si4-Si5 dimer. Thus, there is evidence to infer from the ELF results that there is an alteration in the chemical reactivity of Si4, from a Lewis acid to a Lewis base, which is more likely to adsorb SiCl3 radicals. Meanwhile, the MBO value of Si4-Si5 increases from 1.05 to 1.44 due to the increment in electron density. The MBO and ELF values of Si1-Cl1, Si2-Si3, and Si1-Si4 are almost unperturbed.
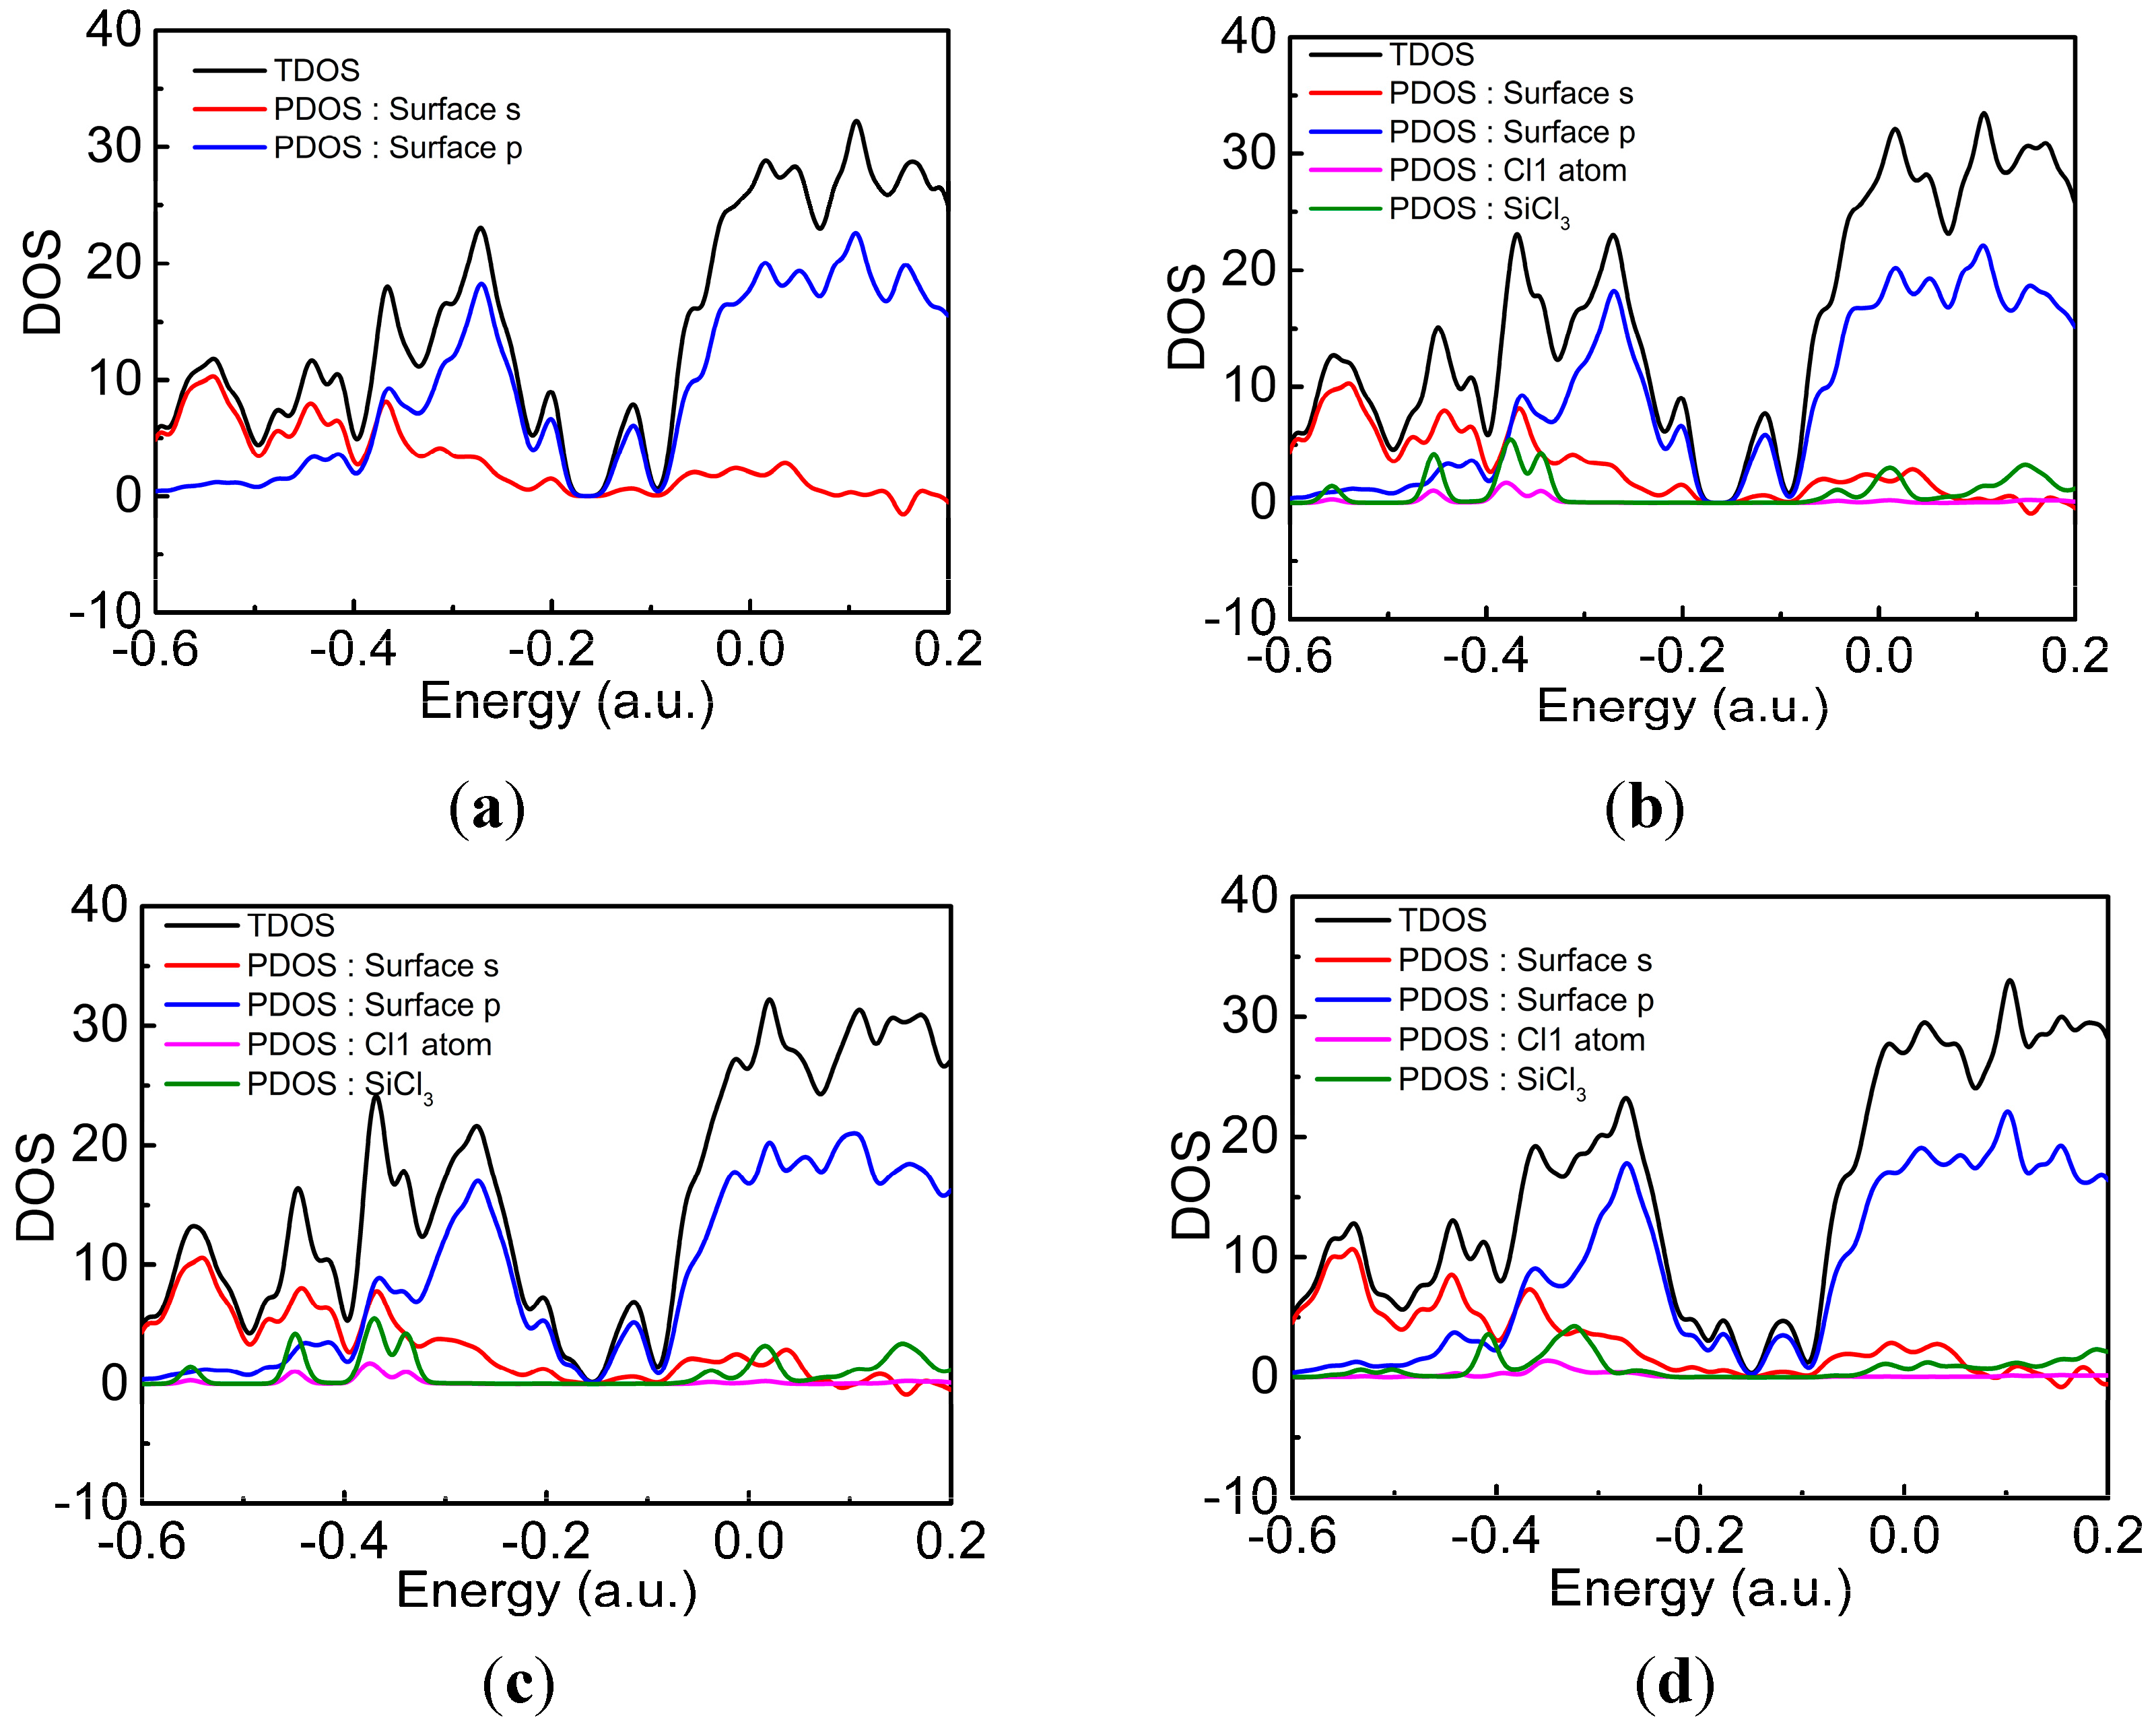
To better comprehend how the STC DA changes the molecular orbital energies and HOMO-LUMO gap, the total densities of states (TDOS) of the surface-adsorbed STC are shown in Figure 7. The partial densities of states (PDOS) of Si1 atom, SiCl3 radical, and the s and p surface orbitals are provided to evaluate their contribution to the TDOS. Figure 7a shows that the major contribution from the s-basis functions of silicon is due to the low-lying molecular orbitals (MO) instead of the frontier MOs. Additionally, the STC orbitals (pink and green curves) are also important components of the low-lying MOs. However, for the MOs around the Fermi level, the p-basis functions of the surface are the most dominant composition. The TDOS and PDOS of VDW1 are plotted in Figure 7b. The TDOS of Si(100) surface after STC physisorption exhibits some changes, which is demonstrated by the increased DOS in the range from −0.55 to −0.45 a.u. The DOS results give evidence to infer that the s orbitals on the surface play a significant role in the physisorption, and the large contribution of the p orbitals is negative for the adsorption. The DOS and PDOS of IM1 are presented in Figure 7c. Compared to the VDW1 DOS results, the PDOS values for IM1 are slightly elevated near the range from −0.55 to −0.45 a.u., such that the TDOS values are significantly higher. Consequently, not only does the hybridization of the SiCl3 and Si1 orbitals with the s orbitals of the Si(100) surface lead to physical adsorption, but it also affects the DA. Finally, the DOS and the PDOS of the P1 are presented in Figure 7d. The figure shows that after DA, the energy of some SiCl3 orbitals is elevated, making the low-lying DOS curve flat. In all the cases, the contribution from the Cl1 atom is generally small. Thus, the adsorption of SiCl3 dominates the adsorption of STC.
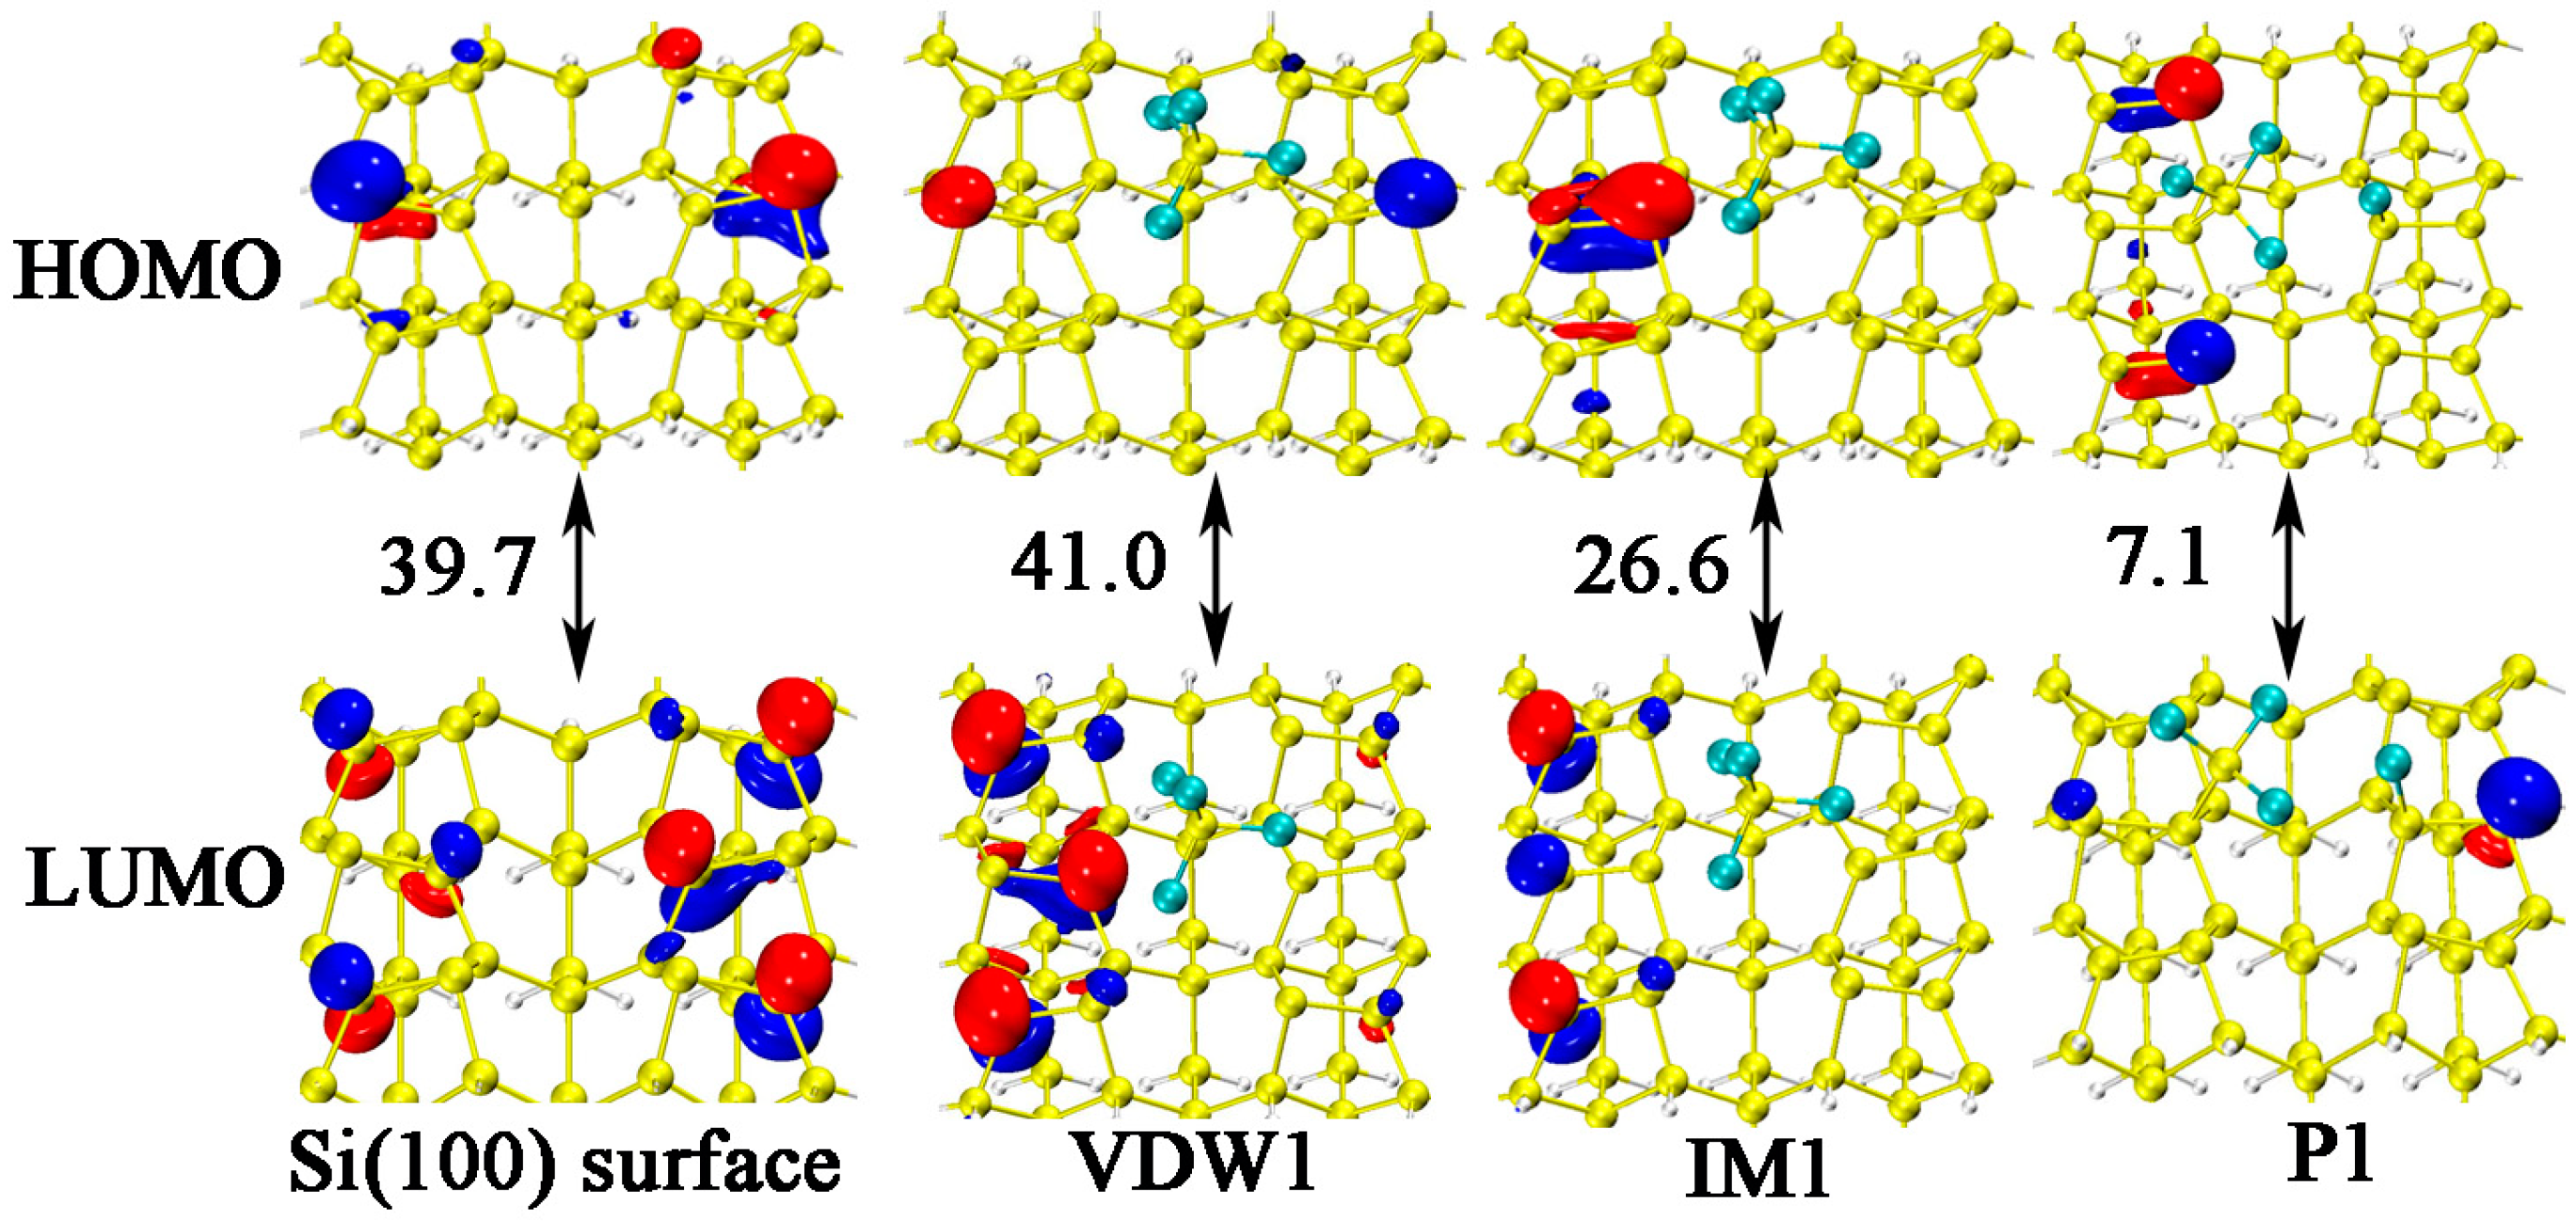
Moreover, the frontier MOs and HOMO-LUMO gaps of the stationary points in the DA at the IR site are shown in Figure 8. It can be clearly seen that the dimer flipping significantly narrows the HOMO-LUMO gap. Comparing the HOMO shape of IM1 and VDW1, the IR site with a flipped dimer is more likely to adsorb the SiCl3 radical. These further explain the lower barrier of the DA after dimer flipping compared to the direct DA.
The MD trajectories of STC DA at the IR site were shown in Movies S1 and S2. The AIMD results are consistent with the mechanisms that are discussed above.

3.3. DA at ID Sites

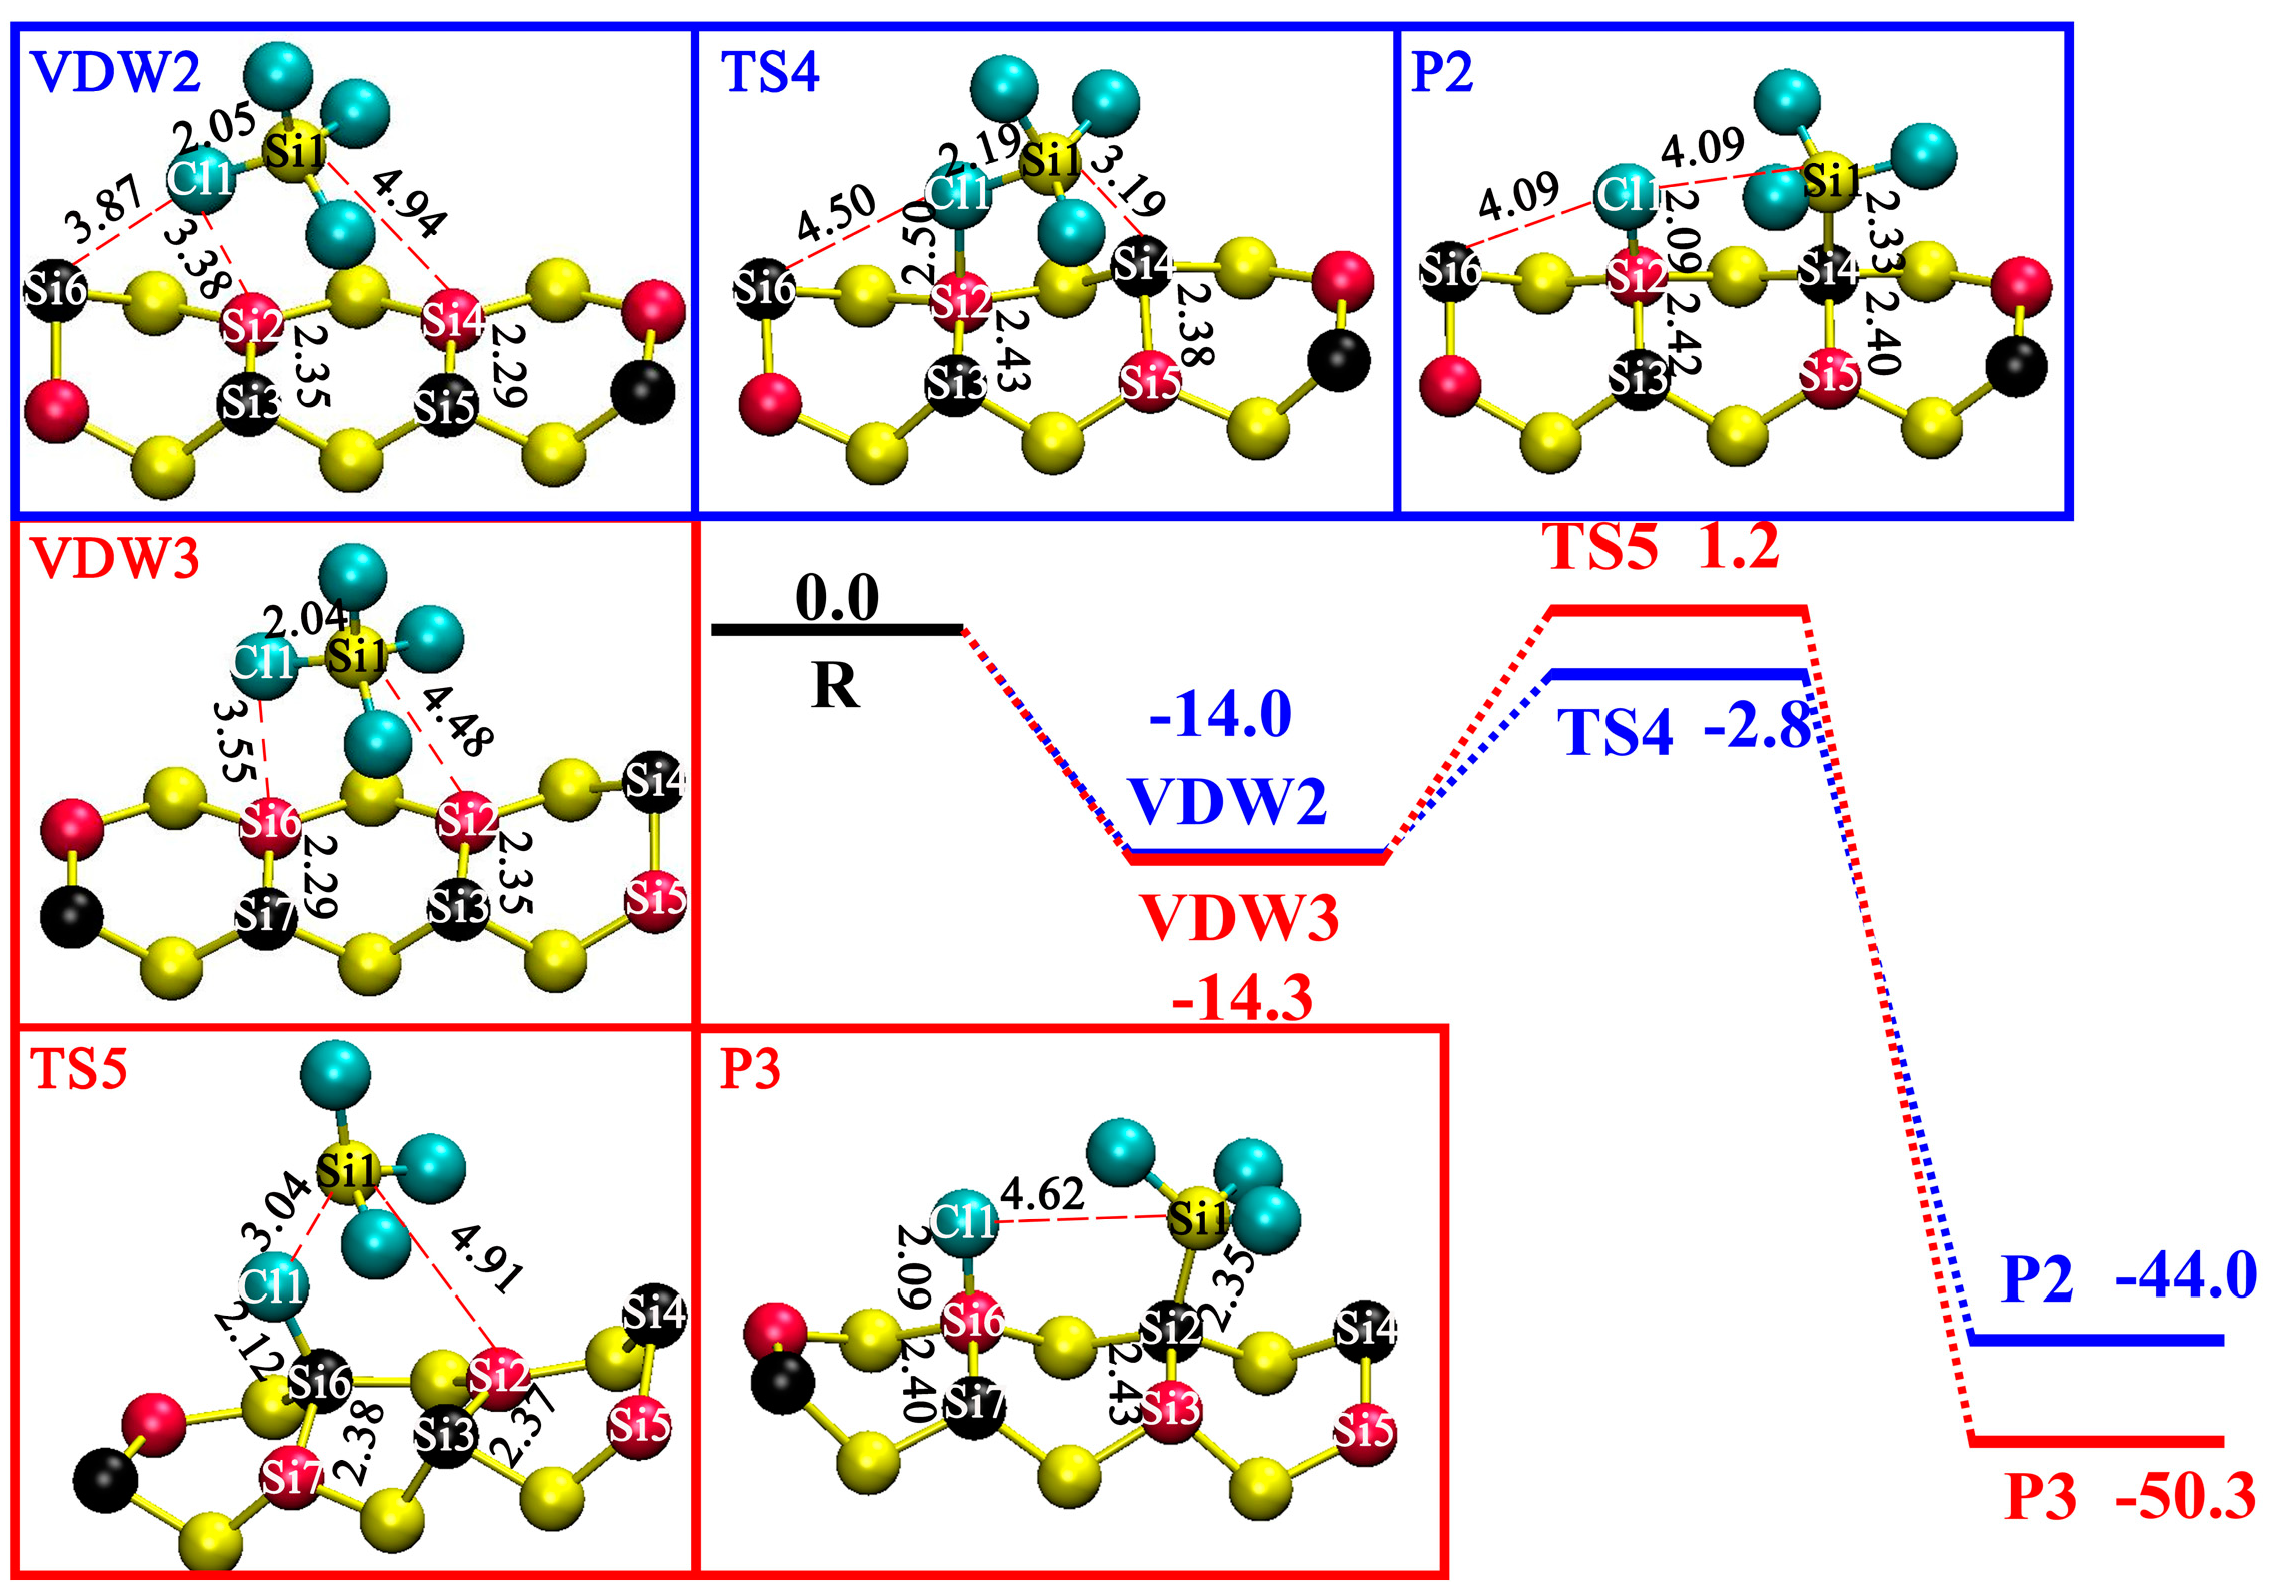
The STC DA reaction pathways at the ID site were identified using first-principles calculations, as shown in Figure 9. On the one hand, VDW2 can be produced through physisorption without barriers. The single point energy of VDW2 is −14.0 kcal/mol. Unlike adsorption at the IR site, the physisorption at the ID site is accompanied by dimer flipping. The outer Si4 site moves inwards, while the inner Si5 site moves outwards. The length of the Cl1-Si2 bond is 3.38 Å, and the length of the Si1-Si4 bond is 4.49 Å. It can be inferred that the Cl atom in the STC dominates the adsorption rather than the SiCl3 radical. The STC is not directly above the ID site, but slightly closer to the Si6 site. As the STC gradually approaches the Si surface, TS4 with a single point energy of −2.8 kcal/mol is formed. The length of the Cl1-Si2 bond is reduced to 2.50 Å, and the length of the Si1-Cl1 bond is elongated from 2.05 to 2.19 Å. The Si4-Si5 dimer flips again. The length of the Si1-Si4 bond is reduced to 3.19 Å, and the Cl1-Si4 bond is elongated from 3.87 to 4.50 Å. Eventually, as the DA at the IR site, the Si1-Cl1 bond becomes completely broken, with the Cl1 atom and SiCl3 radicals being adsorbed on the Si2 and Si4 sites, respectively. Moreover, the VDW3 may be formed by physisorption. With a dimer flipping, the outer Si6 site moves inwards, and the inner Si7 site moves outwards. The VDW3 structure is very similar to that of the VDW2, which leads to their similar single-point energy. However, VDW3 does not interact significantly with the left site like VDW2. Compared to TS4, there is no dimer flipping in the TS5. This is principally attributed to the weak interaction between Si1-Si2, rendering it too weak to counteract the repulsive effect of Si2-Si4. The SiCl3 radicals in P2 and P3 are oriented differently due to the different adjacent sites, which are the outer site in P2 and the inner site in P3. This makes the Si4 in P3 attractive to Si1, but not in P2.
The IRI results from the IGMH analysis of VDW2 and VDW3 are presented in Figure S1 of SI. Like the IR site, the physisorption of the ID site is also formed by dispersion. Moreover, the interaction of the Cl1 atom with the inner site is dominant during the physisorption, as shown in Tables S1 and S2, respectively. Figures S1 and S2 show that the dimer flipping results in the formation of significant dispersion interaction of the STC with many of the Si sites.
The MBO and ELF were performed for the DA at the ID sites. As shown in Figure S3, the Si4-Si5 dimer flipping makes the electron localization near the Si5 atom, which also leads to an increase in the order of the Si4-Si5 bond. From the TS4 results, we can deduce that the Si4-Si5 dimer underwent a second flip during the DA, which resulted in the localization of many electrons at the Si4 atom compared to VDW2. The dimer flipping gives the Si4 the properties of Lewis acid. While the Si2 atom is adsorbing Cl1, Si4 is also adsorbing SiCl3, resulting in a lower barrier than other paths. In addition, from the TS5 results, we can infer that there is no second flip at the Si2-Si3 dimer, resulting in the ELF value at Si2 being very low. Thus, it is difficult for the Si2 site to form strong interaction with the SiCl3 radical. Moreover, the DOS results for the STC DA at ID are shown in Figure S4.
One typical MD trajectory for the reaction at the ID site, VDW2-TS4-P2, was shown in Movie S3. Clearly, the AIMD results are consistent with the mechanism discussed above. However, we did not find another reaction (VDW3-TS5-P3) in the MD trajectory calculations. This is mainly because no dimer flipping occurred at the beginning of the reaction, resulting in the Si2 atom where the adsorbed SiCl3 radical remains at the inner site. In addition, Cl2 and Cl3 atoms are too close to the Si2 and Si3 atoms, which may cause the Si(100) surface to tend to form stronger interactions with the Cl atoms in the radical rather than the Si atom. These findings are consistent with the ELF and IGMH results.

3.4. DA at OD Sites

The DA reaction paths at the IR site are shown in Figure 10. Unlike the adsorption at the IR and ID sites, neither physisorption nor DA at the OD site is accompanied by dimer flipping. VDW4 can be produced through physisorption with single point energy of −8.7 kcal/mol. After a −5.0 kcal/mol transition state, TS6, the Cl1 atom, and the SiCl3 radical are adsorbed onto the Si2 and Si3 atoms, respectively. The barriers for the forward and reverse directions are 3.7 and 55.4 kcal/mol, which are different from the theoretical values of 6.2 and 49.3 kcal/mol by Yadav and Singh [20]. One reason is that different GPW and PAW methods are used. Another reason may be that the current VDW4 structure is different from that given by Yadav and Singh, [20] which causes the discrepancy in the CI-NEB results. Ultimately, the P4 product with a single point energy of −60.4 kcal/mol is generated.
The IRI results analysis of VDW4 is presented in Figure S5. The IGMH analyses are shown in Table S3. Compared to VDW1, VDW2, and VDW3, the IRI isosurface region of VDW4 is smaller and represents fewer surface sites with apparently weak interactions with STC. This is the main reason for the high energy of VDW4.
Furthermore, the ELF and the MBO results, as shown in Figure S6, indicate that as the STC approaches the Si surface, the OD site has a significant covalent effect on both the Cl1 atom and the SiCl3 radical. This makes the occurrence of DA at the OD site easier than at the IR and ID sites.
According to the DOS results of DA at the OD site (shown in Figure S7), the SiCl3 orbitals contribute more to DOS compared to DA at other sites in the region from −0.45 to −0.3 eV, which may explain the easier occurrence of DA at the OD site and the lower P3 energy than the other sites.

4. Conclusions

In this study, we explored and studied all possible absorption sites and DA reaction pathways of the STC molecule on the Si(100)-c(4×2) surface by DFT calculations. Two new pathways, IR and ID, have been successfully derived. The physisorption before DA was also considered and analyzed. In addition, we found a new mechanism for STC DA, which involves a flip of a silicon dimer of the Si surface.
An innovative determination of the physisorption products gave the relative ordering of the single point energy for the three categories, in order of decreasing energy, OD, ID, and IR. The physisorption on different sites was characterized by the IRI and IGMH method. All products of the physisorption are formed mainly through van der Waals interaction. The inner site may form a slightly strong interaction with a Cl atom of STC due to the mixing of dispersion with electrostatics. For the ID and IR sites, in addition to the atoms in the first layer of the Si surface, those in the second and third layers also contribute significantly to the physisorption. Unlike adsorption at the IR and OD sites, the physisorption at the ID site is accompanied by dimer flipping, resulting in the formation of significant dispersion interaction of the STC with many of the Si sites.
After physisorption, the STC molecule could dissociate first by breaking one Si-Cl bond, following which the resulting SiCl3 and Cl fragments are attached to adjacent Si-atom sites. The STC DA on the Si(100) surface may be accompanied by dimer flipping. The relative ordering of the barriers is given for all DA processes, in the order of decreasing barriers, R-VDW4-TS6-P4, R-VDW2-TS4-P2, R-VDW1-TS2-IM1-TS3-P1, R-VDW3-TS5-P3, and R-VDW1-TS1-P1. The dimer flipping reduces the absorption barrier. The reason is that the outer sites in the first layer are more likely to form significant interactions with the SiCl3 radical due to their higher electron density than the inner sites.

Supplementary Materials

The following supporting information can be downloaded at: https://www.mdpi.com/article/10.3390/sym15010213/s1, Figure S1: Isosurface map of IRI of VDW2; Table S1: Percentage contribution of several atoms pairs of VDW2 to the physisorption, obtained by IGMH analysis; Figure S2: Isosurface map of IRI of VDW3; Table S2: Percentage contribution of several atoms pairs of VDW3 to the physisorption, obtained by IGMH analysis; Figure S3: Mayer bond order (MBO) and two-dimensional electron localization function (ELF) color-filled maps for the minima and transition states along the pathway of STC DA at ID site; Figure S4: Total and partial densities of states (DOS) for Si(100)-c(4×2) with STC absorption; Figure S5: Isosurface map of IRI of VDW4; Table S3: Percentage contribution of several atoms pairs of VDW4 to the physisorption, obtained by IGMH analysis; Figure S6: Mayer bond order (MBO) and two-dimensional electron localization function (ELF) color-filled maps for the minima and transition states along the pathway of STC DA at OD site; Figure S7: Total and partial densities of states (DOS) for Si(100)-c(4×2) with STC absorption; Figure S8: The cluster model used for the single point calculations in ORCA; Movies S1 and S2: Two MD trajectories of STC DA at IR site; Movie S3: A MD trajectory of STC DA at ID site. Moreover, the structural coordinates used in DFT calculations are also given.

Author Contributions

Conceptualization, Q.Z. and J.L.; Data curation, J.Z.; Formal analysis, J.Z.; Funding acquisition, Q.Z. and J.L.; Investigation, J.Z.; Methodology, J.L.; Project administration, Q.Z. and J.L.; Resources, J.L.; Software, J.L.; Supervision, Q.Z. and J.L.; Validation, J.Z.; Visualization, J.Z.; Writing—original draft, J.Z.; Writing—review & editing, Q.Z. and J.L. All authors have read and agreed to the published version of the manuscript.

Funding

This work was supported by the National Natural Science Foundation of China (21973009 to JL, 92060101 to QZ), Chongqing Municipal Natural Science Foundation (cstc2019jcyj-msxmX0087 to JL), the Venture and Innovation Support Program for Chongqing Overseas Returnees (cx2021071 to JL), and the Sichuan Province Science Fund for Distinguished Young Scholars (2021JDJQ0011 to QZ).

Data Availability Statement

Not applicable.

Conflicts of Interest

The authors declare no conflict of interest.

References

  1. Parida, B.; Iniyan, S.; Goic, R. A Review of Solar Photovoltaic Technologies. Renew. Sust. Energy Rev. 2011, 15, 1625–1636. [Google Scholar] [CrossRef]
  2. Yadav, S.; Chattopadhyay, K.; Singh, C.V. Solar Grade Silicon Production: A Review of Kinetic, Thermodynamic and Fluid Dynamics Based Continuum Scale Modeling. Renew. Sust. Energy Rev. 2017, 78, 1288–1314. [Google Scholar] [CrossRef]
  3. Andrews, R.N.; Clarson, S.J. Pathways to Solar Grade Silicon. Silicon 2015, 7, 303–305. [Google Scholar] [CrossRef]
  4. Zhang, J.; Zhu, Q.; Li, J. Theoretical Investigations for Kinetics of the Chemical Reactions: H + SiClx (X = 1, 2, 3). J. Phys. Chem. A 2022, 126, 1689–1700. [Google Scholar] [CrossRef]
  5. Pandey, A.K.; Tyagi, V.V.; Selvaraj, J.A.L.; Rahim, N.A.; Tyagi, S.K. Recent Advances in Solar Photovoltaic Systems for Emerging Trends and Advanced Applications. Renew. Sust. Energy Rev. 2016, 53, 859–884. [Google Scholar] [CrossRef]
  6. Ramstad, A.; Brocks, G.; Kelly, P.J. Theoretical Study of the Si(100) Surface Reconstruction. Phys. Rev. B 1995, 51, 14504–14523. [Google Scholar] [CrossRef] [Green Version]
  7. Wolkow, R.A. Direct Observation of an Increase in Buckled Dimers on Si(001) at Low Temperature. Phys. Rev. Lett. 1992, 68, 2636–2639. [Google Scholar] [CrossRef]
  8. Guo, C.-S.; Hermann, K.; Zhao, Y. Dynamics and Energetics of Reconstruction at the Si(100) Surface. J. Phys. Chem. C 2014, 118, 25614–25619. [Google Scholar] [CrossRef]
  9. Manzano, C.; Soe, W.H.; Kawai, H.; Saeys, M.; Joachim, C. Origin of the Apparent (2×1) Topography of the Si(100)-c(4×2) Surface Observed in Low-Temperature STM Images. Phys. Rev. B 2011, 83, 201302. [Google Scholar] [CrossRef]
  10. Dürr, M.; Höfer, U. Dissociative Adsorption of Molecular Hydrogen on Silicon Surfaces. Surf. Sci. Rep. 2006, 61, 465–526. [Google Scholar] [CrossRef]
  11. Lyubinetsky, I.; Dohnálek, Z.; Choyke, W.J.; Yates, J.T. Cl2 Dissociation on Si(100)-(2×1) a Statistical Study by Scanning Tunneling Microscopy. Phys. Rev. B 1998, 58, 7950–7957. [Google Scholar] [CrossRef]
  12. Owen, J.H.G. Competing Interactions in Molecular Adsorption: NH3 on Si(001). J. Phys. Condens. Matter 2009, 21, 443001. [Google Scholar] [CrossRef]
  13. Wang, C.G.; Huang, K.; Ji, W. Dissociative Adsorption of CH3X (X = Br and Cl) on a Silicon(100) Surface Revisited by Density Functional Theory. J. Chem. Phys. 2014, 141, 174701. [Google Scholar]
  14. Lim, T.B.; McNab, I.R.; Polanyi, J.C.; Guo, H.; Ji, W. Multiple Pathways of Dissociative Attachment: CH3Br on Si(100)-2×1. J. Am. Chem. Soc. 2011, 133, 11534–11539. [Google Scholar] [CrossRef]
  15. Guo, Q.; Sterratt, D.; Williams, E.M. Negative Ion Formation from SiCl4 Adsorbed on Si(100). Surf. Sci. 1996, 352-354, 327–331. [Google Scholar] [CrossRef]
  16. Gao, Q.; Dohnalek, Z.; Cheng, C.C.; Choyke, W.J.; Yates, J.T. The Adsorption and Surface Reaction of SiCl4 on Si(100)-(2×1). Surf. Sci. 1994, 302, 1–9. [Google Scholar] [CrossRef]
  17. Tossell, J.A. Theoretical Studies on the Adsorption of SiCl4 on the Si(100) 2×1 Surface. Surf. Sci. 1999, 431, 186–192. [Google Scholar] [CrossRef]
  18. Hall, M.A.; Mui, C.; Musgrave, C.B. DFT Study of the Adsorption of Chlorosilanes on the Si(100)-2×1 Surface. J. Phys. Chem. B 2001, 105, 12068–12075. [Google Scholar] [CrossRef]
  19. Chan, S.P.; Liu, Z.F.; Lau, W.M.; Tse, J.S. SiCl4 Desorption in Chlorine Etching of Si(100)—A First Principles Study. Surf. Sci. 1999, 432, 125–138. [Google Scholar] [CrossRef]
  20. Yadav, S.; Singh, C.V. Molecular Adsorption and Surface Formation Reactions of HCl, H2 and Chlorosilanes on Si(100)-c(4×2) with Applications for High Purity Silicon Production. Appl. Surf. Sci. 2019, 475, 124–134. [Google Scholar] [CrossRef]
  21. Henkelman, G.; Uberuaga, B.P.; Jónsson, H. A Climbing Image Nudged Elastic Band Method for Finding Saddle Points and Minimum Energy Paths. J. Chem. Phys. 2000, 113, 9901–9904. [Google Scholar] [CrossRef]
  22. Hwang, G.S. A Channel for Dimer Flipping on the Si(001) Surface. Surf. Sci. 2000, 465, L789–L793. [Google Scholar] [CrossRef]
  23. Hata, K.; Sainoo, Y.; Shigekawa, H. Atomically Resolved Local Variation of the Barrier Height of the Flip-Flop Motion of Single Buckled Dimers of Si(100). Phys. Rev. Lett. 2001, 86, 3084–3087. [Google Scholar] [CrossRef] [Green Version]
  24. Sweetman, A.; Jarvis, S.; Danza, R.; Bamidele, J.; Gangopadhyay, S.; Shaw, G.A.; Kantorovich, L.; Moriarty, P. Toggling Bistable Atoms Via Mechanical Switching of Bond Angle. Phys. Rev. Lett. 2011, 106, 136101. [Google Scholar] [CrossRef]
  25. Buehler Emily, J.; Boland John, J. Dimer Preparation That Mimics the Transition State for the Adsorption of H2 on the Si(100)-2×1 Surface. Science 2000, 290, 506–509. [Google Scholar] [CrossRef]
  26. Yu, S.-Y.; Kim, Y.-S.; Kim, H.; Koo, J.-Y. Influence of Flipping Si Dimers on the Dissociation Pathways of Water Molecules on Si(001). J. Phys. Chem. C 2011, 115, 24800–24803. [Google Scholar] [CrossRef]
  27. Harikumar, K.R.; Lim, T.; McNab, I.R.; Polanyi, J.C.; Zotti, L.; Ayissi, S.; Hofer, W.A. Dipole-Directed Assembly of Lines of 1,5-Dichloropentane on Silicon Substrates by Displacement of Surface Charge. Nat. Nanotechnol. 2008, 3, 222–228. [Google Scholar] [CrossRef]
  28. Zhang, J.; Dolg, M. Abcluster: The Artificial Bee Colony Algorithm for Cluster Global Optimization. Phys. Chem. Chem. Phys. 2015, 17, 24173–24181. [Google Scholar] [CrossRef]
  29. Zhang, J.; Dolg, M. Global Optimization of Clusters of Rigid Molecules Using the Artificial Bee Colony Algorithm. Phys. Chem. Chem. Phys. 2016, 18, 3003–3010. [Google Scholar] [CrossRef]
  30. Perdew, J.P.; Burke, K.; Ernzerhof, M. Generalized Gradient Approximation Made Simple. Phys. Rev. Lett. 1996, 77, 3865–3868. [Google Scholar] [CrossRef] [Green Version]
  31. Grimme, S. Semiempirical Gga-Type Density Functional Constructed with a Long-Range Dispersion Correction. J. Comput. Chem. 2006, 27, 1787–1799. [Google Scholar] [CrossRef] [PubMed]
  32. Kühne, T.D.; Iannuzzi, M.; Del Ben, M.; Rybkin, V.V.; Seewald, P.; Stein, F.; Laino, T.; Khaliullin, R.Z.; Schütt, O.; Schiffmann, F.; et al. CP2K: An Electronic Structure and Molecular Dynamics Software Package—Quickstep: Efficient and Accurate Electronic Structure Calculations. J. Chem. Phys. 2020, 152, 194103. [Google Scholar] [CrossRef] [PubMed]
  33. Lippert, B.G.; Parrinello, J.H.; Michele, A. Hybrid Gaussian and Plane Wave Density Functional Scheme. Mol. Phys. 1997, 92, 477–488. [Google Scholar] [CrossRef]
  34. VandeVondele, J.; Hutter, J. Gaussian Basis Sets for Accurate Calculations on Molecular Systems in Gas and Condensed Phases. J. Chem. Phys. 2007, 127, 114105. [Google Scholar] [CrossRef] [PubMed] [Green Version]
  35. Goedecker, S.; Teter, M.; Hutter, J. Separable Dual-Space Gaussian Pseudopotentials. Phys. Rev. B 1996, 54, 1703–1710. [Google Scholar] [CrossRef] [Green Version]
  36. VandeVondele, J.; Hutter, J. An Efficient Orbital Transformation Method for Electronic Structure Calculations. J. Chem. Phys. 2003, 118, 4365–4369. [Google Scholar] [CrossRef] [Green Version]
  37. Fletcher, R.; Reeves, C.M. Function Minimization by Conjugate Gradients. Comput. J. 1964, 7, 149–154. [Google Scholar] [CrossRef] [Green Version]
  38. Lu, T.; Liu, Z.; Chen, Q. Comment on “18 and 12—Member Carbon Rings (Cyclo[N]Carbons)—A Density Functional Study”. Mater. Sci. Eng. B 2021, 273, 115425. [Google Scholar] [CrossRef]
  39. He, G.; Ma, J.; He, H. Role of Carbonaceous Aerosols in Catalyzing Sulfate Formation. ACS Catal. 2018, 8, 3825–3832. [Google Scholar] [CrossRef]
  40. Neese, F.; Wennmohs, F.; Becker, U.; Riplinger, C. The Orca Quantum Chemistry Program Package. J. Chem. Phys. 2020, 152, 224108. [Google Scholar] [CrossRef]
  41. Neese, F.; Wennmohs, F.; Hansen, A.; Becker, U. Efficient, Approximate and Parallel Hartree–Fock and Hybrid DFT Calculations. A ‘Chain-of-Spheres’ Algorithm for the Hartree–Fock Exchange. Chem. Phys. 2009, 356, 98–109. [Google Scholar] [CrossRef]
  42. Neese, F. An Improvement of the Resolution of the Identity Approximation for the Formation of the Coulomb Matrix. J. Comput. Chem. 2003, 24, 1740–1747. [Google Scholar] [CrossRef]
  43. Becke, A.D.; Edgecombe, K.E. A Simple Measure of Electron Localization in Atomic and Molecular Systems. J. Chem. Phys. 1990, 92, 5397–5403. [Google Scholar] [CrossRef]
  44. Mayer, I. Charge, Bond Order and Valence in the Ab Initio SCF Theory. Chem. Phys. Lett. 1983, 97, 270–274. [Google Scholar] [CrossRef]
  45. Lu, T.; Chen, Q. Independent Gradient Model Based on Hirshfeld Partition: A New Method for Visual Study of Interactions in Chemical Systems. J. Comput. Chem. 2022, 43, 539–555. [Google Scholar] [CrossRef]
  46. Lu, T.; Chen, Q. Interaction Region Indicator: A Simple Real Space Function Clearly Revealing Both Chemical Bonds and Weak Interactions. Chem. Methods 2021, 1, 231–239. [Google Scholar] [CrossRef]
  47. Lu, T.; Chen, F. Multiwfn: A Multifunctional Wavefunction Analyzer. J. Comput. Chem. 2012, 33, 580–592. [Google Scholar] [CrossRef] [PubMed]
  48. Bussi, G.; Donadio, D.; Parrinello, M. Canonical Sampling through Velocity Rescaling. J. Chem. Phys. 2007, 126, 014101. [Google Scholar] [CrossRef] [PubMed] [Green Version]
  49. Pino-Rios, R.; Inostroza, D.; Cárdenas-Jirón, G.; Tiznado, W. Orbital-Weighted Dual Descriptor for the Study of Local Reactivity of Systems with (Quasi-) Degenerate States. J. Phys. Chem. A 2019, 123, 10556–10562. [Google Scholar] [CrossRef]
  50. Clark, T.; Hennemann, M.; Murray, J.S.; Politzer, P. Halogen Bonding: The σ-Hole. J. Mol. Model. 2007, 13, 291–296. [Google Scholar] [CrossRef]
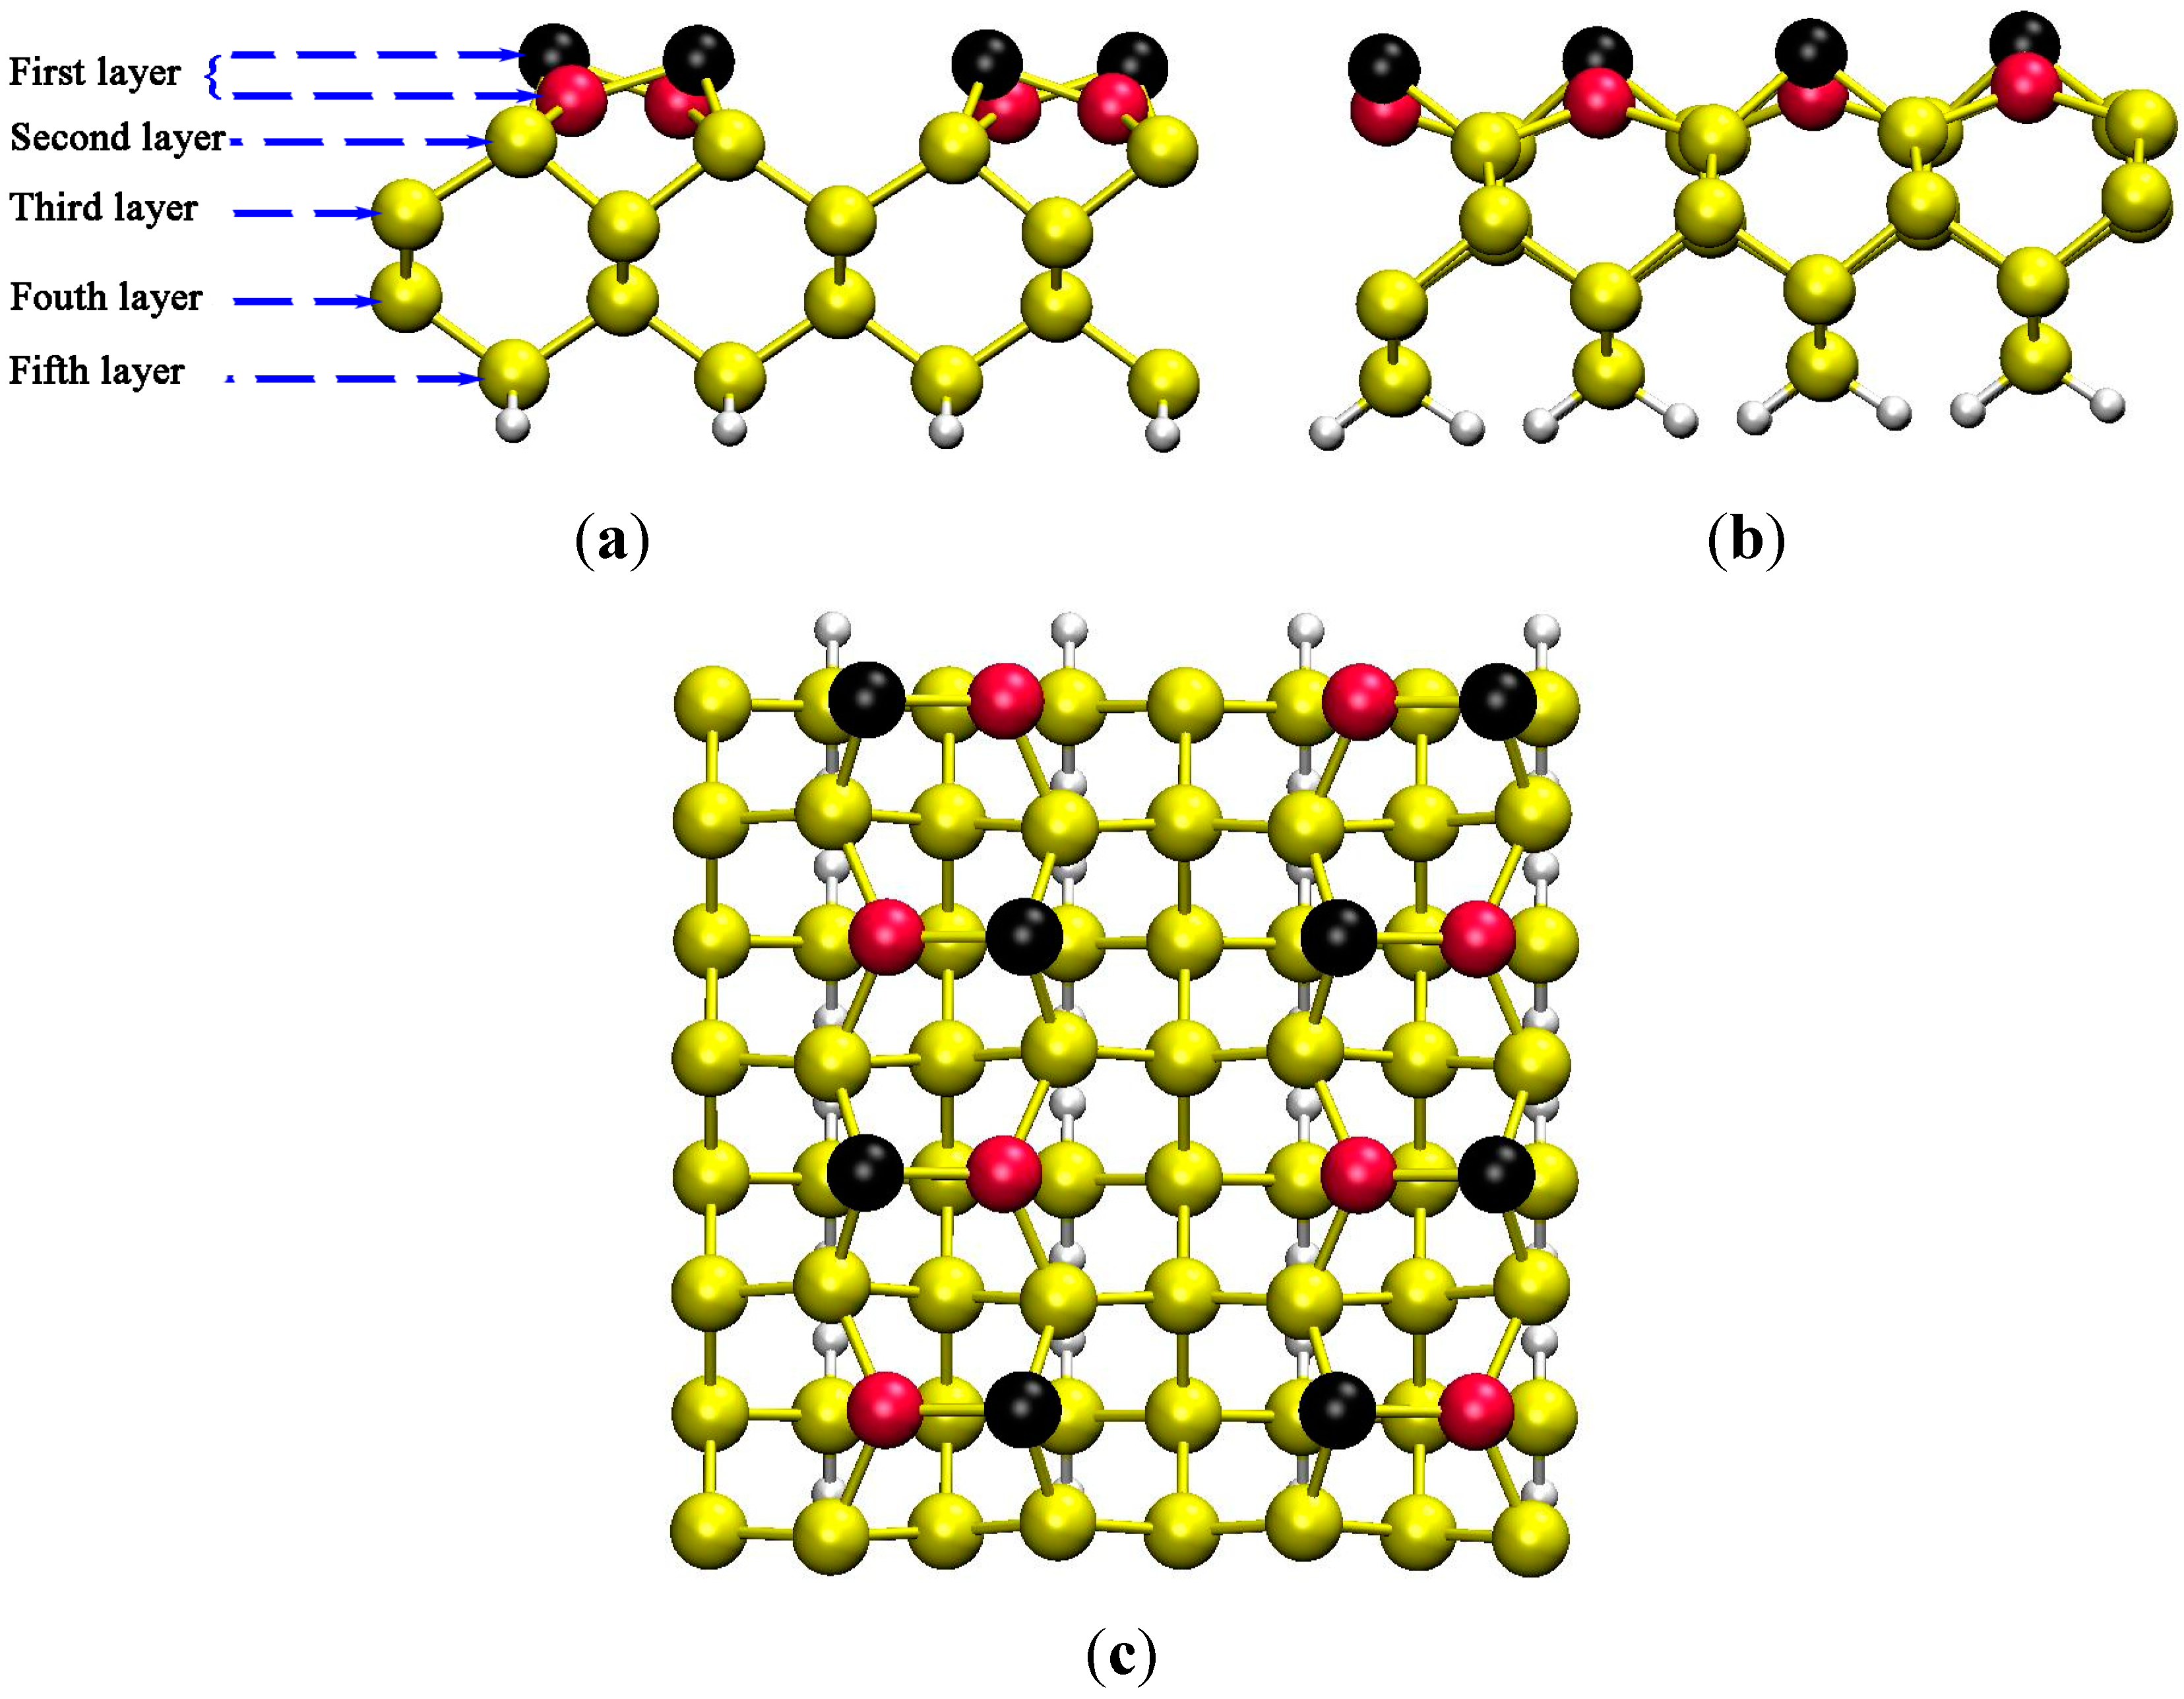
Figure 1. Front (a), side (b), and top (c) views of the supercell used for the GPW calculations. Yellow, white, and cyan circles denote bulk Si, H, and Cl atoms, respectively. Black and red circles denote the outer and inner Si atoms on the first layer of the Si(100) surface.
Symmetry 15 00213 g001
Figure 2. Isosurface map of the dual descriptor with isovalue 0.0004 a.u. for (a) Si(100)-c(4×2) and (b) STC. Green and blue isosurfaces correspond to positive and negative parts of the dual descriptor, respectively.
Symmetry 15 00213 g002
Figure 3. The schematic drawing of the DA mechanism.
Symmetry 15 00213 g003
Figure 4. Energy profiles (kcal/mol) of the reaction pathway of STC DA at the IR site as well as the optimized geometries of the reactant, TSs, IM, and product. All lengths are given in Å.
Symmetry 15 00213 g004
Figure 5. Isosurface map of IRI of VDW1. The Isovalue of IRI is chosen to be 1.0.
Symmetry 15 00213 g005
Figure 6. Mayer bond order (MBO) and two-dimensional electron localization function (ELF) color-filled maps for the minima and transition states along the pathway of STC DA at the IR site.
Symmetry 15 00213 g006
Figure 7. Total and partial densities of states (DOS) for Si(100)-c(4×2) with STC absorption. (a) Si surface; (b) VDW1; (c) IM1; (d) P1.
Symmetry 15 00213 g007
Figure 8. The frontier MOs and HOMO-LUMO gaps (kcal/mol) of the stationary points in STC DA at the IR site.
Symmetry 15 00213 g008
Figure 9. Energy profiles (kcal/mol) of the reaction pathway of STC DA at the ID site.
Symmetry 15 00213 g009
Figure 10. Energy profiles (kcal/mol) of the reaction pathway of STC DA at OD site.
Symmetry 15 00213 g010
Table 1. Percentage contribution of several atoms pairs of VDW1 to the physisorption, obtained by IGMH analysis.
PairsPercentage
Cl1-Si313.1%
Cl3-Si78.1%
Cl4-Si98.1%
Cl1-Si26.7%
Cl3-Si115.9%
Cl4-Si135.9%
Cl3-Si43.9%
Cl4-Si43.9%
Cl1-Si313.1%
Disclaimer/Publisher’s Note: The statements, opinions and data contained in all publications are solely those of the individual author(s) and contributor(s) and not of MDPI and/or the editor(s). MDPI and/or the editor(s) disclaim responsibility for any injury to people or property resulting from any ideas, methods, instructions or products referred to in the content.