Article

Approximation Algorithm for X-ray Imaging Optimization of High-Absorption Ratio Materials

1
School of Physics, Changchun University of Science and Technology, Changchun 130022, China
2
Electronic Information Engineering College, Changchun University, Changchun 130022, China
*
Authors to whom correspondence should be addressed.
Symmetry 2023, 15(1), 44; https://doi.org/10.3390/sym15010044
Submission received: 11 November 2022 / Revised: 14 December 2022 / Accepted: 19 December 2022 / Published: 24 December 2022

Abstract

:
In the application of X-ray industrial flaw detection, the exposure parameters directly affect the image quality. The voltage of the tube is the most important factor, which is difficult to be accurately calculated. Especially in the detection of a workpiece composed of both high absorption coefficient and low absorption coefficient materials, the improper symmetric balance of the tube voltage would lead to an overexposure or underexposure phenomenon. In this paper, based on the X-ray absorption model, combined with the performance of the X-ray imaging detector, and taking the optimal symmetry and contrast as the model constraint condition, the key factors of high absorption ratio material imaging are decomposed. Through expansion and iteration, the calculation process is simplified, the optimal imaging convergence surface is found, and then the optimal energy input conditions of high absorptivity materials are obtained and symmetrically balanced. As a result, this paper solves the problem of fast selection and symmetric factor chosen of the optimal tube voltage when imaging materials with high absorption ratios. It reduces the subsequent complications of the X-ray image enhancement process and obtains a better image quality. Through experimental simulation and measurement verification, the error between the theoretical calculation results and the measured data was better than 5%.

1. Introduction

In the field of industrial flaw detection, an X-ray can penetrate the surface of the device, complete the internal structure detection, and realize material analysis and damage judgment under the premise of nondestructive conditions. It is not susceptible to environmental influences, so it has been widely used in many fields. However, in many cases, the material detected has a large difference in the X-ray absorption ratio of a variety of basic constituent elements, i.e., the structure of the material with a high-absorption ratio. In complex workpieces such as power cables, aircraft guidance actuators, automobiles, and aero engines, there are many high-absorption ratio structures with high-density and low-density mixing, which makes the imaging threshold difficult to balance, and the details of flaw detection imaging blurred, which needs to be optimized and improved [1,2,3,4].
For X-ray imaging technology, the image quality is related to the ray energy, imaging detectors, object materials, and structures. For complex workpieces, the completion of structural information projection is the key to achieving high-precision imaging of materials with high-absorption ratios in the case of the same imaging major devices and a limited dynamic range of energy [5].
At present, the X-ray imaging detection technology for objects with high absorption ratios usually adopts methods such as the compensation method, partial transillumination, photoelectric imaging device with large charge capacity, high dynamic range, variable voltage imaging, etc., with problems such as full visual effects of images, increased equipment cost, lack of versatility, etc. Therefore, in order to improve the quality of X-ray imaging, researchers have carried out certain work that has been applied in the fields of medicine and industrial inspection. For example, Haidekker et al. [6] proposed a method to fuse multiple exposure images into a composite image and then restore the mathematical framework of absorbance from the composite image, thus expanding the dynamic range of X-ray imaging and improving the imaging quality. Cao et al. [7,8,9,10] proposed their own deep learning methods for the etiological screening of lung lesions in chest X-ray imaging, which improved the efficiency and quality of medical X-ray imaging screening for etiology. Sniureviciute et al. [11] conducted research on reducing patient dose and optimizing imaging quality in X-ray imaging medical diagnosis. Mehranian et al. [12] studied the effect of the roughness of the anode surface on the quality of X-ray imaging. Lin et al. [13] first used the gray relational analysis method to select the welding process parameters that played a key role in the GMA welding quality as the prediction input and used the neural network algorithm to predict and model the functional relationship between it and the welding quality index, so that the process parameters are optimized, and the imaging efficiency and quality are improved. Park et al. [14] proposed a method of using a neural network to establish a prediction model for the tensile strength of aluminum alloy laser welding. The process parameters that play a key role in strength have achieved good optimization results. Chiang et al. [15] proposed a method to improve the yield rate of the chromium thin film sputtering process in the manufacturing process of color filters. Firstly, principal component analysis was used to determine the main parameters of the chromium thin film sputtering process, and then the entropy measurement method was used to obtain the weight of each process parameter, and finally used, the method of combining TM and GRA to optimize the process, and achieved a good optimization effect. Sanchez-Gonzalez et al. [16] applied machine learning methods to predict the pulse characteristics of X-ray free electron lasers and diagnosed the intensity, spectral, and time profiles of X-rays, and predicted the pulse characteristics more accurately; Ivashchuk et al. [17] first proposed the concept of working with pyroelectric accelerators and X-ray sources in a pulse mode, in the proof-of-principle experiment, the X-ray radiation power in the pulse mode can be increased by more than two orders of magnitude, which has certain research value for fast X-ray imaging, but the technology is demanding for experimental conditions and difficult to achieve engineering applications. Yang et al. [18] proposed an X-ray image dynamic range extension method, which can expand the gray dynamic range of the imaging equipment by reconstructing a wide dynamic range image of the target image taken at two different tube voltages, but multiple measurements under different tube voltages will extend the test time and reduce the detection efficiency. Zhou [19] used the BP neural network algorithm to establish an X-ray imaging quality prediction model, and based on this model, the key parameter combination of optimal imaging quality was solved to improve the imaging quality of X-ray equipment, but they only considered film imaging, and the composition of the test sample was relatively simple. Zhou et al. [20] applied X-ray imaging technology in the quality inspection of tensile clips for the two parts of the tension clamp aluminum sleeve and steel anchor pipe by analyzing the X-ray absorption coefficient of these materials and the thickness of the X-ray through, it was proved that when the ray source emits the appropriate ray energy, it is feasible to use X-ray to perform nondestructive testing of the internal crimping quality of the tension clamps, but there is a lack of a rapid calculation model. The research of Yuan et al. [21] introduced the application methods and steps of X-ray imaging technology in cable and accessory defect detection, and in the process of using X-ray imaging technology to shoot high-voltage cables, a 160 kV tube voltage ray source and a 3 mA tube current were selected to analyze the original X-ray images taken. The DR board has been fully exposed, and its grayscale window width is above 50,000, retaining a wealth of grayscale information, then the original image is transformed by grayscale, histogram correction, Butterworth high-pass filtering, and sharpening, which improves the quality of the captured image. Qiao et al. [22] conducted a study on the non-uniform correction method of the X-ray imaging system, analyzed the influence of random noise and fixed inhomogeneity on the imaging quality, and proposed the correction method of the imaging system, which improved the image contrast, but due to the limitation of the radiation source parameters, the image contrast improved by the method but did not reach the optimum.
The above research has achieved some results in many fields, but there are still some problems in industrial X-ray high absorption ratio material imaging:
  • At present, the relevant research on X-ray imaging in the industry is mostly the study of a single material, and the X-ray imaging study of the high-absorption ratio material is less, which is more demanding for the selection of the ray source and the subsequent processing of the image;
  • Some research results point out that when the ray source selects the appropriate ray energy, X-ray imaging technology can be applied to high-absorption ratio materials but rarely gives a specific ray source selection method;
  • In engineering applications, the lack of means to quickly complete the selection of reasonable X-ray sources leads to complicating the subsequent X-ray image enhancement process, which affects the in-depth research of the above technologies.
In order to solve the above problems, this paper uses the characteristics that X-rays can penetrate the surface of objects without damage, complete the internal structure detection, and realize material analysis and damage judgment. Considering the physical differences in the structure of high-absorption ratio materials, and aiming at the best imaging contrast, an imaging model with an optimal contrast ratio is established and quickly simplified through approximate calculations, and the optimal condition solution method for detecting high-absorption ratio materials is given [23,24,25,26].
The main contributions of this research work are summarized as follows:
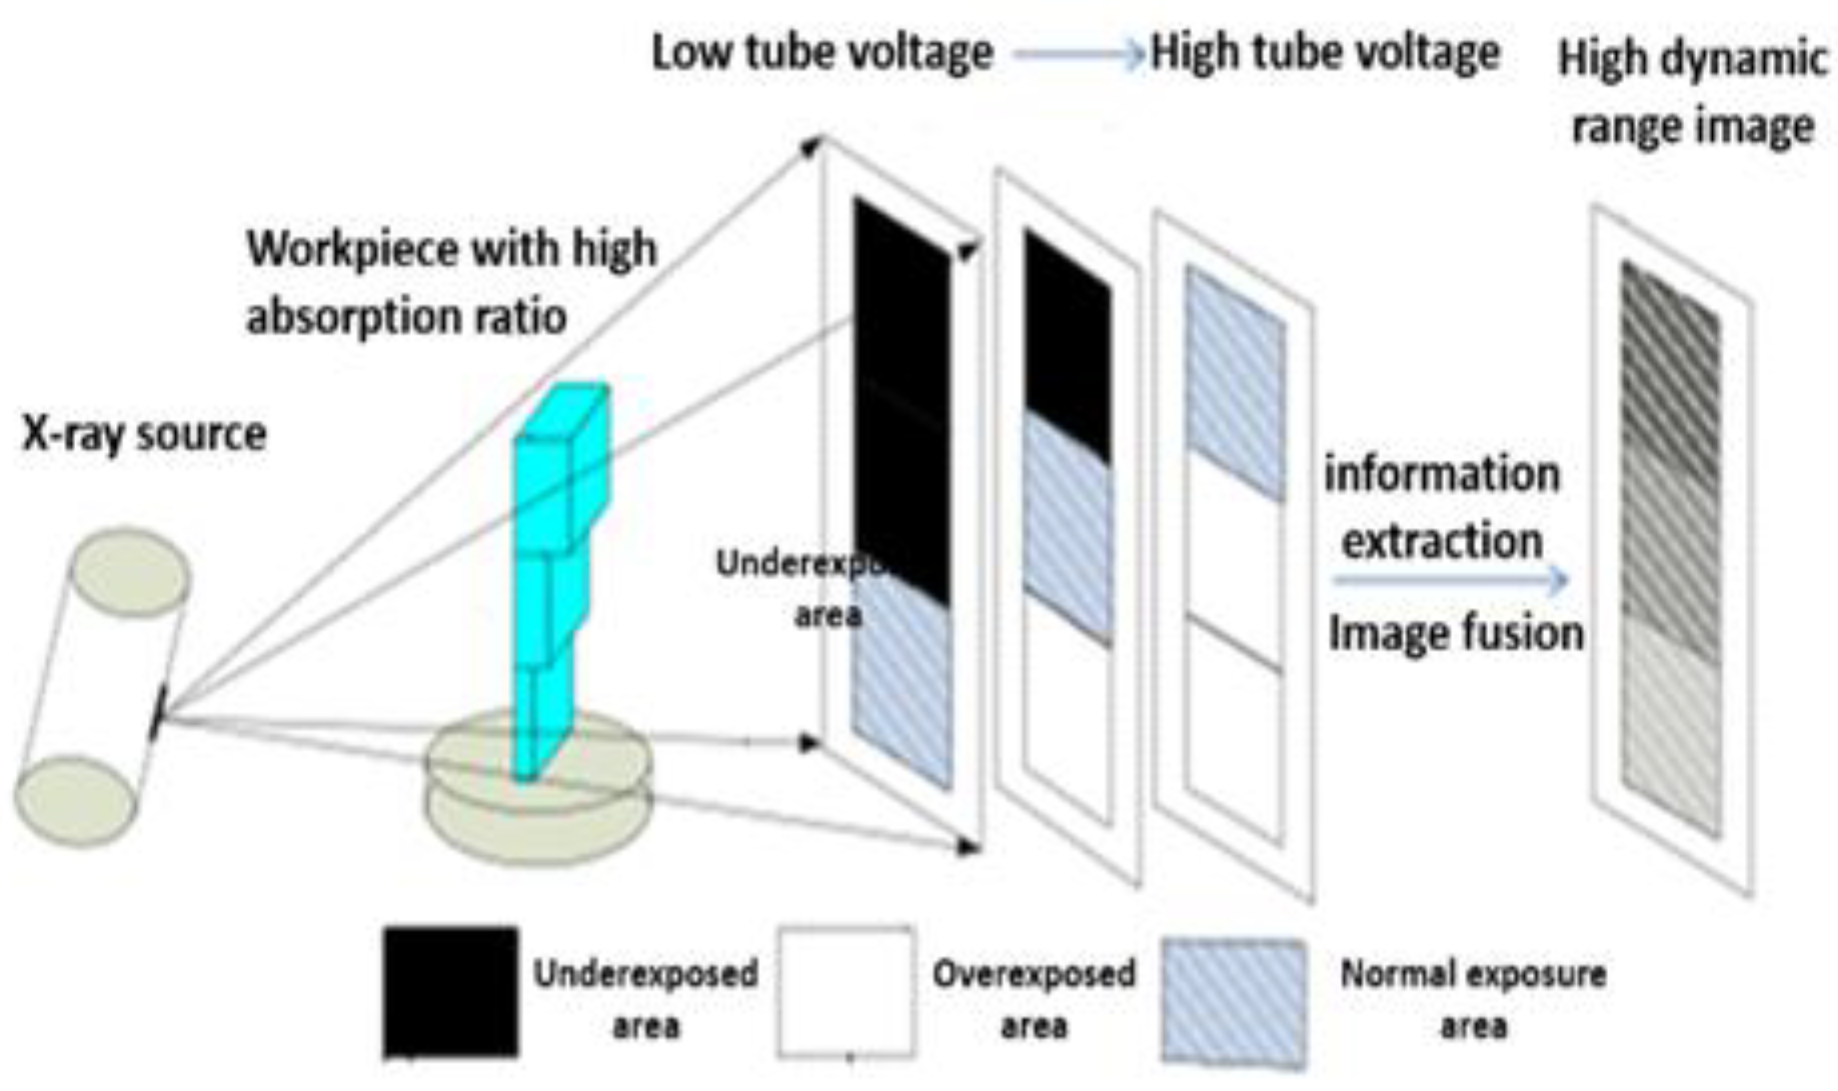
  • Through the X-ray absorption model, combined with the performance of the X-ray imaging detector, with the best symmetry and contrast as the model constraints, decompose the key factors of high absorption ratio material imaging.
  • By expanding iterations and simplifying the calculation process, the optimal imaging converging surface is found, and then the optimal energy input conditions of high-absorption materials are obtained and symmetrically balanced.
  • Test the effectiveness of the algorithm through experimental simulation and measurement verification. Our method achieves better image quality and reduces subsequent complications of the X-ray image enhancement process.

2. X-ray High Absorption Ratio Structural Imaging Model Optimization

2.1. X-ray Imaging Physical Model Construction

X-ray probing completes imaging by using the detector to obtain the intensity of the transmitted energy of ray photons per unit area. After the high-voltage power supply to the anode target, an X-ray is emitted and penetrates the object to be detected, and the energy accumulation is carried out on the corresponding surface of the detector; then, the image is obtained after quantification by analog-to-digital conversion. Figure 1 shows the X-ray imaging process [27].
To achieve high absorption ratio material imaging optimization, we first model and analyze the imaging process of the X-ray source. Img corresponds to an X-ray spectrum in each detection pixel, Img ( x , y ) , and the cumulative total intensity of the X-ray can be obtained by calculating the area of each curve at a certain time, I J , and the formula for the total energy of the X-ray emitted by the anode target can be obtained as follows:
I J = k i Z tg U m
In Equation (1): i is the tube current, U is the maximum tube voltage of the ray source, Z tg is the atomic number of the anode target, and k and m are empirical constants, m ≈ 2, k ≈ 1.5 × 10⁻⁹/V. The total X-ray intensity, I J , is the sum of the X-ray energy, I λ ( v ) , at multiple wavelengths containing different voltage energy levels, and the X-ray intensity of a single wavelength needs to be calculated separately due to the different influence coefficients of different wavelengths when performing probing imaging, I λ (v), i.e., as shown in Equation (2):
{ I J = v = V m i n U I λ ( v ) I λ ( v ) = C Z tg ( 1 λ 0 1 λ ( v ) )
In Equation (2), λ 0 is the short-wave limit, and its size depends on the maximum tube voltage of the ray source U, i.e., λ 0 = 12.4/U, v is the continuous voltage, λ(v) is the corresponding single-energy level wavelength at the continuous voltage in the tube, λ(v) = 12.4/v, and C is the empirical value associated with the atomic number of the anode target, i.e., as shown in Equation (3):
C = 1 + ( 1 + 2.56 × 10 3 Z tg 2 ) 1 [ 1 + ( 2.56 × 10 3 ) λ 0 Z tg 2 ] ( 0.25 ξ + 1 × 10 4 )
In Equation (3), ξ = ( 1 λ 0 1.65 1 λ ( v ) 1.65 ) μ tg csc ϕ . ϕ is the angle between the outgoing X-ray and the anode target; μ tg is the mass absorption coefficient of the anode target. Using Equation (4), we calculated the mass absorption coefficient in a conventional model.
μ tg = K λ 3 ( v ) Z tg 4
where K is constant between 0.007 and 0.0009. From the above model calculation, the final single-wavelength outgoing energy intensity can be obtained, I λ ( v ) . After penetrating the material to be detected, its spectral energy, I r , is received by the detector, and its energy change is subject to the Lambert–Beer law, i.e., as shown in Equation (5):
I r = V m i n U I λ ( v ) e μ z ( v ) D z d v
In Equation (5), μ z ( v ) is the linear absorption coefficient of the element of the substance to be detected, and D z is the transmission thickness of the probed substance z at the corresponding pixel. Single-point imaging of X-rays can be obtained by sampling and quantifying spectral energy, I r , detector through a multichannel converter, and finally expanding throughout the Img plane to complete the imaging calculation of single-component materials [28].

2.2. X-ray High Absorption Ratio Structural Imaging Model Optimization

2.2.1. Model Building

As can be seen from the X-ray imaging model of single-component materials, the main factors affecting imaging are the source characteristics, the absorption coefficient of the detected element, and the thickness of the material. For high absorption ratio materials containing elemental M a and elemental M b , the element type is known, and imaging using the same ray source can be optimized using previous models [29,30,31]. The imaging process for materials with high absorption ratios is shown in Figure 2.
First, a single-point region of imaging two types of elements is modeled separately using a single-component material, as shown in Equation (6):
{ I M a ( x , y ) = V m i n U   I λ   ( v )   e μ M a ( v ) D M a ( x , y ) d v I M b ( x , y ) = V m i n U   I λ   ( v )   e μ M b ( v ) D M b ( x , y ) d v
In Equation (6), I M a ( x , y ) , I M b ( x , y ) , μ M a , μ M b , D M a ( x , y ) , and D M b ( x , y ) are respectively corresponding to the single point energy, absorption coefficient, and material thickness of the material M a and the material M b . In a high absorption ratio material device, the ray passes through two materials, M a and M b , of different thicknesses, and empirically, the case of the ray passing through the two materials without being completely absorbed is independent of the sequence, i.e., I M a b ( x , y ) = I M a b ( x , y ) = I M b a ( x , y ) . Equation (7) gives the transmitted energy model of the point I M a b ( x , y ) .
I M a b ( x , y ) = V m i n U I λ ( v ) e μ M a ( v ) D M a ( x , y ) e μ M b ( v ) D M b ( x , y ) d v
To achieve the optimal image quality, it is necessary to consider the signal quantization from the entire image Img plane, and we consider the maximum symmetry and contrast, R, as the optimal quantification indicator, i.e., R = a r g m a x ( I M a b M a x I M a b M i n ) . When the value of R is exactly equal to the detector range accuracy, N, the imaging quality is optimal, and the corresponding voltage, U, is the optimal source voltage value.

2.2.2. Model Optimization

Due to the complexity of the law of continuous spectrum attenuation, in practical processing, the average wavelength, λ ¯ , is often quoted to simplify the continuous spectrum, generally taken:
λ ¯ = c λ 0
The value range of c is 1.3–1.4, and we take c = 1.35 to simplify the model; when the continuous spectrum passes through the first layer of material, M a , its energy becomes:
I M a ( x , y ) =   I ( λ ) e μ M a ( λ ¯ ) D M a
Currently, the X-ray spectrum through the first layer of material is still a continuous spectrum and satisfies:
E ( λ 0 ) e μ M a ( λ 0 ) D M a 1 = E ( λ 0 )
λ 0 is the short-wavelength limit of the incident photon, λ 0 is the shortest wavelength M a penetrates the first layer of material, E ( λ 0 ) is the maximum energy of the incident photon, and E ( λ 0 ) is the maximum energy of the photon M a through the first layer of material. According to the relationship between wavelength and energy in quantum theory, it can be obtained:
{ E ( λ 0 ) = h c λ 0 E ( λ 0 ) = h c λ 0
Combine Equations (10) and (11), and we can obtain:
λ 0 = λ 0 e μ M a ( λ 0 ) D M a
Then the average wavelength, λ ¯ , penetrated through the first layer of material, M a , is:
λ ¯ = c λ 0 e μ M a ( λ 0 ) D M a
When the continuous spectrum through the second layer of material, M b , its energy becomes:
I M a b ( x , y ) = I M a ( x , y ) e μ M b ( λ ¯ ) D M b
When the model is expanded, the energy is
I M a b ( x , y ) =   I ( λ ) e μ M a ( λ ¯ ) D M a e μ M b ( λ ¯ ) D M b
When we take the maximum symmetry and contrast, R, as the optimal quantification index, and the R-value is exactly equal to the detector range accuracy, N, the ratio of the image quality to the best, and the I M a 1 b 1 and the minimum value of the energy intensity at the maximum energy intensity I M a 1 b 2 , R is calculated as follows:
R =   I ( λ ) e μ M a ( λ ¯ ) D M a 1 e μ M b ( λ 1 ¯ ) D M b 1   I ( λ ) e μ M a ( λ ¯ ) D M a 2 e μ M b ( λ 2 ¯ ) D M b 2
Expand the above equation to obtain:
R = e μ M a ( λ ¯ ) D M a 2 + μ M b ( λ 2 ¯ ) D M b 2 μ M a ( λ ¯ ) D M a 1 μ M b ( λ 1 ¯ ) D M b 1
Then it can be obtained as:
μ M a ( λ ¯ ) ( D M a 2 D M a 1 ) + μ M b ( λ 2 ¯ ) D M b 2 μ M b ( λ 1 ¯ ) D M b 1 = L n R  
Expand the mass absorption coefficient, and we can obtain:
K Z M a 4 λ ¯ 3 ( D M a 2 D M a 1 ) + K Z M b 4 ( λ 2 ¯ 3 D M b 2 λ 1 ¯ 3 D M b 1 ) = L n R
Simplify the model with the mean (8) and substitute the correlation amounts, then we can obtain:
K β λ 0 3 [ Z M a 4 ( D M a 2 D M a 1 ) + Z M b 4 ( e 3 μ M a ( λ 0 ) D M a 2 D M b 2 e 3 μ M a ( λ 0 ) D M a 1 D M b 1 ) ] = L n R
where β = c 3 . Use Taylor’s equation to expand, and we can obtain the first approximation:
K β λ 0 3 [ Z M a 4 ( D M a 2 D M a 1 ) + 3 K λ 0 3 Z M a 4 Z M b 4 ( D M a 2 D M b 2 D M a 1 D M b 1 ) ] = ln R
After optimization, the equation is:
K λ 0 3 Z M a 4 [ β ( D M a 2 D M a 1 ) + 3 K λ 0 3 Z M b 4 ( D M a 2 D M b 2 D M a 1 D M b 1 ) ] = L n R
Set T = λ 0 3 , and we can obtain the equation:
3 K 2 Z M b 4 ( D M a 2 D M b 2 D M a 1 D M b 1 ) T 2 + K β Z M a 4 ( D M a 2 D M a 1 ) T L n R = 0
We can solve the above equations and obtain T:
T = ( K β Z M a 4 ( D M a 2 D M a 1 ) ± K 2 β 2 Z M a 8 ( D M a 2 D M a 1 ) 2 + 12 K 2 Z M b 4 ( D M a 2 D M b 2 D M a 1 D M b 1 ) L n R 6 K 2 Z M b 4 ( D M a 2 D M b 2 D M a 1 D M b 1 )
where λ 0 = 12.4 U , then we can establish a voltage optimization model with an optimal high absorption ratio.
U = 12.4 { 6 K 2 Z M b 4 ( D M a 2 D M b 2 D M a 1 D M b 1 ) K β Z M a 4 ( D M a 2 D M a 1 ) ± K 2 β 2 Z M a 8 ( D M a 2 D M a 1 ) 2 + 12 K 2 Z M b 4 ( D M a 2 D M b 2 D M a 1 D M b 1 ) L n R } 1 / 3
Using the above equations, the optimal voltage value can be quickly given on the premise that the type of high absorption material is known, and the thickness range of each material is roughly determined.

3. X-ray Image Enhancement Algorithm

For non-equal-thickness components, the appropriate voltage is selected and then enhanced, which reduces the subsequent image enhancement work, and the histogram equalization algorithm can be further used to enhance the contrast of X-ray images to solve the problem of the uneven global processing effect in the follow-up, and then bilateral filtering is used to suppress the noise in the image [32,33,34,35].

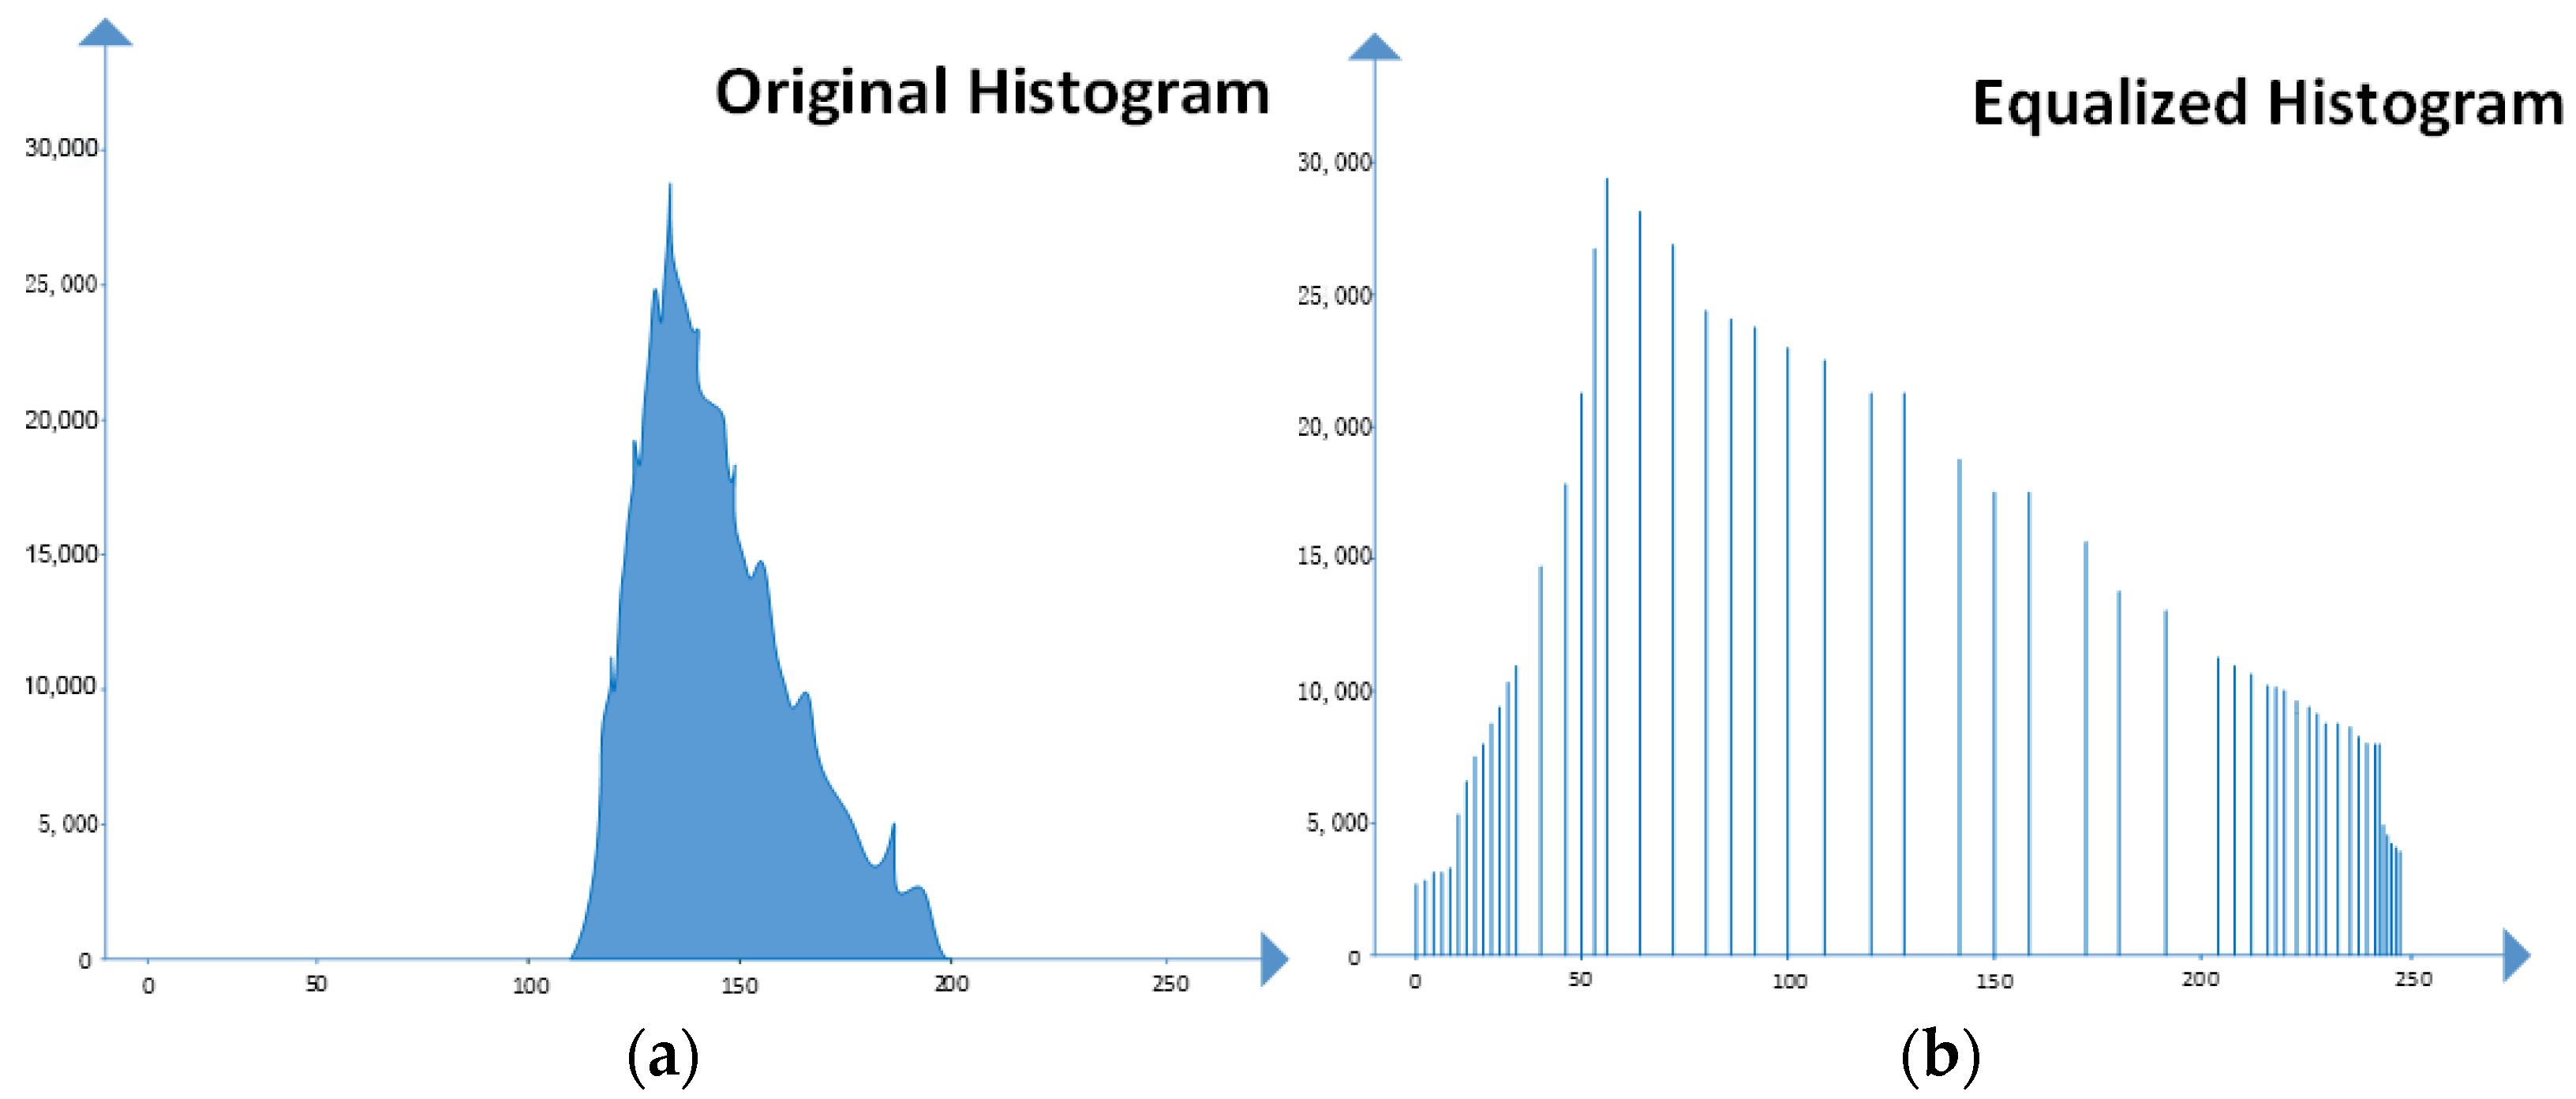
3.1. Histogram Equalization Algorithm

The original image may be concentrated in a narrow interval due to its gray distribution, resulting in an image that is not clear enough; the use of histogram equalization, the histogram of the original image can be transformed into a uniform distribution form, which increases the dynamic range of the gray value difference between pixels, so as to achieve the effect of enhancing the overall contrast of the image. The histogram equalization algorithm consists of two main steps:
  • Calculate the cumulative histogram
S = T ( r ) = 1 r Pr ( x ) d x
where P r ( x ) represents the grayscale probability density function.
  • Interval conversion of the cumulative histogram
S = T ( r ) = ( L 1 ) 0 r Pr ( x ) d x  
The histogram comparison before and after image equalization is shown in Figure 3.

3.2. Bilateral Filtering

Bilateral filtering is optimized by each weight calculated by spatial proximity from each point to the center point, and it is optimized as the product of the weight calculated by spatial proximity and the weight calculated by pixel similarity, and the optimized weight is then convolved with the image. This method considers both spatial proximity information and color similarity information and achieves edge preservation while filtering out noise and smoothing images. We use a symmetrical balance algorithm to improve the quality of the image. The formula is as follows:
g ( i , j ) = ( k , l ) S ( i , j ) f ( k , l ) w ( i , j , k , l ) ( k , l ) S ( i , j ) w ( i , j , k , l )  
where g ( i ,   j ) represents the output point; S ( i ,   j ) refers to the range of sizes centered on (i,j) (2N + 1)(2N + 1); f ( k ,   l ) represents (multiple) input points; and w ( i ,   j ,   k ,   l ) represents a value calculated by two Gaussian functions.

4. Experimental Verification

In industrial applications, the high-suction ratios of common materials such as cables and strain clamps are with iron and aluminum as the primary materials. Therefore, based on the construction and completion of the high absorption ratio material imaging optimization model in this paper, in allusion to the above materials, the simulation model is built by Geant4 software for simulation, and the real object is tested and verified by comparison [36,37,38,39].

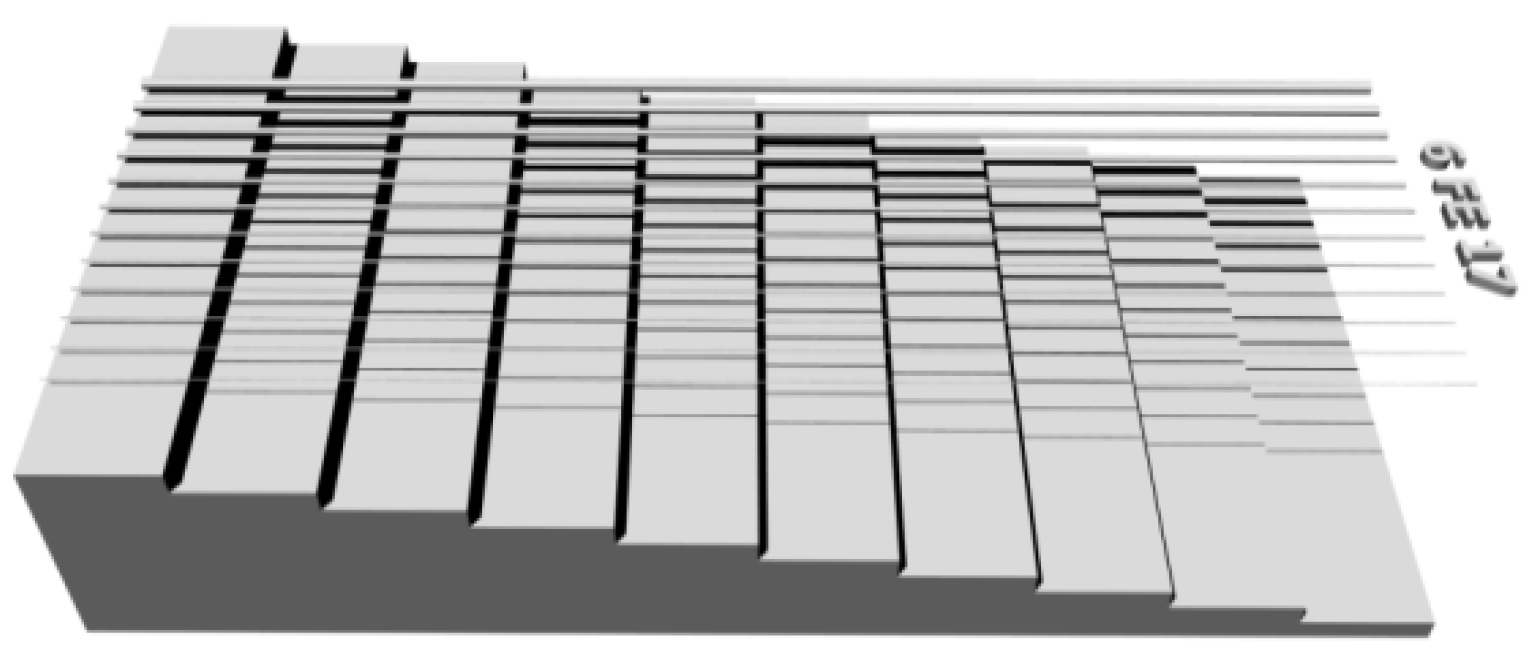
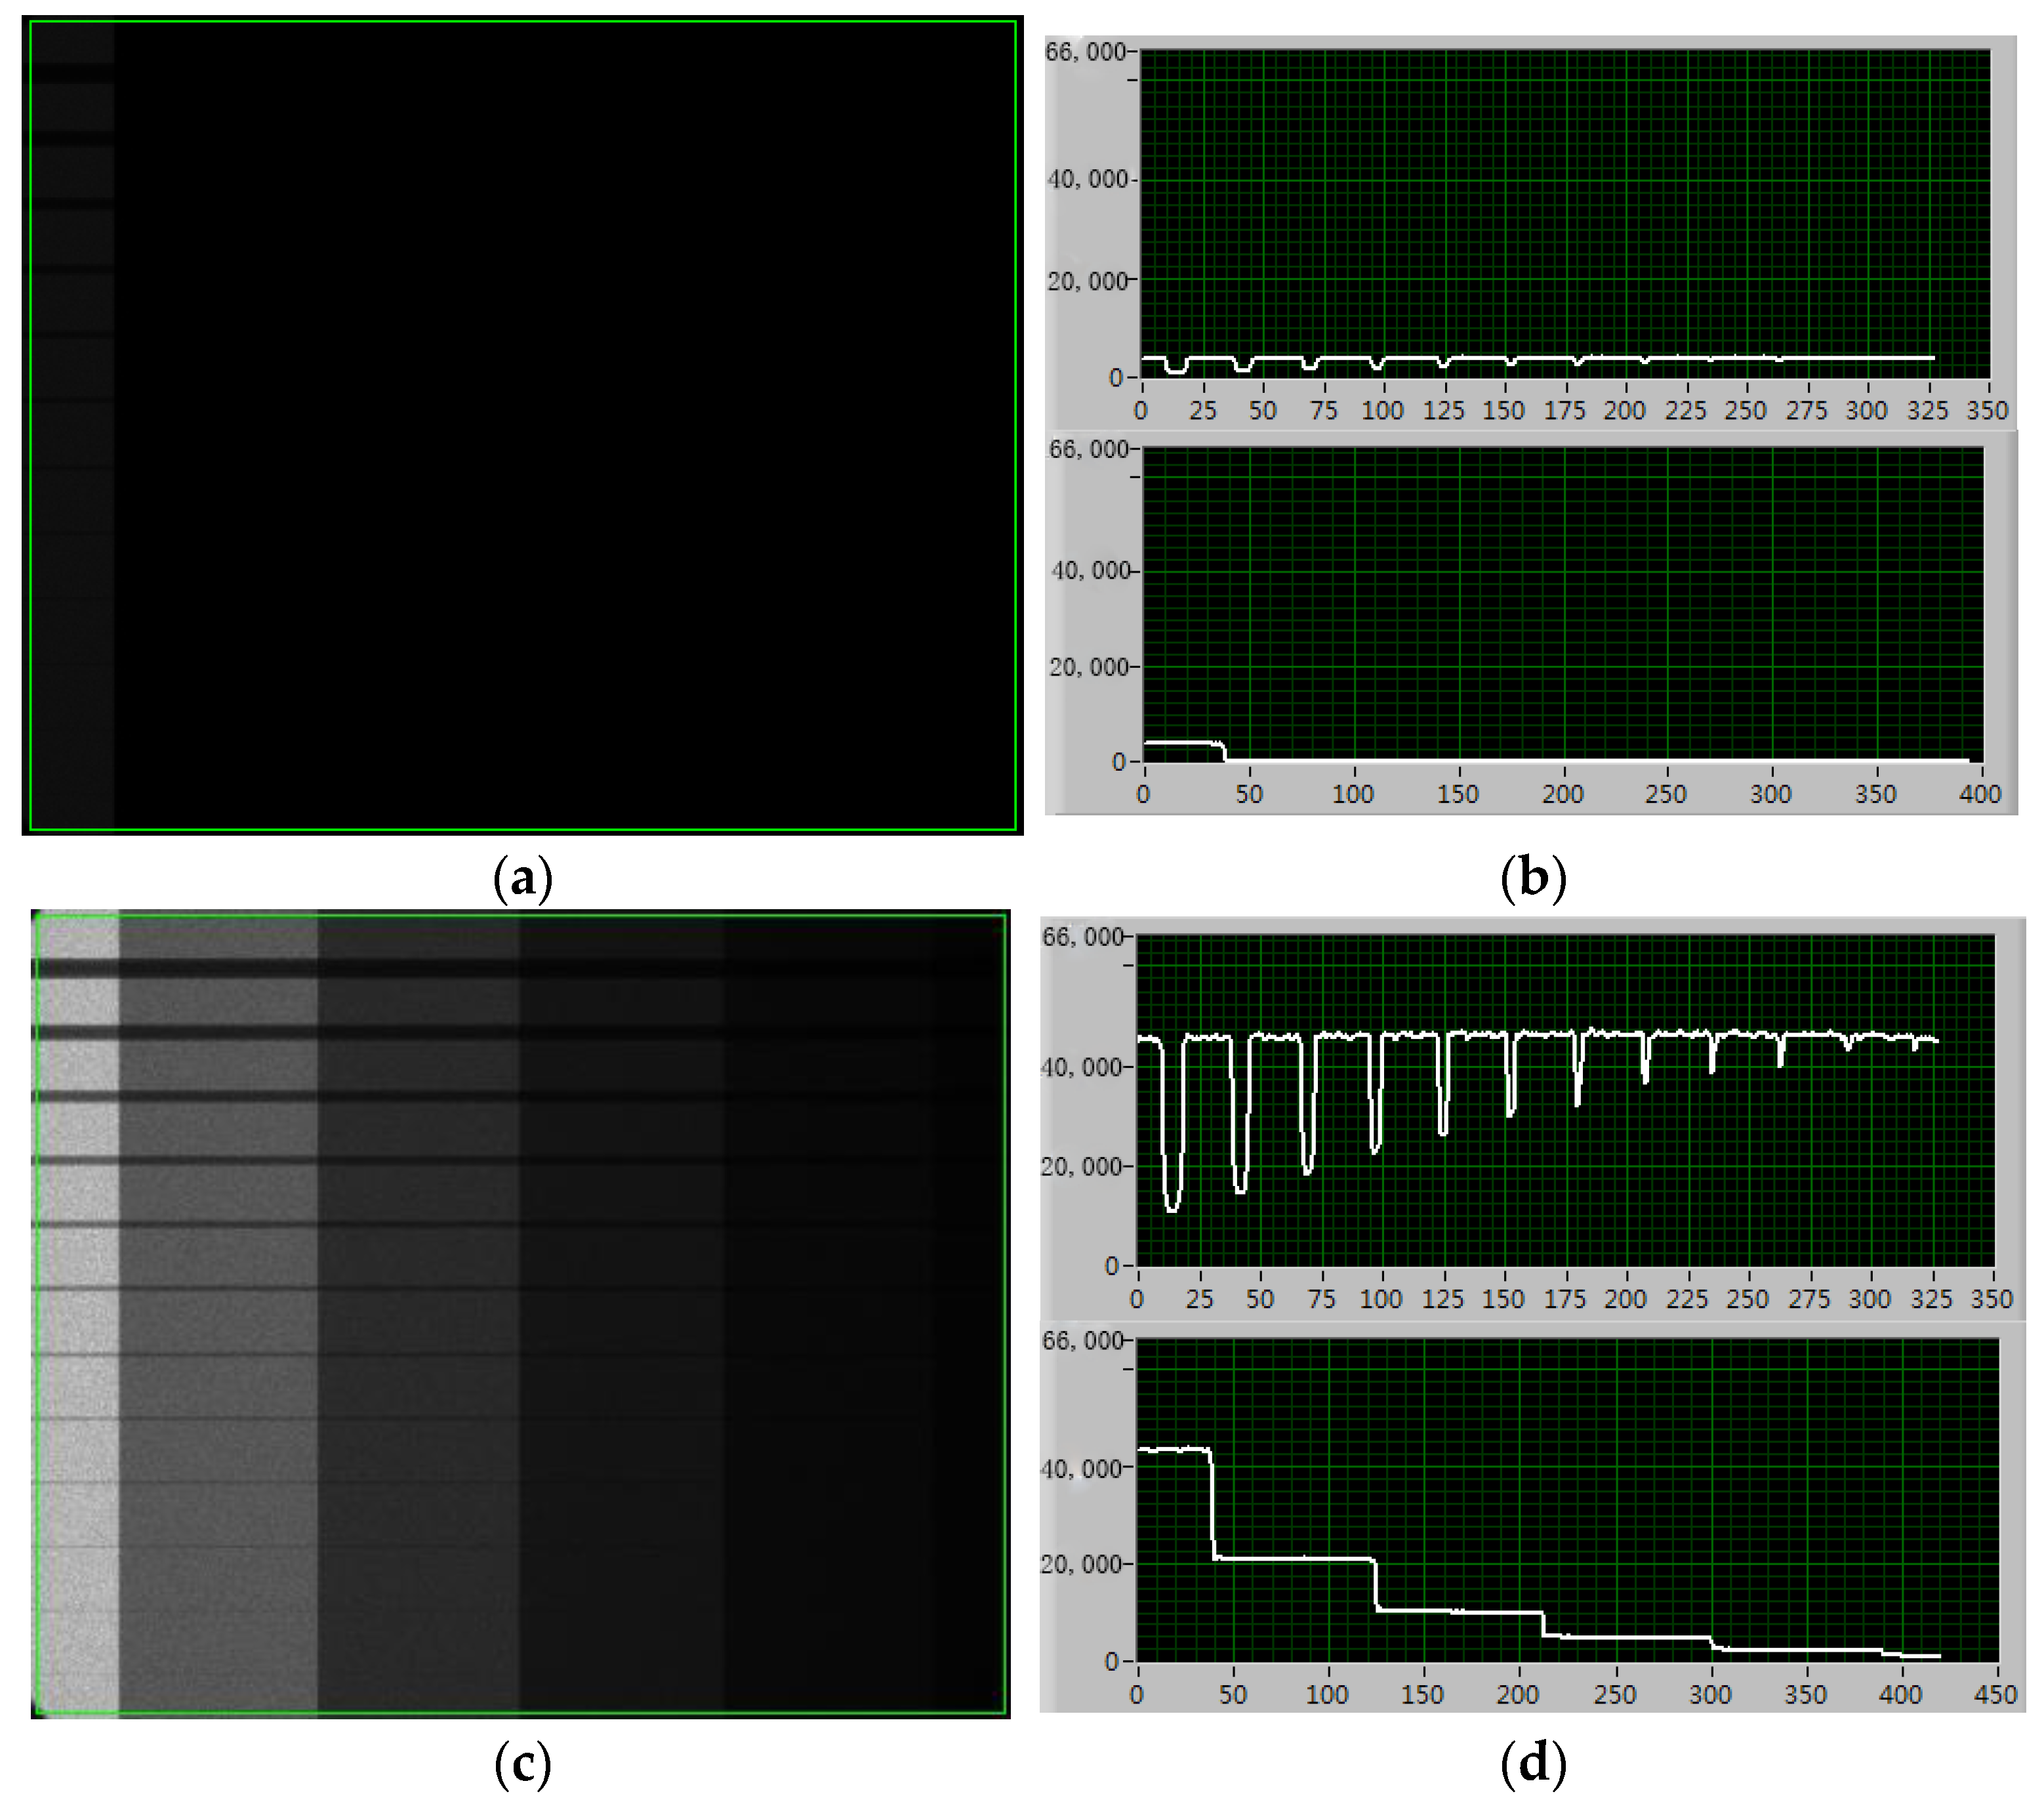
4.1. Step Wedge X-ray Imaging Simulation

Firstly, the simulation model of the step wedge is established, as shown in Figure 4.
Using the traditional image model, it can be calculated that the good photon range of voltage is widely between 80 kV and 250 kV. In the model, the thickness of each step decreases by two millimeters, and the width of the steps is ten millimeters. Using our algorithm, the good photon range of voltage is narrowly around 150 kV in this situation (about 146.6 kV). Therefore, the voltages of the incident X-ray imaging simulations are set into four levels: 50 kV, 100 kV, 150 kV, and 200 kV, while the image bit of the analog board is 16 (max count is 65,535). The experimental results are shown in Figure 5.
It can be concluded from the simulation experiment that it is difficult for the X-ray to penetrate the workpiece at 50 kV. Under the condition of 100 kV, the step wedge can basically image, but the thickness is lower than most of the symmetry and contrast. Under the condition of 150 kV, each part of the step wedge has good symmetry and contrast. Under the condition of 200 kV, the X-ray penetration ability is further enhanced, but the filament part of the filament-type image mass meter has been exposed and cannot be resolved. If you do not select the appropriate tube voltage first, e.g., directly use 50 kV imaging, the subsequent results are shown in Figure 6a, and the effect is very inconspicuous. This means that the amount of work to process the image will be too large, and if the suitable tube voltage is calculated first, as shown in Figure 6c, the effect is obvious, and the follow-up work is reduced. The optimal tube voltage calculated by the model in this paper is basically consistent with the simulation results.

4.2. Strain Clamp X-ray Imaging Test

On this basis, the algorithm in this paper is applied to the simulation and measurement of tensioning clip imaging. According to the size data of the tensioning wire clamp, the simulation software is used to input the parameters of the difference between the thickness of iron and aluminum, and the simulation image is obtained, as shown in Figure 7.
It can be seen from the figure that the best imaging effect is achieved at the optimal tube voltage value. The simulation effect is close to the physical test effect, which can be good for simulating the optimal imaging effect on the physical object, and the most reasonable configuration can be given for high absorption detection imaging.
It can be seen from the simulation results that the proposed algorithm can obtain the optimal imaging voltage through the calculation for the simultaneous imaging of objects with a large difference in absorption coefficients [40,41].
We also used the actual five situations of high absorption materials, which are both in different thicknesses to the test, and compared the best value calculated in this paper with the measured value. As a typical device with a high absorption ratio, the strain clamp is selected as the physical test sample, and its optimal imaging effect is tested with an adjustable X-ray source. The image test is shown in Figure 8.
The experimental results are shown in Table 1.
An additional experiment is set in that the thickness of one material is growing while another is fixed. The best dynamic range imaging is measured compared to our model calculation, and the result is shown in Figure 9.

5. Conclusions

Through the simulation and the experiment, the result shows that this model can be used to image materials with a high absorption ratio while the data error rate is better than 5%. While one thickness of the material is fixed, the best voltage calculated for dynamic range imaging has a lower error than 4% compared to the measurement. For the question of the input voltage selected according to the difference of material with a high absorption ratio, the calculation process is simplified, the effective quantization range of the prime minister is clarified, and the imaging quality of X-ray flaw detection is improved. High absorption ratio X-ray flaw detection technology is improved. At the same time, it also alleviates the subsequent image processing and other work. However, in many cases, the voltage selection range of the ray source is limited. In the future, we can further study loading filters of different materials and thicknesses on high-absorption ratio material components to quickly reduce the value of high-energy units, further improve imaging contrast, optimize X-ray imaging quality, and widely apply research results to industrial, medical, and other X-ray imaging inspection fields.

Author Contributions

Methodology, data analysis, and writing, Y.L. (Yanxiu Liu) and S.J.; conceptualization and project administration, Y.L. (Ye Li); Investigation, visualization, and formal analysis, X.Y. and G.L.; All authors have read and agreed to the published version of the manuscript.

Funding

This research received no external funding.

Institutional Review Board Statement

Not applicable.

Informed Consent Statement

Not applicable.

Data Availability Statement

Not applicable.

Acknowledgments

The authors would like to thank all of the cited authors and the anonymous reviewers in this article for their helpful suggestions.

Conflicts of Interest

The authors declare no conflict of interest.

References

  1. Sukovic, P.; Clinthrone, N.H. A method for extending the dynamic range of flat panel imagers for use in cone beam computed tomography. In Proceedings of the 2001 IEEE Nuclear Science Symposium Conference Record (Cat. No.01CH37310), San Diego, CA, USA, 4–10 November 2001. [Google Scholar]
  2. Kuntz, K.D.; Atz, E.; Collier, M.R.; Collado-Vega, Y.; Connor, H.K.; Porter, F.S.; Sibeck, D.G.; Walsh, B.M. Making the invisible visible: X-ray imaging—ScienceDirect. In Understanding the Space Environment through Global Measurements; Elsevier: Amsterdam, The Netherlands, 2022. [Google Scholar]
  3. Wilbur, S.; Anastopoulos, C.; AngelMahr, M.; Asfis, G.; Koch, J.; Lindbolm, M.; Lohwasser, K.; Margulis, W.; On Behalf of the FleX-RAY Collaboration. Flexible X-ray imaging detectors using scintillating fibers. J. Instrum. 2022, 17, C10013. [Google Scholar] [CrossRef]
  4. Li, Y.; Han, Y.; Chen, P. X-Ray Energy Self-Adaption High Dynamic Range (HDR) Imaging Based on Linear Constraints with Variable Energy. IEEE Photonics J. 2018, 10, 3400114. [Google Scholar] [CrossRef]
  5. Liu, B.; Zhao, P.; Zhao, X.; Zhang, L. Enhancement Algorithm of Variable Energy X-ray Fusion Images. Acta Opt. Sin. 2020, 40, 216–221. [Google Scholar]
  6. Haidekker, M.; Morrison, L.D.-K.; Sharma, A.; Burke, E. Enhanced dynamic range x-ray imaging. Comput. Biol. Med. 2017, 82, 40–48. [Google Scholar] [CrossRef]
  7. Cao, F.; Zhao, H. Automatic Lung Segmentation Algorithm on Chest X-ray Images Based on Fusion Variational Auto-Encoder and Three-Terminal Attention Mechanism. Symmetry 2021, 13, 814. [Google Scholar] [CrossRef]
  8. Zulkifley, M.; Abdani, S.R.; Zulkifley, N.H. COVID-19 Screening Using a Lightweight Convolutional Neural Network with Generative Adversarial Network Data Augmentation. Symmetry 2020, 12, 1530. [Google Scholar] [CrossRef]
  9. Afifi, A.; Hafsa, N.E.; Ali, M.A.S.; Alhumam, A.; Alsalman, S. An Ensemble of Global and Local-Attention Based Convolutional Neural Networks for COVID-19 Diagnosis on Chest X-ray Images. Symmetry 2021, 13, 113. [Google Scholar] [CrossRef]
  10. Karlm, A.; Mishra, A. Novel COVID-19 Recognition Framework Based on Conic Functions Classifier. In Healthcare Informatics for Fighting COVID-19 and Future Epidemics; Springer: Berlin/Heidelberg, Germany, 2022; pp. 1–10. [Google Scholar]
  11. Sniureviciute, M. Problems with film processing in medical X-ray imaging in Lithuania. Radiat. Prot. Dosim. 2005, 114, 260–263. [Google Scholar] [CrossRef]
  12. Mehranian, A.; Ay, M.R.; Alam, N.R.; Zaidi, H. Quantifying the effect of anode surface roughness on diagnostic X-ray spectra using Monte Carlo simulation. Am. Assoc. Phys. Med. 2010, 37, 742–752. [Google Scholar] [CrossRef] [Green Version]
  13. Lin, H. The use of the Taguchi method with grey relational analysis and a neural network to optimize a novel GMA welding process. J. Intell. Manuf. 2012, 23, 1671–1680. [Google Scholar] [CrossRef]
  14. Park, Y.W.; Rhee, S. Process modeling and parameter optimization using neural network and genetic algorithms for aluminum laser welding automation. Int. J. Adv. Manuf. Technol. 2008, 37, 1014–1021. [Google Scholar] [CrossRef]
  15. Chiang, Y.; Hsieh, H.-H. The use of the Taguchi method with grey relational analysis to optimize the thin-film sputtering process with multiple quality characteristic in color filter manufacturing. Comput. Ind. Eng. 2009, 56, 648–661. [Google Scholar] [CrossRef]
  16. Sanchez-Gonzalez, A.; Micaelli, P.; Olivier, C.; Barillot, T.R.; Ilchen, M.; Lutman, A.A.; Marinelli, A.; Maxwell, T.; Achner, A.; Agåker, M.; et al. Accurate prediction of X-ray pulse properties from a free-electron laser using machine learning. Nat. Commun. 2017, 8, 15461. [Google Scholar] [CrossRef] [PubMed] [Green Version]
  17. Ivashchuk, O.O.; Shchagin, A.V.; Kubankin, A.S.; Ionidi, V.Y.; Chepurnov, A.S.; Miroshnik, V.S.; Volkov, V.I.; Lepeshko, D.A. Pyroelectric accelerator and X-ray source in pulsed mode. J. Instrum. 2020, 15, C02002. [Google Scholar] [CrossRef]
  18. Yang, Y.; Mou, X.; Luo, T.; Tang, S. Reconstruction of X-ray image with super dynamic range by wavelet transform. Acta Photonica Sin. 2009, 38, 2435–2438. [Google Scholar]
  19. Zhou, J. Study on X-ray Imaging Quality Prediction and Parameter Optimization. Master Thesis, Southeast University, Nanjing, China, 2017. [Google Scholar]
  20. Zhou, Z.; Li, Y.; Rao, B.; Hu, J.; Mao, R. Application of X-ray imaging technology in quality inspection of tensioning wire clips. Jiangxi Electr. Power 2018, 42, 33–36, 53. [Google Scholar]
  21. Yuan, J.; Chen, J.; Wang, X. Application of X-ray Imaging technology in the detection of Cable and Accessory defects. China Equip. Eng. 2021, 01, 118–119. [Google Scholar]
  22. Qiao, Y.; Liu, Y.; Li, Z. Study on the non-uniformity correction method of X-ray imaging system. J. Hebei Acad. Sci. 2021, 38, 1–5, 34. [Google Scholar]
  23. Chen, L.; Wang, Y. Improved image unevenness reduction and thresholding methods for effective asphalt X-ray CT image segmentation. J. Comput. Civil Eng. 2017, 31, 040170. [Google Scholar] [CrossRef]
  24. Li, Z.; Wu, Z.; Gao, Y.; Deng, J.; Hu, Z.; Li, L.; Xiao, T.; Fu, Y.; Chen, R. Measurement of Internal geometric Structure and Size of Injector Nozzle Based on Synchrotron radiation High-energy X-ray. J. Jilin Univ. (Eng. Technol. Ed.) 2011, 41, 128–132. [Google Scholar]
  25. Han, S.; Zhao, K.; Chang, Z. Monitoring Argon L-Shell Auger Decay Using 250-eV Attosecond X-ray Pulses. Sensors 2022, 22, 7513. [Google Scholar] [CrossRef] [PubMed]
  26. Li, D.; Ni, C.; Gu, M. Application of aluminum filter in Phase-contrast imaging of microfocused tungsten target X-ray source. Opt. Instrum. 2009, 31, 24–27. [Google Scholar]
  27. Liu, B. Research of High Dynamic Range X-ray Imaging Technology and System. Ph.D. Dissertation, North University of China, Taiyuan, China, 2014. [Google Scholar]
  28. Ji, A.; Tao, G.; Zhuo, S.; Luo, L. X-ray Fluorescence Spectroscopy, 1st ed.; Science Press: Beijing, China, 2003; pp. 7–9. [Google Scholar]
  29. Filippov, E.D.; Burdonov, K.F.; Pikuz, T.A.; Skobelev, I.Y. X-ray Self-Emission Imaging of Hydrodynamic Laser-Induced Astrophysical Phenomena. Symmetry 2022, 14, 2536. [Google Scholar] [CrossRef]
  30. Looker, Q.; Wood, M.G.; Miceli, A.; Niraula, M.; Porter, J.L. Synchrotron characterization of high-Z, current-mode X-ray de-tectors. Rev. Sci. Instrum. 2020, 91, 023509. [Google Scholar] [CrossRef] [PubMed]
  31. Sun, X.; Zhang, X.; Zhu, Y.; Wang, Y.; Shang, H.; Zhang, F.; Liu, Z.; Sun, T. 13.1 micrometers hard X-ray focusing by a new type monocapillary X-ray optic designed for common laboratory X-ray source. Nuclear Instrum. Methods Phys. Res. A 2018, 888, 13–17. [Google Scholar] [CrossRef]
  32. Ye, X.; Wu, G.; Huang, L.; Fan, F.; Zhang, Y. Image Enhancement for Inspection of Cable Images Based on Retinex Theory and Fuzzy Enhancement Method in Wavelet Domain. Symmetry 2018, 10, 570. [Google Scholar] [CrossRef] [Green Version]
  33. Wu, H.; Wu, Z. A Few-Shot Dental Object Detection Method Based on a Priori Knowledge Transfer. Symmetry 2022, 14, 1129. [Google Scholar] [CrossRef]
  34. Karim, A.M.; Kaya, H.; Alcan, V.; Sen, B.; Hadimlioglu, I.A. New Optimized Deep Learning Application for COVID-19 Detection in Chest X-ray Images. Symmetry 2022, 14, 1003. [Google Scholar] [CrossRef]
  35. Berinde, V.; Ţicală, C. Enhancing Ant-Based Algorithms for Medical Image Edge Detection by Admissible Perturbations of Demicontractive Mappings. Symmetry 2021, 13, 885. [Google Scholar] [CrossRef]
  36. Li, Y. Research on Key Technologies of Portable Low-intensity X-ray Real-Time Imaging System. Ph.D. Dissertation, Changchun University of Science and Technology, Changchun, China, 2011. [Google Scholar]
  37. Li, W. Research on Low-Dose Dual-Energy X-ray Item Inspection and Liquid Dangerous Goods Identification Technology. Master Thesis, Northeastern University, Qinhuangdao, China, 2010. [Google Scholar]
  38. Raza, H.S.; Kim, H.J.; Ha, J.M.; Cho, S.O. Behavior of characteristic X-rays from a partial-transmission-type X-ray target. Appl. Radiat. Isotopes 2013, 80, 67–72. [Google Scholar] [CrossRef]
  39. Xu, C.; Zhang, X.; Chen, Y.; Li, M.; Park, J.-S.; Kenesei, P.; Almer, J.; Yang, Y. In-situ high energy X-ray characterization of neutron irradiated HT-UPS stainless steel under tensile deformation. Acta Mater. 2018, 156, 330–341. [Google Scholar] [CrossRef]
  40. Liu, Y. Research on Influencing Factors of X-ray Imaging and Image Processing Technology. Master Thesis, Changchun University of Science and Technology, Changchun, China, 2014. [Google Scholar]
  41. Nishimura, R.; Arai, Y.; Miyoshi, T.; Hirano, K.; Kishimoto, S.; Hashimoto, R. Development of an X-ray imaging system with SOI pixel detectors. Nuclear Instrum. Methods Phys. Res. Sect. A 2016, 831, 49–54. [Google Scholar] [CrossRef]
Figure 1. X-ray imaging schematic.
Symmetry 15 00044 g001
Figure 2. Model optimization of imaging processes for materials with high absorption ratios.
Symmetry 15 00044 g002
Figure 3. Histogram comparison before and after image equalization: (a) original histogram and (b) equalization histogram.
Symmetry 15 00044 g003
Figure 4. Step wedge model of a single material.
Symmetry 15 00044 g004
Figure 5. Imaging simulation results of irradiating step wedge by X-ray: (a) imaging effect at 50 kV; (b) gray level change in the x-axis and y-axis of the 50 kV image; (c) imaging effect at 100 kV; (d) gray level change in the x-axis and y-axis of the 100 kV image; (e) imaging effect at 150 kV; (f) gray level change in the x-axis and y-axis of the 150 kV image; (g) imaging effect at 200 kV; and (h) gray level change in the x-axis and y-axis of the 200 kV image.
Symmetry 15 00044 g005aSymmetry 15 00044 g005b
Figure 6. X-ray imaging and subsequent image enhancement contrast at different voltages: (a) imaging contrast effect at 50 kV; (b) imaging contrast effect at 100 kV; (c) imaging contrast effect at 150 kV; and (d) imaging contrast effect at 200 kV.
Symmetry 15 00044 g006
Figure 7. Comparison of the imaging effects of a strain clamp: (a) 100 kV, (b) 200 kV, and (c) 150 kV.
Symmetry 15 00044 g007
Figure 8. Best dynamic range image test: (a) underexposure, (b) overexposure, and (c) best dynamic range image.
Symmetry 15 00044 g008
Figure 9. Voltage comparison for the best dynamic range imaging.
Symmetry 15 00044 g009
Table 1. Experimental comparison error.
SIT. 1SIT. 2SIT. 3SIT. 4SIT. 5
Calculate (kV)101139170163182
Measured (kV)106145167165177
Error Rate4.7%4.1%1.8%1.2%2.7%
Disclaimer/Publisher’s Note: The statements, opinions and data contained in all publications are solely those of the individual author(s) and contributor(s) and not of MDPI and/or the editor(s). MDPI and/or the editor(s) disclaim responsibility for any injury to people or property resulting from any ideas, methods, instructions or products referred to in the content.

