Article

Analysis of a Productive Topological Index Correlated to Fullerenes’ Physical Properties

1
Department of Mathematics, Division of Science and Technology, University of Education, Lahore 54700, Pakistan
2
Department of Applied Sciences, National Textile University, Faisalabad 38000, Pakistan
3
Institute of Experimental Physics, Slovak Academy of Sciences, 04001 Kosice, Slovakia
*
Author to whom correspondence should be addressed.
Symmetry 2023, 15(1), 58; https://doi.org/10.3390/sym15010058
Submission received: 20 October 2022 / Revised: 2 November 2022 / Accepted: 1 December 2022 / Published: 26 December 2022
(This article belongs to the Section Mathematics)

Abstract

:
Fullerene is a cage-like carbon allotrope admitting a vast range of applications. Some of the important fullerenes are C 54 , C 58 , C 60 , C 70 , C 74 , C 76 , C 78 , C 80 C 82 , C 84 , C 86 , C 90 . The physical properties of fullerenes can be exhibited using the degree-based topological indices. The sum based geometric arithmetic index is significant in this manner. The sum based atomic bond connectivity, Randic, first and second Zagreb indices are well known topological indices. We have determined the regression relation between each of these indices and the sum based geometric arithmetic index. Moreover, the correlation coefficient is also calculated. Correlation is a symmetric relation, as it provides association between two variables. On the basis of regression analysis and correlation coefficient, it was found that each of this index is strongly related to the sum based geometric arithmetic index. Moreover, we have computed the regression relations concerning the physical properties depending on the sum based geometric arithmetic index. The physical properties include binding energies, Ramsauer-Townsend minima, shape resonances and heat of formation of fullerene molecules. It was concluded that the sum based G A index is the best in presenting the heat of the formation of molecules.

1. Introduction

Fullerenes are active carbon molecules with a closed or partially closed mesh of atoms connected by single or double bonds. Fullerenes are famous carbon allotropes with fused rings of five to seven atoms. These structures can be embedded into a sphere, torus, Klein bottle, and projective plane [1]. The molecular structure of fullerenes gives them outstanding macroscopic properties including high tensile strength, electrical conductivity, ductility, heat conductivity, and chemical inactivity [2].
Nanostructures rules the industry due to their negligible dimensions. Fullerenes as dimers and oligomers are attractive molecular objects that fall in between molecules and nanostructures. Their minute size requires the use of high-cost quantum chemical techniques to compute their structural and molecular characteristics. Fullerenes are closed carbon structures used in various industries [3]. Fullerenes are used as anti-aging, anti-damage, anti-viral and anti-oxidant agents. Moreover, fullerenes are used in making carbon nanotubes-based fabrics and fibers [4]. The unique chemistry of fullerenes make them applicable in the fields of medicine, superconductors and fiber optics [5,6,7,8,9].
Chemical structures are mathematically modeled as graph in chemical graph theory. A chemical graph is a representation of a compound’s structural formula in terms of graph theory, as used in chemical graph theory and mathematical chemistry. The chemical graph presents atom as vertices and atomic bonds as edges. This graph admits scalar graph invariants called topological indices. A topological index or connectivity index is a molecular structure descriptor that characterizes the compound’s topology [10,11].
Degree-based topological indices (TIs) are useful for identifying the quantitative structure analysis of chemicals, nanostructures, and medicines. The multiplicative degree-based TIs generated for nanostar dendrimers have the potential to be used in chemical, biological, and medicinal applications [12,13]. The famous geometric arithmetic and atom bond connectivity indices are proven to be valuable tools in quantitative structure-property relationship (QSPR) and quantitative structure-activity relationship (QSAR) research. The atom bond connectivity index admits a strong link with heat of formation of branched alkanes and the strain energy of cycloalkanes [14,15]. Recently, the geometric arithmetic and atom bond connectivity indices of Guar gum and its derivatives [16], linear graphs of molecular cactus chain networks and their subdivisions [17], geranyl and farnesyl penicillin G bioconjugate with and without a sensitive bond [18], drugs used for the treatment of breast cancer [19] and polycyclic aromatic hydrocarbons [20] are calculated to relate with the QSPR.
Simple explicit formulae are developed to predict the geometric arithmetic and atom bond connectivity indices and their expected values in random polyphenyl chains with n hexagons [21]. The weighted graph entropies for the porous graphene structure are analyzed using the first and second Zagreb, Randic and reciprocal Randic, first and fourth atom-bond connectivity, first and fifth geometric arithmetic, harmonic and sum-connectivity indices [22]. The general Randic connection, general Zagreb, general sum connectivity, first, second and multiplicative Zagreb, atom-bond connectivity, and geometric arithmetic indices of horizontal and vertical cylindrical Benes networks are calculated [23].
The regression analysis between the TIs and the physical properties of the chemicals is in fashion. The curvilinear regression relations between several COVID-19 drugs and the physicochemical properties have been developed [24]. For the famous COVID-19 drug Remdesivir, the reverse general Randic index, reverse atom bond connectivity index, reverse geometric arithmetic index, reverse forgotten index, reverse Balaban index, and other types of Zagreb indices are computed to help in the development of new corona virus treatment [25]. The modified Sombor index and modified Sombor energy give a better quadratic correlation than their corresponding classical versions with the boiling points of the chemical graphs of the order of at most seven [26].
Fullerenes posses important physical properties including binding energies (BE), Ramsauer-Townsend minima (RT minima), shape resonances (SR) and heat of formation (HoF). The BE is the amount of energy necessary to detach a particle from a particle system or to scatter all of the particles in the system. Subatomic particles in atomic nuclei, electrons attached to atoms nuclei, and atoms and ions bonded together in crystals represents significance of binding energy. The RT effect is the scattering of low-energy electrons by atoms of a noble gas. The SR is a meta-stable condition in which a potential barrier’s form traps an electron. Hof is the amount of heat absorbed or evolved when one mole of a compound is formed from its constituent elements, each substance being in its normal physical state.
There are certain statistical methods, which investigate the dependence of the TIs on each other. These include regression analysis and coefficient of correlation. Linear regression uses an equation to represent the linear relationship, whereas correlation quantifies the strength of that linkage. Regression explains the quantitative dependency of one variable on other variable. The coefficient of determination investigates the percentage of data represented by the regression line.
Correlation is the relationship between two or more variables that change in a specific direction and the coefficient of correlation measures its extent. Correlation is a symmetric relation as the correlation describes the strength of association between the two variables. Correlation between two quantities A and B equals the correlation between B and A . It is noteworthy that a symmetric relationship is not always smooth. It indicates that the fluctuation of the two variables occur at the same time.
The objective of this study is to investigate productive sum based TIs presenting the physical properties of fullerenes. We considered sum based geometric arithmetic ( G A ), atomic bond connectivity ( A B C ), Randic (R), first Zagreb index ( Z M 1 ) and second Zagreb index ( Z M 2 ) in this regard. Moreover, the physical properties analyzed are BE, RT minima, SRs and Hof. The manuscript is organized as follows: The next section consists of methodology used in research. Section 3 contains the graphs of fullerene structures used in the work, formulas for sum based TIs and their calculations. Section 4 keeps the analysis of relation between each of the sum based TI with the sum based GA index. Section 5 is comprised of the analysis of physical variables including BE, RT minima, SRs and Hof with the sum based GA index. The last section consists of the conclusion of the research.

2. Methodology

The following method would be adopted to perform the research:
Step 1:
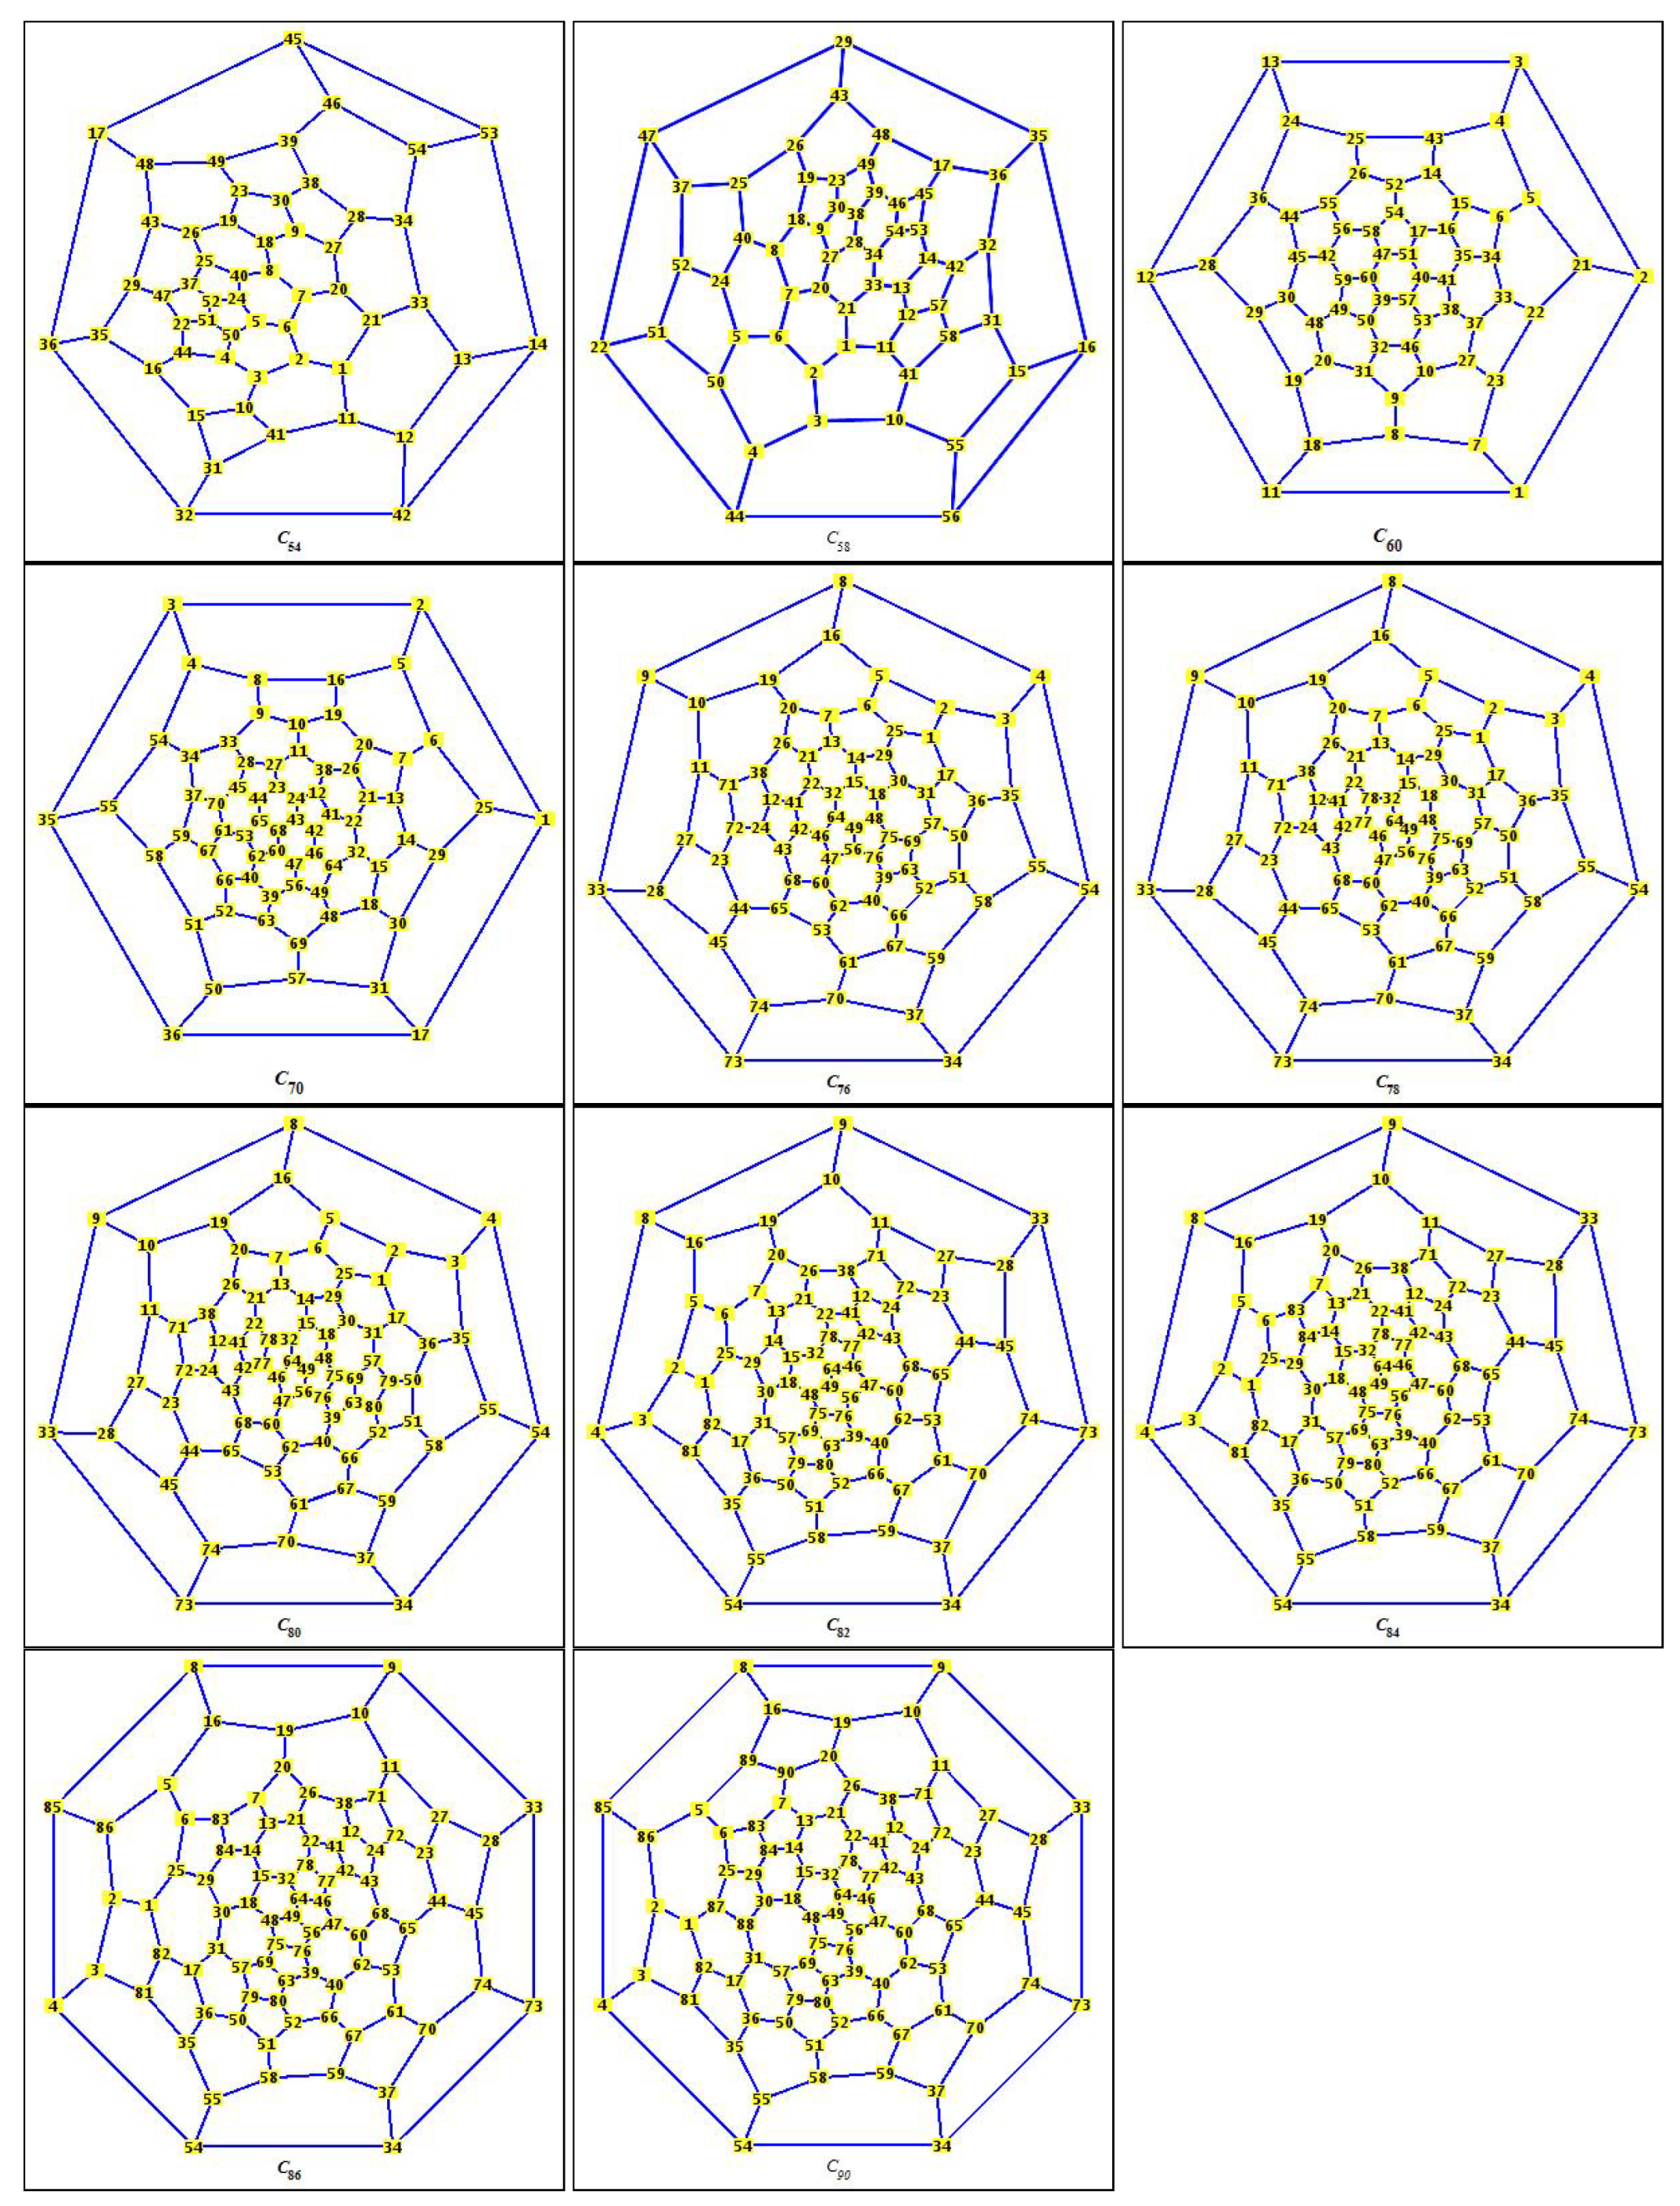
Considering each of the molecular graph of the specific fullerene structures: C 54 , C 58 , C 60 , C 70 , C 74 , C 78 , C 80 , C 82 , C 84 , C 86 , C 90 .
Step 2:
The vertices and their degrees would be calculated.
Step 3:
The G A , A B C , R , Z M 1 and Z M 2 indices would be derived using their specific formulae.
Step 4:
The linear regression relation between each of the mentioned sum based index and the sum based G A index would be computed. The coefficient of determination and the correlation coefficient would also be computed.
Step 5:
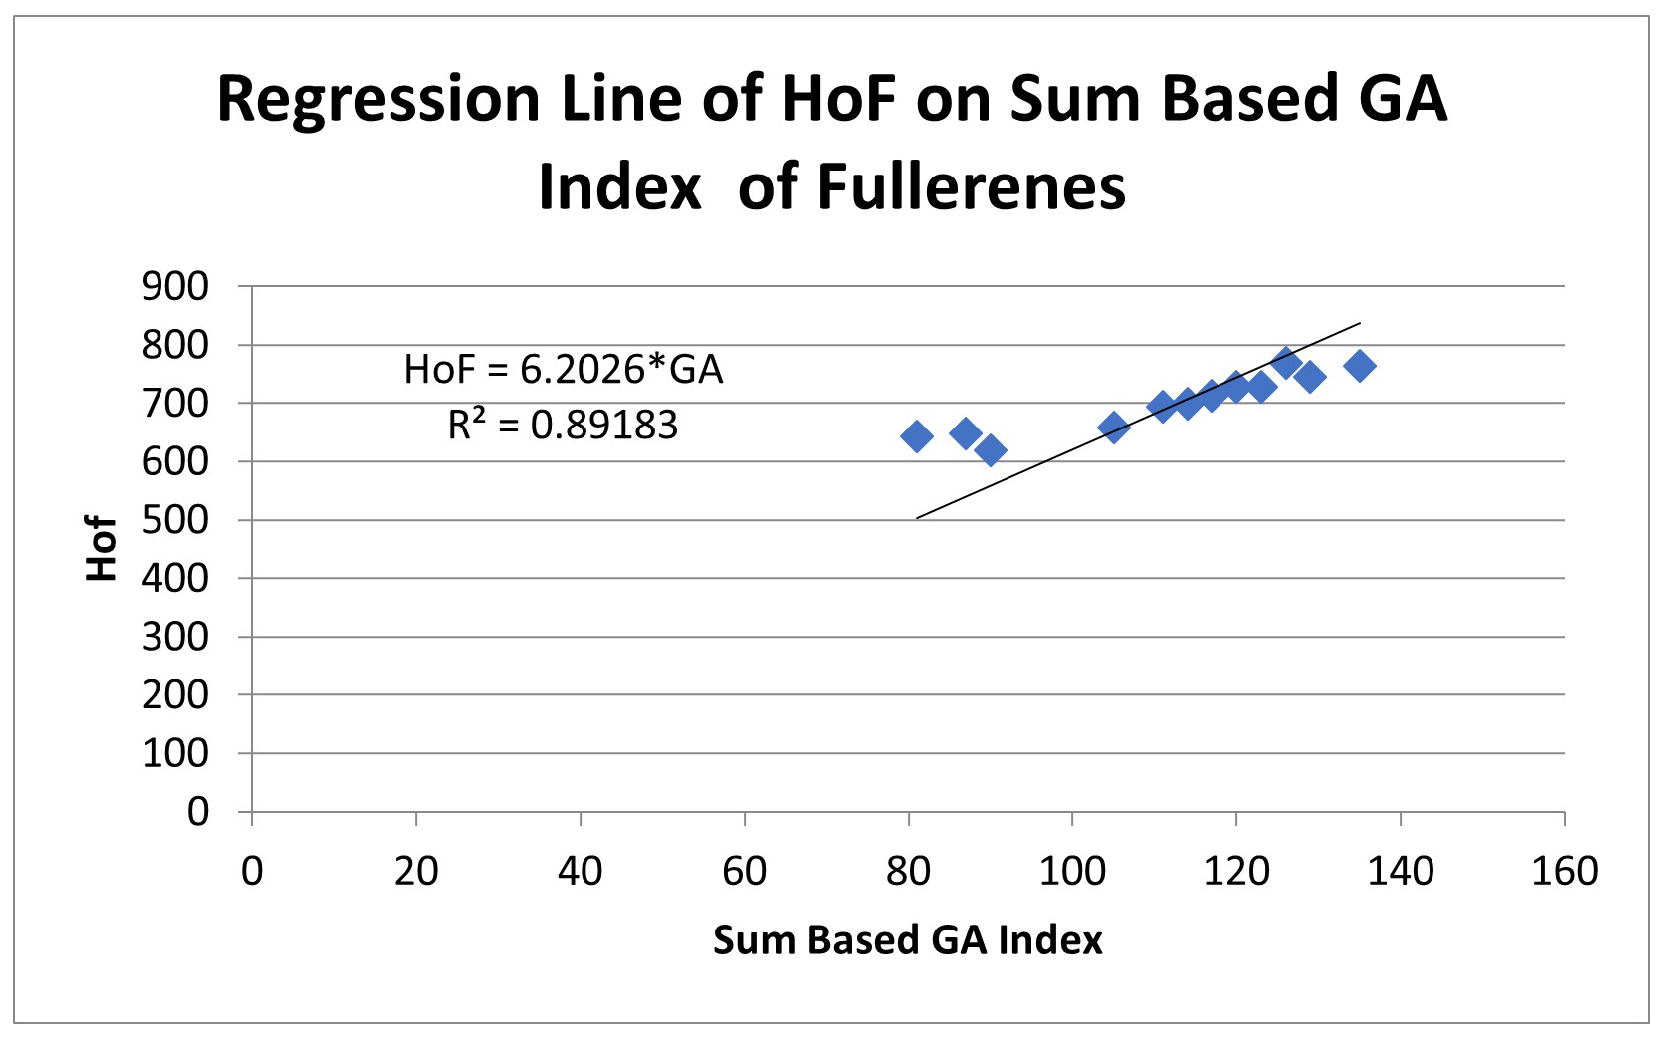
The linear regression relation between each of the physical properties including BE, RT minima, SRs and Hof depending on the sum based GA index are analyzed. The coefficient of determination and the correlation coefficient would also be computed to judge the productivity of the sum based G A index.

3. Computational Details
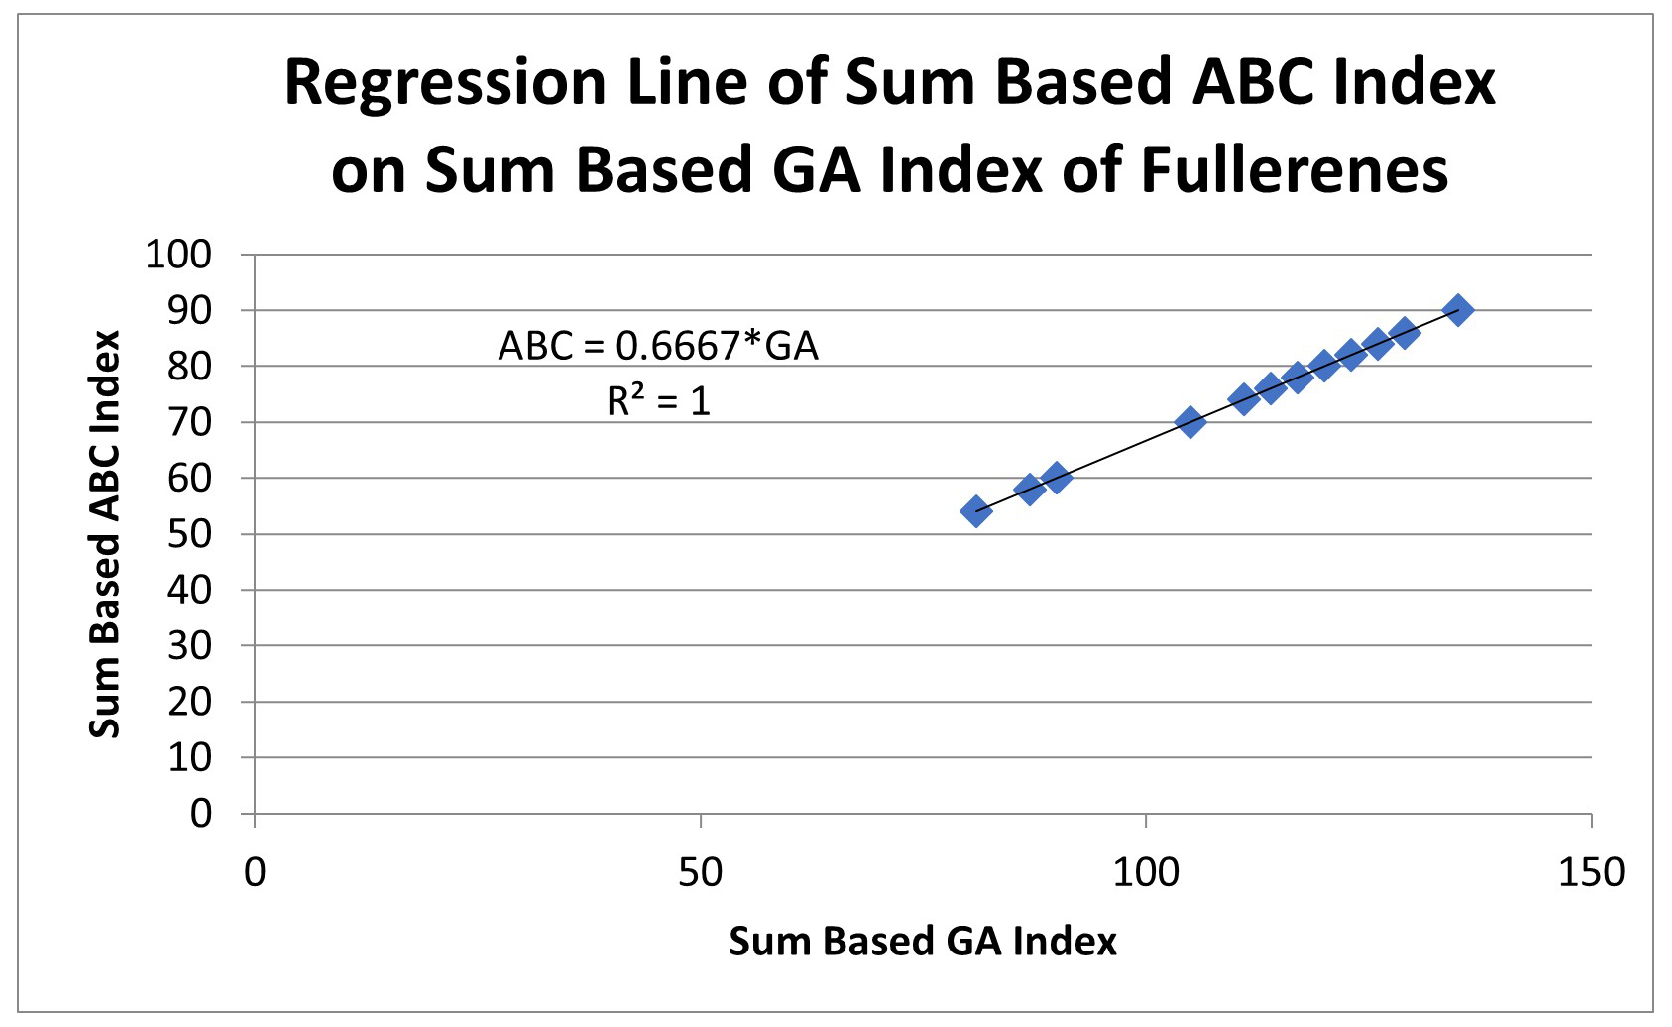
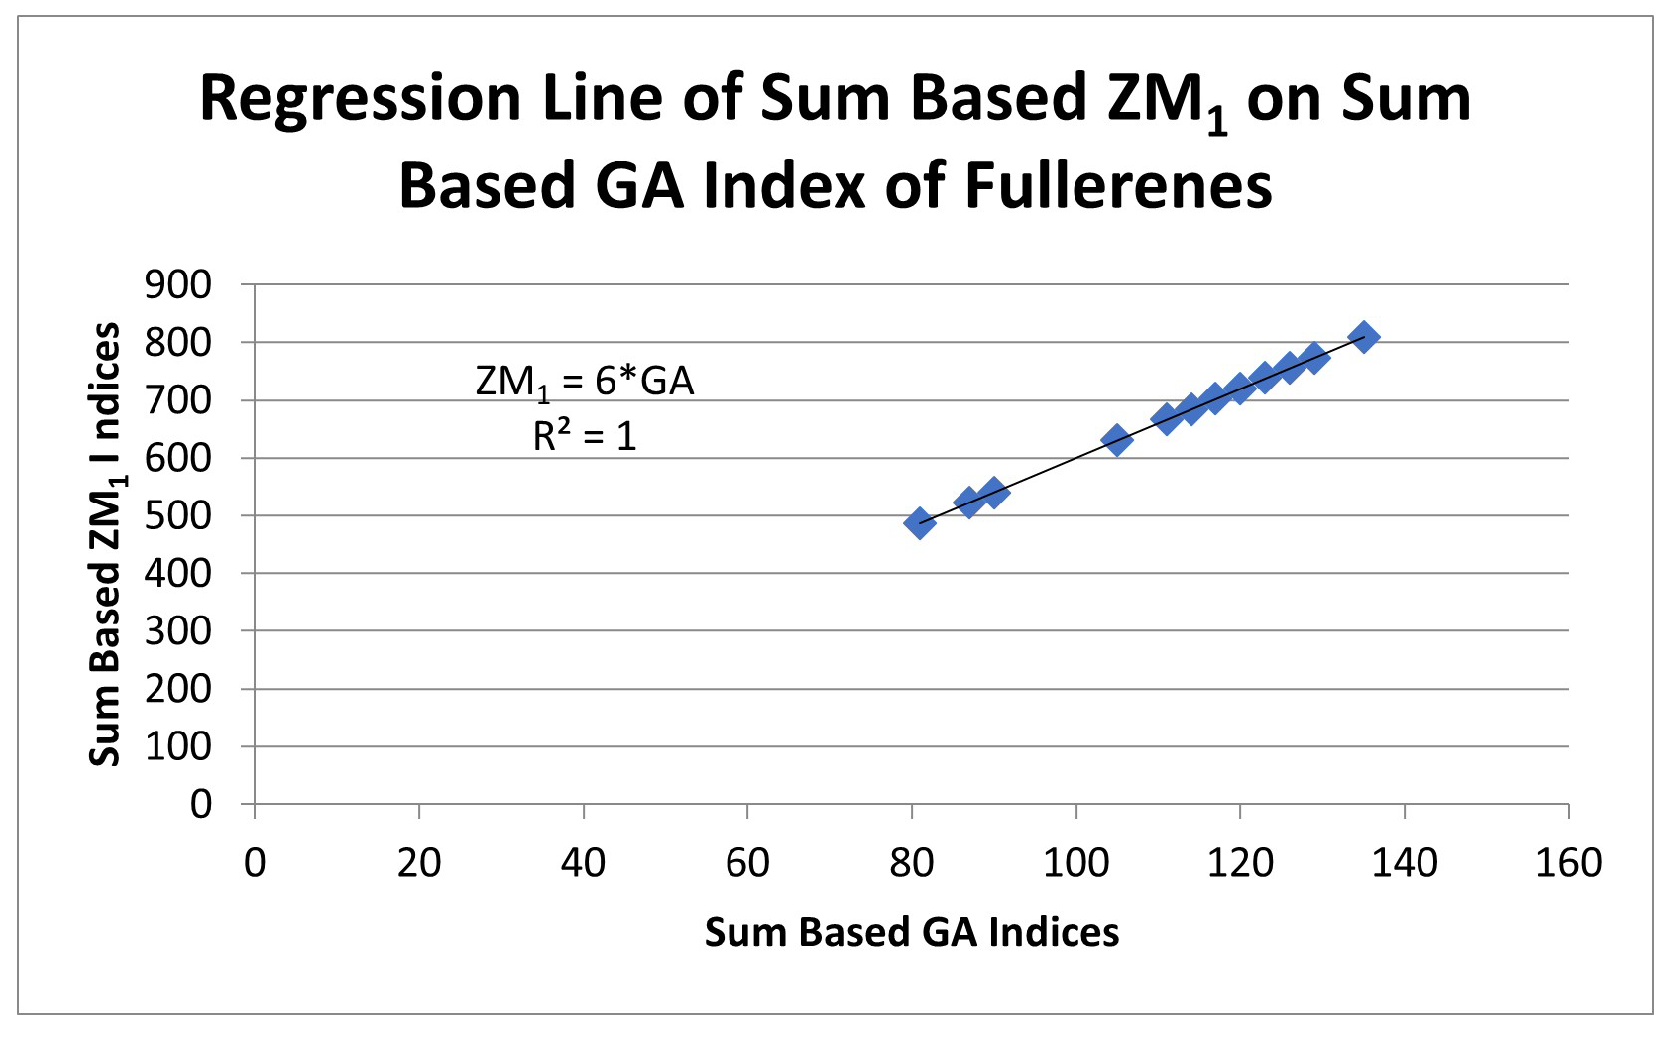
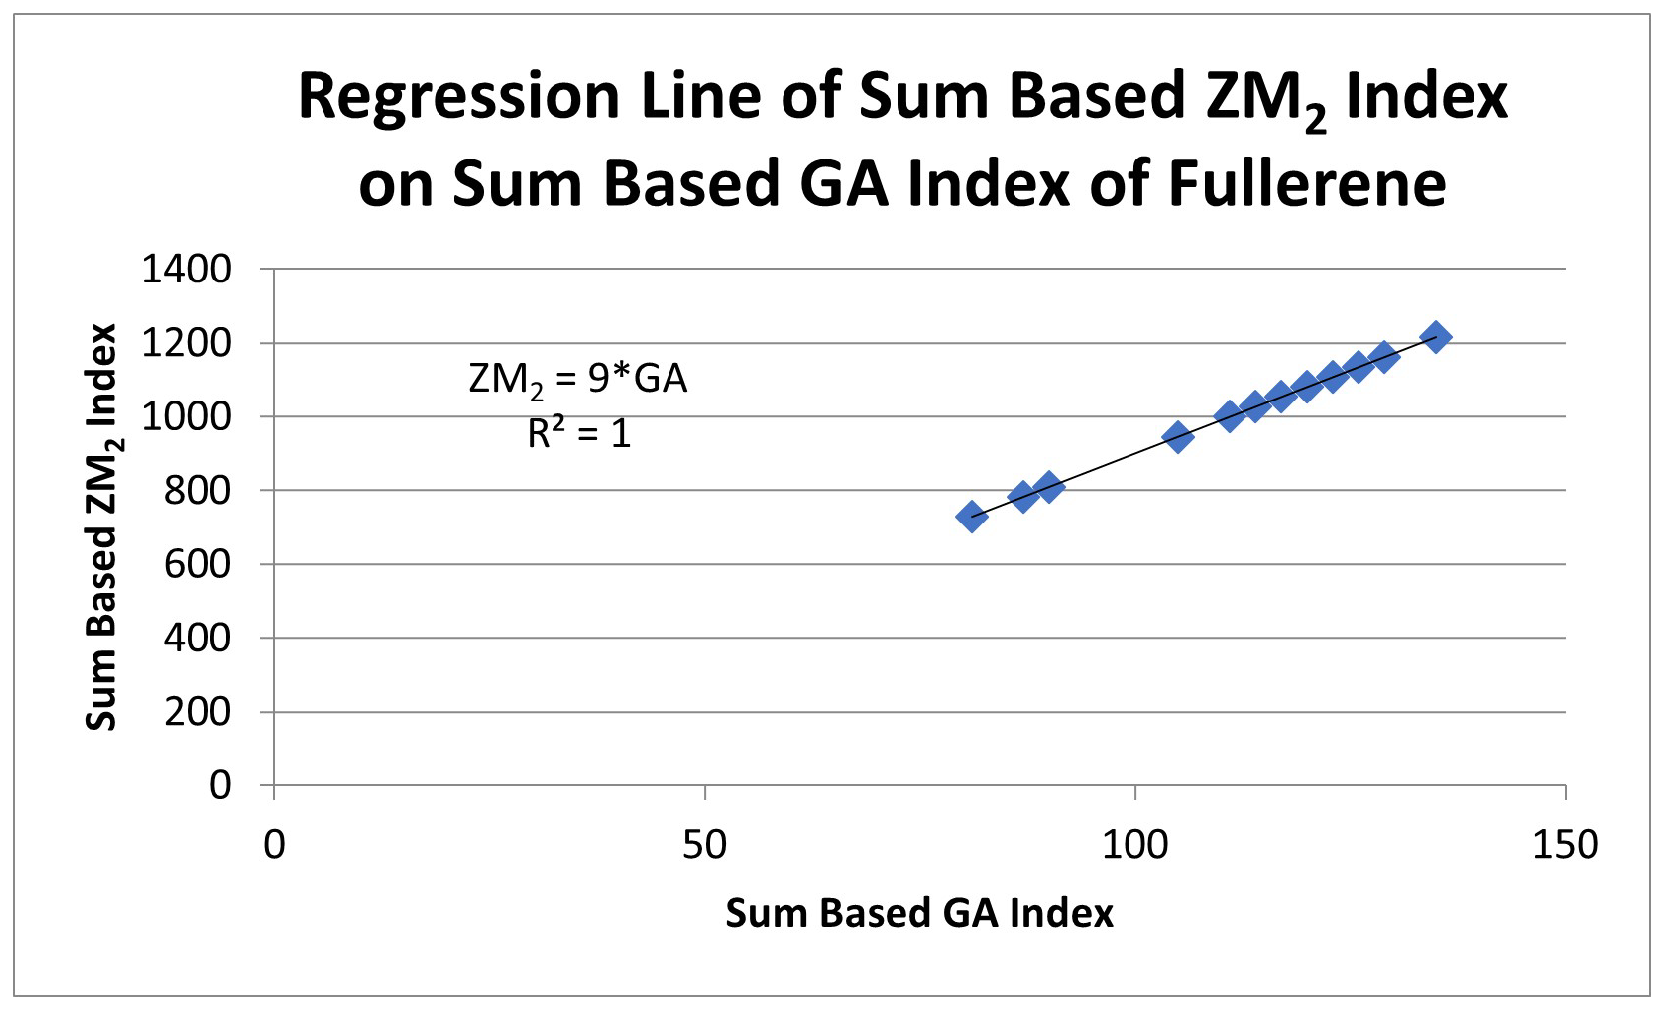
Consider a graph G with vertex set V and edge set E . Let u and v be any two vertices in G with degrees d ( u ) and d ( v ) , respectively. The graphs of different fullerene structures are given in Figure 1.
The sum based TIs we use in our work are as follows.
Using the formulas mentioned in the Table 1, we calculated sum based G A , A B C , R, Z M 1 and Z M 2 indices for the set of ten fullerenes C 54 , C 58 , C 60 , C 70 , C 74 , C 78 , C 80 , C 82 , C 84 , C 86 , and C 90 . It is worth mentioning that each of the fullerenes’ atoms admit three bonds and thus, each of the vertex in its chemical graph has degree three. The computed values are given in Table 2.

4. Analyzing Relationship of Sum Based ABC , R , ZM 1 and ZM 2 Indices with Sum Based GA Index

Presently, we shall analyze linear regression between the each of the sum based A B C , R, Z M 1 and Z M 2 indices and the sum based G A index of fullerenes as calculated in Table 2. The linear dependency relations including the linear regression equation, coefficient of determination and correlation coefficient can be calculated (taken in the form Y ( X ) , X : G A I n d e x , n is the number of observations) are given in Table 3.
The linear dependency relations of sum based A B C , R , Z M 1 and Z M 2 indices on G A index (linear regression relations, determination and correlation coefficients) are given in Table 4.
The relations provided in Table 4 are presented in Figure 2, Figure 3, Figure 4 and Figure 5. It is worth noting that the coefficients of correlation and determination are computed by formulas mentioned in Table 3 to discuss the results in the figures.
Figure 2 indicates the dependency of the sum based A B C index on sum based G A index. It is obvious from the figure that the coefficient of determination is 1 . This shows that the regression relation is fit on hundred percent data. Moreover, the correlation coefficient is calculated as 1 indicating a strong direct relationship between the two indices.
Figure 3 indicates the dependency of sum based R index on sum based G A index. The figure depicts the coefficient of determination as well as the correlation coefficient, which is 1 . This indicates not only that the regression line perfectly fits over the whole data but that there is a strong direct relationship between the indices.
Figure 4 indicates the dependency of sum based Z M 1 index on sum based G A index. The figure shows a perfect fit of the linear regression on the data points due to the coefficient of determination being 1 . The correlation coefficient is the unity, indicating a strong direct relationship between the indices.
Figure 5 indicates the dependency of the sum based Z M 2 index on sum based G A index. It is visible from the figure that the regression line is the best fit to the data, due to which the coefficient of determination is 1 . The correlation coefficient is calculated as 1, defining a strong direct relationship between the indices.
The Figure 2, Figure 3, Figure 4 and Figure 5 indicate that the sum based A B C , R , Z M 1 and Z M 2 indices have perfect correlation with the sum based G A index. Therefore, we will be able to illustrate the relationship between physical qualities (BE, RT minima, SRs and HoF) and all specified indices by relating them just to the sum based G A index.

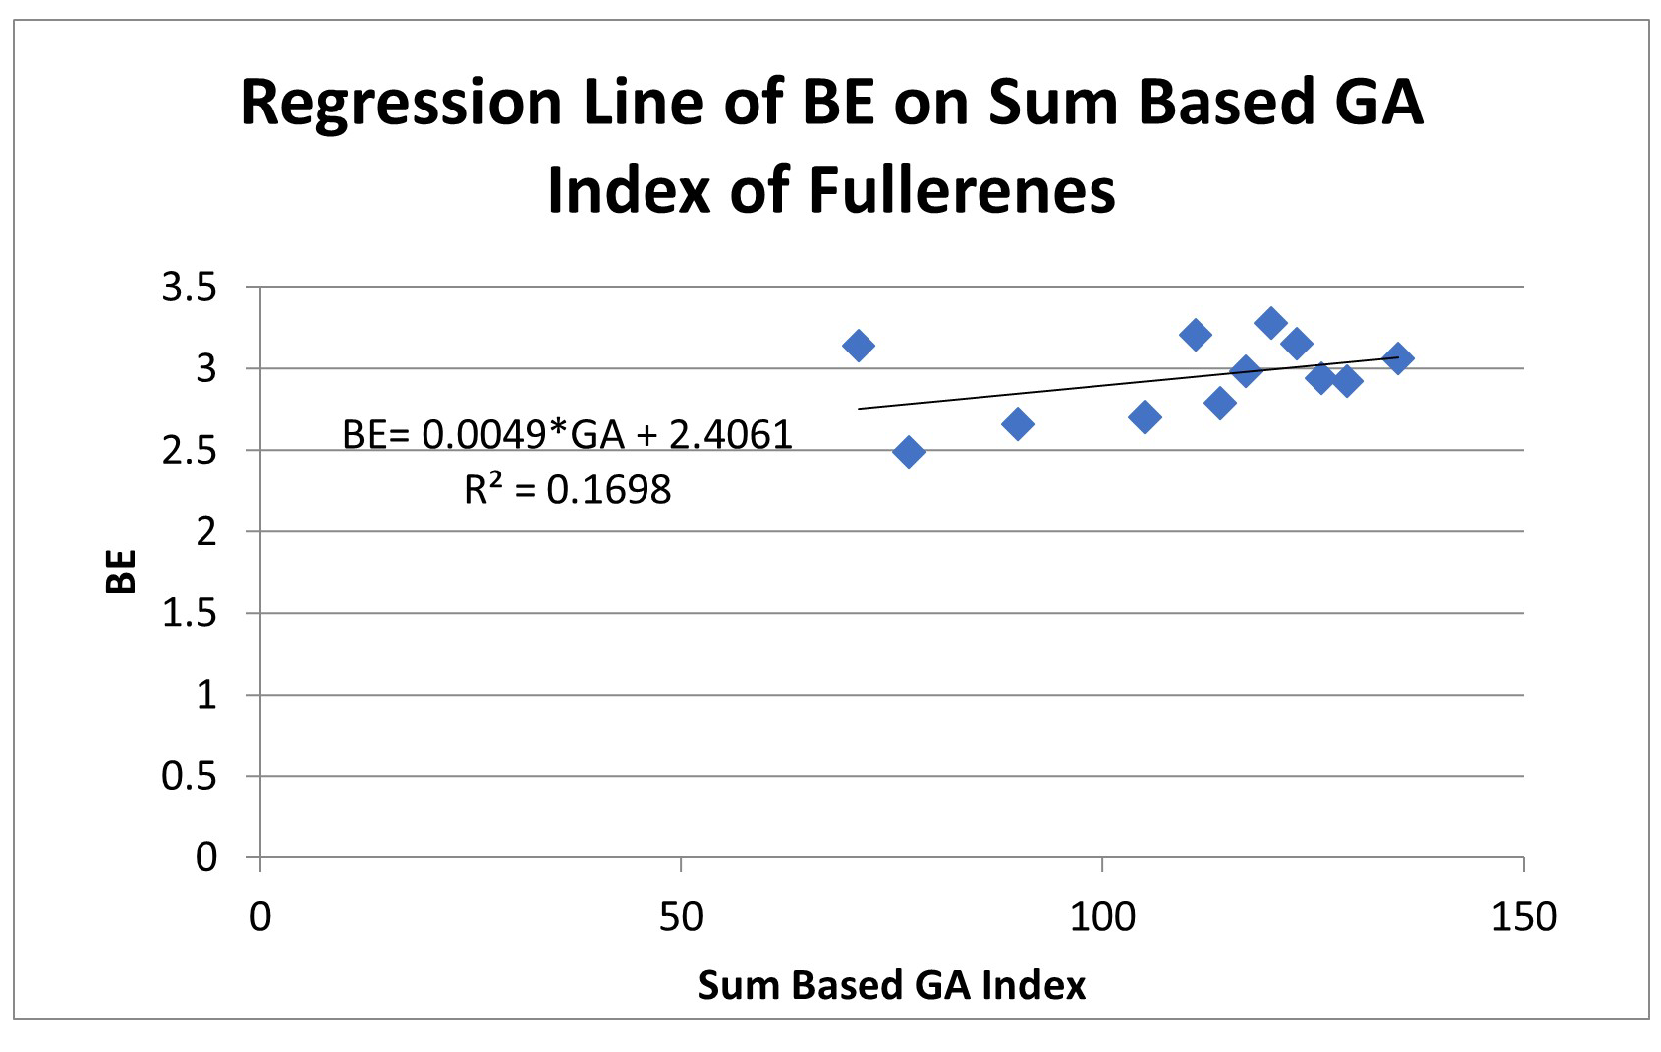
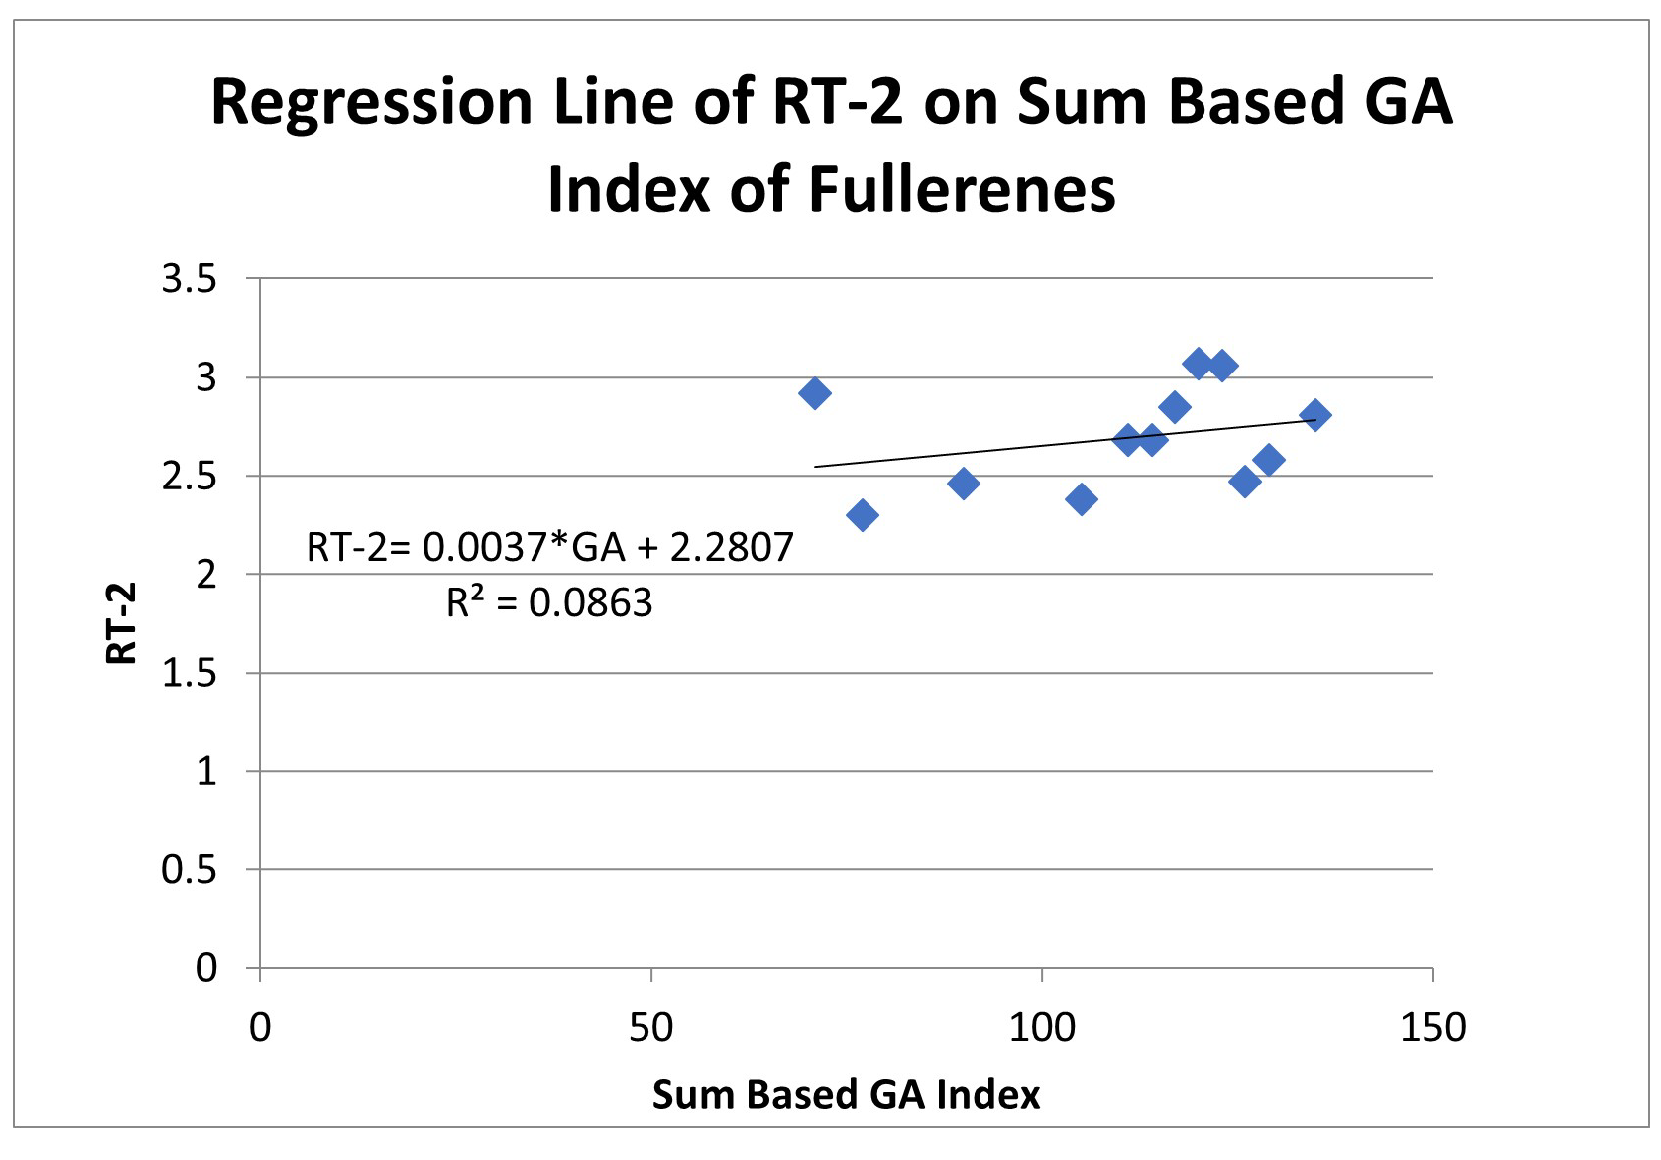
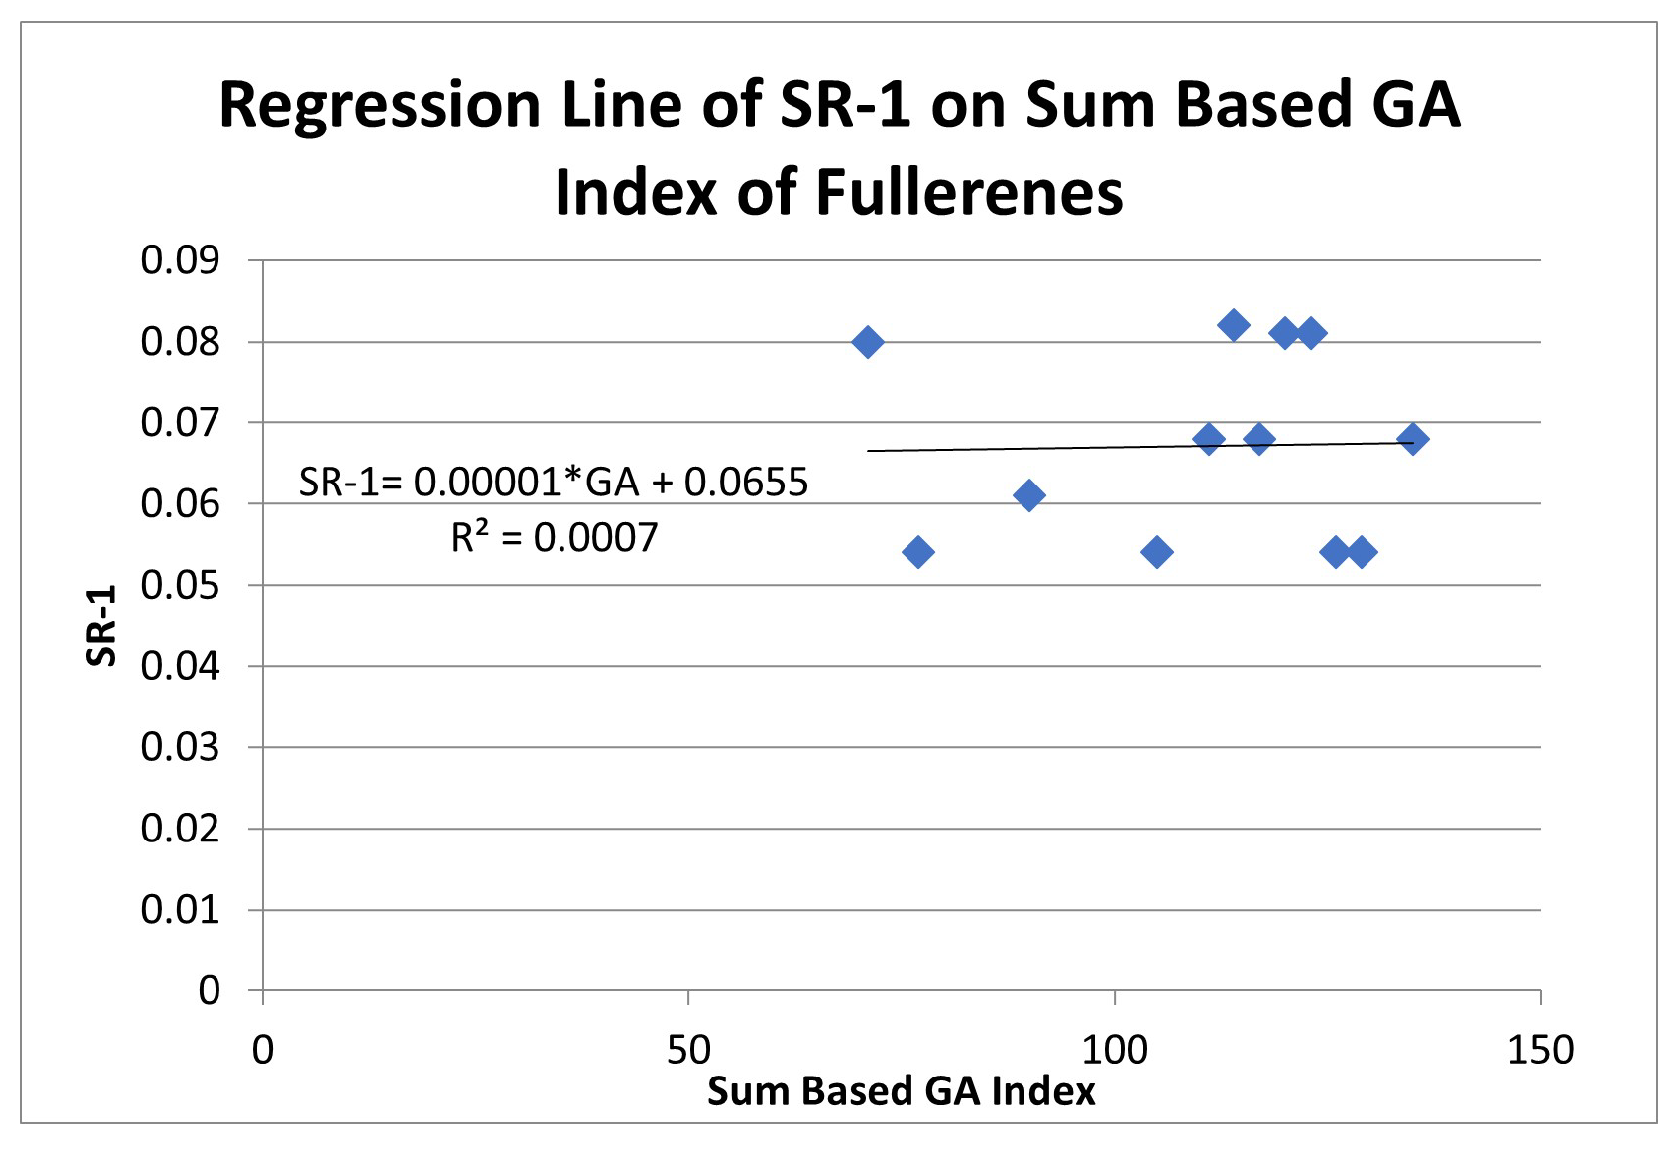
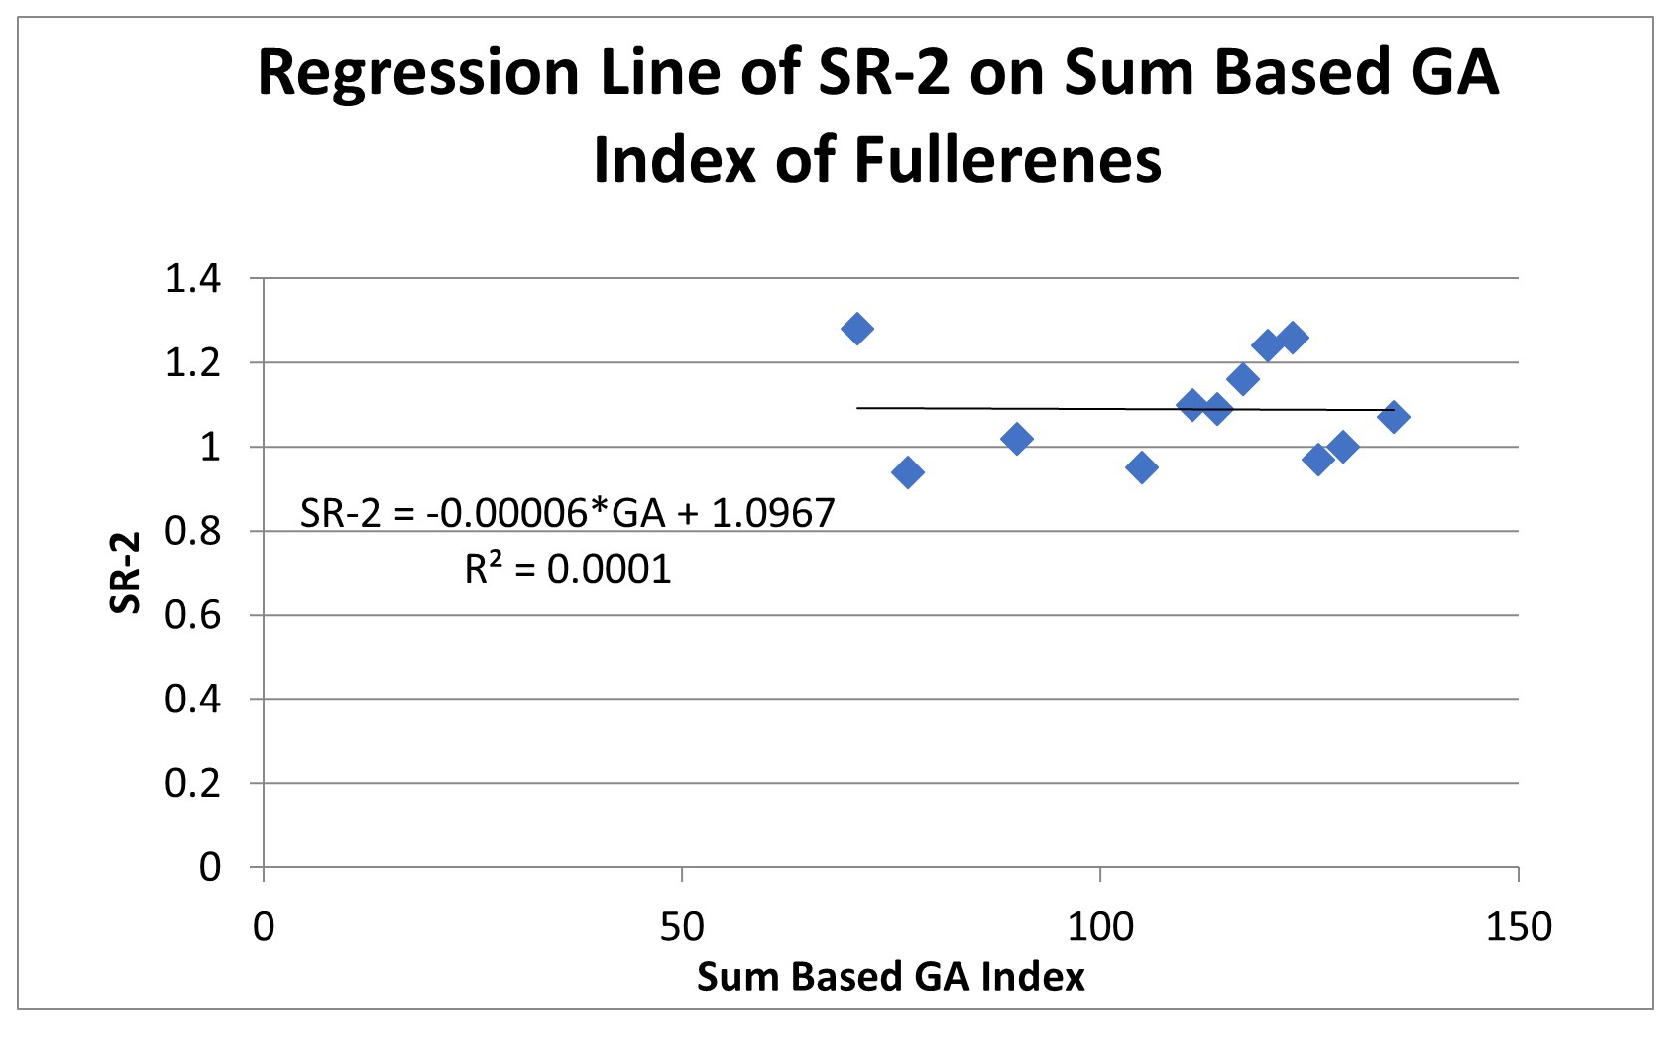
5. Analyzing the Relationship of Physical Properties with Sum Based GA Index

We can analyze the linear relationship of the HoF, BE, RT minima and SR of fullerenes with their G A indices. For this purpose, we collected these properties of the C 54 , C 58 , C 60 , C 70 , C 74 , C 78 , C 80 , C 82 , C 84 , C 86 , C 90 fullerene structures [27]. These properties are mentioned in Table 5.
The regression analysis between each of the physical properties, such as BEs, RT-1, RT-2, SR-1, SR-2 and Hof (data provided in Table 5), depending on the sum based G A index, can be exhibit by the following figures.
It can be deduced from the Figure 6, Figure 7, Figure 8, Figure 9, Figure 10 and Figure 11 and Table 6 that the linear regression relation of the heat of formation on the GA index fits on most of the data points. The coefficient of determination is 0.89183 , indicating a better goodness of fit to the observations. Thus, the regression line fits on more than 89 percent of data. The correlation coefficient is 0.944 , indicating a strong positive correlation between the heat of formation and the sum based G A index.
The regression relations and related quantitative measures (coefficients of determination and correlation) can be summarized as:

6. Conclusions

This work deals with the calculations of a productive sum based topological index correlated to fullerene’s physical properties. For this purpose, we consider C 54 , C 58 , C 60 , C 70 , C 74 , C 78 , C 80 , C 82 , C 84 , C 86 , C 90 fullerene balls. The chemical structures are graphically plotted and presented. It was noticed that the degree of each of the vertex’s of chemical graph is three. The sum based G A , A B C , R , Z M 1 and Z M 2 indices are computed. The linear regression analysis is performed where a regression line is fitted to the data. A regression line depicts a linear behavior of the data using the famous least squares fit and thus provides the highest accuracy. We calculated the coefficient of determination and the correlation coefficient for the data. The regression analysis of the sum based A B C , R , Z M 1 and Z M 2 indices depending on the sum based G A index leads to the result that all the indices are strongly related to the sum based G A index for these structures.
We considered the physical properties including BEs, RT-1, RT-2, SR-1, SR-2 and Hof of the mentioned fullerene cages. The linear regression analysis of these properties depending on the sum based G A index is performed. It was observed that the physical properties including binding energies, first and second Ramsauer-Townsend minima and first and second shape resonances are not strongly correlated with the sum based G A index. However, the sum based G A index ideally represents the heat of formation of the structures with a strong coefficient of determination and strong correlation coefficient. Thus, we can conclude that the sum based G A index is the best to predict the Hof of fullerene structures with a strong dependence on the sum based G A index.
It is noteworthy that this study concerns the prediction of physical properties of fullerenes on the basis of the GA index. It is found that the the heat of formation can be predicted with the highest accuracy from the derived linear regression relation. These models may be used to systematize ecological, biochemical, and medical knowledge relevant to the use of fullerenes. Since the application of fullerenes has grown daily, this systematization steadily assumes a significant role.

Author Contributions

U.S., Conceptualization, Writing—Reviewing and Editing, Supervision. Q.u.A.T., Methodology, Writing—Original draft preparation, Investigation. Y.N.A., Software, Visualization. R.P., Software, Validation. All authors have read and agreed to the published version of the manuscript.

Funding

The work was partially funded by Slovak Grant Agency for Science VEGA under the grant number VEGA 2/0009/19.

Data Availability Statement

Data sharing not applicable to this article, as no data-sets were generated or analyzed during the current study.

Acknowledgments

The authors acknowledge the support of HEC Pakistan, National Textile University Faisalabad and University of Education, Lahore (Faisalabad Campus) for their administrative and technical support.

Conflicts of Interest

The authors declare that they have no known competing financial interests or personal relationships that could have appeared to influence the work reported in this paper.

References

  1. Deza, M.; Fowler, P.W.; Rassat, A.; Rogers, K.M. Fullerenes as tilings of surfaces. J. Chem. Inf. Comput. Sci. 2000, 40, 550–558. [Google Scholar] [CrossRef] [PubMed]
  2. Mehboob, M.Y.; Adnan, M.; Hussain, R.; Irshad, Z. Quantum chemical designing of banana-shaped acceptor materials with outstanding photovoltaic properties for high-performance non-fullerene organic solar cells. Synth. Met. 2021, 277, 116800. [Google Scholar] [CrossRef]
  3. Joshi, G.; Mehta, K.P. Fabrication and applications of fullerene-based metal nanocomposites: A review. J. Mater. Res. 2021, 36, 114–128. [Google Scholar]
  4. Zhang, J.; Zhou, Q.; Cao, J.; Wu, W.; Zhang, H.; Shi, Y.; Mao, Q.; Ma, H. Flexible textile ion sensors based on reduced graphene oxide/fullerene and their potential applications of sweat characterization. Cellulose 2021, 28, 3123–3133. [Google Scholar] [CrossRef]
  5. Kepley, C.L. Fullerenes in medicine; Will it ever occur? J. Nanomed. Nanotechnol. 2012, 3, e111. [Google Scholar] [CrossRef]
  6. Shunaev, V.V.; Pincak, R.; Glukhova, O.E. The energetical, electronic and optical properties of the intermetallic fullerene Fe@ C60. Comput. Theor. Chem. 2022, 1214, 113784. [Google Scholar] [CrossRef]
  7. Bosi, S.; Ros, T.D.; Spalluto, G.; Prato, M. Fullerene derivatives: An attractive tool for biological applications. Eur. J. Med. Chem. 2003, 38, 913–923. [Google Scholar] [CrossRef]
  8. Cataldo, F.; Da Ros, T. (Eds.) Medicinal Chemistry and Pharmacological Potential of Fullerenes and Carbon Nanotubes; Springer Science and Business Media: New York, NY, USA, 2008; Volume 1. [Google Scholar]
  9. Krishna, V.; Singh, A.; Sharma, P.; Iwakuma, N.; Wang, Q.; Zhang, Q.; Knapik, J.; Jiang, H.; Grobmyer, S.R.; Koopman, B.; et al. Polyhydroxy fullerenes for non-invasive cancer imaging and therapy. Small 2010, 6, 2236–2241. [Google Scholar] [CrossRef]
  10. Sheikh, U.; Rashid, S.; Ozel, C.; Pincak, R. On Hosoya Polynomial and Subsequent Indices of C4C8(R) and C4C8(S) Nanosheets. Symmetry 2022, 14, 1349. [Google Scholar] [CrossRef]
  11. Sheikh, U.; Rashid, S.; Ozel, C.; Pincak, R. On Hosoya Polynomial and Subsequent Indices of Pent-Heptagonal Carbon Nanosheets. Int. J. Geom. Methods Mod. Phys. 2022. [Google Scholar] [CrossRef]
  12. Babar, U.; Ali, H.; Arshad, S.H.; Sheikh, U. Multiplicative topological properties of graphs derived from honeycomb structure. Aims Math. 2020, 5, 1562–1587. [Google Scholar] [CrossRef]
  13. Mondal, S.; De, N.; Pal, A. Multiplicative degree based topological indices of nanostar dendrimers. Biointerface Res. Appl. Chem. 2021, 11, 7700–7711. [Google Scholar]
  14. Estrada, E. Atom-bond connectivity and the energetic of branched alkanes. Chem. Phys. Lett. 2008, 463, 422–425. [Google Scholar] [CrossRef]
  15. Estrada, E.; Torres, L.; Rodriguez, L.; Gutman, I. An atom-bond connectivity index: Modelling the enthalpy of formation of alkanes. Indian J. Chem. 1998, 37A, 849–855. [Google Scholar]
  16. Shanmukha, M.C.; Usha, A.; Siddiqui, M.K.; Fufa, S.A.; Praveen, B.M. Degree-Based Molecular Descriptors of Guar Gum and Its Chemical Derivatives. J. Chem. 2022, 2022, 7371538. [Google Scholar] [CrossRef]
  17. Turaci, T.; Durgut, R. On topological properties of some molecular cactus chain networks and their subdivisions by using line operator. J. Discret. Math. Sci. Cryptogr. 2021, 1–18. [Google Scholar] [CrossRef]
  18. Naeem, M.; Rauf, A.; Maqbool, S.; Aslam, A. Degree-based topological indices of geranyl and farnesyl penicillin G bioconjugate structure. Eur. Phys. J. Plus 2022, 137, 303. [Google Scholar] [CrossRef]
  19. Bokhary, S.A.H.; Adnan Siddiqui, M.K.; Cancan, M. On Topological Indices and QSPR Analysis of Drugs Used for the Treatment of Breast Cancer. Polycycl. Aromat. Compd. 2022, 42, 6233–6253. [Google Scholar] [CrossRef]
  20. Malik, M.Y.H.; Binyamin, M.A.; Hayat, S. Correlation Ability of Degree-Based Topological Indices for Physicochemical Properties of Polycyclic Aromatic Hydrocarbons with Applications. Polycycl. Aromat. Compd. 2022, 42, 6267–6281. [Google Scholar] [CrossRef]
  21. Ke, X.; Wei, S.; Huang, J. The atom-bond connectivity and geometric-arithmetic indices in random polyphenyl chains. Polycycl. Aromat. Compd. 2021, 41, 1873–1882. [Google Scholar] [CrossRef]
  22. Shanmukha, M.C.; Usha, A.; Basavarajappa, N.S.; Shilpa, K.C. Graph entropies of porous graphene using topological indices. Comput. Theor. Chem. 2021, 1197, 113142. [Google Scholar] [CrossRef]
  23. Hussain, A.; Numan, M.; Naz, N.; Butt, S.I.; Aslam, A.; Fahad, A. On topological indices for new classes of Benes network. J. Math. 2021, 2021, 6690053. [Google Scholar] [CrossRef]
  24. Havare, O.C. Quantitative Structure Analysis of Some Molecules in Drugs Used in the Treatment of COVID-19 with Topological Indices. Polycycl. Aromat. Compd. 2021, 42, 5249–5260. [Google Scholar] [CrossRef]
  25. Rosary, M.S. Topological Study of Line Graph of Remdesivir Compound Used in the Treatment of Corona Virus. Polycycl. Aromat. Compd. 2021, 42, 5731–5747. [Google Scholar] [CrossRef]
  26. Zuo, X.; Rather, B.A.; Imran, M.; Ali, A. On Some Topological Indices Defined via the Modified Sombor Matrix. Molecules 2022, 27, 6772. [Google Scholar] [CrossRef]
  27. Felfli, Z.; Msezane, A. Simple method for determining binding energies of fullerene and complex atomic negative ions. In APS Division of Atomic, Molecular and Optical Physics Meeting Abstracts; American Physical Society: Sacramento, CA, USA, 2017; Volume 2017, pp. Q1–Q144. [Google Scholar]
Figure 1. Graphs of C 54 , C 58 , C 60 , C 70 , C 74 , C 78 , C 80 , C 82 , C 84 , C 86 , C 90 Fullerene Structures.
Symmetry 15 00058 g001
Figure 2. Regression analysis of sum based A B C index depending on sum based G A index.
Symmetry 15 00058 g002
Figure 3. Regression analysis of sum based R index depending on sum based G A index.
Symmetry 15 00058 g003
Figure 4. Regression analysis of sum based Z M 1 index depending on sum based G A index.
Symmetry 15 00058 g004
Figure 5. Regression analysis of sum based Z M 2 index depending on sum based G A index.
Symmetry 15 00058 g005
Figure 6. Regression analysis of bending energy depending on sum based G A index.
Symmetry 15 00058 g006
Figure 7. Regression analysis of first RT minima depending on sum based G A index.
Symmetry 15 00058 g007
Figure 8. Regression analysis of second RT minima depending on sum based G A index.
Symmetry 15 00058 g008
Figure 9. Regression analysis of first shape resonance depending on sum based G A index.
Symmetry 15 00058 g009
Figure 10. Regression analysis of second shape resonance depending on sum based G A index.
Symmetry 15 00058 g010
Figure 11. Regression analysis of heat of formation depending on sum based G A index.
Symmetry 15 00058 g011
Table 1. Mathematical formulas for sum-based G A , A B C , R , Z M 1 and Z M 2 indices.
Index NameAbbreviationFormula
G A Index G A ( G ) μ ν ϵ E ( G ) 2 d μ d ν d μ + d ν
A B C Index A B C ( G ) μ ν ϵ E ( G ) d μ + d ν 2 d μ d ν
R IndexR(G) μ ν ϵ E ( G ) 1 d μ d ν
Z M 1 Index Z M 1 ( G ) μ ν ϵ E ( G ) ( d u + d v )
Z M 2 Index Z M 2 ( G ) μ ν ϵ E ( G ) ( d u × d v )
Table 2. Calculations of sum based G A , A B C , R , Z M 1 and Z M 2 indices for different fullerene structures.
Fullerene Structure GA ABC R ZM 1 ZM 2
C 54 815427486729
C 58 875829522783
C 60 906030540810
C 70 1057035630945
C 74 1117437666999
C 76 11476386841026
C 78 11778397021053
C 80 12080407201080
C 82 12382417381107
C 84 12684427561134
C 86 12986437741161
C 90 13590458101215
Table 3. Mathematical formulas for linear regression, coefficient of determination and correlation coefficient.
RelationExpressionFormula
Regression Line Y = a + b X The coefficients a and b can be calculated from:
   Y = n a + b X , X Y = a X + b X 2 .
Coefficient of Determination R 2 n X Y X Y ( n X 2 ( X ) 2 ) ( n Y 2 ( Y ) 2 )
Coefficient of CorrelationR n X Y X Y ( n X 2 ( X ) 2 ) ( n Y 2 ( Y ) 2 )
Table 4. Linear dependency relations between each of sum based A B C , R , Z M 1 , Z M 2 indices depending on sum based G A index of fullerenes structures.
Sum Based IndexRegression Relation with Sum Based GA IndexCoefficient of DeterminationCorrelation Coefficient
A B C 0.6667 G A 11
R 0.3333 G A 11
Z M 1 6 G A 11
Z M 2 9 G A 11
Table 5. The physical properties including BEs, first and second RTs, first and second SRs and Hof for different fullerene structures.
Fullerene StructureBE (eV)RT-1 (eV)RT-2 (eV)SR-1 (eV)SR-2 (eV)Hof (kcal/mol)
C 54 3.140.942.920.081.28642.0
C 58 2.490.712.300.0540.94648.1
C 60 2.660.762.460.0611.02618.1
C 70 2.700.712.380.0540.95657.7
C 74 3.210.822.680.0681.1694.6
C 76 2.790.822.680.0821.09699.1
C 78 2.980.872.850.0681.16712.5
C 80 3.280.923.070.0811.24727.2
C 82 3.150.953.060.0811.26727.8
C 84 2.940.722.470.0540.97768.1
C 86 2.920.752.580.0541.0745.7
C 90 3.060.822.810.0681.07763.7
Table 6. Linear dependency relations between each of HoF, BEs, RT-1, RT-2, SR-1 and SR-2 over sum based G A index of fullerene structures.
Sum Based IndexRegression Relation with Sum Based GA IndexCoefficient of DeterminationCorrelation Coefficient
BEs 0.0049 G A + 2.4061 0.16980.412035
RT-1 0.0002 G A + 0.7967 0.0016150.040187
RT-2 0.0037 G A + 2.2807 0.0863220.293806
SR-1 0.00001 G A + 0.0655 0.00070.02553
SR-2 0.00006 G A + 1.0967 0.0001050.010231
Hof 0.6667 G A 0.891830.94437
Disclaimer/Publisher’s Note: The statements, opinions and data contained in all publications are solely those of the individual author(s) and contributor(s) and not of MDPI and/or the editor(s). MDPI and/or the editor(s) disclaim responsibility for any injury to people or property resulting from any ideas, methods, instructions or products referred to in the content.

