1. Introduction
Fullerenes are active carbon molecules with a closed or partially closed mesh of atoms connected by single or double bonds. Fullerenes are famous carbon allotropes with fused rings of five to seven atoms. These structures can be embedded into a sphere, torus, Klein bottle, and projective plane [
1]. The molecular structure of fullerenes gives them outstanding macroscopic properties including high tensile strength, electrical conductivity, ductility, heat conductivity, and chemical inactivity [
2].
Nanostructures rules the industry due to their negligible dimensions. Fullerenes as dimers and oligomers are attractive molecular objects that fall in between molecules and nanostructures. Their minute size requires the use of high-cost quantum chemical techniques to compute their structural and molecular characteristics. Fullerenes are closed carbon structures used in various industries [
3]. Fullerenes are used as anti-aging, anti-damage, anti-viral and anti-oxidant agents. Moreover, fullerenes are used in making carbon nanotubes-based fabrics and fibers [
4]. The unique chemistry of fullerenes make them applicable in the fields of medicine, superconductors and fiber optics [
5,
6,
7,
8,
9].
Chemical structures are mathematically modeled as graph in chemical graph theory. A chemical graph is a representation of a compound’s structural formula in terms of graph theory, as used in chemical graph theory and mathematical chemistry. The chemical graph presents atom as vertices and atomic bonds as edges. This graph admits scalar graph invariants called topological indices. A topological index or connectivity index is a molecular structure descriptor that characterizes the compound’s topology [
10,
11].
Degree-based topological indices (TIs) are useful for identifying the quantitative structure analysis of chemicals, nanostructures, and medicines. The multiplicative degree-based TIs generated for nanostar dendrimers have the potential to be used in chemical, biological, and medicinal applications [
12,
13]. The famous geometric arithmetic and atom bond connectivity indices are proven to be valuable tools in quantitative structure-property relationship (QSPR) and quantitative structure-activity relationship (QSAR) research. The atom bond connectivity index admits a strong link with heat of formation of branched alkanes and the strain energy of cycloalkanes [
14,
15]. Recently, the geometric arithmetic and atom bond connectivity indices of Guar gum and its derivatives [
16], linear graphs of molecular cactus chain networks and their subdivisions [
17], geranyl and farnesyl penicillin G bioconjugate with and without a sensitive bond [
18], drugs used for the treatment of breast cancer [
19] and polycyclic aromatic hydrocarbons [
20] are calculated to relate with the QSPR.
Simple explicit formulae are developed to predict the geometric arithmetic and atom bond connectivity indices and their expected values in random polyphenyl chains with
n hexagons [
21]. The weighted graph entropies for the porous graphene structure are analyzed using the first and second Zagreb, Randic and reciprocal Randic, first and fourth atom-bond connectivity, first and fifth geometric arithmetic, harmonic and sum-connectivity indices [
22]. The general Randic connection, general Zagreb, general sum connectivity, first, second and multiplicative Zagreb, atom-bond connectivity, and geometric arithmetic indices of horizontal and vertical cylindrical Benes networks are calculated [
23].
The regression analysis between the TIs and the physical properties of the chemicals is in fashion. The curvilinear regression relations between several COVID-19 drugs and the physicochemical properties have been developed [
24]. For the famous COVID-19 drug Remdesivir, the reverse general Randic index, reverse atom bond connectivity index, reverse geometric arithmetic index, reverse forgotten index, reverse Balaban index, and other types of Zagreb indices are computed to help in the development of new corona virus treatment [
25]. The modified Sombor index and modified Sombor energy give a better quadratic correlation than their corresponding classical versions with the boiling points of the chemical graphs of the order of at most seven [
26].
Fullerenes posses important physical properties including binding energies (BE), Ramsauer-Townsend minima (RT minima), shape resonances (SR) and heat of formation (HoF). The BE is the amount of energy necessary to detach a particle from a particle system or to scatter all of the particles in the system. Subatomic particles in atomic nuclei, electrons attached to atoms nuclei, and atoms and ions bonded together in crystals represents significance of binding energy. The RT effect is the scattering of low-energy electrons by atoms of a noble gas. The SR is a meta-stable condition in which a potential barrier’s form traps an electron. Hof is the amount of heat absorbed or evolved when one mole of a compound is formed from its constituent elements, each substance being in its normal physical state.
There are certain statistical methods, which investigate the dependence of the TIs on each other. These include regression analysis and coefficient of correlation. Linear regression uses an equation to represent the linear relationship, whereas correlation quantifies the strength of that linkage. Regression explains the quantitative dependency of one variable on other variable. The coefficient of determination investigates the percentage of data represented by the regression line.
Correlation is the relationship between two or more variables that change in a specific direction and the coefficient of correlation measures its extent. Correlation is a symmetric relation as the correlation describes the strength of association between the two variables. Correlation between two quantities A and B equals the correlation between B and It is noteworthy that a symmetric relationship is not always smooth. It indicates that the fluctuation of the two variables occur at the same time.
The objective of this study is to investigate productive sum based TIs presenting the physical properties of fullerenes. We considered sum based geometric arithmetic (
), atomic bond connectivity (
), Randic (
R), first Zagreb index (
) and second Zagreb index (
) in this regard. Moreover, the physical properties analyzed are BE, RT minima, SRs and Hof. The manuscript is organized as follows: The next section consists of methodology used in research.
Section 3 contains the graphs of fullerene structures used in the work, formulas for sum based TIs and their calculations.
Section 4 keeps the analysis of relation between each of the sum based TI with the sum based GA index.
Section 5 is comprised of the analysis of physical variables including BE, RT minima, SRs and Hof with the sum based GA index. The last section consists of the conclusion of the research.
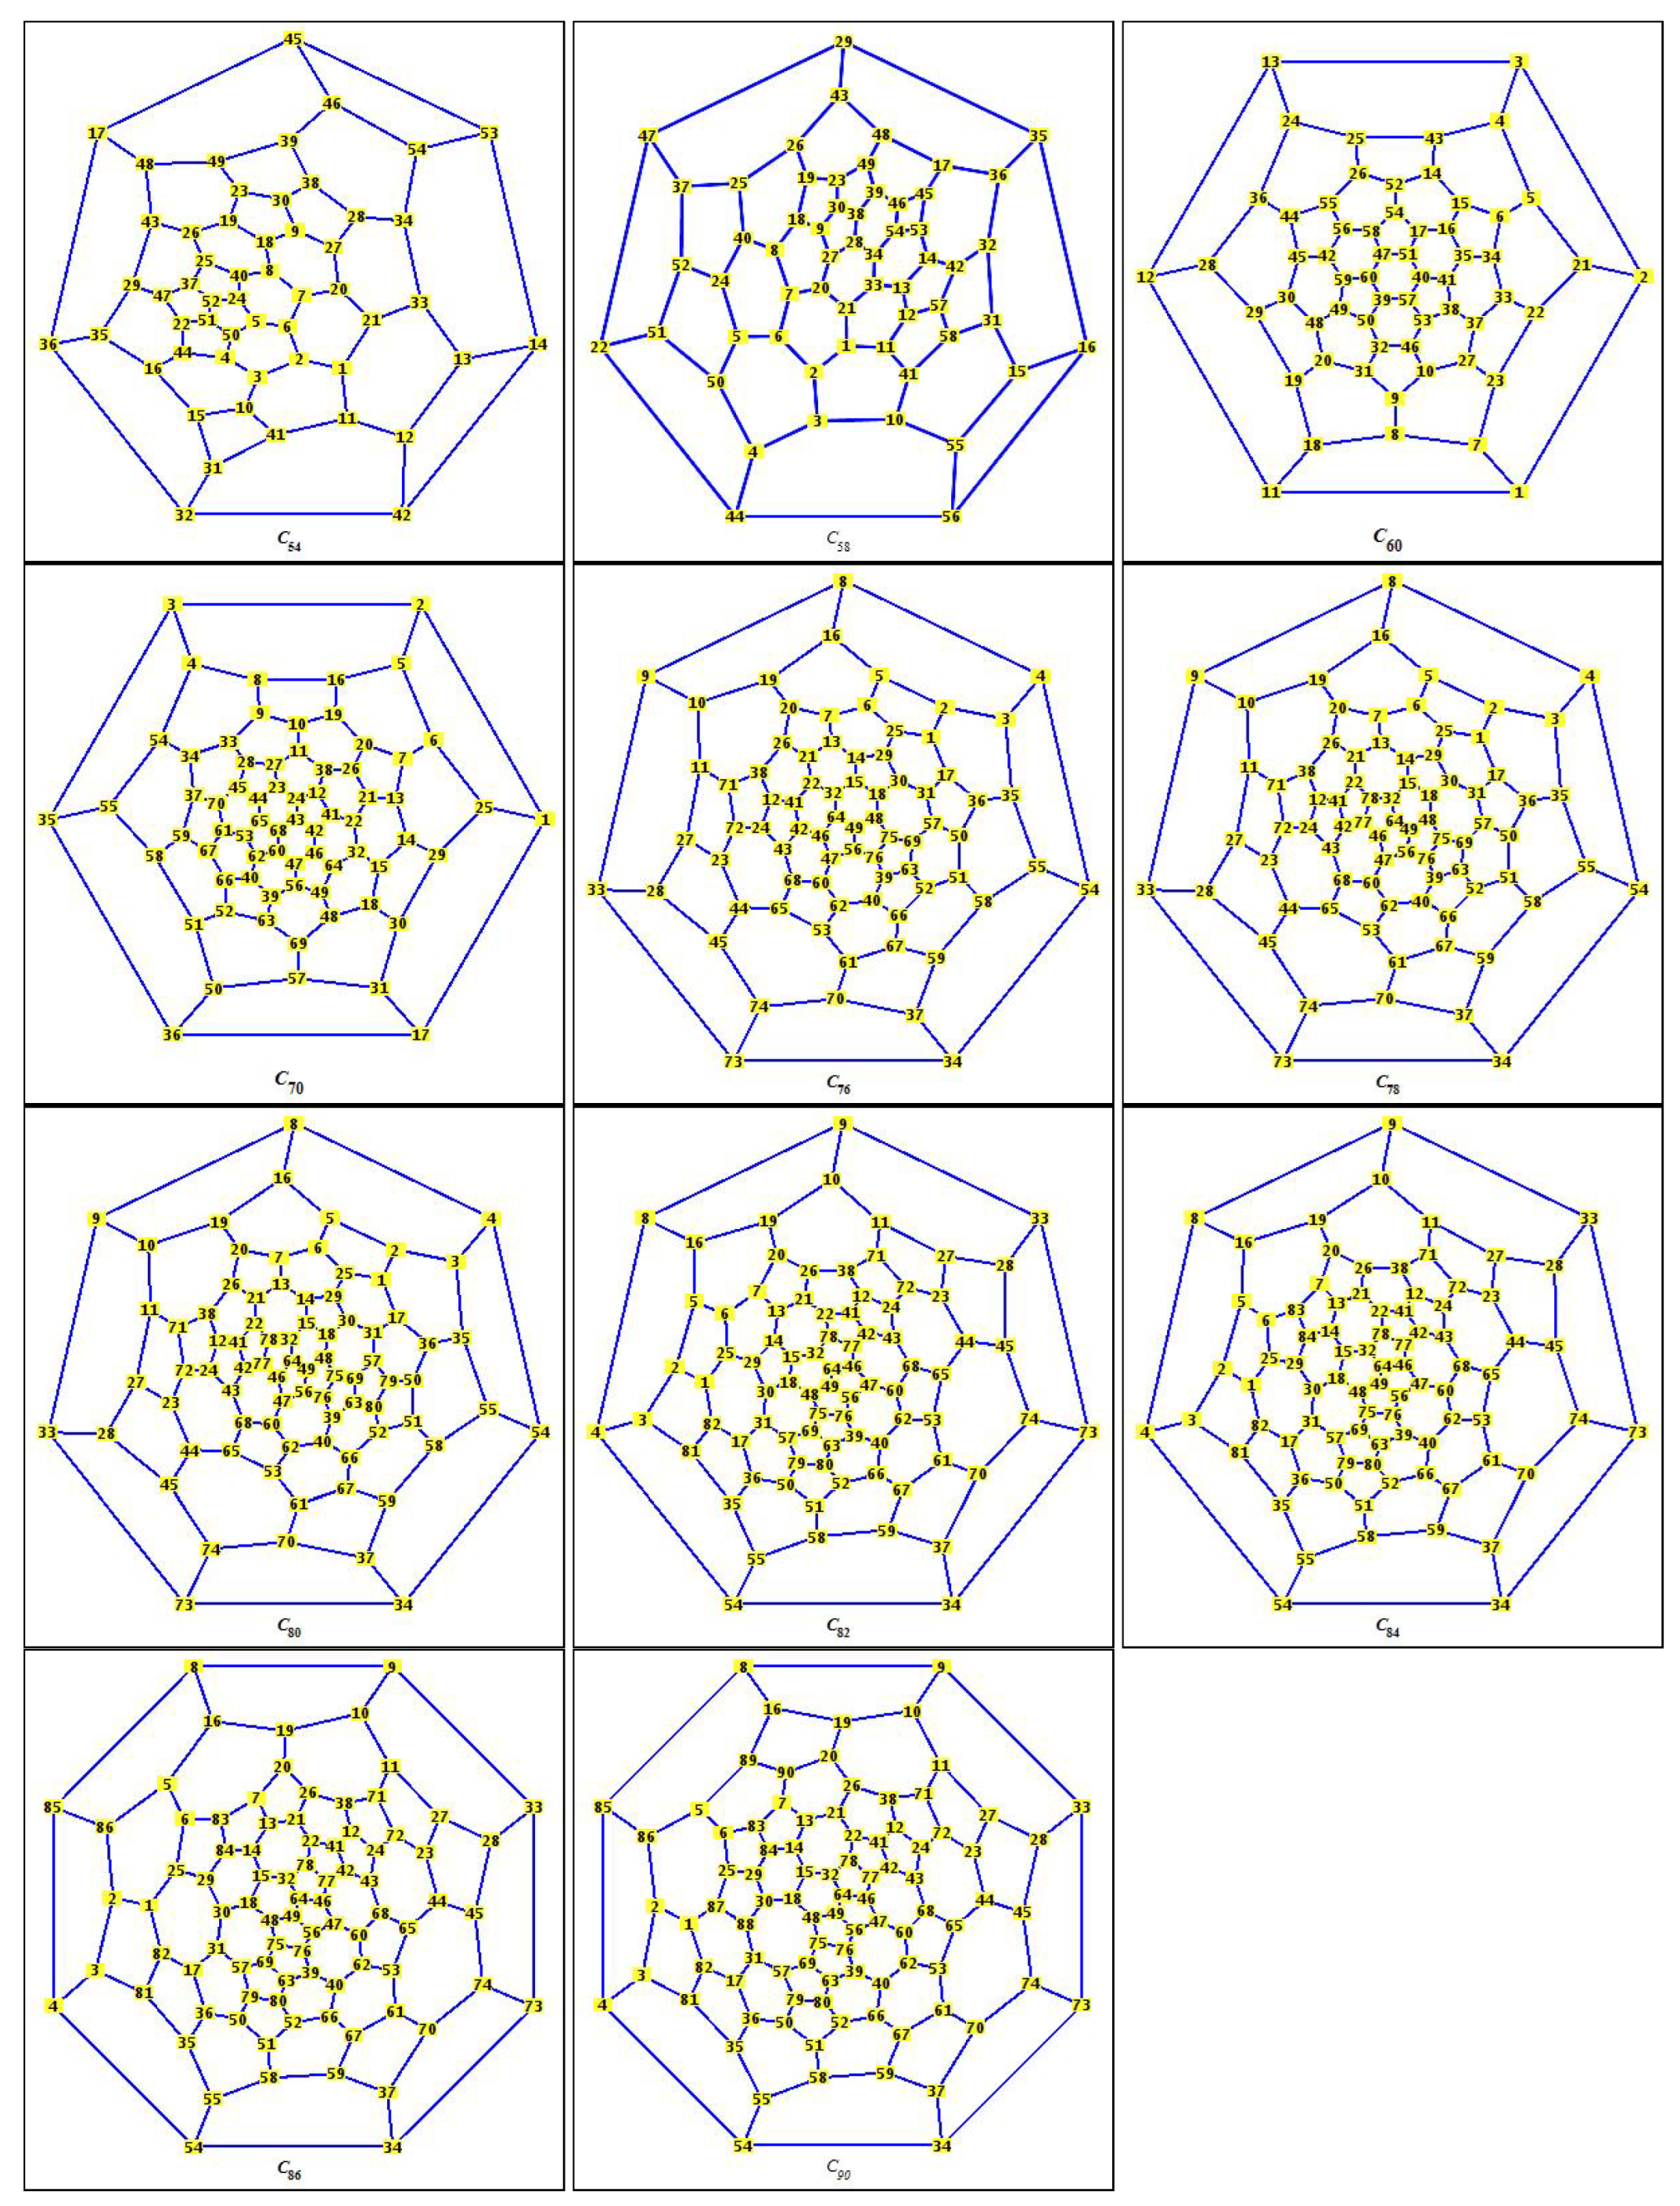
4. Analyzing Relationship of Sum Based and Indices with Sum Based Index
Presently, we shall analyze linear regression between the each of the sum based
,
R,
and
indices and the sum based
index of fullerenes as calculated in
Table 2. The linear dependency relations including the linear regression equation, coefficient of determination and correlation coefficient can be calculated (taken in the form
is the number of observations) are given in
Table 3.
The linear dependency relations of sum based
and
indices on
index (linear regression relations, determination and correlation coefficients) are given in
Table 4.
The relations provided in
Table 4 are presented in
Figure 2,
Figure 3,
Figure 4 and
Figure 5. It is worth noting that the coefficients of correlation and determination are computed by formulas mentioned in
Table 3 to discuss the results in the figures.
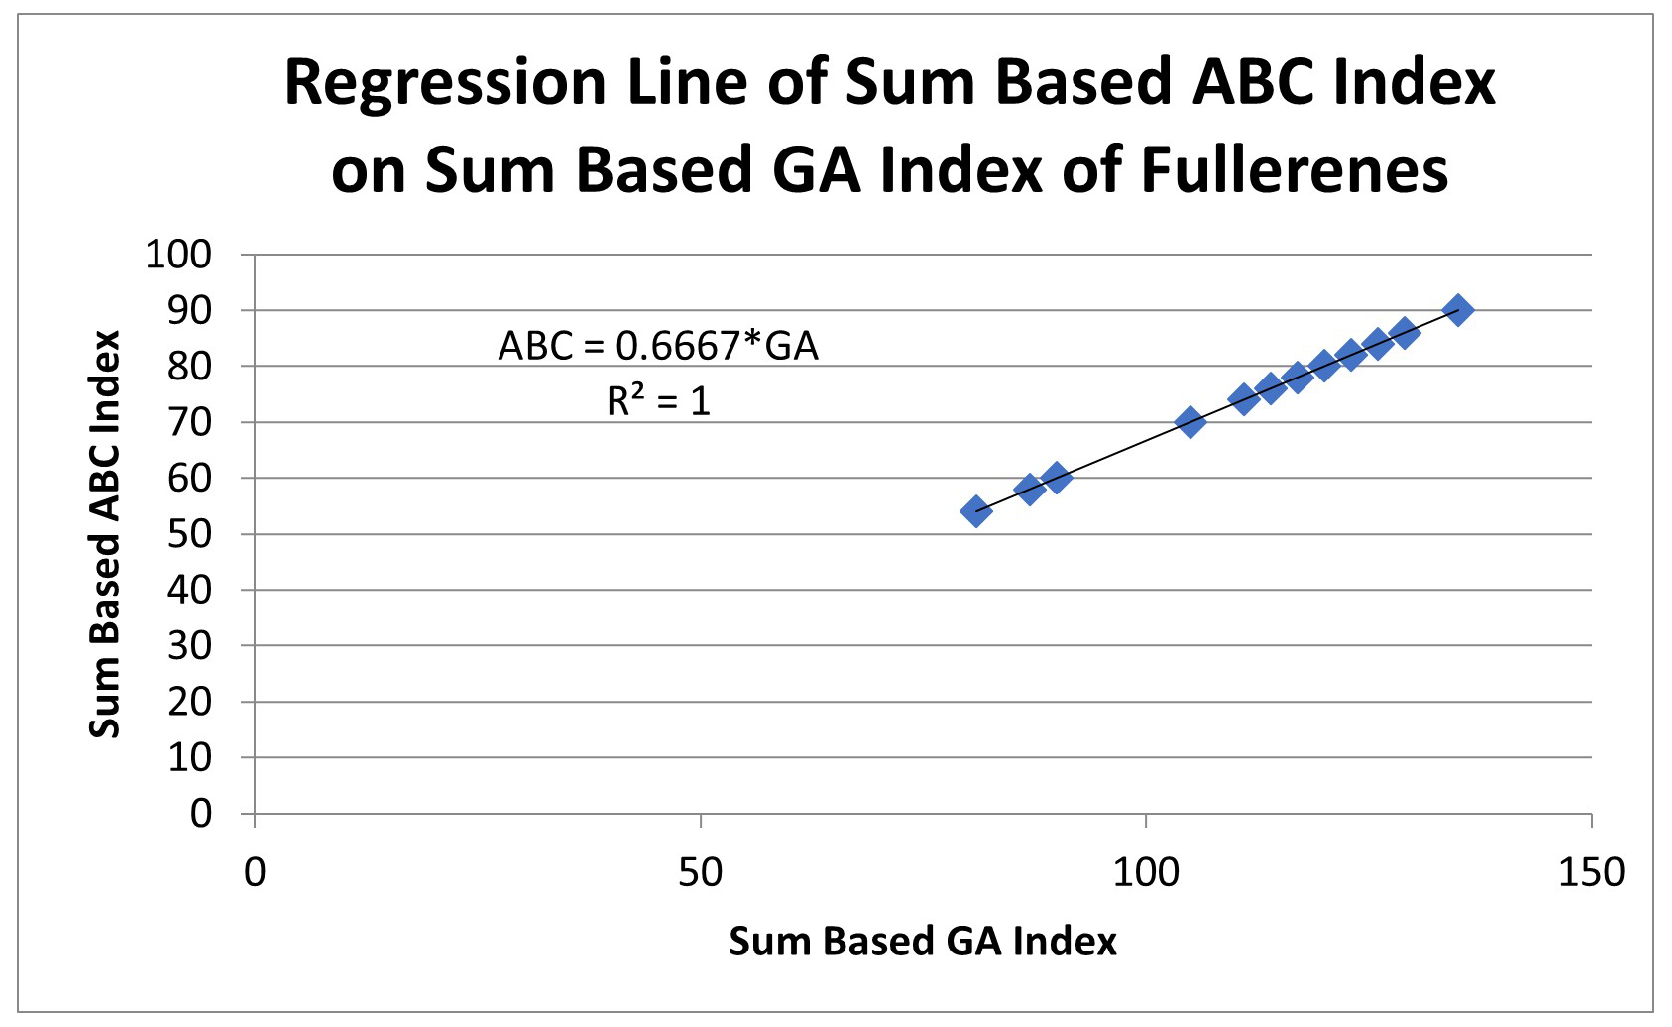
Figure 2 indicates the dependency of the sum based
index on sum based
index. It is obvious from the figure that the coefficient of determination is
This shows that the regression relation is fit on hundred percent data. Moreover, the correlation coefficient is calculated as 1 indicating a strong direct relationship between the two indices.
Figure 3 indicates the dependency of sum based
R index on sum based
index. The figure depicts the coefficient of determination as well as the correlation coefficient, which is
This indicates not only that the regression line perfectly fits over the whole data but that there is a strong direct relationship between the indices.
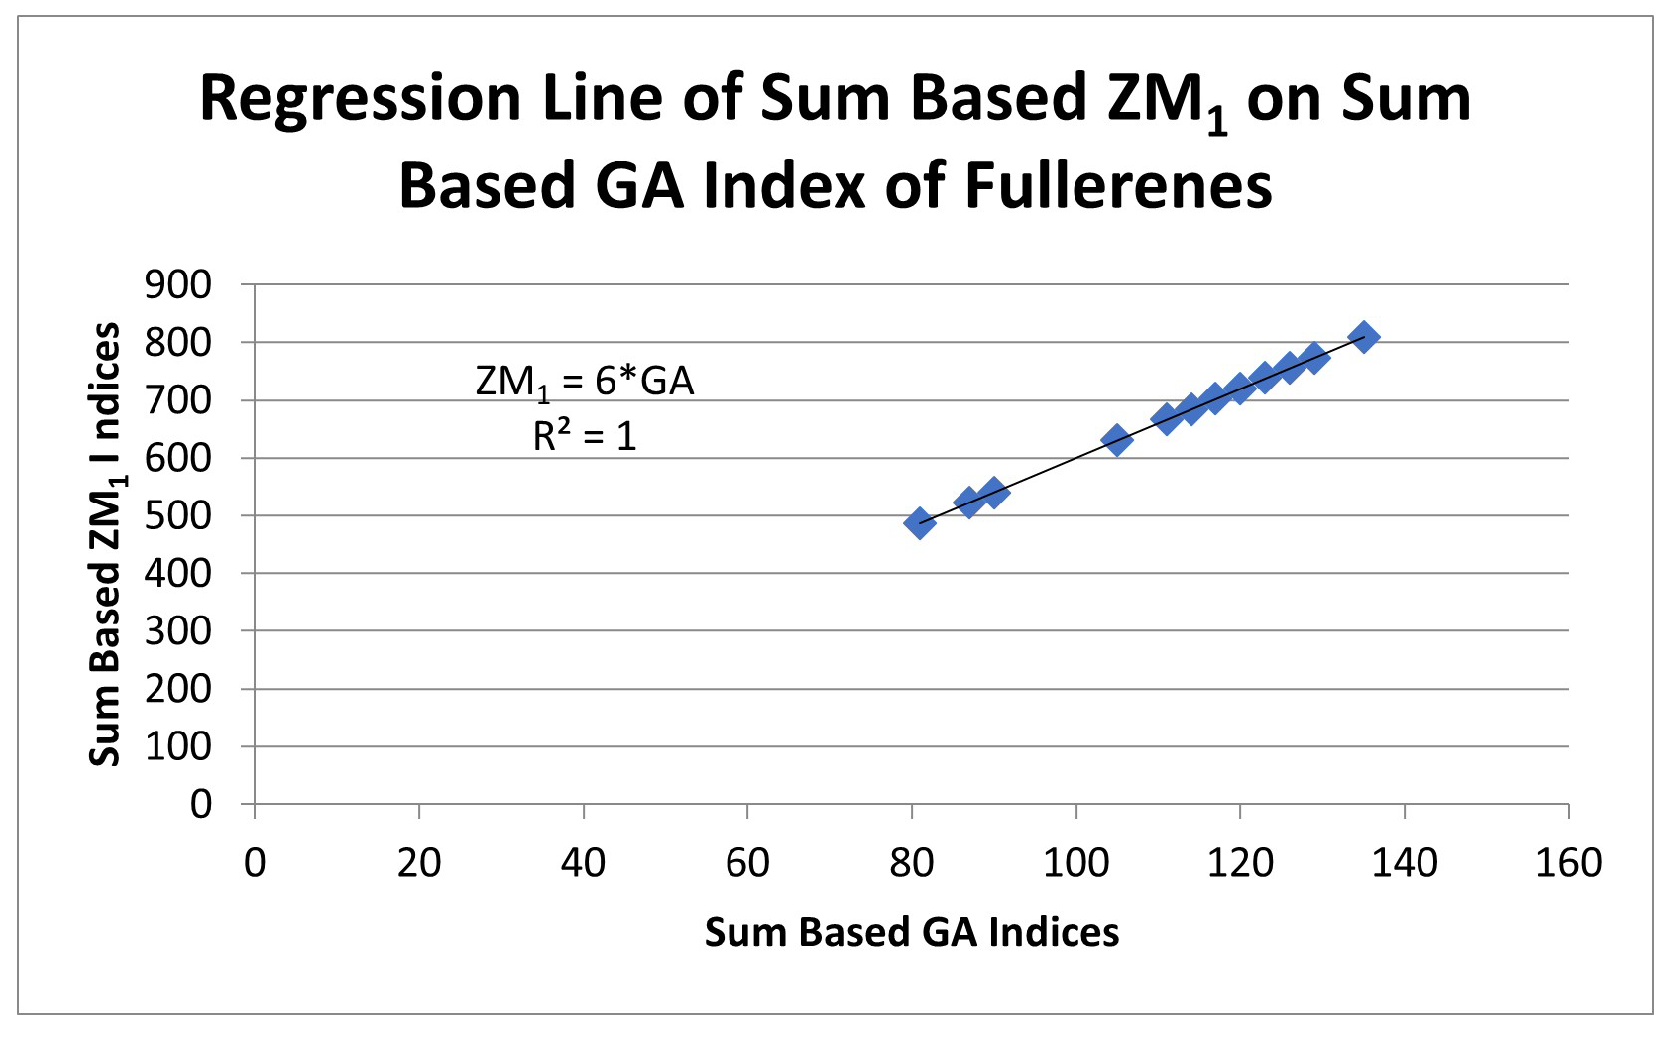
Figure 4 indicates the dependency of sum based
index on sum based
index. The figure shows a perfect fit of the linear regression on the data points due to the coefficient of determination being
The correlation coefficient is the unity, indicating a strong direct relationship between the indices.
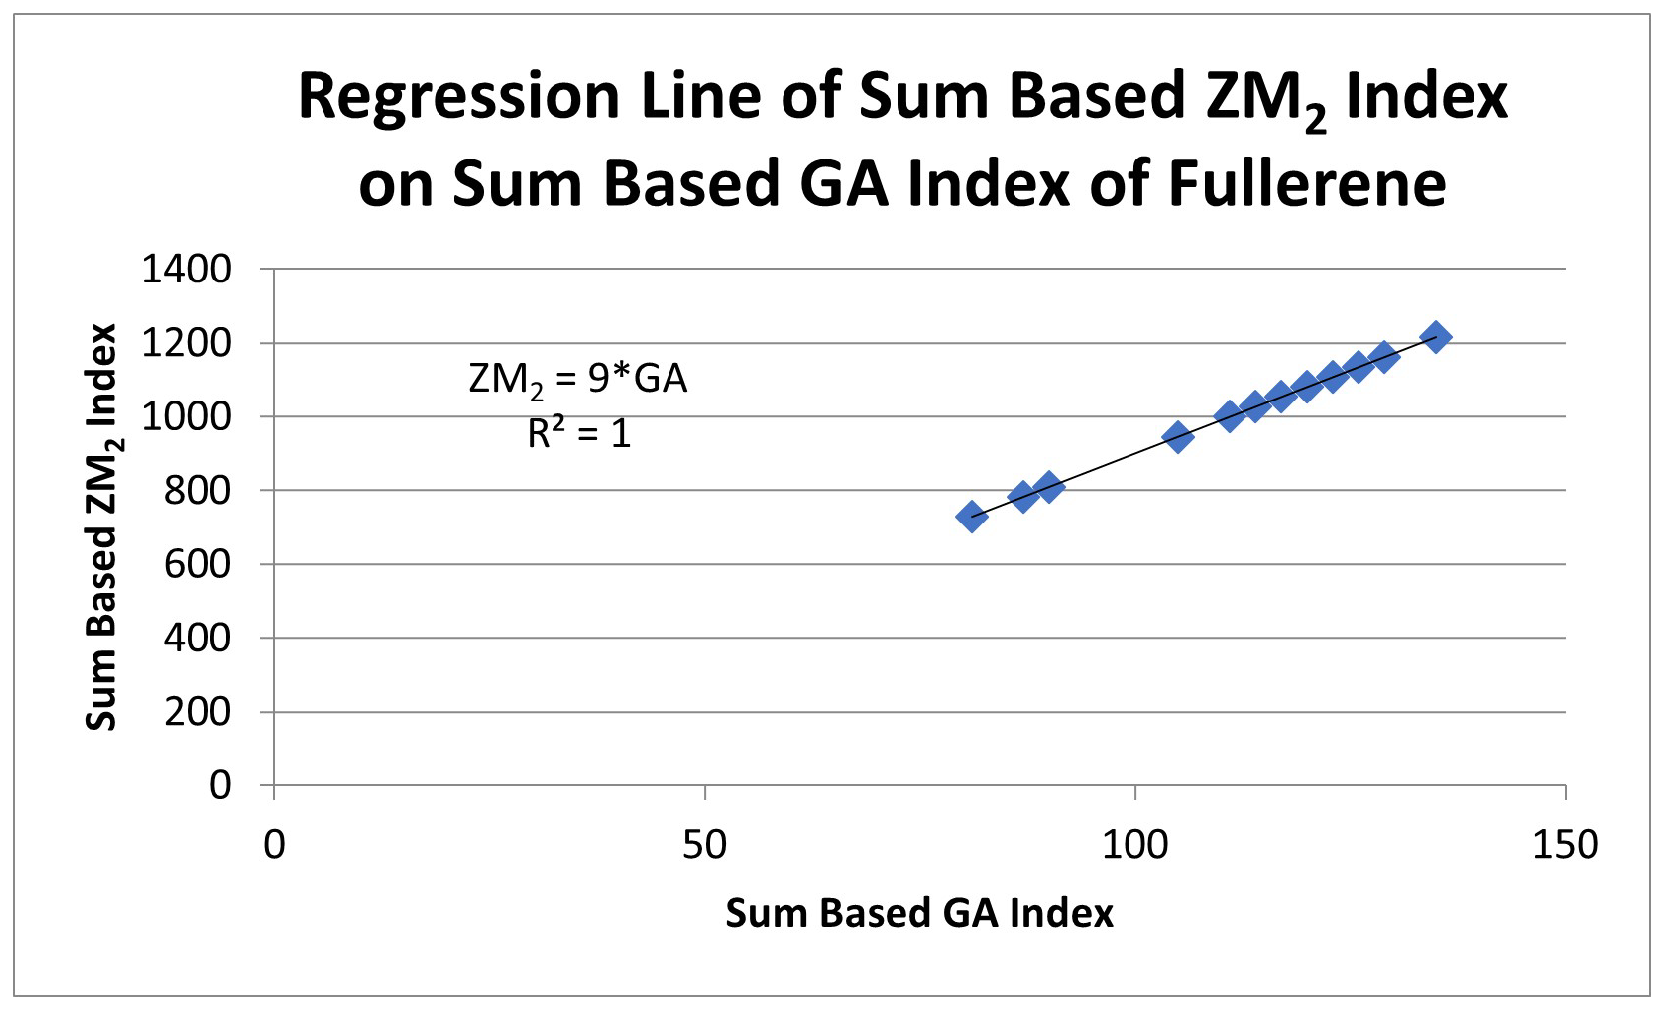
Figure 5 indicates the dependency of the sum based
index on sum based
index. It is visible from the figure that the regression line is the best fit to the data, due to which the coefficient of determination is
The correlation coefficient is calculated as 1, defining a strong direct relationship between the indices.
The
Figure 2,
Figure 3,
Figure 4 and
Figure 5 indicate that the sum based
and
indices have perfect correlation with the sum based
index. Therefore, we will be able to illustrate the relationship between physical qualities (BE, RT minima, SRs and HoF) and all specified indices by relating them just to the sum based
index.
5. Analyzing the Relationship of Physical Properties with Sum Based Index
We can analyze the linear relationship of the HoF, BE, RT minima and SR of fullerenes with their
indices. For this purpose, we collected these properties of the
,
,
,
,
,
,
,
,
,
,
fullerene structures [
27]. These properties are mentioned in
Table 5.
The regression analysis between each of the physical properties, such as BEs, RT-1, RT-2, SR-1, SR-2 and Hof (data provided in
Table 5), depending on the sum based
index, can be exhibit by the following figures.
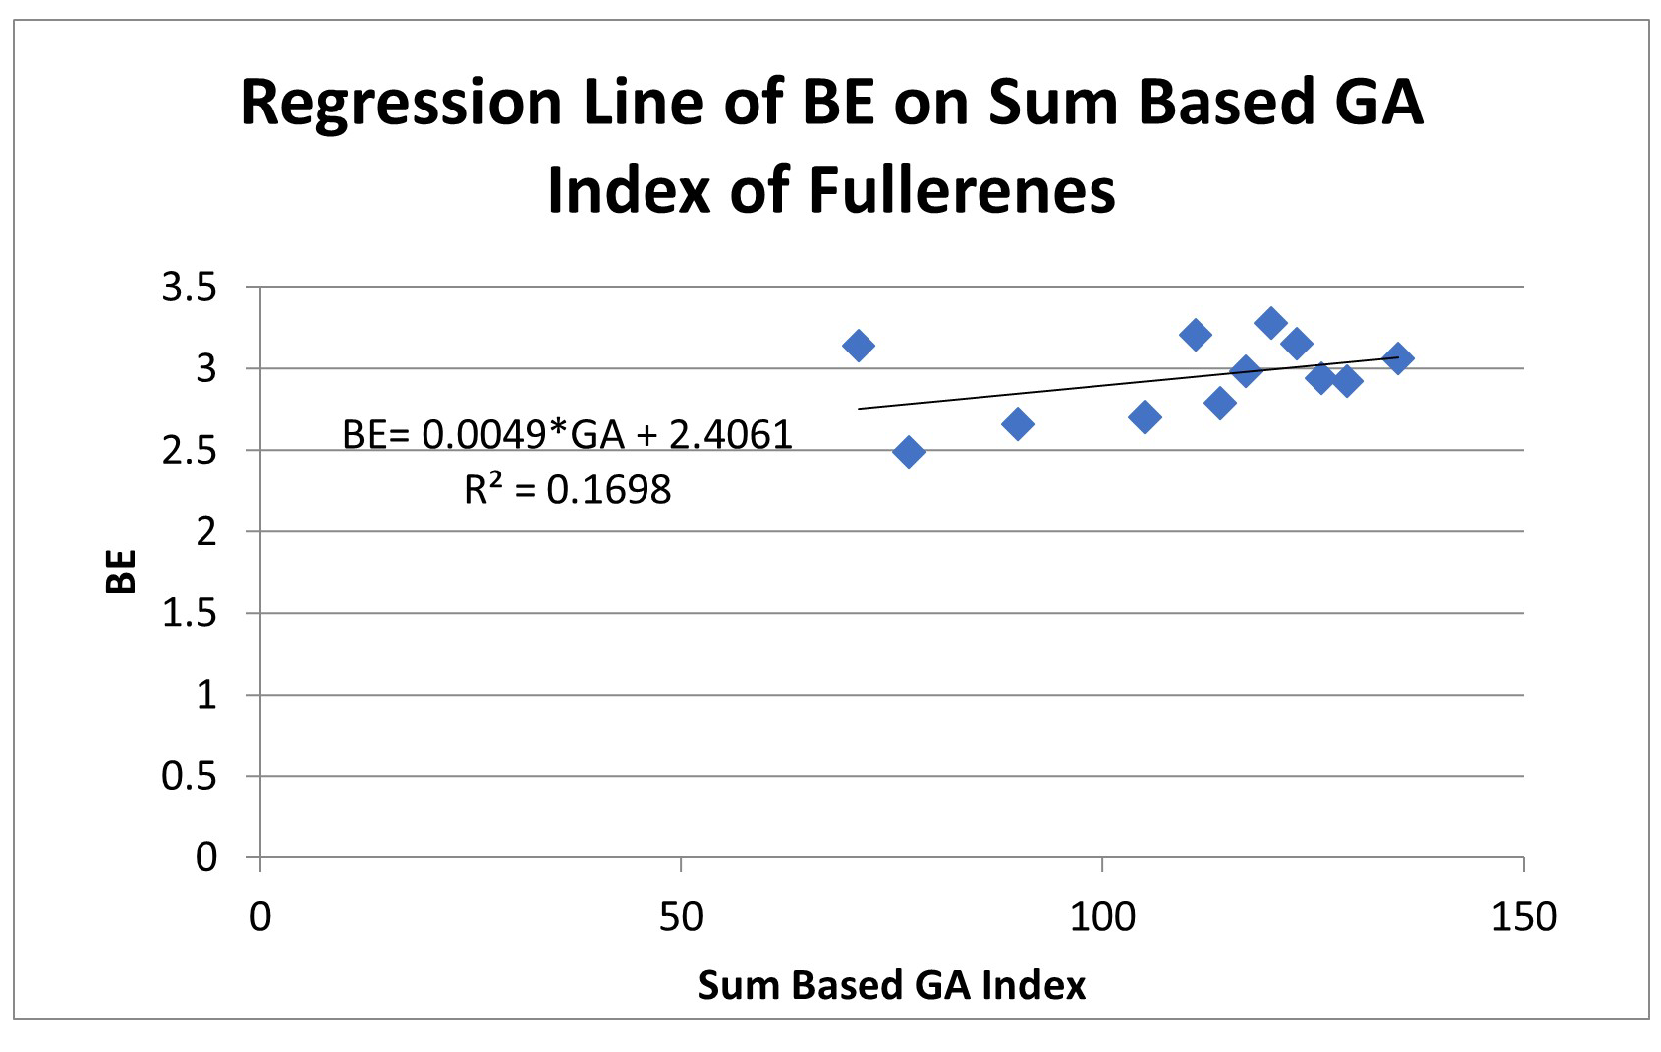
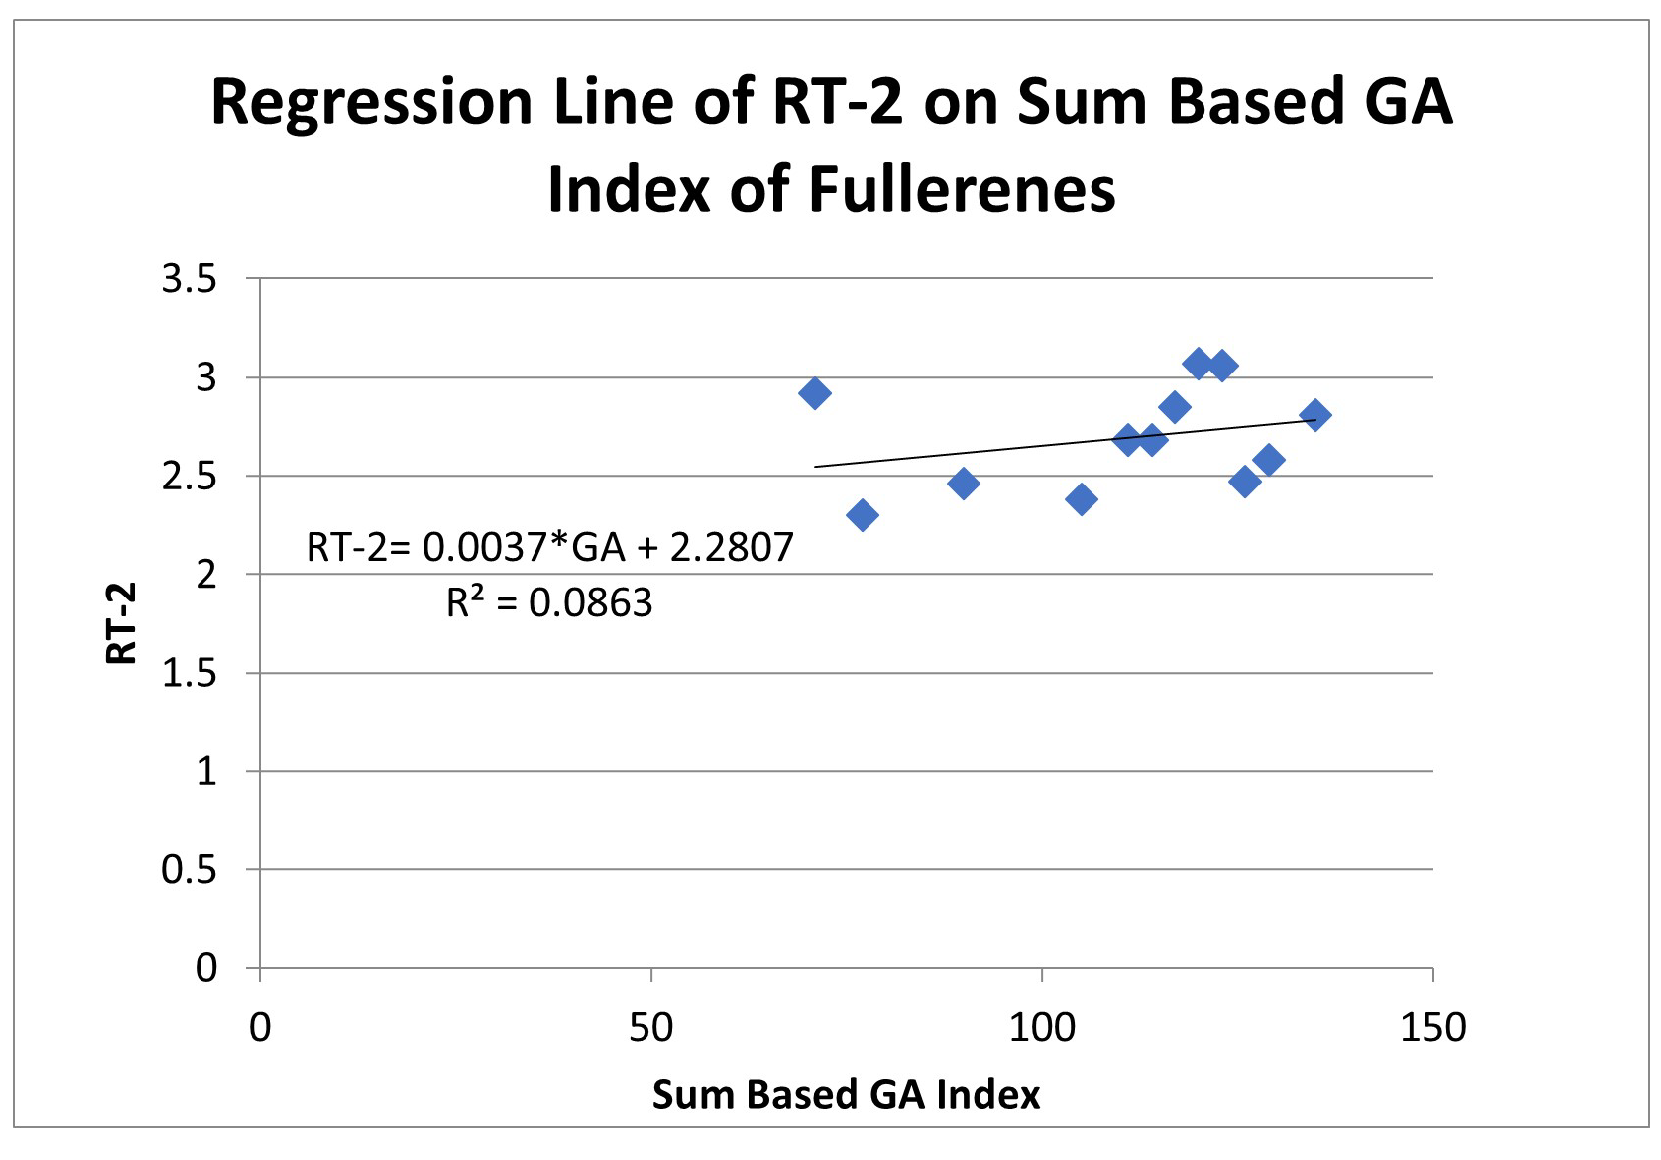
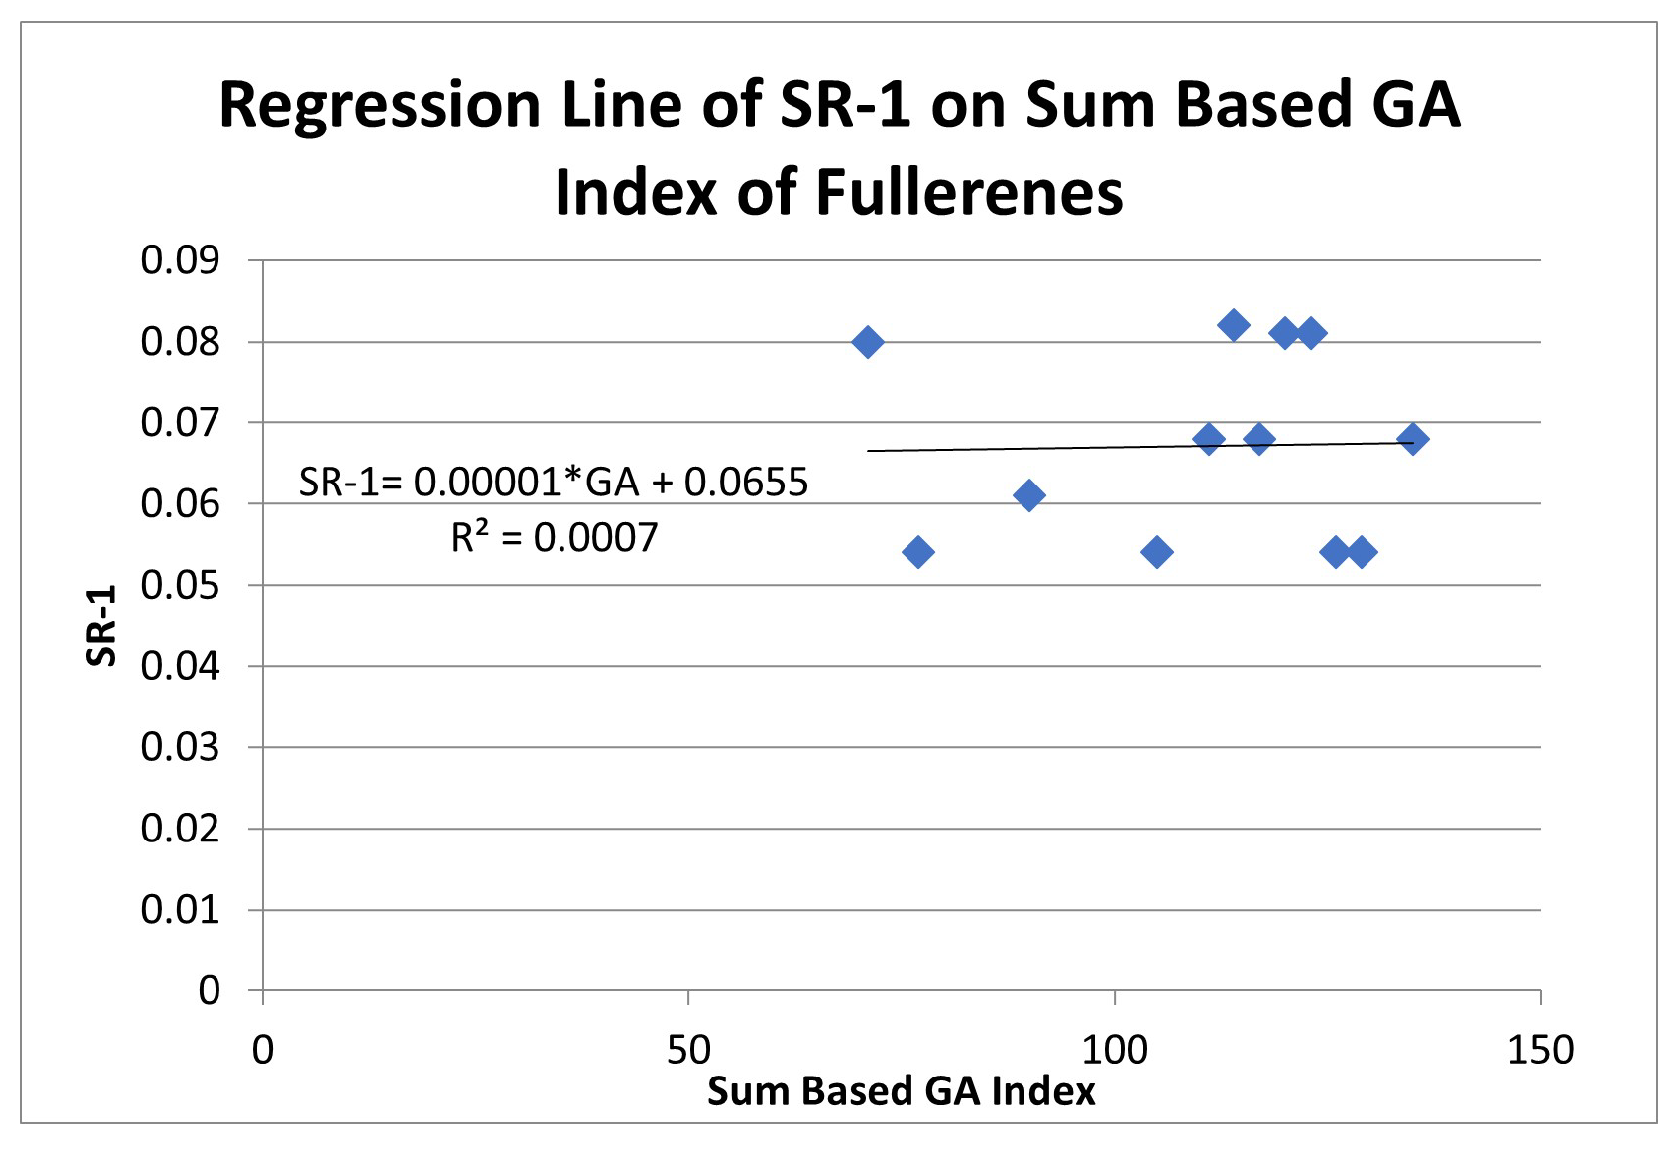
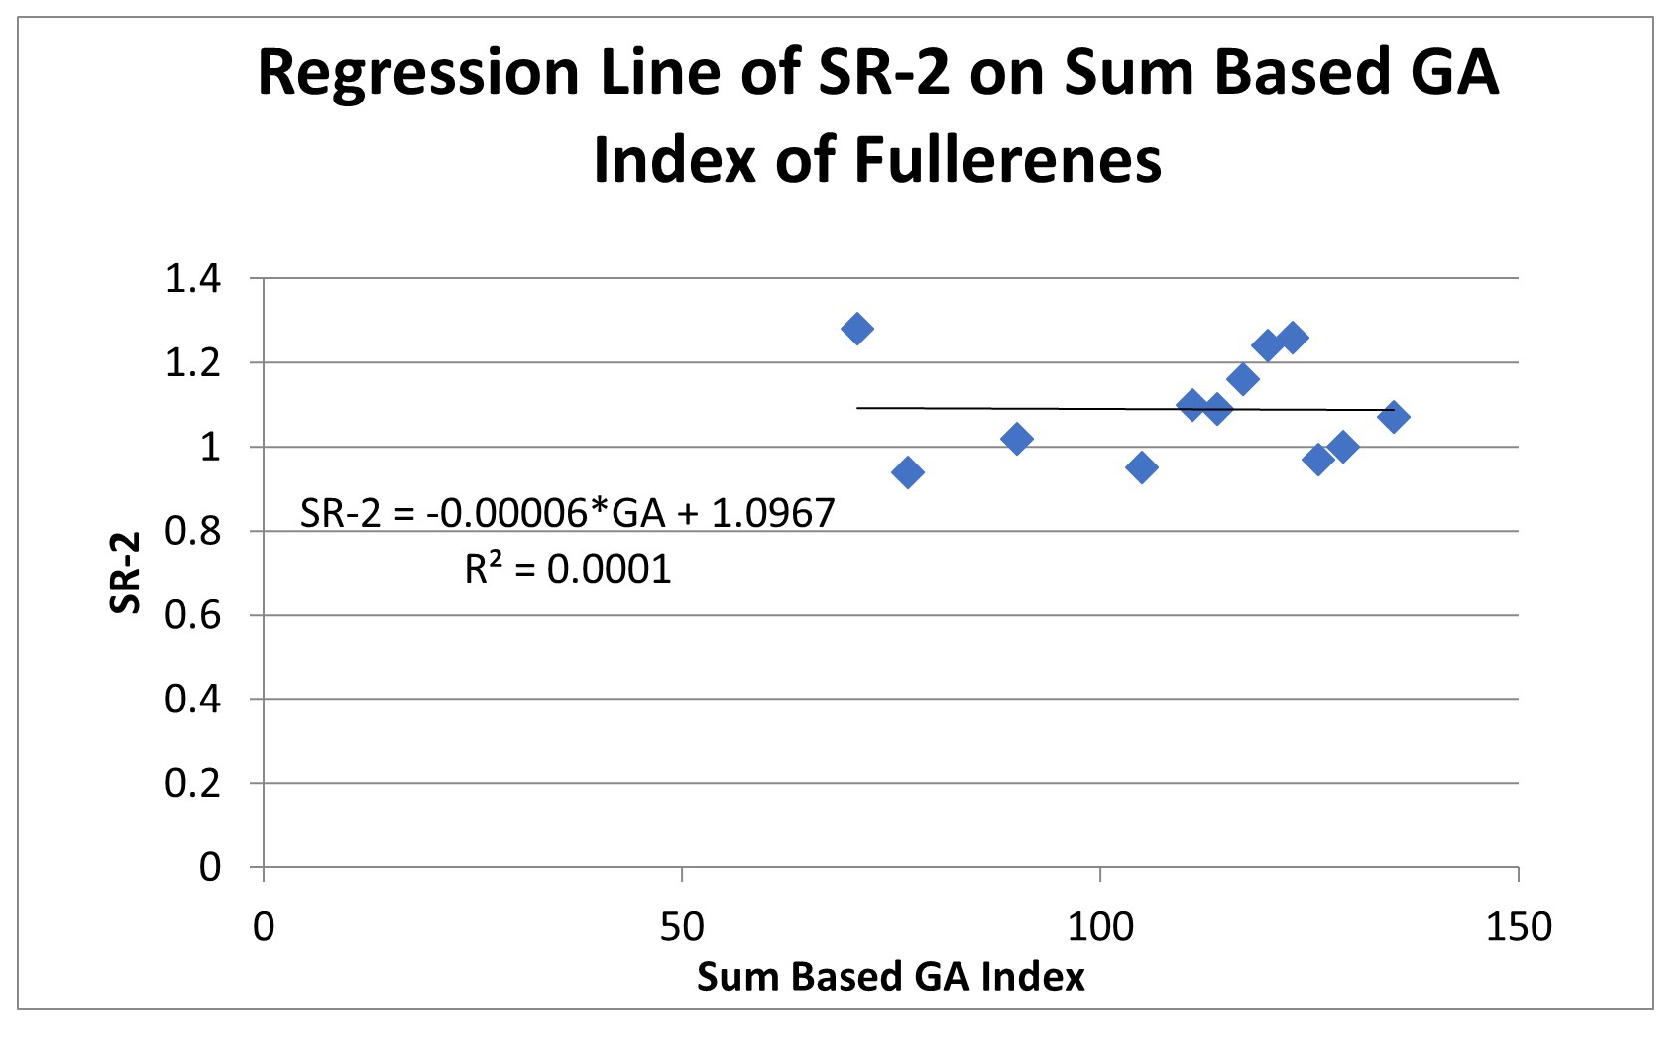
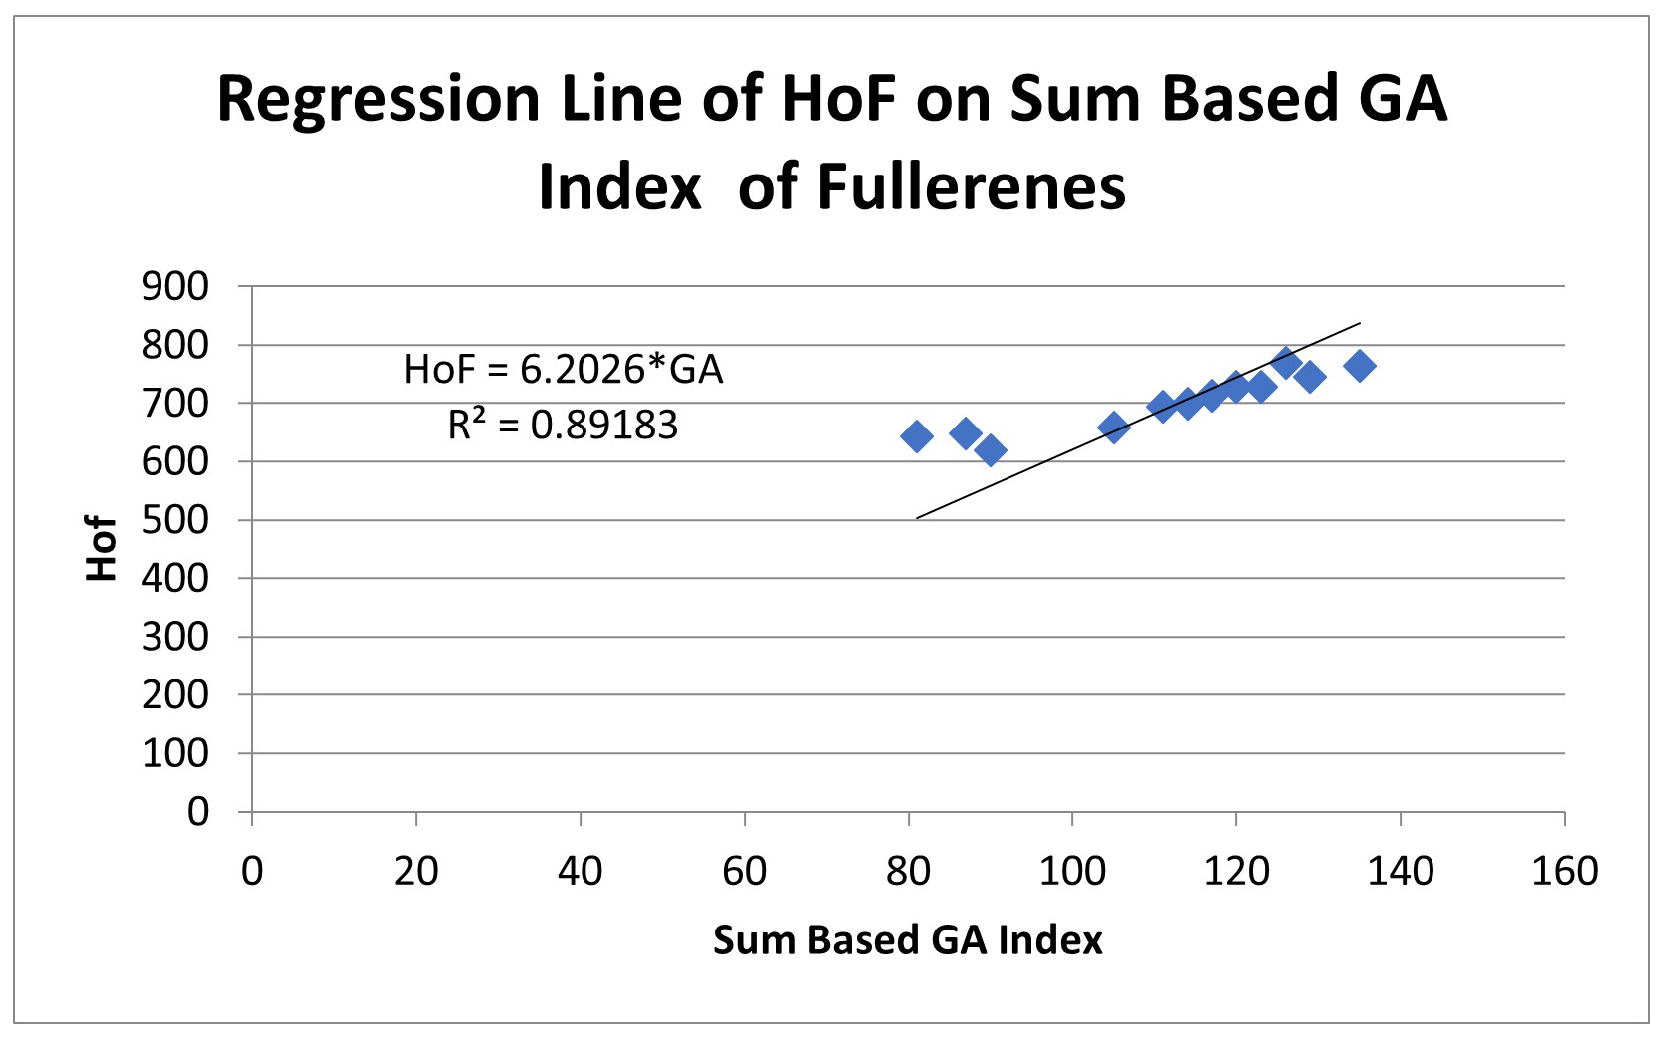
It can be deduced from the
Figure 6,
Figure 7,
Figure 8,
Figure 9,
Figure 10 and
Figure 11 and
Table 6 that the linear regression relation of the heat of formation on the GA index fits on most of the data points. The coefficient of determination is
, indicating a better goodness of fit to the observations. Thus, the regression line fits on more than 89 percent of data. The correlation coefficient is
, indicating a strong positive correlation between the heat of formation and the sum based
index.
The regression relations and related quantitative measures (coefficients of determination and correlation) can be summarized as:
6. Conclusions
This work deals with the calculations of a productive sum based topological index correlated to fullerene’s physical properties. For this purpose, we consider , , , , , , , , , , fullerene balls. The chemical structures are graphically plotted and presented. It was noticed that the degree of each of the vertex’s of chemical graph is three. The sum based and indices are computed. The linear regression analysis is performed where a regression line is fitted to the data. A regression line depicts a linear behavior of the data using the famous least squares fit and thus provides the highest accuracy. We calculated the coefficient of determination and the correlation coefficient for the data. The regression analysis of the sum based and indices depending on the sum based index leads to the result that all the indices are strongly related to the sum based index for these structures.
We considered the physical properties including BEs, RT-1, RT-2, SR-1, SR-2 and Hof of the mentioned fullerene cages. The linear regression analysis of these properties depending on the sum based index is performed. It was observed that the physical properties including binding energies, first and second Ramsauer-Townsend minima and first and second shape resonances are not strongly correlated with the sum based index. However, the sum based index ideally represents the heat of formation of the structures with a strong coefficient of determination and strong correlation coefficient. Thus, we can conclude that the sum based index is the best to predict the Hof of fullerene structures with a strong dependence on the sum based index.
It is noteworthy that this study concerns the prediction of physical properties of fullerenes on the basis of the GA index. It is found that the the heat of formation can be predicted with the highest accuracy from the derived linear regression relation. These models may be used to systematize ecological, biochemical, and medical knowledge relevant to the use of fullerenes. Since the application of fullerenes has grown daily, this systematization steadily assumes a significant role.


