
Benefits Evaluation Method of an Integrated Energy System Based on a Fuzzy Comprehensive Evaluation Method


Abstract
:1. Introduction
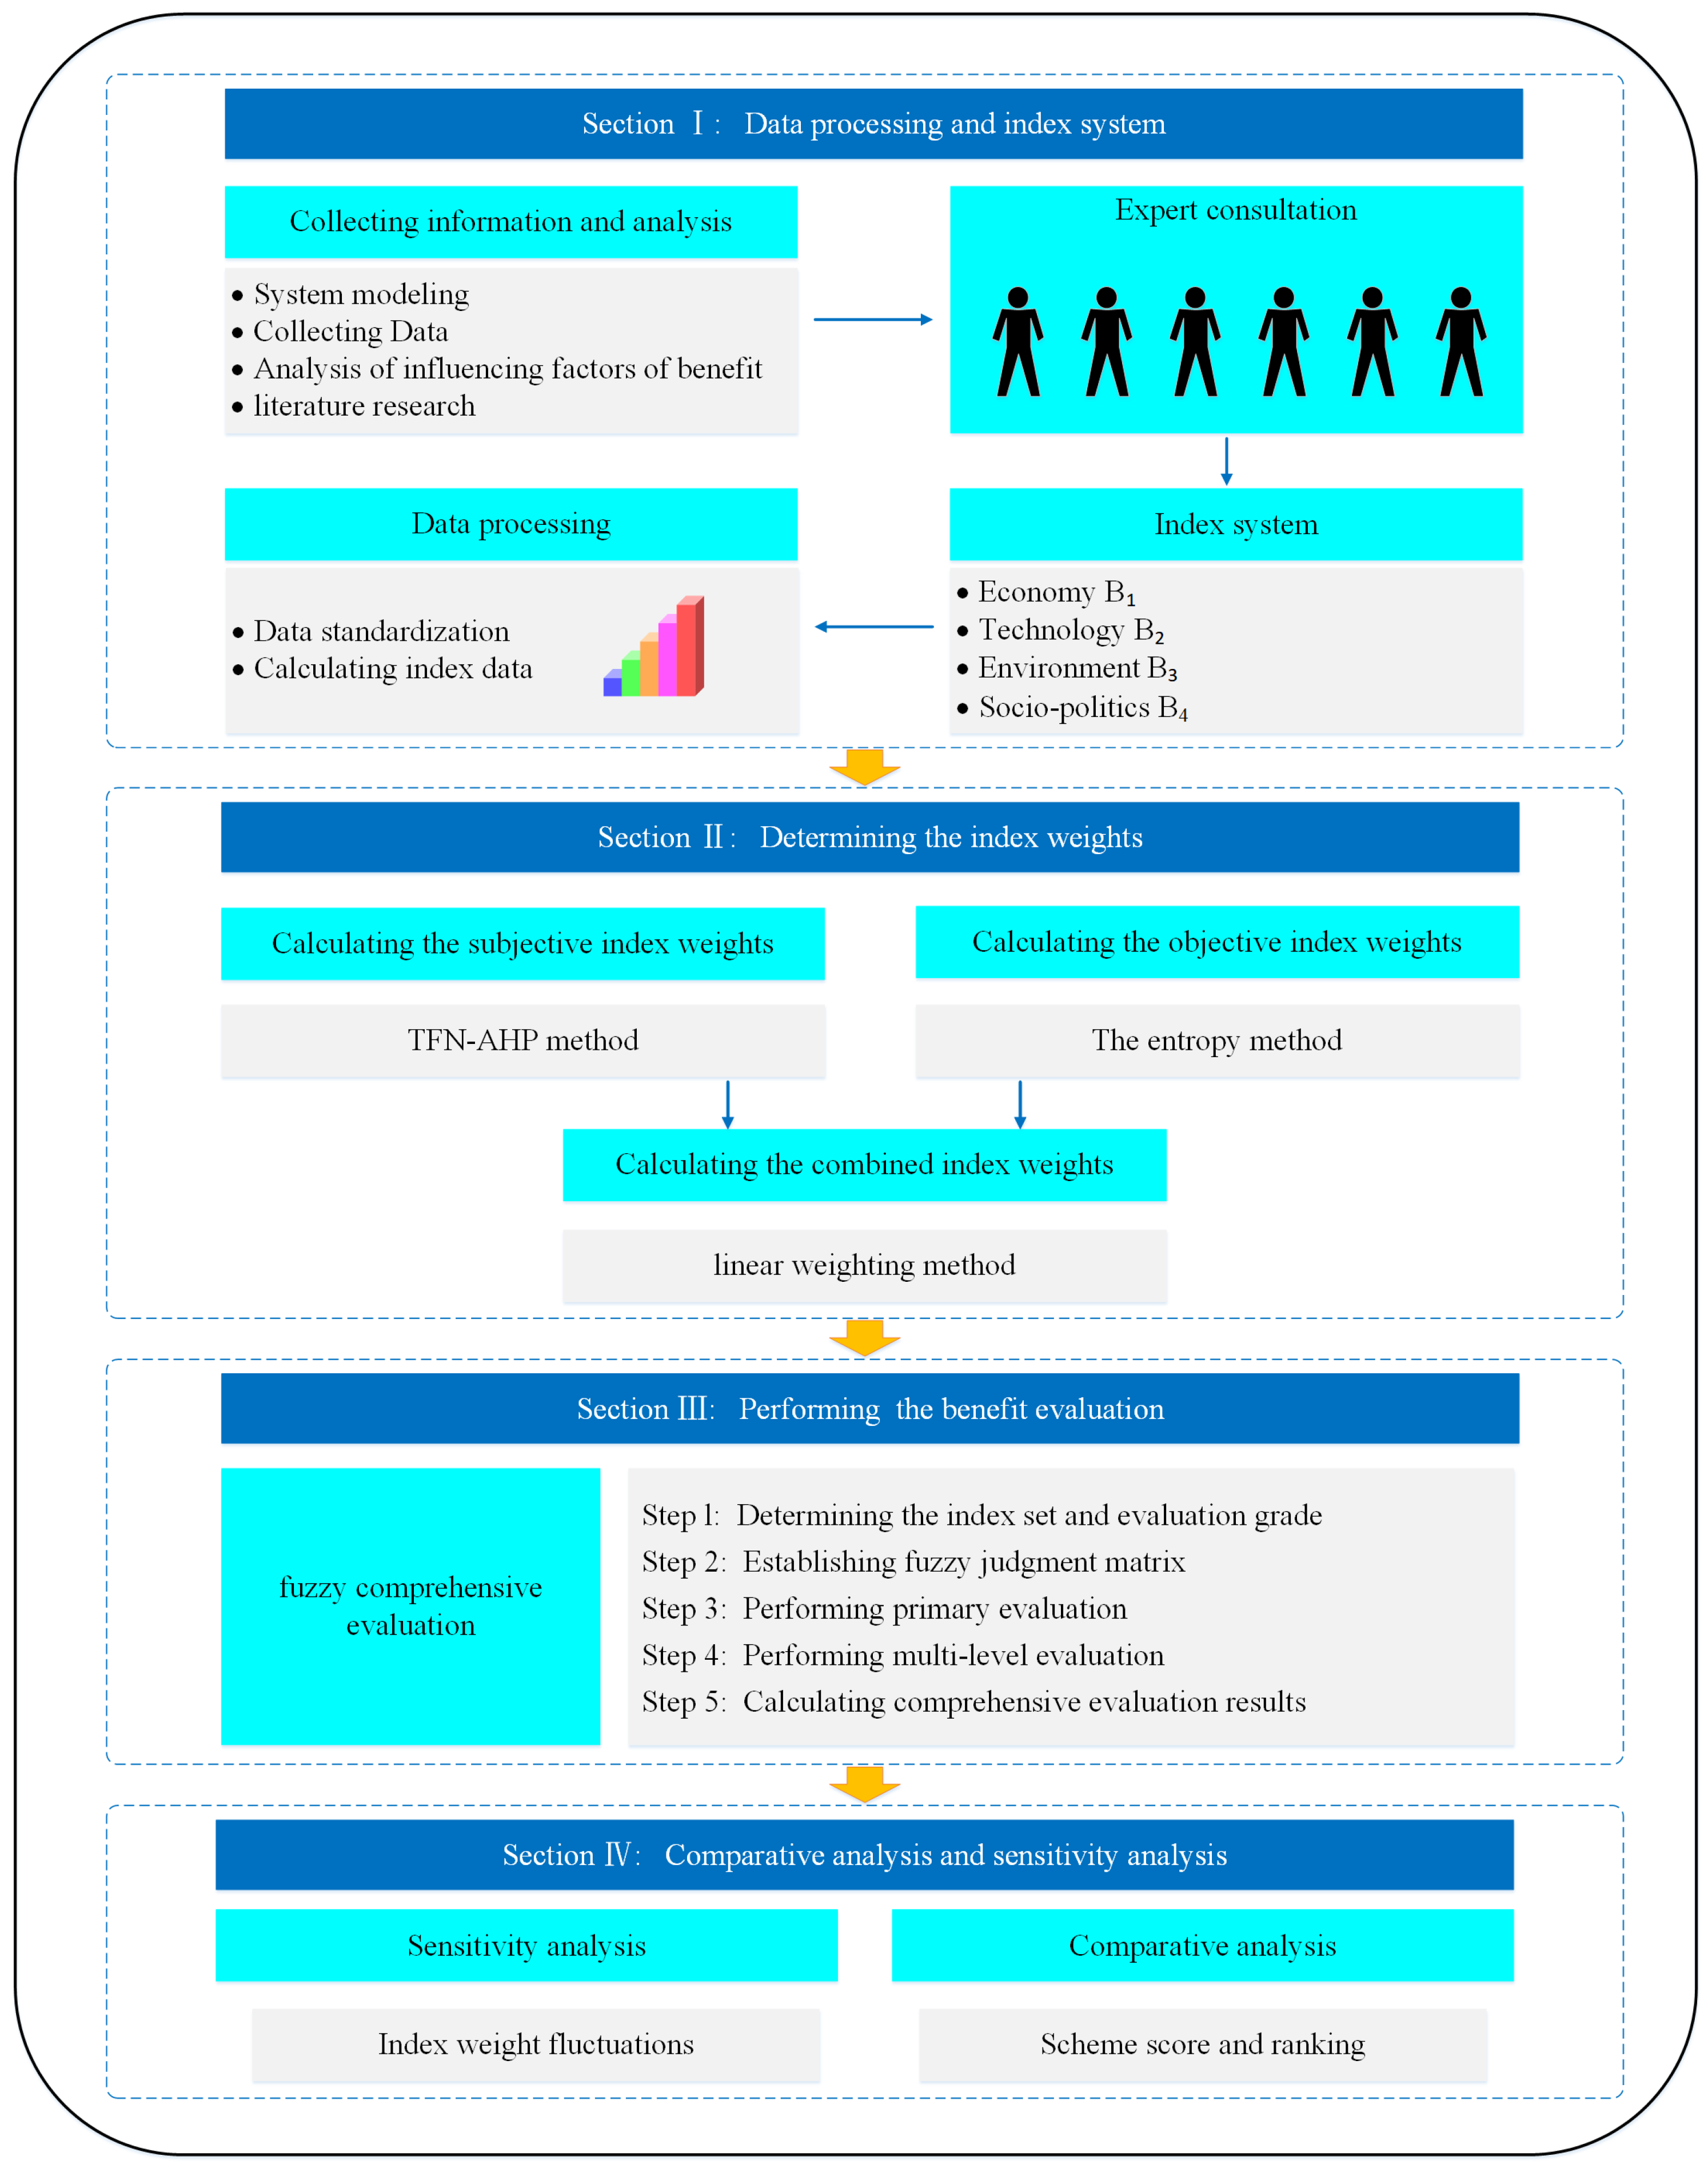
- Considering the IES coupling between energy, this paper proposes an index system for the benefit evaluation of IES, which can objectively express the feature of the evaluation object;
- This paper proposes a combined weighting method. The TFN-AHP method is used to determine the subjective weight, and objective weights are determined by the entropy method. By combining the linear weighting method, the subjective and objective weights are integrated to determine the combined weights. It avoids the influence of subjective factors on the weights and solves the problem of weight calculation errors caused by the mutual influence between indexes;
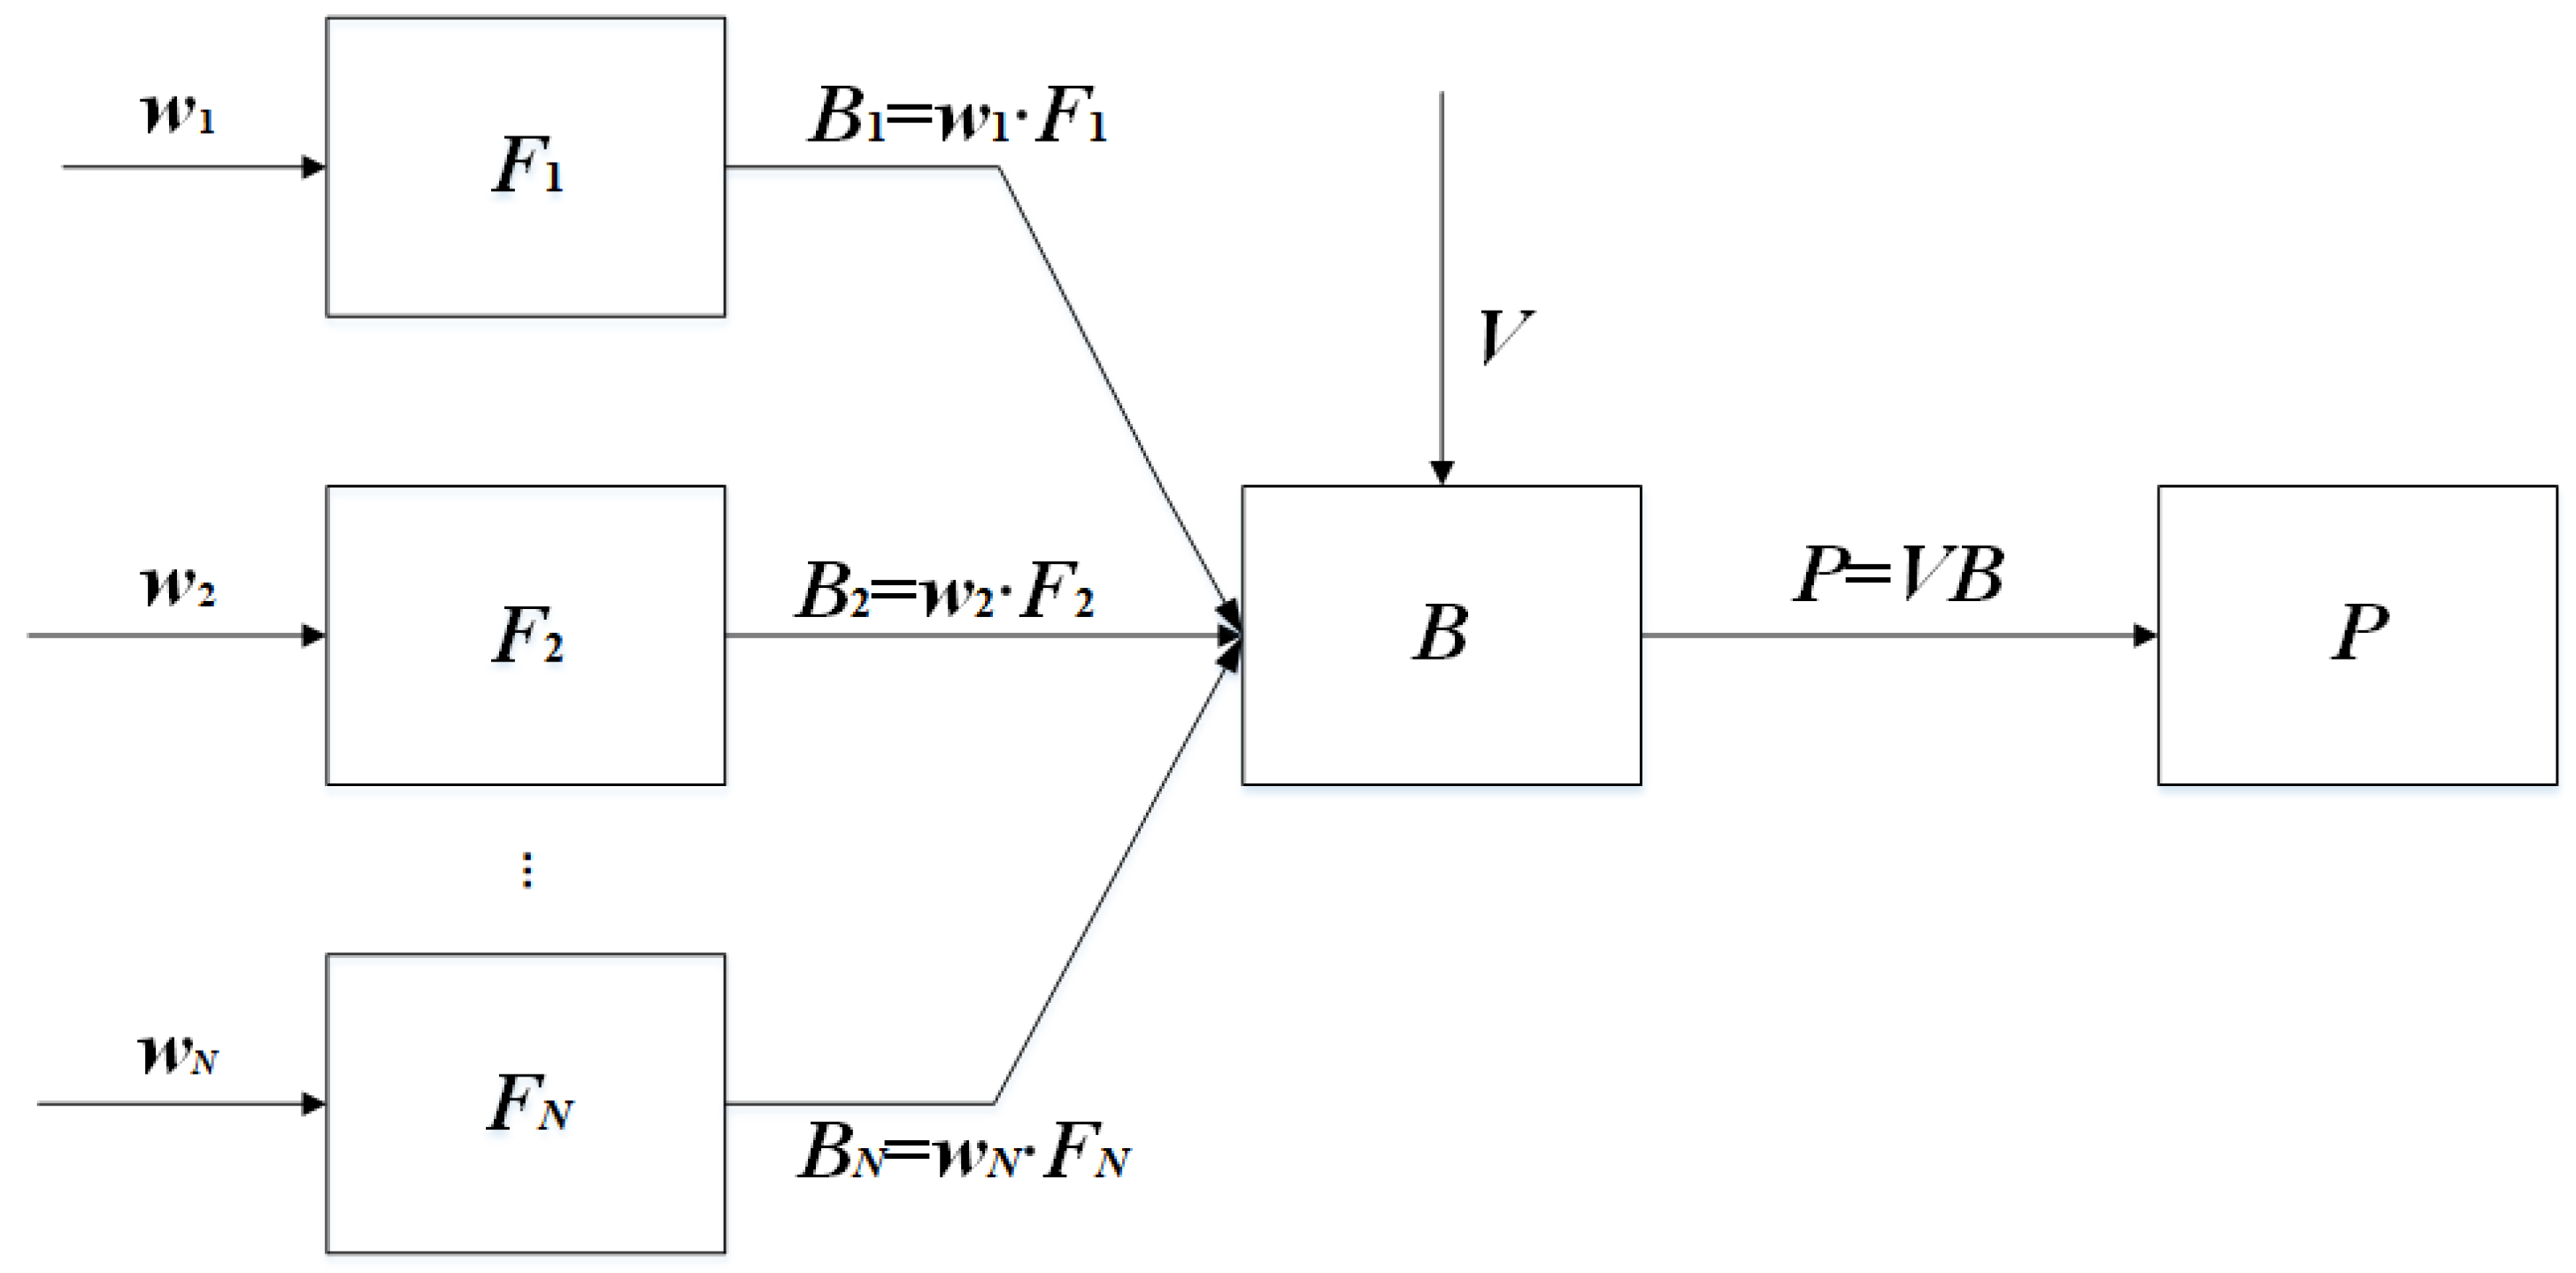
- This paper proposes the fuzzy comprehensive evaluation method, which conducts the multi-criterion benefit evaluation of the IES. The transformation of the index from qualitative to quantitative is realized, and the problem of the uncertainty of the index is solved.
2. Related Work
2.1. Research on the Index System
2.2. Research on Evaluation Methods
3. Benefit Evaluation Method of the Integrated Energy System
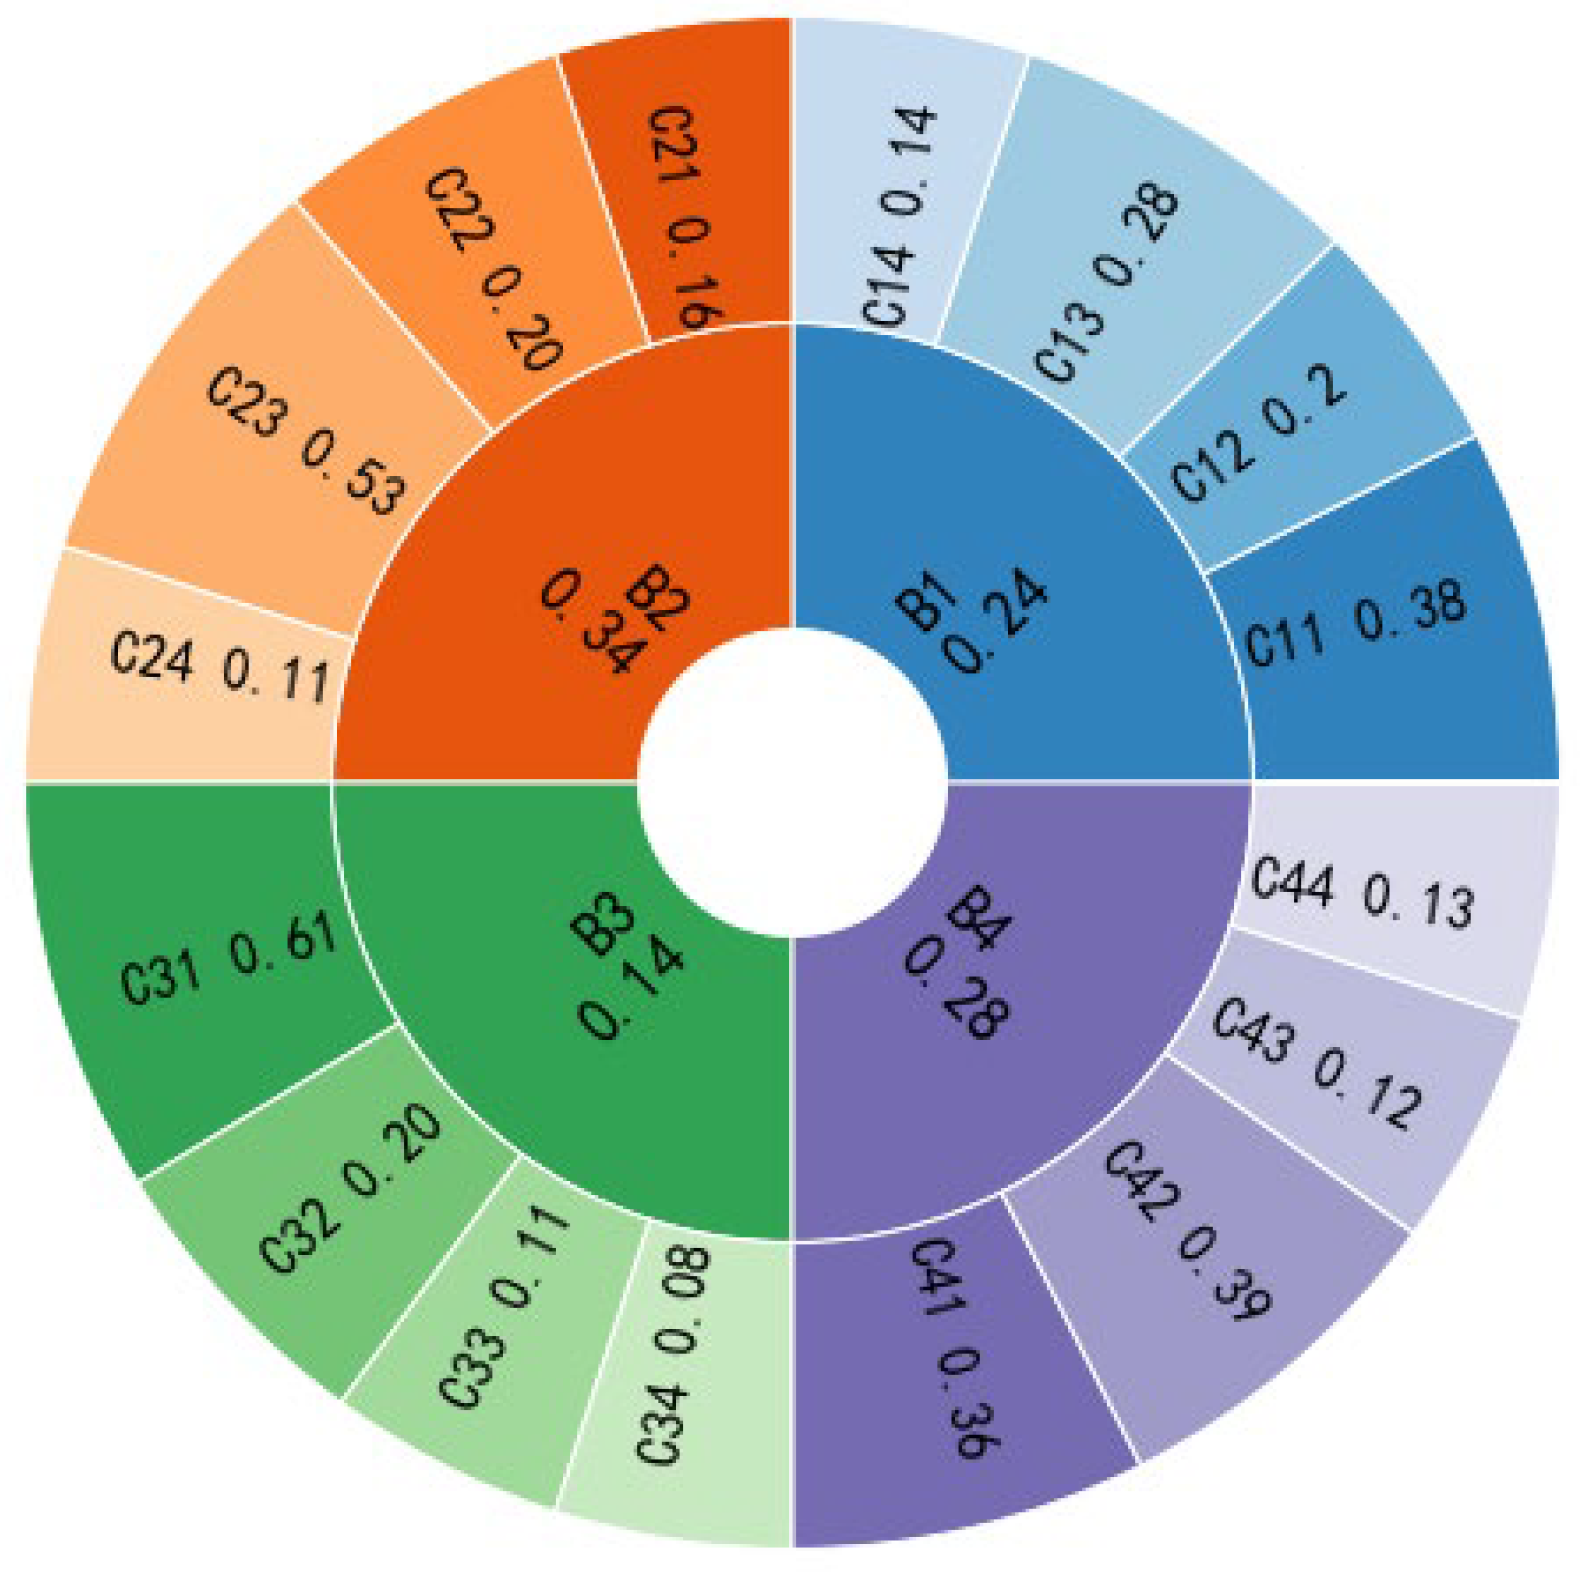
3.1. Benefit Evaluation Index System
3.2. Determination Method of Index Weight
3.2.1. Evaluation Index Standardization
3.2.2. Subjective Method Based on the TFN-AHP
3.2.3. Objective Method Based on the Entropy Method
3.2.4. Combined Weight
3.3. Fuzzy Comprehensive Evaluation Method
4. Case Study
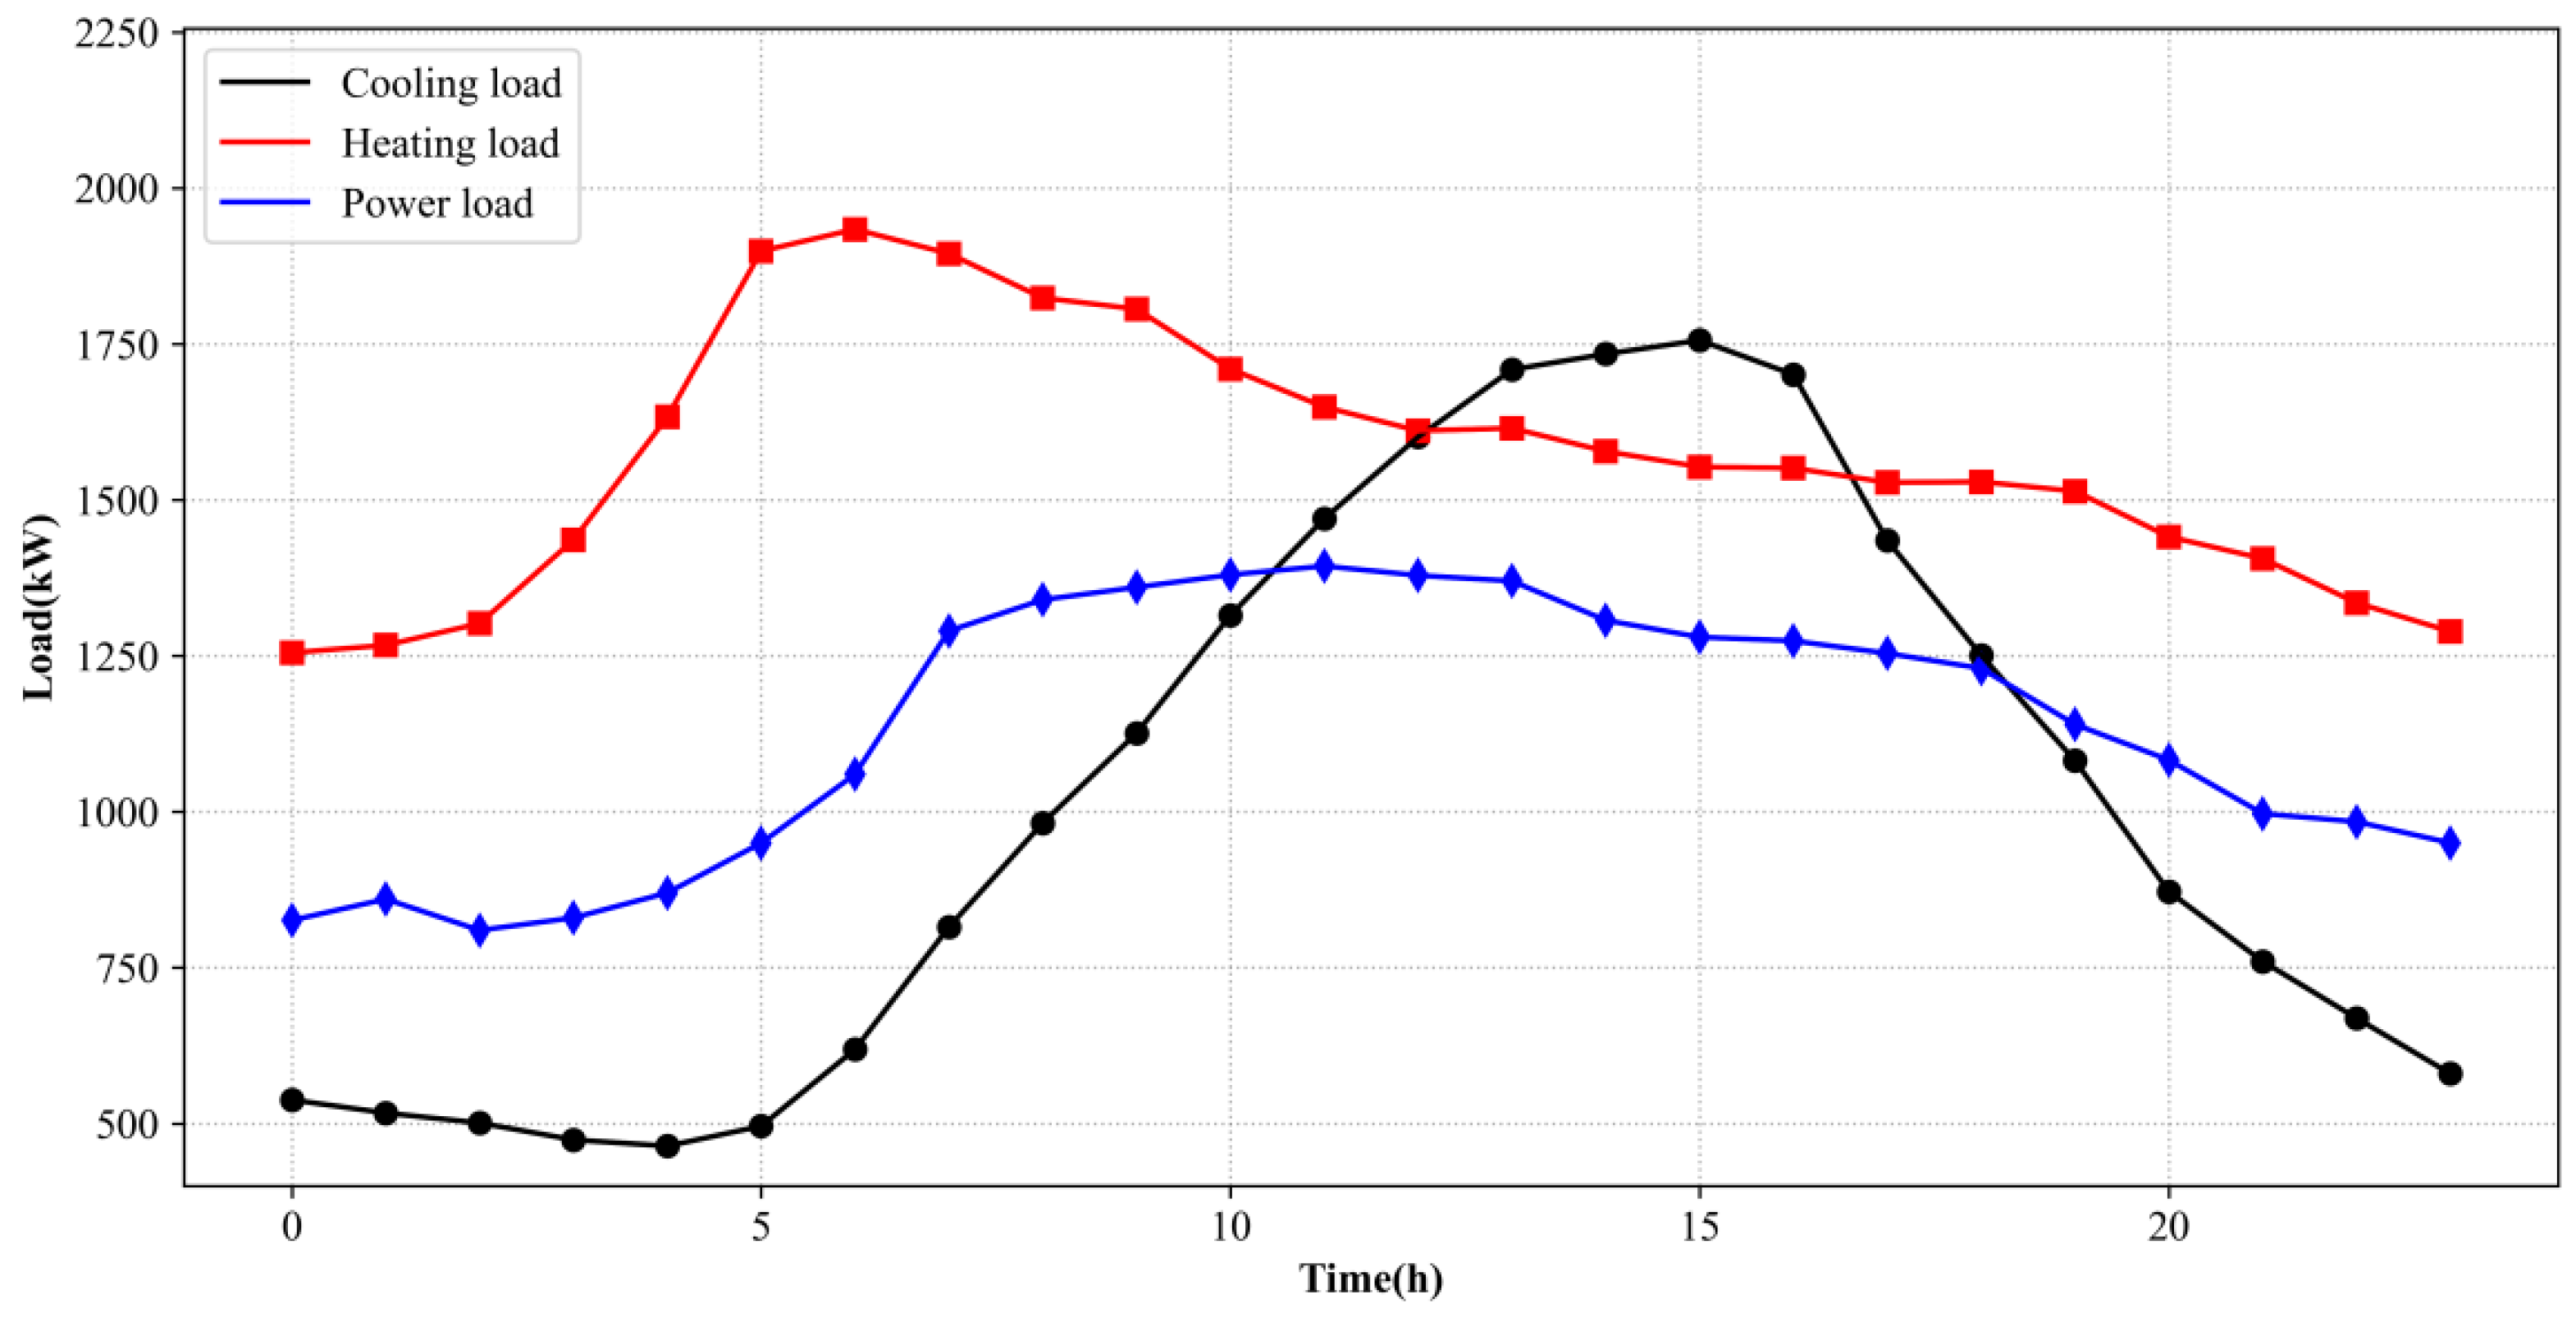
4.1. Building Loads
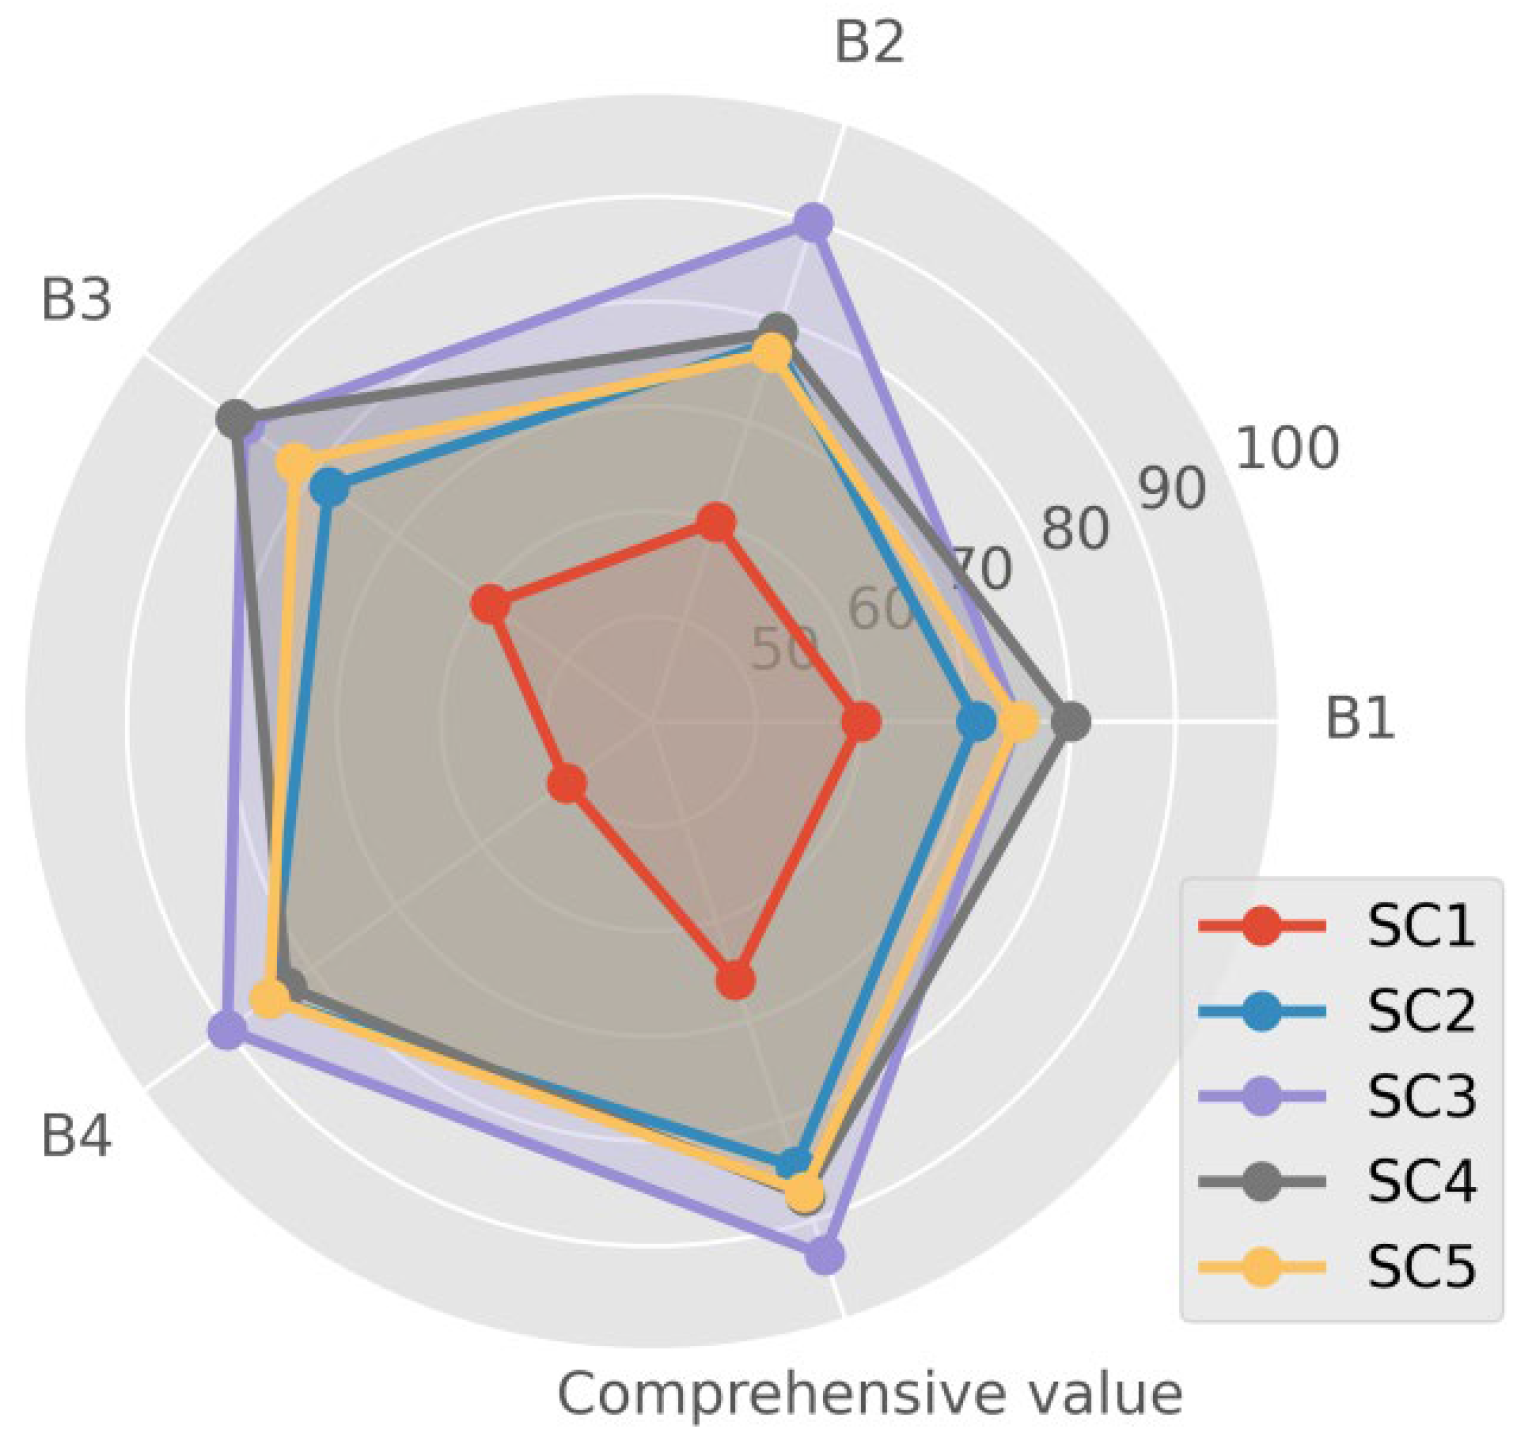
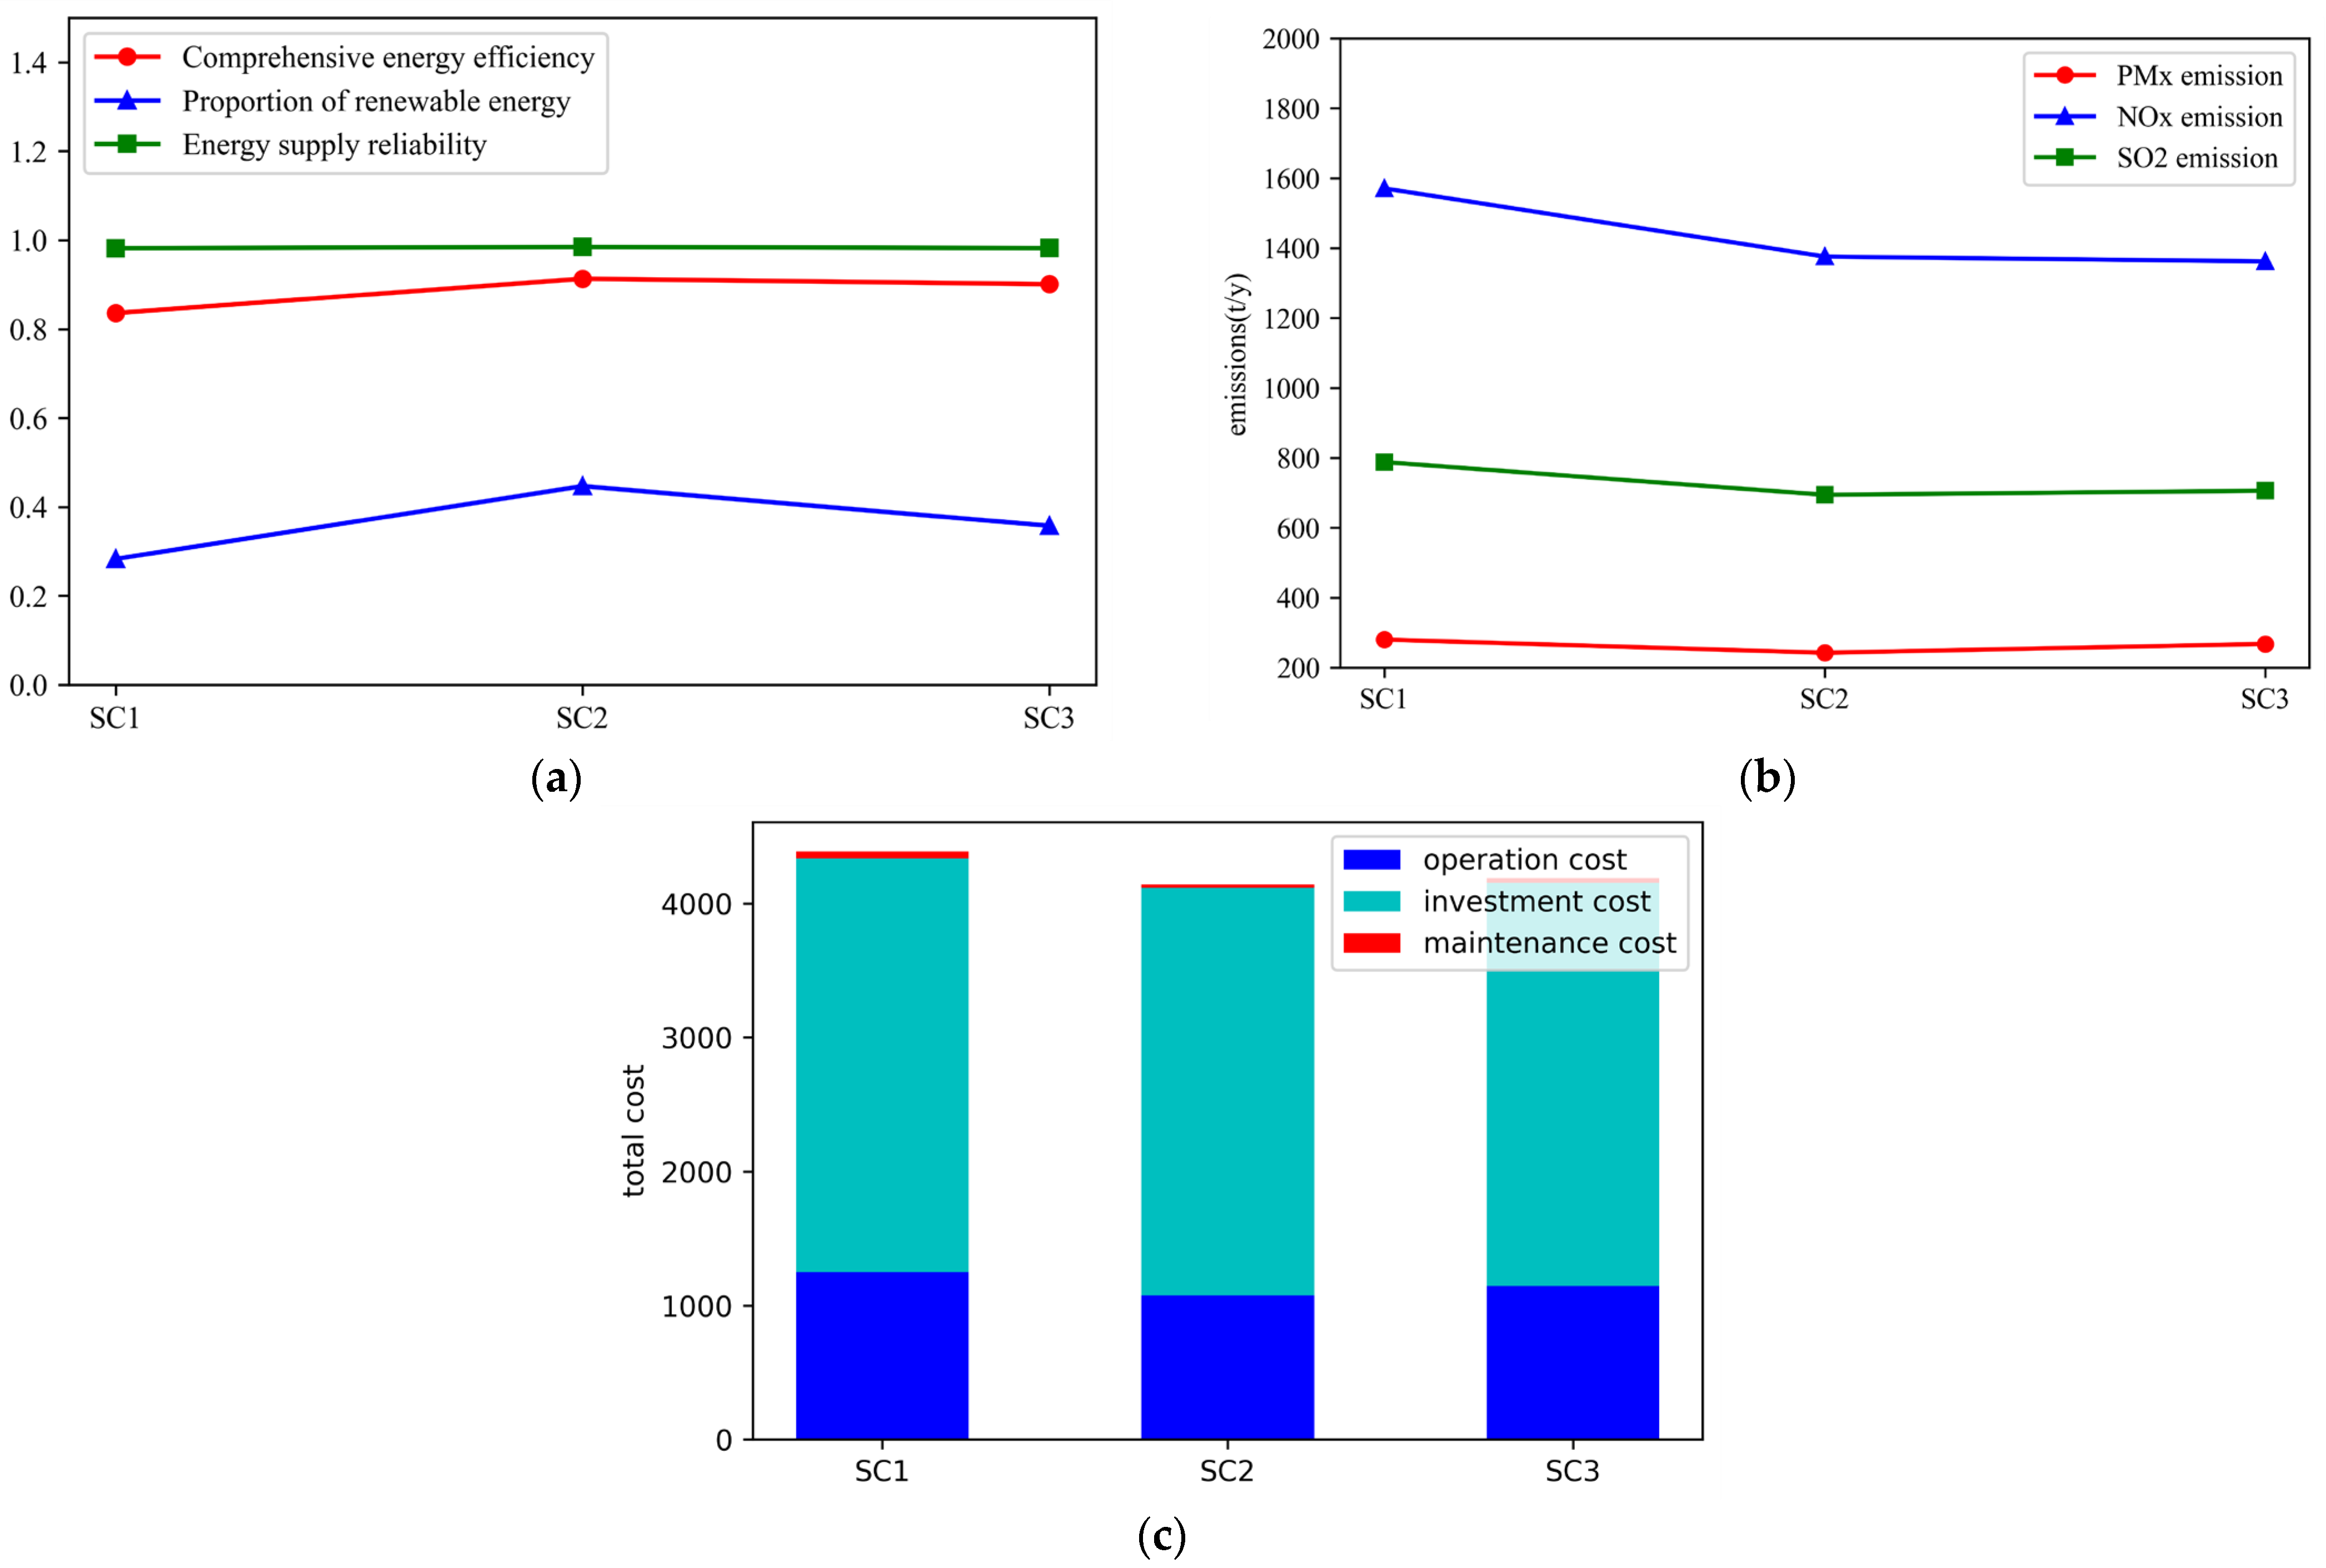
4.2. Analysis of the Experimental Results
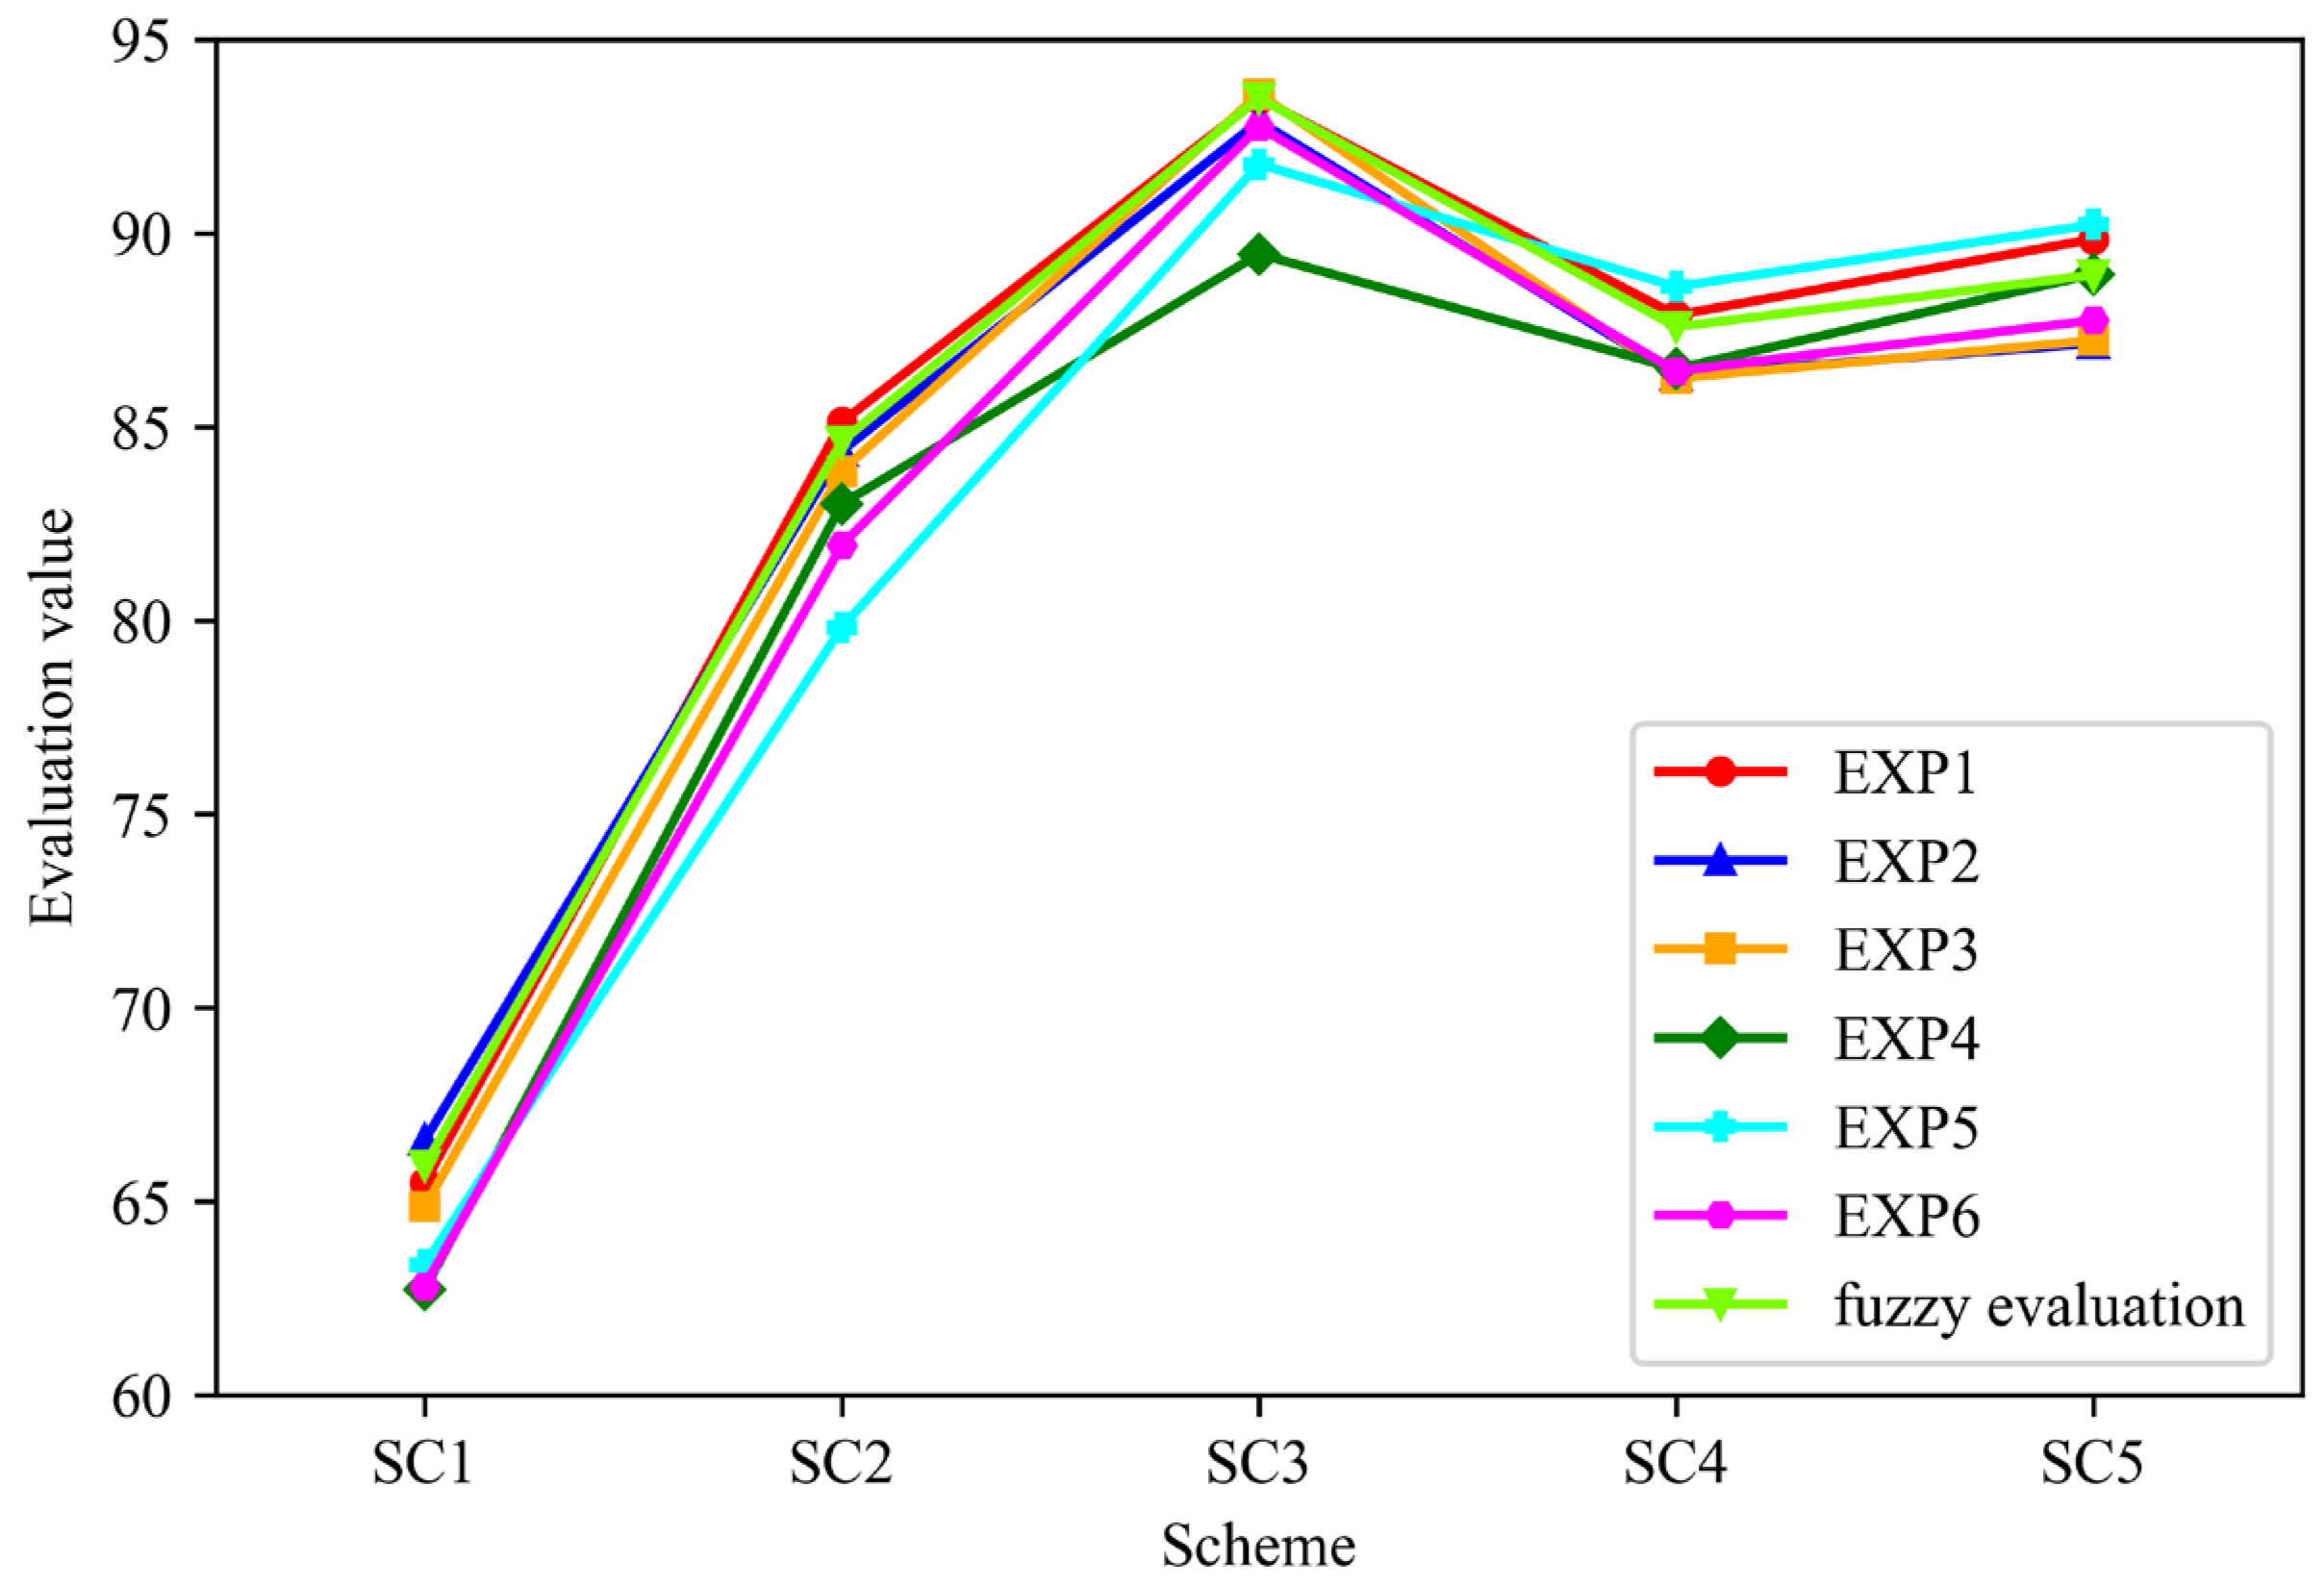
4.3. Analysis of the Influencing Factors of the Evaluation Results
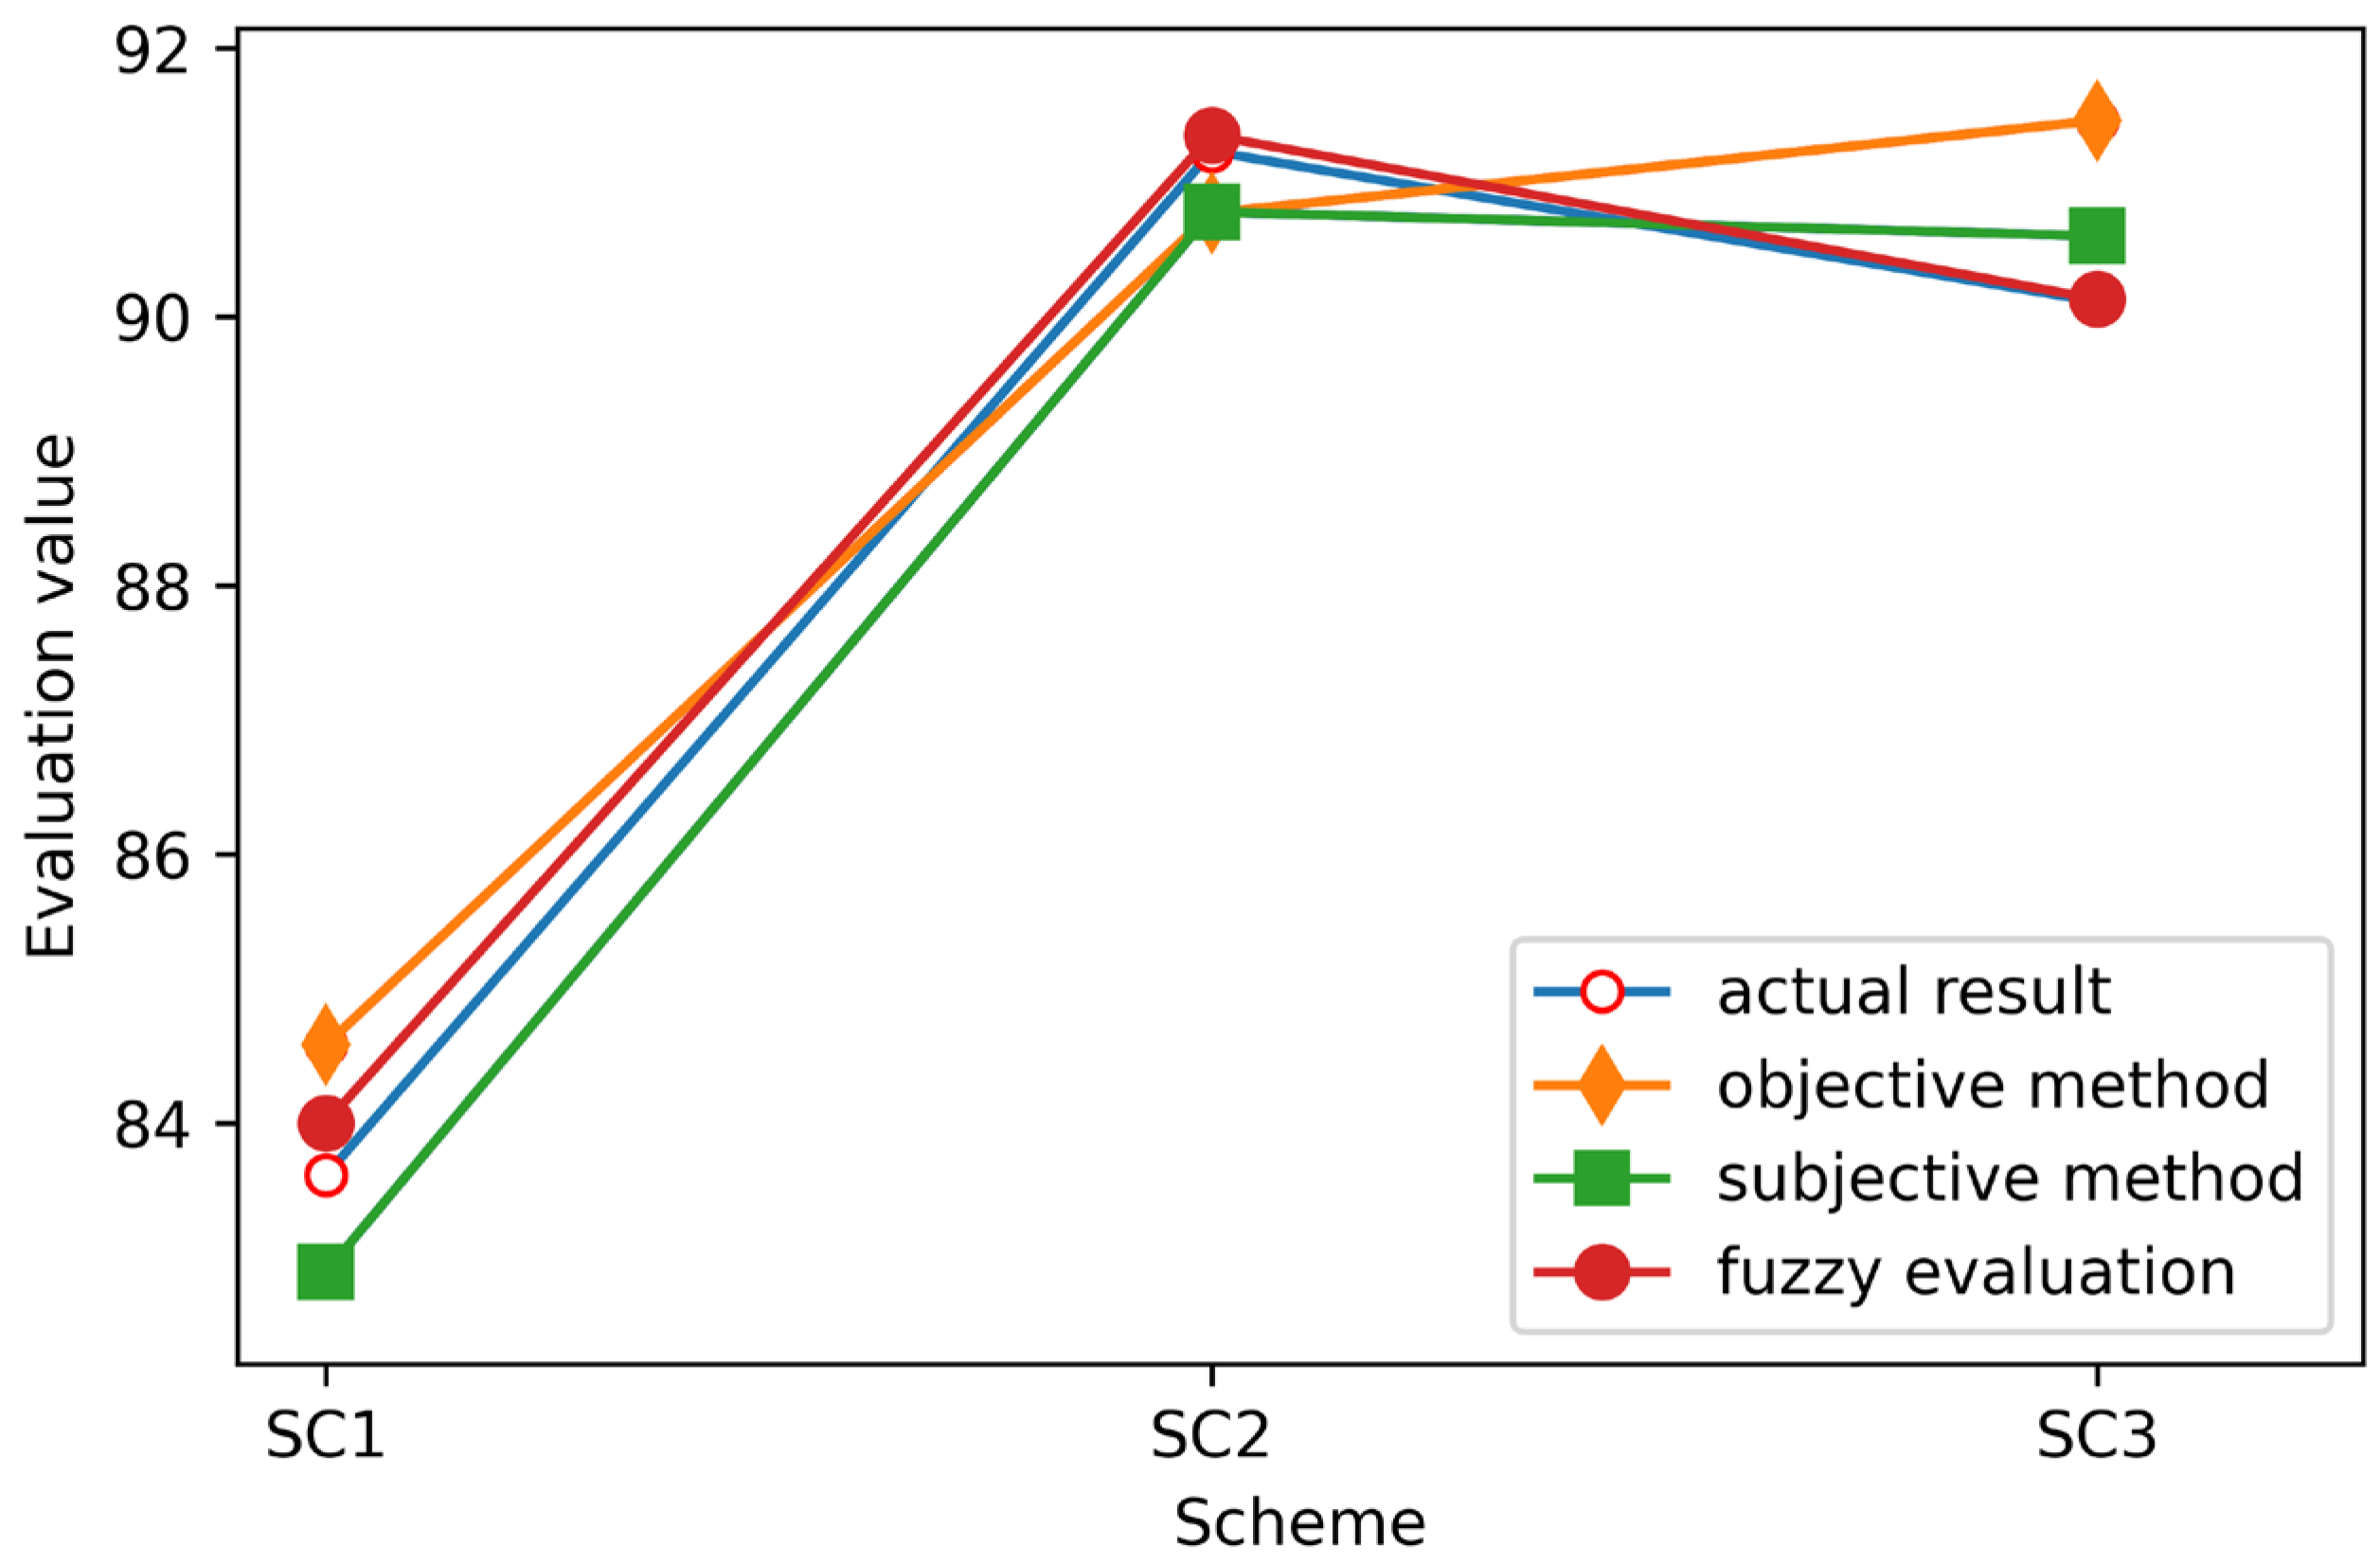
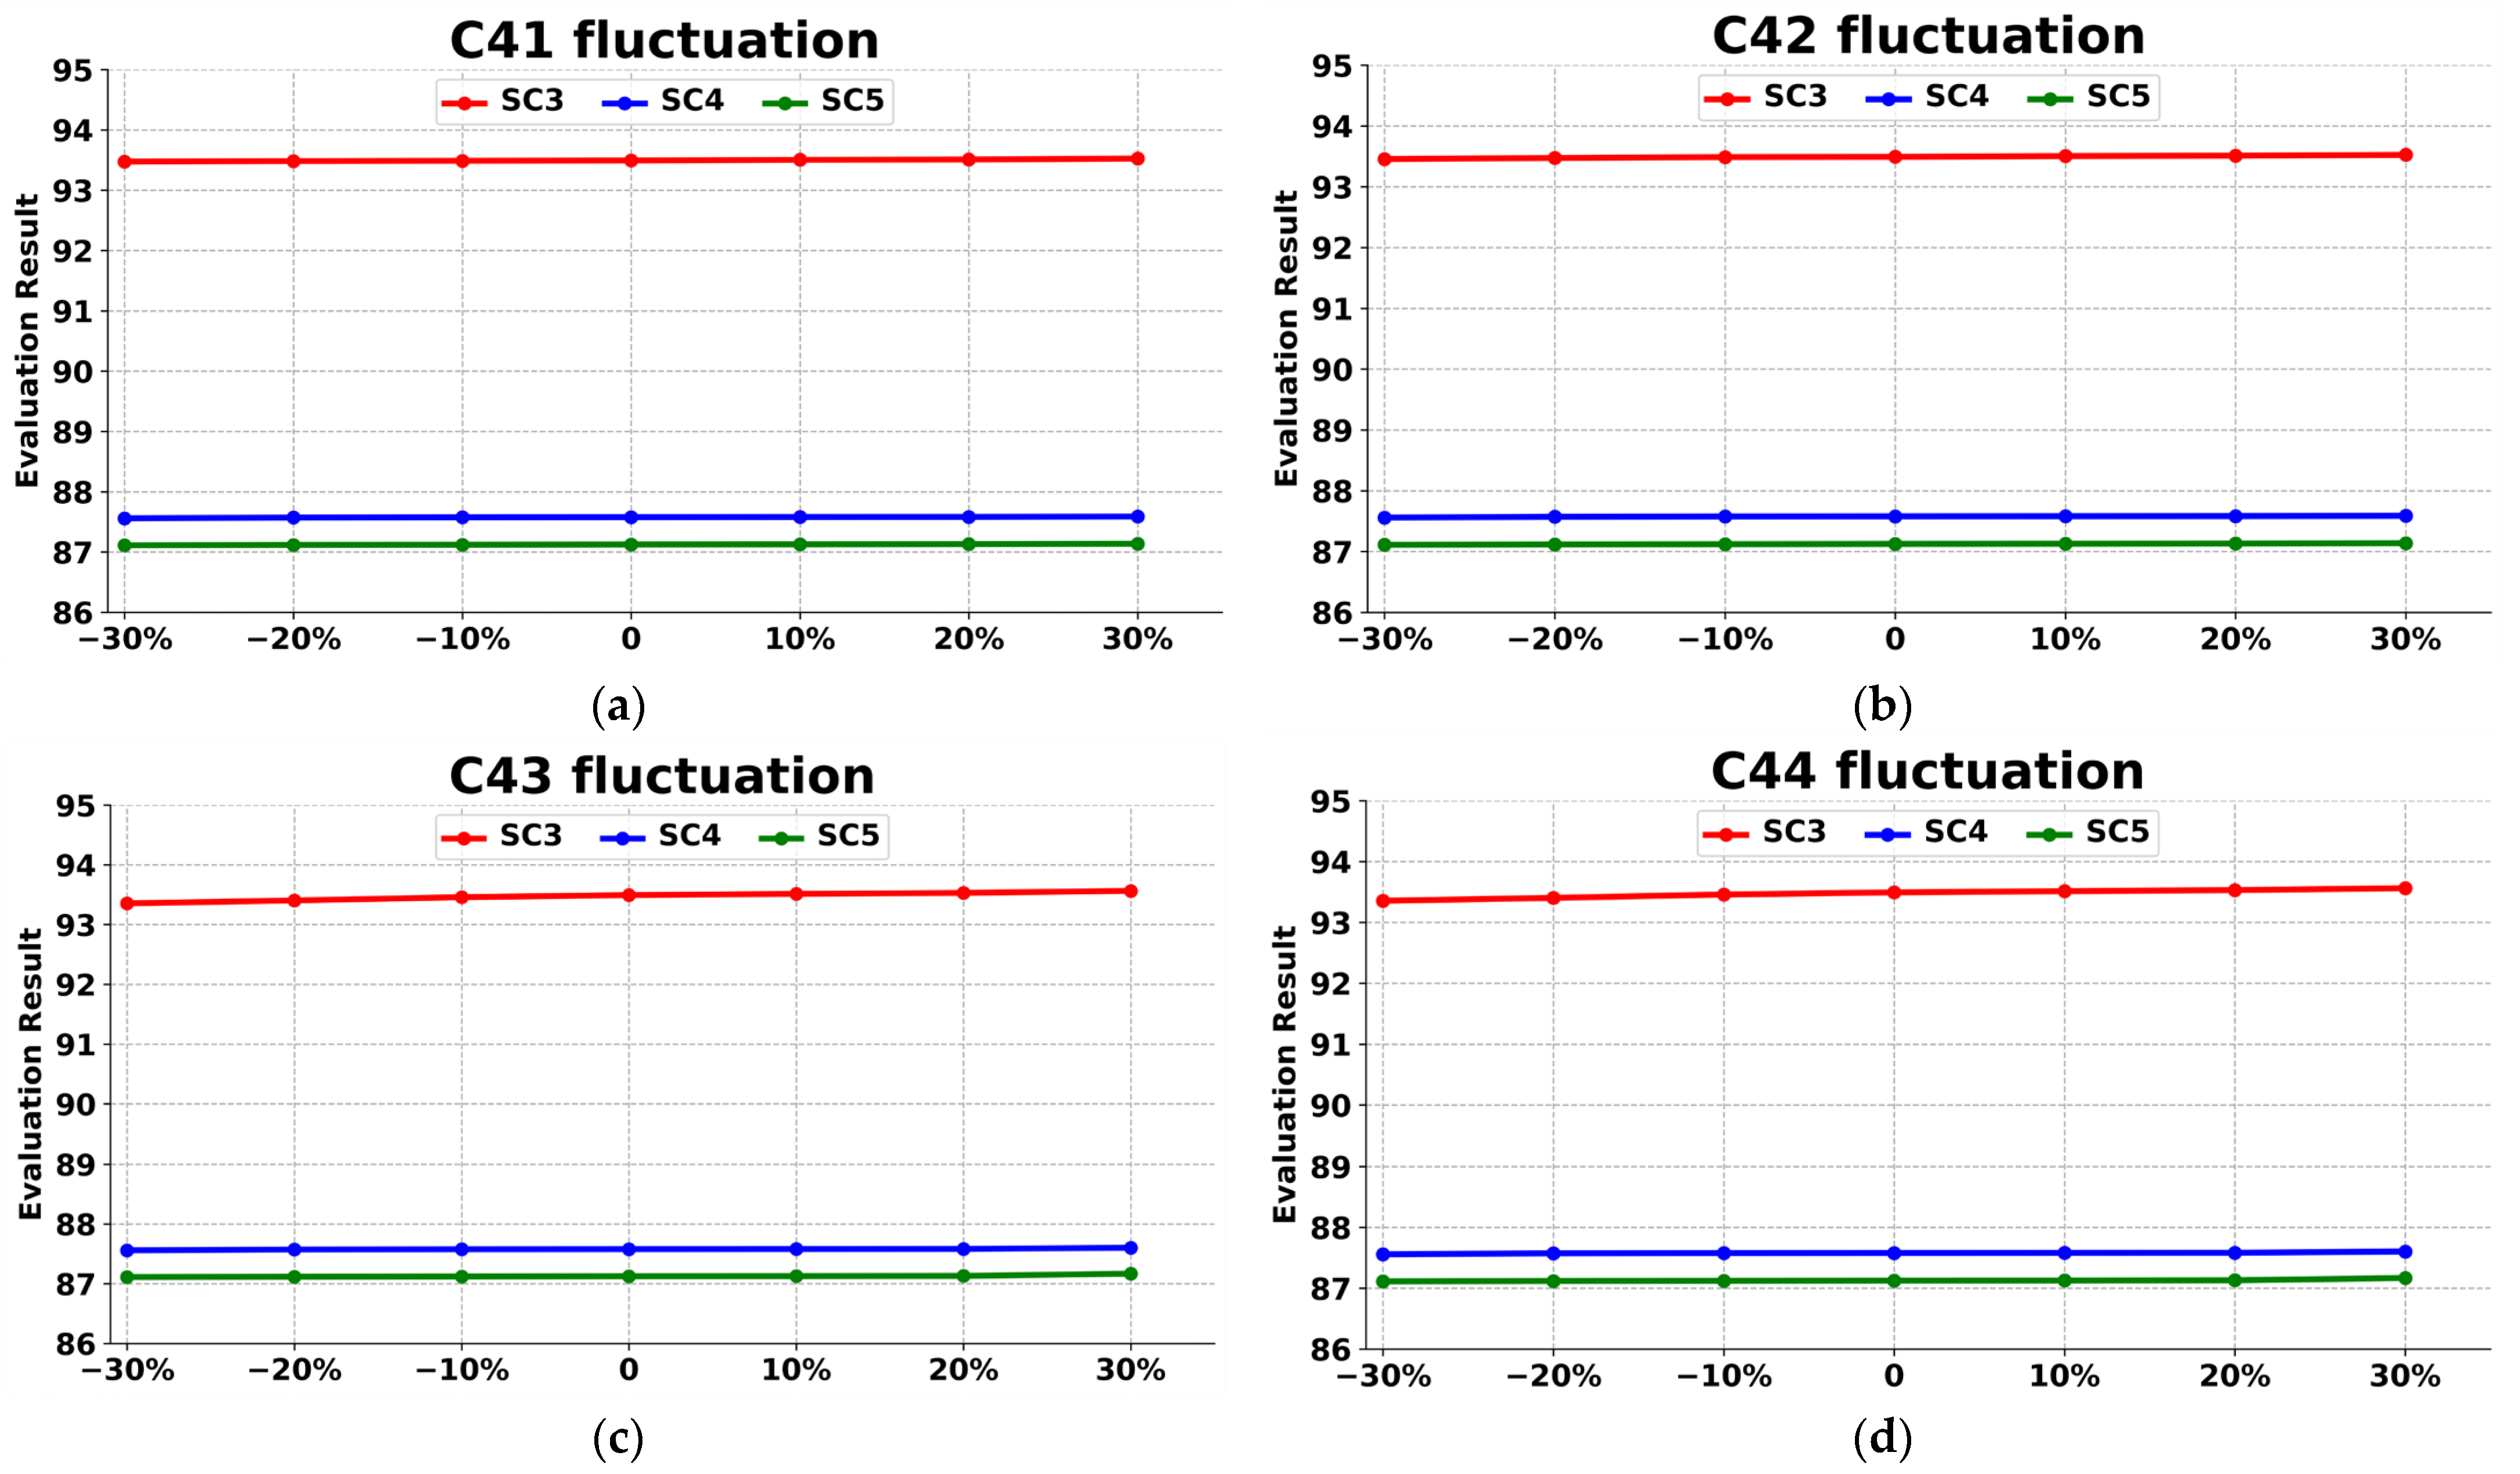
4.4. Sensitivity Analysis
5. Conclusions
Author Contributions
Funding
Institutional Review Board Statement
Informed Consent Statement
Data Availability Statement
Conflicts of Interest
References
- Fan, J.; Zhang, Y.; Wang, B. The impact of urbanization on residential energy consumption in China: An aggregated and disaggregated analysis. Renew. Sust. Energy Rev. 2017, 75, 220–233. [Google Scholar] [CrossRef]
- Wang, W.; Wang, D.; Jia, H.; Chen, Z.; Fan, M. Review of Steady-state Analysis of Typical Regional Integrated Energy System Under the Background of Energy Internet. Proc. CSEE 2016, 36, 3292–3306. [Google Scholar]
- Zeng, M.; Yang, Y.; Li, Y.; Zeng, B.; Bai, X. The Preliminary Research for Key Operation Mode and Technologies of Electrical Power System With Renewable Energy Sources Under Energy Internet. Proc. CSEE 2016, 36, 681–691. [Google Scholar]
- Yu, X.; Xu, X.; Chen, S.; Wu, J.; Jia, H. A Brief Review to Integrated Energy System and Energy Internet. Trans. China Electrotech. Soc. 2016, 31, 1–13. [Google Scholar]
- Bie, C.; Wang, X.; Hu, Y. Review and Prospect of Planning of Energy Internet. Proc. CSEE 2017, 37, 6445–6462. [Google Scholar]
- Wu, J. Drivers and state-of-the-art of integrated energy systems in Europe. Autom. Electr. Power Syst. 2016, 40, 1–7. [Google Scholar]
- Huang, A.Q.; Crow, M.L.; Heydt, G.T.; Zheng, J.P.; Dale, S.J. The future renewable electric energy delivery and management (FREEDM) system: The Energy Internet. Proc. IEEE 2010, 99, 133–148. [Google Scholar] [CrossRef]
- Ahmadi, P.; Dincer, I.; Rosen, M.A. Thermoeconomic multi-objective optimization of a novel biomass-based integrated energy system. Energy 2014, 68, 958–970. [Google Scholar] [CrossRef]
- Kumar, A.; Sah, B.; Singh, A.R. A review of multi-criteria decision making (MCDM) towards sustainable renewable energy development. Renew. Sust. Energy Rev. 2017, 69, 596–609. [Google Scholar] [CrossRef]
- Katal, F.; Fazelpour, F. Multi-criteria evaluation and priority analysis of different types of existing power plants in Iran: An optimized energy planning system. Renew. Energy 2018, 120, 163–177. [Google Scholar] [CrossRef]
- Yang, K.; Yan, D.; Zhu, N.; Fan, Y.; Wang, Q. Multi-criteria integrated evaluation of distributed energy system for community energy planning based on improved grey incidence approach: A case study in Tianjin. Appl. Energy 2018, 229, 352–363. [Google Scholar] [CrossRef]
- Huang, W.; Guo, Z.; Hua, L. Comprehensive Evaluation of Regional Integrated Energy System Considering Multi-participant Interest Coordination. Electr. Power Constr. 2019, 40, 81–89. [Google Scholar]
- Pilavachi, P.A.; Roumpeas, C.P.; Minett, S.; Afgan, N.H. Multi-criteria evaluation for CHP system options. Energy Convers. Manag. 2006, 47, 3519–3529. [Google Scholar] [CrossRef]
- Jiang, L.; Yuan, Y.; Wang, Z.; Wang, S. Evaluation Index System and Comprehensive Evaluation Method of Energy Internet in Innovative Demonstration Area of Smart Grid. Proc. CSU-EPSA 2016, 28, 39–45. [Google Scholar]
- Qi, W.; Yanchao, L.; Yijiang, L.; Ning, X.; Xu, L. Investment Evaluation Method of Integrated Energy System. Smart Power 2020, 48, 20–27. [Google Scholar]
- Ma, L.; Lu, Z.; Zhu, L. A Closed-Loop Approach to Calculate Economical Operation Indices of Distribution Network Based on Dempster-Shafer Evidence Theory. Power Syst. Technol. 2011, 35, 110–116. [Google Scholar]
- Yu, Y.; Fang, X.; Zhang, W.; Shen, X. Research on Investment Efficiency of Power Grid Construction Project Based on Entropy Weight Method-DEA Model. Smart Power 2016, 44, 72–77. [Google Scholar]
- Ying, H. Research on Comprehensive Risk Assessment Model of Solar Photovoltaic Projects Based on Credibility Theory. Master’s Thesis, North China Electric Power University, Beijing, China, 2014. [Google Scholar]
- Xu, S.; Cui, Y.; Yang, C.; Wei, S.; Wang, W. The fuzzy comprehensive evaluation (FCE) and the principal component analysis (PCA) model simulation and its applications in water quality assessment of Nansi Lake Basin, China. Environ. Eng. Res. 2020, 26, 200022. [Google Scholar] [CrossRef]
- Wu, Q.; Ren, H.; Gao, W.; Ren, J. Multi-criteria assessment of combined cooling, heating and power systems located in different regions in Japan. Appl. Ther. Eng. 2014, 73, 660–670. [Google Scholar] [CrossRef]
- Jing, R.; Wang, M.; Brandon, N.; Zhao, Y. Multi-criteria evaluation of solid oxide fuel cell based combined cooling heating and power (SOFC-CCHP) applications for public buildings in China. Energy 2017, 141, 273–289. [Google Scholar] [CrossRef]
- Li, M.; Mu, H.; Li, N.; Ma, B. Optimal design and operation strategy for integrated evaluation of CCHP (combined cooling heating and power) system. Energy 2016, 99, 202–220. [Google Scholar] [CrossRef]
- Chatzimouratidis, A.I.; Pilavachi, P.A. Technological, economic and sustainability evaluation of power plants using the Analytic Hierarchy Process. Energy Policy 2009, 37, 778–787. [Google Scholar] [CrossRef]
- Rong, Z.; Li, H.; Jiang, R.; Liu, L.; Zhang, G. A novel multi-objective optimization method for CCHP-GSHP coupling systems. Energy Build. 2016, 112, 149–158. [Google Scholar]
- Chen, W. Research on Multi-level Combined Fuzzy Comprehensive Evaluation for Alternative Transmission Network Planning. Master’s Thesis, Huazhong University of Science and Technology, Wuhan, China, 2015. [Google Scholar]
- Li, Y.; Chen, Z. Study on Regional Electric Energy Substitution Potential Evaluation Based on TOPSIS Method of Optimized Connection Degree. Power Syst. Technol. 2019, 43, 687–695. [Google Scholar]
- Zhang, Q.; Jia, M. Research on rural power grid investment allocation decision based on BP neural network evaluation. Power Syst. Big Data 2019, 22, 72–78. [Google Scholar]
- Shen, Y.; Peng, X.; Shi, T.; Mao, X.; Sun, Y. A Gray Comprehensive Evaluation Method of Power Quality Based on Optimal Combination Weight. Autom. Electr. Power Syst. 2012, 36, 67–73. [Google Scholar]
- Zhou, H.; Yu, Y.; Gao, Y. Research on post-evaluation of power grid technological transformation project based on matter-element extension. Electr. Eng. 2020, 21, 50–55. [Google Scholar]
- Moglia, M.; Cook, S.; Mcgregor, J. A review of Agent-Based Modelling of Technology Diffusion with special reference to residential energy efficiency. Sustain. Cities Soc. 2017, 31, 173–182. [Google Scholar] [CrossRef]
- Erixno, O.; Rahim, N.A. A techno-environmental assessment of hybrid photovoltaic-thermal based combined heat and power system on a residential home. Renew. Energy 2020, 156, 1186–1202. [Google Scholar] [CrossRef]
- Wang, J.; Jing, Y.; Zhang, C. Integrated evaluation of distributed triple-generation systems using improved grey incidence approach. Energy 2008, 33, 1427–1437. [Google Scholar] [CrossRef]
- Noorollahi, Y.; Senani, A.G.; Fadaei, A.; Simaee, M.; Moltames, R. A framework for GIS-based site selection and technical potential evaluation of PV solar farm using Fuzzy-Boolean logic and AHP multi-criteria decision-making approach. Renew. Energy 2022, 186, 89–104. [Google Scholar] [CrossRef]
- Ren, H.; Gao, W.; Zhou, W. Multi-criteria evaluation for the optimal adoption of distributed residential energy systems in Japan. Energy Policy 2009, 37, 5484–5493. [Google Scholar] [CrossRef]
- Georgiou, D.; Mohammed, E.S.; Rozakis, S. Multi-criteria decision making on the energy supply configuration of autonomous desalination units. Renew. Energy 2015, 75, 459–467. [Google Scholar] [CrossRef] [Green Version]
- Dong, F.; Zhang, Y.; Shang, M. Multi-criteria comprehensive evaluation of distributed energy system. Proc. CSEE 2016, 36, 3214–3223. [Google Scholar]
- Vishnupriyan, J.; Manoharan, P.S. Multi-criteria decision analysis for renewable energy integration: A southern India focus. Renew. Energy 2018, 121, 474–488. [Google Scholar] [CrossRef]
- Kaya, T.; Kahraman, C. Multi-criteria renewable energy planning using an integrated fuzzy VIKOR and AHP methodology: The case of Istanbul. Energy 2010, 35, 2517–2527. [Google Scholar] [CrossRef]
- Wang, Q.; Han, R.; Huang, Q.; Tang, B. Research on energy conservation and emissions reduction based on AHP-fuzzy synthetic evaluation model: A case study of tobacco enterprises. J. Clean. Prod. 2018, 201, 88–97. [Google Scholar] [CrossRef]
- Yi, L.; Li, Z.P.; Yang, L.; Liu, J.; Liu, Y.R. Comprehensive evaluation on the “maturity” of China’s carbon markets. J. Clean. Prod. 2018, 198, 1336–1344. [Google Scholar] [CrossRef]
- Çolak, M.; Kaya, İ. Prioritization of renewable energy alternatives by using an integrated fuzzy MCDM model: A real case application for Turkey. Renew. Sust. Energy Rev. 2017, 80, 840–853. [Google Scholar] [CrossRef]
- Li, Y.; Li, K.; Yang, Z.; Yu, Y.; Xu, R.; Yang, M. Stochastic optimal scheduling of demand response-enabled microgrids with renewable generations: An analytical-heuristic approach. J. Clean. Prod. 2022, 330, 129840. [Google Scholar] [CrossRef]
- Li, J.; Liu, H.; Wang, R. Comprehensive Efficiency Evaluation of Integrated Energy System Based on Cross-super-efficiency CCR Model. Autom. Electr. Power Syst. 2020, 44, 78–90. [Google Scholar]
- Tian, L.; Cheng, L.; Guo, J.; Sun, S.; Cheng, Y.; Wei, D. Multi-energy System Valuation Method Based on Emergy Analysis. Power Syst. Technol. 2019, 43, 2925–2934. [Google Scholar]
- Li, Y.; Wang, B.; Yang, Z.; Li, J.; Li, G. Optimal scheduling of integrated demand response-enabled community-integrated energy systems in uncertain environments. IEEE Trans. Ind. Appl. 2022, 58, 2640–2651. [Google Scholar] [CrossRef]
- Chen, B.; Liao, Q.; Liu, D.; Wang, W.; Wang, Z.; Chen, S. Comprehensive Evaluation Indices and Methods for Regional Integrated Energy System. Autom. Electr. Power Syst. 2018, 42, 174–182. [Google Scholar]
- Liu, H.; Zhao, Y.; Liu, X.; Zhang, Q.; Ge, S.Y.; Liu, J.Y. Comprehensive Energy Efficiency Assessment of Park-level Multi-energy System Considering Difference of Energy Grade. Power Syst. Technol. 2019, 43, 2835–2843. [Google Scholar]
- Liu, Y. Research on Comprehensive Evaluation of Regional Distributed “Multi-energy Complementary” Energy System. Master’s Thesis, Chongqing University, Chongqing, China, 2019. [Google Scholar]
- Wen, Q.; Liu, G.; Wu, W.; Liao, S. Multicriteria comprehensive evaluation framework for industrial park-level distributed energy system considering weights uncertainties. J. Clean. Prod. 2020, 282, 124530. [Google Scholar] [CrossRef]
- Li, Y.; Li, J.; Wang, Y. Privacy-preserving spatiotemporal scenario generation of renewable energies: A federated deep generative learning approach. IEEE Trans. Ind. Inform. 2022, 18, 2310–2320. [Google Scholar] [CrossRef]
- Wu, Y.; Zhang, B.; Wu, C.; Zhang, T.; Liu, F. Optimal site selection for parabolic trough concentrating solar power plant using extended Promethee method: A case in China. Renew. Energy 2019, 143, 1910–1927. [Google Scholar] [CrossRef]
- Le, T.N.; Quyen, H.A.; Nguyen, N.A. Application of fuzzy-analytic hierarchy process algorithm and fuzzy load profile for load shedding in power systems. Int. J. Electr. Power Energy Syst. 2016, 77, 178–184. [Google Scholar] [CrossRef]


| Target Layer | Secondary Indexes | Third-Grade Indexes | Type |
|---|---|---|---|
| Comprehensive benefit A | Economy B1 | Initial investment (C11) Payback period (C12) System operating cost (C13) Equipment life (C14) | quantity |
| Technology B2 | Energy conversion efficiency (C21) Renewable energy utilization ratio (C22) Comprehensive energy utilization efficiency (C23) Primary energy utilization efficiency (C24) | ||
| Environment B3 | CO2 emission (C31) Nitrogen oxide emission (C32) SO2 emission (C33) PMX emission (C34) | ||
| Socio-politics B4 | Compatibility with political framework (C41) Social acceptability (C42) Space occupation (C43) Maintenance convenience (C44) | quality |
| Scale Value | Meaning |
|---|---|
| 1 | This represents that both elements have the same importance |
| 3 | One element is slightly more important than the other element |
| 5 | One element is significantly more important than the other element |
| 7 | One element is much more important than the other element |
| 9 | One element is more important than the other element |
| 2, 4, 6, 8 | The intermediate value of the above two adjacent judgments |
| inverse | is judgment comparing factor i and j, then factor j and i is |
| n | 1 | 2 | 3 | 4 | 5 | 6 | 7 | 8 | 9 |
|---|---|---|---|---|---|---|---|---|---|
| RI | 0 | 0 | 0.58 | 0.9 | 1.12 | 1.24 | 1.32 | 1.14 | 1.45 |
| Number | System Scheme | Main Configuration |
|---|---|---|
| 1 | Separate production system | Electric chiller + gas boiler + power grid |
| 2 | CCHP system | Gas turbine + lithium bromide absorption unit + electric refrigerator + gas boiler + power grid |
| 3 | Optimized CCHP system | Electric refrigerator + gas boiler + power grid + gas turbine + absorption chiller + power chiller + exhaust treater + energy storage device |
| 4 | Solar collector system | Solar heat collection device + power grid |
| 5 | GSHP system | Ground source heat pump system |
| Equipment | Parameter | Value |
|---|---|---|
| Gas turbine | Rated generating power (kW) | 5050 |
| Generating efficiency (%) | 30 | |
| Heating efficiency (%) | 25 | |
| Absorption chiller | Refrigeration status rated refrigeration capacity (kW) | 200 |
| The hot and cold ratio in the refrigeration state | 3.5 | |
| Heating state rated heat (kW) | 200 | |
| Heat exchange efficiency in the heating state (%) | 80 | |
| Electric Power (kW) | 50 | |
| Exhaust-heat boiler | Rated heat supply capacity (kW) | 200 |
| Heat transfer efficiency (%) | 90 | |
| Electric compression Refrigeration machine | Rated Refrigeration Capacity (kW) | 500 |
| Refrigeration energy efficiency ratio | 6 | |
| Gas boiler | Rated heat supply capacity (kW) | 200 |
| Heating efficiency (%) | 90 |
| Index Number | Unit | Scheme 1 | Scheme 2 | Scheme 3 | Scheme 4 | Scheme 5 |
|---|---|---|---|---|---|---|
| C11 | Wan Yuan | 3621 | 4745 | 5106 | 4275 | 4980 |
| C12 | year | 6.3 | 9.7 | 9.3 | 5.6 | 8.4 |
| C13 | Wan yuan/year | 3014.04 | 2536.21 | 1706.79 | 1789.48 | 1805.48 |
| C14 | year | 20 | 30 | 30 | 25 | 30 |
| C21 | % | 56 | 68 | 80 | 76 | 75 |
| C22 | % | 0 | 28.32 | 39.68 | 35.77 | 32.22 |
| C23 | % | 70 | 80.95 | 89.73 | 82.44 | 79.72 |
| C24 | % | 46.7 | 76.1 | 81.5 | 62 | 75.6 |
| C31 | t/y | 36,313.2 | 19,756 | 11,756 | 19,491.1 | 28,946 |
| C32 | t/y | 1670.93 | 1175.79 | 1060.52 | 995 | 1106.75 |
| C33 | t/y | 788.02 | 704.60 | 546.25 | 686.55 | 694.42 |
| C34 | t/y | 280.41 | 169.76 | 122.97 | 112.90 | 142.54 |
| C41 | value | 40 | 90 | 95 | 90 | 90 |
| C42 | value | 70 | 90 | 95 | 90 | 80 |
| C43 | value | 60 | 90 | 90 | 90 | 75 |
| C44 | value | 50 | 90 | 95 | 90 | 80 |
| Index Number | Scheme 1 | Scheme 2 | Scheme 3 | Scheme 4 | Scheme 5 |
|---|---|---|---|---|---|
| C11 | 1.0000 | 0.2431 | 0.0000 | 0.5596 | 0.0848 |
| C12 | 0.8292 | 0.0000 | 0.0976 | 1.0000 | 0.3170 |
| C13 | 0.0000 | 0.3655 | 1.0000 | 0.9367 | 0.9245 |
| C14 | 0.0000 | 1.0000 | 1.0000 | 0.5000 | 1.0000 |
| C21 | 0.0000 | 0.5000 | 1.0000 | 0.8333 | 0.7916 |
| C22 | 0.0000 | 0.7137 | 1.0000 | 0.9015 | 0.8119 |
| C23 | 0.0000 | 0.5549 | 1.0000 | 0.6305 | 0.4927 |
| C24 | 0.0000 | 0.8448 | 1.0000 | 0.4396 | 0.8304 |
| C31 | 0.0000 | 0.3257 | 1.0000 | 0.3149 | 0.7000 |
| C32 | 0.0000 | 0.2674 | 0.0969 | 1.0000 | 0.1653 |
| C33 | 0.0000 | 0.6549 | 1.0000 | 0.5803 | 0.6128 |
| C34 | 0.0000 | 0.6605 | 0.9398 | 1.0000 | 0.8230 |
| C41 | 0.4000 | 0.9000 | 0.9500 | 0.9000 | 0.9000 |
| C42 | 0.7000 | 0.9000 | 0.9500 | 0.8500 | 0.8000 |
| C43 | 0.6000 | 0.9000 | 0.9000 | 0.9000 | 0.7500 |
| C44 | 0.5000 | 0.9000 | 0.9500 | 0.9000 | 0.8000 |
| Secondary Indexes | Weight | Third-Grade Indexes | Subjective Weight | Objective Weight |
|---|---|---|---|---|
| B1 | 0.2390 | C11 | 0.3628 | 0.3953 |
| C12 | 0.1630 | 0.2387 | ||
| C13 | 0.3260 | 0.2292 | ||
| C14 | 0.1479 | 0.1367 | ||
| B2 | 0.3397 | C21 | 0.1408 | 0.1868 |
| C22 | 0.2628 | 0.1325 | ||
| C23 | 0.4554 | 0.5976 | ||
| C24 | 0.1408 | 0.0830 | ||
| B3 | 0.1404 | C31 | 0.5485 | 0.6729 |
| C32 | 0.2349 | 0.1593 | ||
| C33 | 0.1164 | 0.1166 | ||
| C34 | 0.0999 | 0.0510 | ||
| B4 | 0.2808 | C41 | 0.4511 | 0.2745 |
| C42 | 0.2609 | 0.5087 | ||
| C43 | 0.1189 | 0.1223 | ||
| C44 | 0.1689 | 0.0942 |
| Score Segment | 90–100 | 80–90 | 70–80 | 60–70 | Below 60 |
|---|---|---|---|---|---|
| Evaluation level | good | preferably | general | poor | bad |
| Secondary Indexes | Third-Grade Indexes | Degree of Membership |
|---|---|---|
| B1 | C11 | (0, 0.17, 0.33, 0, 0.5) |
| C12 | (0.17, 0.5, 0.17, 0.17, 0) | |
| C13 | (0.17, 0.33, 0.5, 0, 0) | |
| C14 | (1, 0, 0, 0, 0) | |
| B2 | C21 | (0.33, 0.5, 0.17, 0, 0) |
| C22 | (1, 0, 0, 0, 0) | |
| C23 | (0.17, 0.33, 0.5, 0, 0) | |
| C24 | (0.67, 0.33, 0, 0, 0) | |
| B3 | C31 | (1, 0, 0, 0, 0) |
| C32 | (1, 0, 0, 0, 0) | |
| C33 | (0.67, 0.17, 0.17, 0, 0) | |
| C34 | (0.5, 0.5, 0, 0, 0) | |
| B4 | C41 | (0.5, 0.5, 0, 0, 0) |
| C42 | (0.67, 0.33, 0, 0, 0) | |
| C43 | (0.83, 0.17, 0, 0, 0) | |
| C44 | (0.83, 0.17, 0, 0, 0) |
| Number | SC1 | SC2 | SC3 | SC4 | SC5 |
|---|---|---|---|---|---|
| Evaluation value | 65.926 | 84.625 | 93.490 | 87.579 | 87.125 |
| Number | Scheme 1 | Scheme 2 | Scheme 3 | Scheme 4 | Scheme 5 |
|---|---|---|---|---|---|
| Expert 1 | 65.48 | 85.125 | 93.482 | 87.882 | 89.85 |
| Expert 2 | 66.58 | 84.381 | 92.885 | 86.33 | 87.156 |
| Expert 3 | 64.86 | 83.86 | 93.593 | 86.256 | 87.23 |
| Expert 4 | 62.72 | 83.01 | 89.46 | 86.50 | 88.94 |
| Expert 5 | 63.37 | 79.82 | 91.78 | 88.62 | 90.22 |
| Expert 6 | 59.81 | 81.95 | 92.74 | 86.44 | 87.75 |
| Fuzzy comprehensive method | 65.926 | 84.625 | 93.490 | 87.579 | 88.925 |
Disclaimer/Publisher’s Note: The statements, opinions and data contained in all publications are solely those of the individual author(s) and contributor(s) and not of MDPI and/or the editor(s). MDPI and/or the editor(s) disclaim responsibility for any injury to people or property resulting from any ideas, methods, instructions or products referred to in the content. |
© 2022 by the authors. Licensee MDPI, Basel, Switzerland. This article is an open access article distributed under the terms and conditions of the Creative Commons Attribution (CC BY) license (https://creativecommons.org/licenses/by/4.0/).
Share and Cite
Cao, J.; He, B.; Qu, N.; Zhang, J.; Liu, C.; Liu, Y.; Chen, C.-L. Benefits Evaluation Method of an Integrated Energy System Based on a Fuzzy Comprehensive Evaluation Method. Symmetry 2023, 15, 84. https://doi.org/10.3390/sym15010084
Cao J, He B, Qu N, Zhang J, Liu C, Liu Y, Chen C-L. Benefits Evaluation Method of an Integrated Energy System Based on a Fuzzy Comprehensive Evaluation Method. Symmetry. 2023; 15(1):84. https://doi.org/10.3390/sym15010084
Chicago/Turabian StyleCao, Jie, Bowen He, Nan Qu, Jiaxin Zhang, Chaoqiang Liu, Yaowei Liu, and Chin-Ling Chen. 2023. "Benefits Evaluation Method of an Integrated Energy System Based on a Fuzzy Comprehensive Evaluation Method" Symmetry 15, no. 1: 84. https://doi.org/10.3390/sym15010084