1. Introduction
Dusty plasmas are very abundant and present in space and astrophysical surroundings. These space environments include cometary tails, planetary rings, the magnetosphere, the lower part of the earth’s ionosphere, and the interstellar medium [
1,
2,
3,
4]. The occurrence and importance of the dust in laboratory plasmas like flames, plasma in fusion devices, and plasma used in industrial laboratories cannot be avoided [
5,
6,
7,
8]. Dust particles, which make the conventional electron–ion (e–i) plasma dusty plasma, are often of micron to submicron size [
4]. Dust particles are not neutral; depending on the charging mechanism in the plasma environment, they may be negatively or positively charged. Dust grains have the capability to accumulate negative charges by gathering electrons from the surrounding plasma, a process facilitated by field emission, exposure to ultraviolet rays, and plasma currents [
9,
10]. Certain mechanisms, including thermionic emission induced by radiative heating, the secondary emission of electrons from the dust grain’s surface, and photo-emission in the presence of ultraviolet photon flux, can also result in the positive charging of dust particles [
1,
11]. Linear and nonlinear wave propagation have been studied in dusty plasma. The presence of numerous dust particles in plasma introduced several new types of wave modes. These new modes include dust acoustic waves (DAWs) [
12], dust lattice waves (DLWs) [
13,
14], dust drift waves (DDWs), and dust ion acoustic waves (DIAWs) [
15]. Out of these, DIAWs are one of the most explored dust-associated low frequency waves, which are essential for understanding various types of collective processes in dusty plasmas. Theoretically, Shukla and Silin anticipated these waves in 1992 [
15]. Later on, experimentally, Barkan et al. [
16] confirmed these waves in the laboratory. Apart from the linear study of DIAWs, the planar solitary waves, i.e., the nonlinear DIAWs, which exhibit a high degree of symmetry due to the delicate balance between the dispersion and non linearity, have also been studied; see, for example [
17,
18,
19]. The symmetry of planar solitary waves has important applications in various fields, including optics, fluid dynamics, and plasma physics. In optics, for example, planar solitary waves can be generated in fiber optic systems and used for long-distance data transmission without regenerating a signal. In [
17,
18], the Reductive Perturbation technique or similar expansions were used to explore various features of small amplitude solitary waves and/or double layers [
15,
19,
20].
Although, While the Maxwell-Boltzmann distribution function is typically employed to describe plasma particles, there are situations where particle distribution functions deviate from the Maxwellian distribution. Excess superthermal electrons are frequent in space and laboratory plasma. The space plasmas include the regions like the ionosphere, magneto-sheet, mesosphere, magnetosphere, lower atmosphere, radiation belts, and auroral zones [
21,
22,
23]. In general, the Kappa (
) distribution can be used to model superthermal plasma [
24]. The
-distribution converts to the Maxwellian distribution with large value of
. On the other side, a low value of
indicates a distribution with a high concentration of superthermal particles. Electrostatic excitation in plasma with electron superthermality effect has been investigated by several authors [
21,
25,
26]. In an unmagnetized dusty plasma with
-distributed electrons, Baluku et al. [
27] explored dust ion acoustic (DIA) solitons.
In space plasma, pressure anisotropy plays a vital role. The plasmas in space is usually collisionless and displays anisotropic behavior. This indicates that the pressures of the plasma particles vary depending on their orientation. The general dynamics and behaviour of the plasma are impacted by the pressure anisotropy. In specific space environments, the plasma flow induces magnetic compression and expansion. This mechanism is responsible for plasma pressure anisotropy [
28]. The magnetic (compression) expansion causes an (increase) decrease in the perpendicular temperature
and parallel temperature
of plasma particles. The temperature anisotropy, represented by
, results from this mechanism. It is possible to assume that the medium fulfil the double adiabatic or Chew-Goldberger-Low (CGL) model in order to include anisotropy in a space plasma model [
29]. In the case of pressure anisotropy, the plasma particle will have different pressures in the relevant direction to the magnetic field. Therefore, one needs to solve two equations of states, one for the parallel pressure
and another for the perpendicular pressure
for plasma particles, in contrast to the case in which pressure isotropy is considered. Numerous spacecraft measurements demonstrate the occurrence of non-Maxwellian particle distribution in the major astrophysical plasmas regions. These regions includes, the magnetosphere, interstellar medium, solar wind and auroral zone [
1,
30,
31], where plasma anisotropy exists. Our work is motivated by magneto sheath observations conducted during the AMPET/CCF and AMPET/IRM spacecraft missions, as described in Denton et al. [
28].
Various non linear theories/methods are employed by researchers to investigate the excitations and characteristics of nonlinear waves in plasma. Researchers commonly employ two well-established methods, namely the Reductive Perturbation theory and the Sagdeev pseudo-potential technique, to investigate nonlinear waves of arbitrary amplitude in plasma. The Reductive Perturbation theory assumes weak non-linearity and is suitable for analyzing weakly nonlinear systems. This theory is primarily used for studying and analyzing weakly nonlinear or small amplitude waves. This theory/method often relies on approximate solutions to simplify the analysis of nonlinear wave phenomena. These approximate solutions are obtained by assuming certain simplifying assumptions or by using perturbation methods to approximate the behavior of the system. On other hand Sagdeev pseudo-potential theory is the widely used nonperturbative theory implemented by Sagdeev [
32] in order to inspect the nonlinear excitations in plasma. This technique is applicable to a wide range of plasma wave phenomena, including both weakly and strongly nonlinear regimes. It overcomes the limitation of other non-linear techniques specifically used by researchers to investigate the waves with small amplitude in plasma [
33]. Furthermore, this theory provides the exact solution of differential equations, which describe nonlinear waves.
In magnetized plasma, researchers have explored ion acoustic solitary waves (IASWs) using the Sagdeev pseudo-potential method, as evidenced by Chatterjee et al.’s work [
34]. Another study by Anowar et al. [
35] employed the Sagdeev pseudo-potential method to investigate the oblique propagation of low-amplitude Dust Ion Acoustic Solitary Waves (DIASWs) in a magnetized dusty plasma. Similarly, Shalaby et al. [
36] delved into the oblique propagation of DIASWs in hot adiabatic magnetized dusty plasmas, utilizing a similar technique.
When considering pressure anisotropy, its effects on solitary wave properties become significant. Researchers, such as Choi et al. [
37], utilized Sagdeev’s potential approach to study the impact of ion pressure anisotropy on DIASWs and Shock waves in plasma with a Maxwellian distribution of electrons. In their model, they extended the Sagdeev potential by considering the low-amplitude limit to derive numerical results. This extension of ion pressure anisotropy in strongly magnetized plasma resulted in modifications to both the width and amplitude of electrostatic solitary waves, as discussed by Mahmood et al. [
38]. DIASWs of double polarity, in the presence of Cairns-distributed electrons with anisotropic pressure were analyzed in Adnan et al.’s work [
39], employing the Reductive Perturbation technique.
Furthermore, Adnan et al. [
40] investigated how ion pressure anisotropy affects the propagation characteristics of obliquely propagating solitary waves in a plasma consisting of superthermal electrons and ions, employing the Sagdeev potential technique as a framework. In another study by Khalid et al. [
41], IASWs in magnetized electron-ion plasma with pressure anisotropy, modeled with a Tsallis distribution, were discussed using a similar nonlinear technique. More recently, researchers explored oblique IASWs in magnetized anisotropic (e-p-i) electron-positron-ion plasma with a Maxwellian distribution for plasma species, as detailed in Khalid et al.’s work [
42]. It’s important to note that the models described in these studies primarily focus on positive potential nonlinear structures, specifically compressive solitary waves.
However, in a magnetized non- Maxwellian (superthermal) anisotropic plasma, obliquely propagating large amplitude DIASWs have not yet been inquired. This work is motivated by [
37,
40]. The article offers a thorough examination of the characteristics of nonlinear DIAWs, with a particular focus on the influence of electron superthermality as well as ion pressure anisotropy. The study employs the Sagdeev pseudo-potential methodology to investigate how various plasma parameters, including the presence of dust grains, the superthermal nature of electrons described by a Kappa distribution, the angle of propagation (obliqueness), magnetic field strength, as well as parallel and perpendicular ion pressure, impact the nonlinear characteristics of oblique DIAWs in anisotropic magnetized dusty plasma.
2. The Governing Equations
We consider a collisionless magnetized three component dusty plasma composed of stationary negatively charged dust particles of constant charge, warm ions and inertialess Kappa distributed superthermal electrons. The charge neutrality at equilibrium requires
, where
denotes the amount of charge residing on the dust particle. The ions with pressure anisotropy provide inertia. Along the x-axis, the ambient magnetic field of constant magnitude is considered i.e.,
. The presence of ion pressure anisotropy modify the ion fluid equations and are given as
Here
,
,
, and
represent the ions’ density, charge state, velocity, and ion pressure tensor, respectively.
stands for the electrostatic potential, and
e and
stand for the ionic charge and mass, respectively. The pressure tensor
is divided into two components related to the external magnetic field
and can be written as
where,
represents the unit vector along the ambient magnetic field and
is the unit tensor. The CGL theory [
29] defines
and
as
In Equation (
4),
and
show the unperturbed values of the perpendicular and parallel pressure, respectively. When
in the case of ion pressure isotropy, then
. We make use of the non Maxwellian distribution (Kappa distribution) function in three dimensions to model the superthermal electrons proposed by [
24] as
where
is the unperturbed density of electrons, and
is the modified thermal speed of an electron.
and
are the temperature of Maxwellian electron and the mass of an electron, respectively, and
is the usual gamma function. The integration of the Kappa distribution function given in Equation (
5) over the velocity space gives rise to
, i.e., the density of Kappa-distributed electrons, which can be expressed as
The deviation from the Maxwellian distribution is measured by the spectral index
. Poisson’s Equation will be applied to complete the system of evolution equations for the electrostatic disturbance.
In equilibrium, the neutrality condition yields
where
is the ratio of the equilibrium densities of plasma species also often referred to as the dust concentration.
2.1. Fluid Evolution Equations
In two-dimensional perturbations, the equations describing the ion dynamic are
where
is defined to be the ion gyro-frequency, and
, and
represent the ion fluid velocity components. The ionic charge state
is assumed.
2.2. Scaling
The ions normalized fluid equations for dynamics of the DIAWs are given by,
The normalized density equation of the Kappa-distributed electrons is
The Poisson’s equation in normalized form can be written as
where, space, time, ion fluid velocity, and electrostatic potential are scaled as
,
, and
. Here, [
] is the sound speed of an ion, [
] is the Debye length, and [
] is the plasma ion frequency. The plasma species densities
(where
s are normalized by the equilibrium ion density
. Moreover,
and
are the normalized parallel and perpendicular ion pressures also
(dimensionless parameter).
3. Linear Wave Analysis
In this section, we use Poisson’s Equation (
19) instead of plasma approximation to obtain the dispersion relation for low frequency DIAWs. Considering the small amplitude harmonic perturbation in the form of
, we linearize Equations (
14)–(
19); one may obtain the dispersion relation of the coupled DIAWs and dust ion acoustic cyclotron waves (DIACWs) in superthermal magnetized anisotropic dusty plasma as given below
here,
where
and
are the wave vectors along and across the ambient magnetic field, respectively. By solving Equation (
20), we obtain
Equation (
21) explicitly depends on the ion pressure anisotropy, via
and
, the dust concentration
, and the superthermality of electrons
, and the magnetic field effect can be seen through
Equation (
17) in [
40] is recovered for
. Furthermore, for
, the Maxwellian limit is obtained. Equation (
21) gives the slow and fast electrostatic modes with frequencies
and
, respectively. An acoustic mode is obtained by setting
,
, and considering
. The phase speed in the direction parallel to the magnetic field is thus obtained as
Equation (
21) shows that the dispersion relation of acoustic modes does not depend on the ion perpendicular pressure
and magnetic field
. Ignoring the dust concentration, i.e.,
, Equation (
22) yields to the earlier result given in [
40]. In
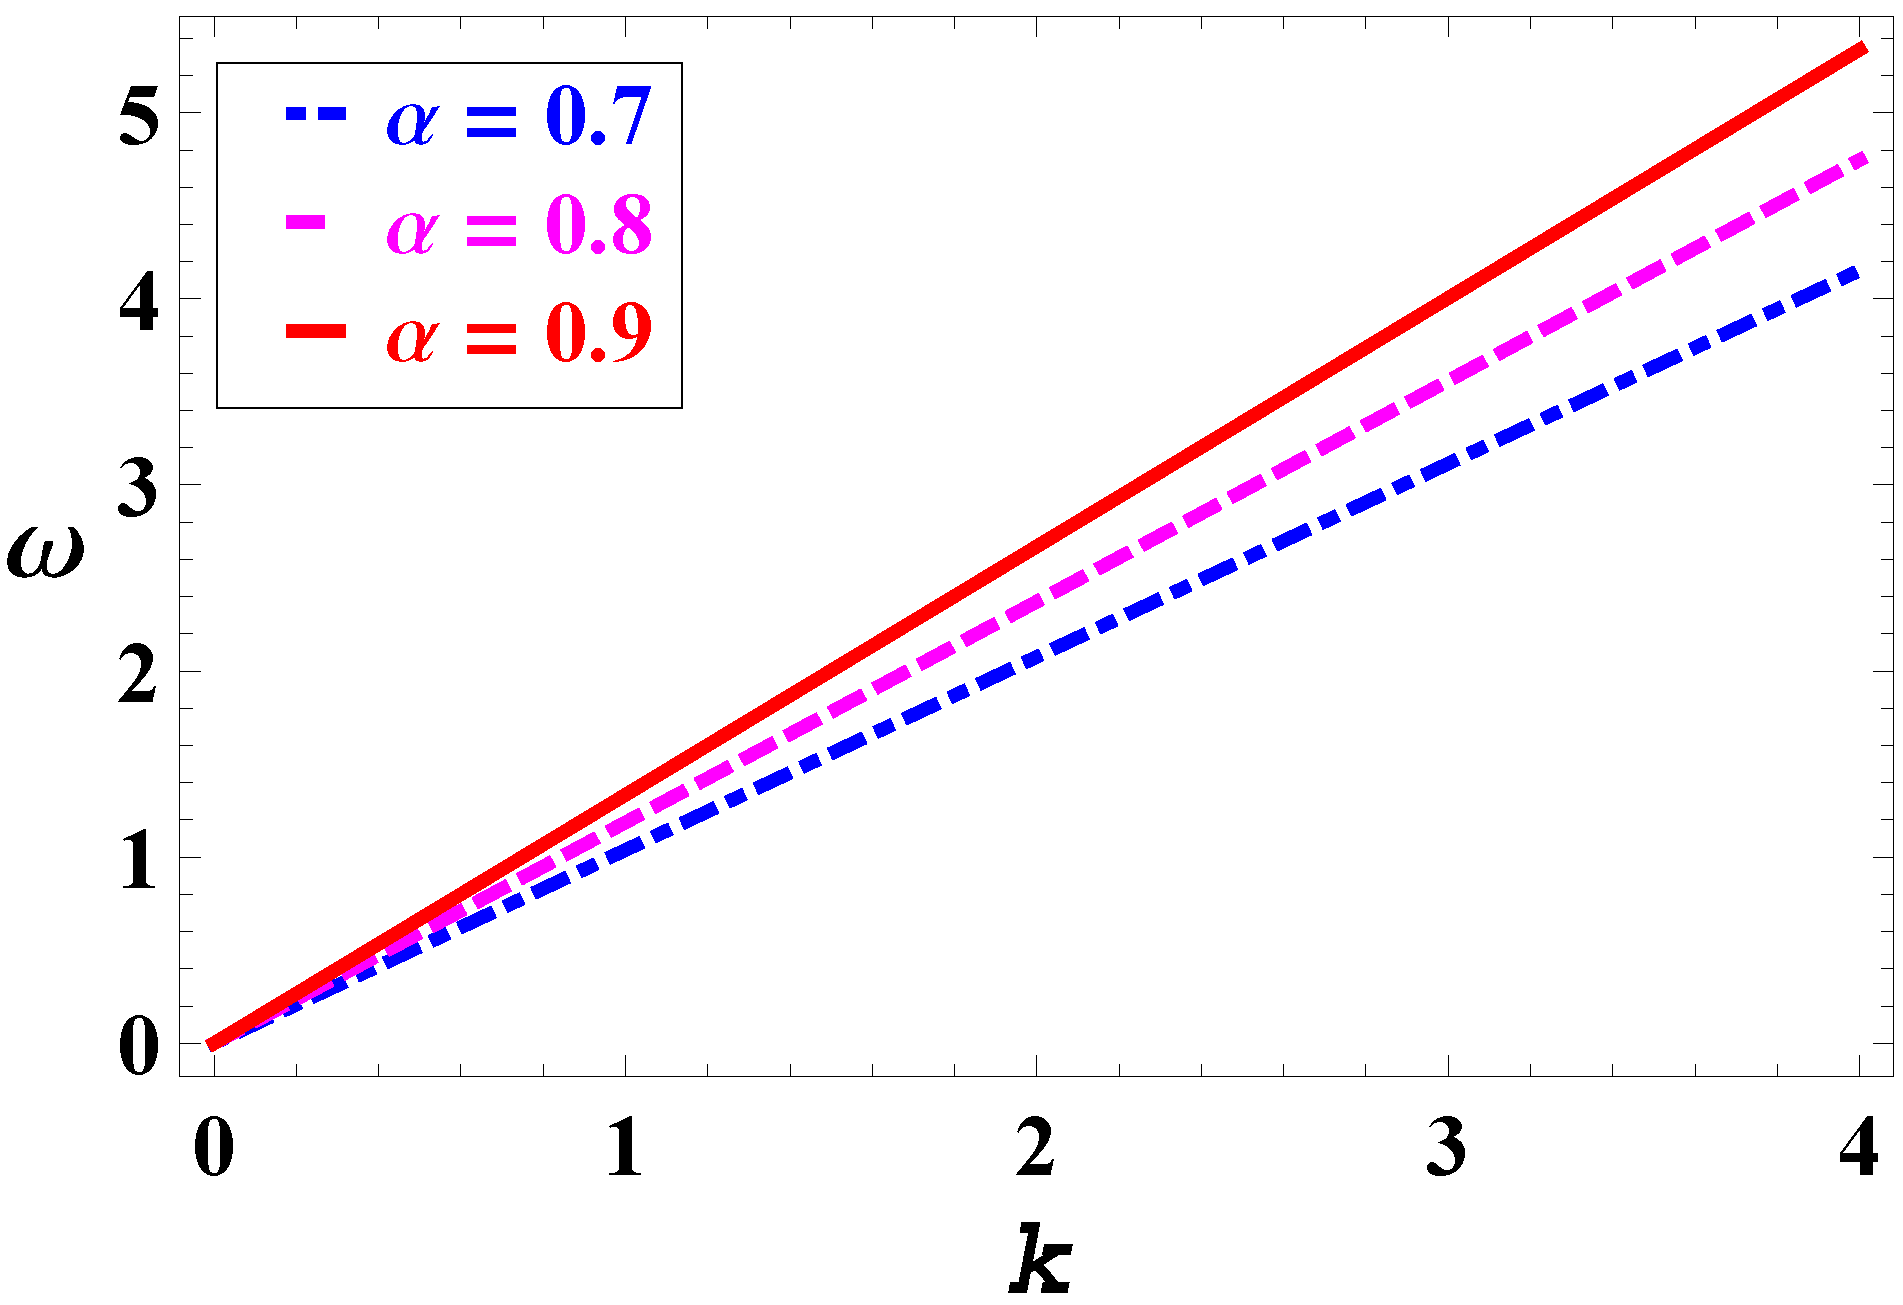
Figure 1, the linear dispersion relation obtained for the acoustic mode
given by Equation (
22) is plotted for different values of
, where
. Here,
show the obliqueness and
is also called obliquity parameter. The range of the value of
is 0
1. It is noted that with increased obliqueness (i.e., a lower
), the frequency and, hence, the phase speed of the magnetized DIAWs decrease.
4. Large Amplitude Solitary Wave Analysis
In the current section, we employ the Sagdeev potential formalism to examine the existence of DIASWs of large amplitude in plasmas composed of electrons following Kappa distribution and ions having anisotropic pressure. The fluid variables in the evolution equations are presumed to be built on a single travelling coordinate, namely
where
M is the normalized soliton speed called the Mach number. The parameter
cos
, while
, which implies the directional cosine of the wave vector along the
x-axis and
y-axis satisfying the condition
. A non-dimensional set of nonlinear differential equations in the co-moving coordinate
is obtained, when Equation (
23) is utilized in Equations (
14)–(
17). Equations (
14)–(
17) in their transformed forms are,
When integrating Equations (
24)–(
27) we use the appropriate initial conditions [
, and
at
], and we arrive to
The use of Equation (
28) with Equations (
26) and (
27) leads to
Inserting
from Equation (
30) into Equation (
32), one obtains
Differentiating Equation (
31) with respect to
and using Equations (
30) and (
33), after some cumbersome calculations, we have
Equation (
34) is multiplied by
. Integrating the resulting equation with the use of initial conditions [
and
at
], we obtain the quadrature
In our proposed Model the Sagdeev potential
given in Equation (
35) is
Equation (
35) is an energy balance equation. This equation describes the dynamics of a particle of unit mass, with velocity
, located in a position
in a potential well
. The expression of the Sagdeev potential given in Equation (
36) in our proposed model can be compared with the Sagdeev potential derived for IASWs in superthermal plasma given by Equation (
30) in [
40]. Therefore, in the absence of dust concentration
(the electron–ion plasma case), Equation (
36) reverts to Equation (
30) in [
40]. In Equation (
36) the potential functions
are given in
Appendix A.
5. Solitary Waves: Existence Domain
The behaviour of the Sagdeev potential given in Equation (
36) could be used to detect the presence of solitary wave structures. A localized solution is possible only in the case when
and
. Also,
should be less than zero i.e., negative for
having value between 0 and
, where
is define to be the root of the Sagdeev potential, which represents compressive soliton (positive potential structure) existence when it is positive. Whereas the negative
corresponds to the occurrence of rarefactive soliton (negative potential structure). The Sagdeev potential and its first derivative are zero at
. The condition
, fulfilled by (
36), defines the solitary waves’ existence domain. Therefore using the same method adopted in [
43],
gives rise to
where
and
Here,
and
are the upper and lower bounds of the Mach number also called the Mach number limits. Above
and below
, compressive and rarefactive solitary waves may be excited. It is evident from Equation (
38) that
is independent of
while
depends on both
and
. For
(i.e., considering the two component electron–ion plasma case), Equations (
38) and (
39) reduce to the earlier result given in [
40]. Substituting
in the same two equations, the Mach numbers given in Equation (
23) for DIASWs in Maxwellian anisotropic magnetized plasma in [
37] are recovered. For
and
, Equations (
38) and (
39) become equal to Equation (
22), which is the true acoustic phase speed of DIAWs. For
, Equation (
37) is satisfied. Also
Furthermore, Equation (
37) is justified only if
. In case of parallel propagation
= 1, both limits
and
coincide with each other; therefore, solitary waves do not exist. Also, in the proposed model, the results hold up in the long wavelength limit, as we have used the neutrality hypothesis. In the proposed model, to assess the effect of the related plasma parameters, i.e., superthermality
, dust concentration
, perpendicular ion
, parallel ion pressure
, and the obliqueness of propagation, using
on the soliton existence domain, the propagation characteristics of DIASWs are chosen as given in [
37,
40].
Figure 2 shows the variation in the upper and lower Mach numbers. The behavior of the Mach numbers relative to the dust grain concentration
has been investigated for varying superthermality parameter
while taking
>
(see
Figure 2a). The graph shows that
and
increase with an increase in
. The higher value of
, i.e., the dust grain concentration, corresponds to a decrease in the electron density, which means that solitary waves in an electron-depleted dusty plasma can appear with a higher
M value. It is worth mentioning that an enhancement in the boundary values of Mach numbers is seen when
gets increase.
Figure 2b depicts the Mach number variations with the superthermality of electrons
. We can observe that both
and
increase with the increase in
. This suggests that when an electron deviates from Maxwellian behavior, it results in the formation of solitary waves with a reduced speed. In other words, when an electron’s behavior does not conform to the Maxwellian distribution, which describes the equilibrium state of particles in a system, it leads to the emergence of solitary waves that propagate at a slower pace. It is also clear from the graph that with a particular value of
and varying the obliquity angle
increases while in
, no prominent variation occurs. Less obliqueness corresponds to higher value of
, which shows that the soliton existence regions shrink.
6. Parametric Analysis
Our focus now is to investigate the dynamical characteristics of obliquely propagating DIASWs by analyzing the effects of different plasma parameters. To achieve this, we will utilize the Sagdeev potential
described in Equation (
36). By studying the variations in plasma parameters, we aim to gain insights into how these factors influence the behavior and properties of obliquely propagating DIASWs. The relevant plasma parameters involve the dust concentration, the electron superthermality, the obliqueness of propagation, the magnetic field via
, the perpendicular ions, and the parallel ions pressure, which play a significant role in altering the characteristics of solitary structures. It is important to note that
truly predicts the shape of solitary pulses; the amplitude of a solitary pulse is determined by the value of its root (the point where the Sagdeev potential curve crosses the axis), while the depth of the Sagdeev potential, as expressed by Equation (
36), predicts the width of the solitary pulse. Therefore, it is required to assess how these parameters affect the dynamical behavior of DIASWs.
To observe the effect of the dust concentration
, the Sagdeev potential
variation is plotted in
Figure 3a. Considering three different values of
with fixed plasma parameters
,
,
,
,
and
. One can infer from
Figure 3a that the Sagdeev potential has two wells, one on the positive
-axis and the other on the negative
-axis showing the coexistence of double polarity dust ion acoustic (DIA) solitary structures (solitons). As
increases, the depth and root of the negative potential well decrease, while the depth of the positive counterpart decreases, and the root increases. The electrostatic potential obtained by the numerical integration of Equation (
36), and the electric field perturbation are plotted in
Figure 3b and
Figure 3c respectively.
Figure 3b shows the resulting solitons. It is seen that when the value of
rises, the compressive soliton’s amplitude rises, and its width decreases. Therefore, compressive solitons of larger amplitude are found, while the smaller amplitude rarefactive solitons are noted. It can be concluded that the effect of the increase in
is prominent on the amplitude of the negative potential DIA solitary structure as compared to the positive potential DIA solitary structure in a magnetized anisotropic dusty plasma. Thus, the dust concentration has a significant effect on the modification of solitary structures. The same effect is shown in [
44], where only negative potential DIA solitary structures were studied in magnetized superthermal dusty plasma without ion pressure anisotropy.
Sultana et al. [
43] have investigated the impact of superthermal electrons on the characteristics of nonlinear ion acoustic wave propagation in magnetized plasma. It has been shown by their research, that solitary waves are enhanced when
has its lowest value. Adnan et al. verified the same conclusions qualitatively. Based on those prior studies, we have looked into how dust and pressure anisotropy affect DIASWs’ propagation when superthermality is present. Our findings align with all the previously published research in the relevant limiting conditions [
40,
43,
44]. Keeping other plasma parameters constant, while considering
,
and
the plots of the Sagdeev potential and the electrostatic potential are depicted in
Figure 4.
Figure 4a shows that the depth and root of the Sagdeev potential well with positive polarity are amplified, while these same features are simultaneously decreases of the Sagdeev potential well with negative polarity. This leads to amplified compressive solitons along with rarefactive solitons having diminishing amplitude, as shown in
Figure 4b. The relevant electric field perturbation is also shown in
Figure 4c.
The properties of DIASWs are examined and studied in relation to the impact of the propagation direction’s, i.e., the obliqueness expressed as
is explored. In order to ensure the electrostatic approximation remains valid, it is essential to keep the obliqueness minimal, as stated in [
45].
Figure 5 illustrates the variations of the Sagdeev potential well, electrostatic potential and electric field perturbation as
is varied. We noticed that raising the value of
resulted in a decrease in the root and depth of both polarity potential pulses. Additionally, it is observed that both polarity DIASWs structures diminished in amplitude. The greater the obliqueness of the propagation, the more enhanced the amplitude of the solitary structures, and a decline in its steepness can be noted. As a result, we obtain the solitary excitation with an enhancement in the amplitude with obliqueness. This qualitative result is expected because increasing obliqueness, allows the Mach number
to decrease (see
Figure 2b); as a result, a given
M value transcends
even more, creating a pulse with a larger amplitude.
Figure 6 illustrates the investigation of the magnetic field effect using the different value of frequency ratio
. In this analysis, we plotted the Sagdeev potential
(
), the electrostatic potential, and the perturbation of the electric field, keeping the remaining dusty plasma parameters fixed. It is obvious from
Figure 6a that both the roots of Sagdeev potential are fixed if we increase the strength of the magnetic field (larger
). However, the depth of the polarity Sagdeev potential well increases. Hence, steeper and sharper compressive and rarefactive solitons are found (see
Figure 6b).
Figure 6c depicts the corresponding electric field perturbation. These results aligns with the earlier result of [
40], where the plasma model supported only compressive solitary waves.
Figure 7 illustrates how the properties of DIASWs are affected by ion pressure anisotropy. We have demonstrated the fluctuation in the Sagdeev potential using the fixed plasma parameters
,
,
,
,
,
and considering ion parallel pressure
,
and
. It is seen that the variation in
is very effective. The depth and root of both polarity wells diminish with rising values of
, and as a result, the corresponding DIASWs’ amplitude is suppressed. We think that the ion parallel pressure gives rise to dispersive effects, which tends to suppress the effects due to the non-linearity, thus leading to smaller amplitude DIA solitons as shown in
Figure 7b. However, only the width of compressive DIASWs rises under increase ion perpendicular pressure, as shown in
Figure 8, while the amplitude of both polarity DIASWs is not significantly affected. The same pressure effects are also shown in [
37,
40]. In
Figure 9, we show the curves for three different cases. In the first case, we chose
,
,
,
,
,
and
. In the second and third cases, respectively,
,
and
are taken into account. In the case of
(curve in blue), a compressive DIA soliton with smaller amplitude results, while for the same case, a large amplitude rarefactive DIA soliton develop. When
(curve in black), the plasma does not support any compressive DIA soliton; however, a rarefactive DIA soliton does develop. The amplitude of the counterpart of the compressive DIA soliton is less for
. Whereas for
(curve in pink) and
(curve in black) a rarefactive DIA soliton of larger amplitude is achieved. These plots shown in
Figure 9 indicate that change in
have a significant impact on the dynamical features of both positive and negative potential DIASWs in contrast to
variations. This analysis of the ion pressure effect agrees with the results provided in [
40] in the case when dust concentration is considered to be negligible.

 ,
, 