1. Introduction
In software engineering, testing is performed just before deployment. Many sets of inputs are created for testing, and software is tested with these inputs to see that the output is as desired. If not, the bugs are reported to the developer to correct the errors mentioned. But, while correcting errors, a new set of errors may be introduced. So, the testing needs to be conducted again. This approach of retesting is called a regression test. Re-exercising all test cases is impossible during regression tests, as it is a highly time-consuming task. In test case scenarios, white-box testing provides a clear version of test cases. The research developed a white-box testing approach that prioritizes, selects, and minimizes in the context of reusability under constraints in the scope of usability. Their approach is a boost to existing approaches [
1]. Instead, some of the test cases alone need to be selected, which will plausibly catch up with errors. The paper develops a test case selection methodology as a constrained search-based optimization task using requirements coverage as a fitness function to be maximized. They used binary-constrained particle swarm optimization as a base technique [
2]. The research work proposed an approach to select test cases in database applications. They designed classification tree models using a similarity base towards black-box testing. Also, a new set of test cases for modified code sections is to be included in the regression test. Moreover, the team lead subjectively decides the number of iterations in regression tests.
So, selecting test cases to catch significant errors with minimal time duration has become necessary for the software industries. And the major challenge in this approach is retaining the software’s quality. The research work proposed an approach to select test cases in database applications. They designed classification tree models using a similarity base towards black-box testing [
3]. The paper proposed a test case allocation method using fuzzy inference [
4]. The research article proposed a weighted attribute-based strategy by conducting more than one clustering iteration using weighted execution profiles [
5]. Therefore, uncovering more errors, especially the critical and showstopper errors with less time duration, is difficult. And this is the research topic of the current era. Researchers have devised techniques based on code. Such techniques are delayed and known to be the white-box approach to software testing. It considers the code flow during execution. The research proposed regression test selection using program dependence graphs for service-oriented workflow applications [
6]. The paper developed two selective regression testing methods to evaluate the effectiveness of the Rosenblum-Weyuker (RW) model for predicting cost-effectiveness [
7]. Also, the data flow across the different paths of code is considered. Such a transparent view of the coding gives clear visibility toward finding bugs and, hence the name. The literature depicts clearly that many researchers rely on design notations and models upon which test cases were generated. The formation of test cases is being achieved for finding bugs, whose backbone is sheer design models. Mirarab et al. [
8] proposed an approach forming an integer linear programming problem using two different coverage-based criteria to select a subset of test cases and then order them using a greedy algorithm to maximize the coverage. Fujiwara et al. [
9]. This approach neither relies on code nor depends on querulents. Hence, it sits amidst white-box and black-box approaches and is termed the grey-box approach in software tests. Yet another approach adopted by practitioners and researchers is generating test cases concerning functional and nonfunctional requirements. The code is completely blacked out as part of testing and hence named a black-box testing approach. Our approach is based on features of the software test in selecting test cases. These features are not picked from implicit or explicit requirements. Instead, these features are marked exclusively by software testers. So, the proposed test case selection methodology can be applied to any test approach such as black box, white box, or grey box. The skilled testers across various software building industries set the order of importance of these features.
Our contributions in this work:
- −
To introduce an inventive hybrid grey-box testing methodology that effectively combines white-box and black-box strategies.
- −
Develop a distinctive feature-based test case selection approach, emphasizing vital aspects of the software designated by proficient testers without reliance on explicit or implicit requirements.
- −
Develop pioneering quantum-based test case selection techniques, employing feature coverage concepts and rank-based coefficients to optimize the relationship between features and test cases.
The innovative hybrid grey-box testing methodology seamlessly integrates the strengths of both white-box and black-box testing strategies, optimizing the testing process for enhanced efficiency and thoroughness. The black-box testing reflects real-world usage scenarios and user perspectives, ensuring a comprehensive assessment of system behavior. By combining these approaches, our methodology leverages the advantages of white-box testing’s precision and black-box testing’s comprehensiveness, offering a holistic evaluation of the software’s functionality, security, and reliability. The innovative hybrid grey-box testing sustains the model’s stability, harmonizing white-box understanding and black-box versatility, ensuring a resilient and dependable performance across diverse conditions.
The distinctive feature-based approach prioritizes critical aspects of the software, identified and designated by proficient testers, bypassing the need for explicit or implicit requirements. Leveraging their expertise and insights, testers meticulously pinpoint significant features integral to the software’s functionality and user experience. This methodology advocates for a proactive testing strategy, ensuring that crucial functionalities and user interactions are thoroughly assessed, even without exhaustive requirements documentation. The distinctive feature-based test case selection approach, guided by proficient testers, fortifies the model’s stability without relying on explicit or implicit requirements, enhancing software robustness and reliability.
Innovate test case selection in quantum computing through groundbreaking methods using feature coverage principles and rank-based coefficients. By intricately optimizing the interplay between features and test cases, we aim to significantly enhance testing efficiency and accuracy and ultimately pave the way for more effective and reliable quantum computing systems, marking a significant leap in the realm of quantum technology. The pioneering quantum-based test case selection leverages feature coverage and rank-based coefficients, optimizing the feature-test case relationship, bolstering the model’s stability, and enhancing software reliability.
The stated order of importance over the features in our proposed work is the renowned, profound, and benchmarked order, which every tester practices while optimizing test cases. The research work-related features and test cases through rank-based coefficients. In the existing market, many other techniques prevail. In this paper, we have developed methods for test case selection based on the quantum of the feature coverage. Altogether, these proposed techniques help to improve software testing effectiveness. This selection process yields an optimal set of test cases, especially in regression tests.
The Scientific Novelty of the Research Work
The effective selection of test cases is crucial in software testing since it helps to reduce the time and effort needed for full testing while maintaining high standards. Software companies look for methods to speed up the testing process without sacrificing quality to meet this demand. This research focuses on implementing test case clustering utilizing ranking and similarity coefficients to find the most faults in a shorter time. The experimentation involves considering eleven distinct features to cluster the test cases, employing two methodologies. In the first methodology, clusters are formed based on covering specific features up to a certain percentage. This ranking methodology aids in selecting the test case clusters. The second methodology determines test case similarity using the eleven features, and fuzzy equivalences are derived through maxmin composition.
Novelty 1: This research pioneers an innovative approach to test case clustering using a unique combination of fuzzy rank-based clustering and similarity coefficients, allowing for efficient selection of test cases based on specific features and significantly accelerating regression testing without compromising quality.
Novelty 2: The experimentation in this study demonstrates the superiority of the proposed methodologies over existing approaches by utilizing eleven distinct features to cluster test cases, achieving higher fault detection rates in a shorter duration. This advancement offers a practical solution for software companies seeking enhanced testing efficiency.
The coming sections discuss related work, motivational examples, empirical evaluation and metrics, results and discussions, future work, and conclusions.
2. Literature Review
Introduced the “partial W” method, which provides a logical link between several finite state machine model test methods, providing general applicability in selecting test cases. Mansour et al. [
10] have compared five regression test selection algorithms: simulated annealing, reduction, slicing, data flow, and firewall algorithms. The criteria they used are the number of selected test cases, execution time, precision, inclusiveness, preprocessing requirements, maintenance, level of testing, and type of approach. Mansour et al. [
11] proposed three test selection methods. The first method is based on modification and its effects. The second method omits tests that do not cover modification. The third method reduces the number of test cases selected by omitting non-modification revealing tests from the initial suite. Lee et al. [
12] proposed a set covering problems using an enhanced zero-one optimal path set selection method to select test cases in structural programming. Graves et al. [
13] experimented to examine the relative costs and benefits of several regression test selection techniques. Rothermel et al. [
14] presented a framework for evaluating regression test selection techniques regarding inclusiveness, precision, efficiency, and generality. Erikrogstad et al. [
15] explored the cost and effectiveness of various approaches and their combination for regression testing of database applications using classification tree models of the input domain.
2.1. Various Test Cases and Methodologies
Zheng et al. [
16] developed a multi-objective evolutionary algorithm, evaluating classic greedy and non-dominated sorting genetic algorithms II. This technique provides a range of solutions with trade-offs between cost and coverage. Rafaqutkazmi et al. [
17] scrutinized 47 regression test case selection articles comprising seven cost measures, 13 coverage types, and five fault detection metrics. Gr Rothermel et al. [
18] developed an algorithm to select test cases based on the modified versions of the program using a control flow graph. Francisco et al. [
19] have devised a similarity technique to select test cases for the modified versions of the program based on state diagrams. Briand et al. [
20] scrutinized UML designs and devised a technique for test case selection based on their changes. Rapps et al. [
21] deployed input selection techniques based on the data flow chain across the program paths. Harrold et al. [
22] implemented a methodology for selecting test cases based on requirements coverage cardinality, reducing the test suite size. Raju et al. [
23] analyzed metrics in testing and chose test cases accordingly for regression tests. Wong et al. [
24] developed a hybrid technique for selecting test cases based on code coverage, fault classification, execution profiles, and program modifications. L Yu et al. [
25] devised classification models to classify test cases based on defect types they captured and dynamic programming to get optimal selection solutions. In a distributed cloud environment, employing multi-objective criteria is essential for efficient test case selection and prioritization. Balancing objectives like performance, resource utilization, and fault tolerance ensures comprehensive testing for optimal system reliability and functionality [
26]. This study focuses on the perceived impact of an offshore aquaculture area in southeastern Portugal, the Armona Pilot Production Aquaculture Area (APPAA). The infrastructure creation aimed to stimulate local employment opportunities in seafood production and improve finfish and shellfish production resilience [
27]. This research paper proposes an expert system based on a fuzzy logic model to analyze the dynamics of sustainable livestock production systems. The objective is to address the complexities and uncertainties inherent in livestock production while aiming for sustainable practices [
28,
29]. The literature survey in the test case selection domain is summarized in
Table 1.
2.2. Analysis of a Literature Work to Find the Strengths and Weaknesses in Research
This study’s key findings encompassed a thorough analysis of software testing methodologies, focusing on optimizing efficiency and effectiveness. The research emphasized detecting dependencies and implementing automation, which significantly enhanced test execution efficiency and reduced overall test execution time. Additionally, this study showcased the importance of a data-driven testing approach and a comprehensive algorithmic performance evaluation for regression testing. The predictive capability for test case selection and the efficient allocation of testing efforts were critical factors in achieving targeted scenario coverage and prioritized test selection. The utilization of UML, innovative test case allocation methods, and automated modification tracking were noted to contribute to an efficient testing process. Common strengths observed were the comprehensive regression test planning, balanced test objective fulfillment coverage, and a focus on database application specifics, ensuring a robust and optimized testing effort allocation. The integration of a quantitative analysis of test volume and efficient test suite minimization further highlighted the research’s commitment to precision and efficiency in testing practices.
The limitations encompass challenges in accurately detecting complex and dynamically changing dependencies, potential resource constraints affecting concurrent test executions for efficient test execution, and the complexity in achieving optimal efficiency for heterogeneous test suites, leading to enhanced test suite efficiency limitations. Reducing test execution time faces constraints due to application intricacies and the need to maintain comprehensive testing coverage, and analyzing size reduction, precision, and recall presents difficulty in finding the perfect balance between these aspects and handling diverse data sources for data-driven testing. Targeted scenario coverage encounters difficulty in identifying and covering all relevant and possible scenarios, while comprehensive algorithmic performance evaluation in regression testing may struggle to predict all impacted areas accurately. Predictive capability for selection and optimized testing effort allocation face uncertainties and potential inaccuracies in prediction and difficulty in accurately allocating efforts amidst evolving project priorities, respectively. Integration complexities challenge the effective utilization of UML, and achieving timely and prioritized test selection can be subjective and prone to biases. The effective utilization of criteria encounters challenges in adapting to changing requirements and potential conflicts in criteria. Quantitative analysis of test volume may face variability in effectiveness, and innovative test case allocation methods struggle with implementation complexities and justifying effectiveness. Efficient test suite minimization faces constraints in achieving significant efficiency gains for already optimized suites, and focusing on database application specifics may be limited by the difficulty in adapting the focus to diverse applications. Balancing test objective fulfillment coverage encounters subjectivity and challenges in satisfying all objectives simultaneously. Automated modification tracking and testing may be complex to fully automate tracking for rapidly changing software. Targeted test case coverage and efficient test case selection face challenges in achieving complete coverage and balancing efficiency with thoroughness, respectively.
3. Motivational Example
For the research work illustration, we have taken a training set which is shown in
Table 2. The training set available in
Table 2 contains 15 different real-time test cases. These test cases are a subset of the test suites for the online banking software system. Eleven different features were considered for this research work, as shown in
Table 2. The 11 different features are ordered in the training set in such a way that they signify the order of importance concerning testing. This order of importance among features is a gathered knowledge from the test experts of the industries, which they follow in
Table 2. The research work uses the proposed model SCARF-RT to identify the best cluster for software test case selection.
Here, in
Table 2, twelve test cases are considered, and eleven features are taken. If we want to test the test cases of the software, we have to consider the features of software applications. Here, the features are nonfunctional activities like Critical bugs, Requirements covered, Time, KLOC covered, Bugs detected, Length critical requirements covered, Customer priority, Fault proneness, Requirements volatility, and Implementation complexity. In the fuzzy, two important jargon are valued: one is linguistics, and another is intuitional-tics; mainly in linguistics, we measure everything as very low (VL), low (L), medium (M), high (H), and very high (VH), all these fuzzy terms are converted to intuitional-tics values from 1 to 5. In our scenario, very low-1, low-2, medium-3, high-4, and very high-5. In
Table 2, the test cases are available from 1 to 15. Each test case has features from C1 to C11 and is given linguistic scores like very low-1, low-2, and medium-3 for the corresponding symbols. Each test case has 11 parts to be tested. This is how
Table 2 was formulated.
In fuzzy, linguistic and intuitive values are offered. The linguistic words are very low (VL), low (L), medium (M), high (H), and very high (VH). Linguistic values are offered as very low-1, low-2, medium-3, high-4, and very high-5 to analyze words in decision support systems. Depending on the nature of the application, the values can be adjusted to a 5 or 10 scale.
Legends: C1—Critical bugs: This metric refers to the number of critical defects or issues discovered during testing. C2—Requirements covered: This metric measures how much the test cases cover the specified requirements. C3—Time: This metric evaluates the time to execute the test cases and measures the testing effort. C4—LOC (Lines of Code) covered: This metric determines the number of lines of code exercised or covered by the test cases. C5—Bugs detected: This metric tracks the total number of defects discovered during testing, including all severity levels. C6—Average word length: It evaluates the number of test steps, input data variations, or conditions covered by each test case. C7—Critical requirements covered: Similar to C2, this metric specifically focuses on critical needs and assesses the coverage of test cases related to those requirements. C8—Customer priority: This metric prioritizes test cases based on customer requirements and preferences. C9—Fault proneness: This metric aims to predict the likelihood of defects occurring in specific areas of the software based on past defect data.C10—Requirements volatility: Requirements volatility measures the frequency of changes to the software’s requirements during the testing process. C11—Implementation complexity: This metric assesses the complexity of the software implementation and its impact on testing efforts.
I considered the 11 features of my empirical study in my research study. These are critical aspects of my application. The various features for various applications may be considered and included. These 11 features produce excellent results with high precision, as seen in the tables.
In
Table 3, for every linguistic value, the corresponding intuitional-tics values of very low (VL)-1 and low (L)-2 like this, the scale values from 1 to 5 are substituted, respectively.
In
Table 4, the values zero and one are assigned with a threshold. If the numbers are 3 or above, we can supply 1; otherwise, we can provide 0.
Table 4 was created using the variables from
Table 3.
Table 5, row-wise total be taken for all the rows from TC1 to TC15. In the rows, 1’s are added as such. In
Table 6, the row-wise total will be arranged in the order called ranking. Through
Table 6, it is possible to understand the ideology.
Table 7, the column-wise total, and
Table 8, the columns arranged in descending order according to the total.
Table 9 shows the formation of a dense cluster. The reason behind using such a cluster denotes one famous ideology for the research work. In
Table 9, I drew out four dense clusters available in different colors. In the yellow color dense cluster features like C1, C2, C3, C4 and C9 is 100% needed for the test cases TC9, TC11, TC4, TC5 and TC10. Features like C8, C11, C5, C7 and C10 are 100% for the test cases TC9 and TC11 in the violet color clusters. Out of thirty 1’s, the red color cluster contains, there you can find only thirty-one 1’s are available, that is 88.57%, features like C1, C2, C3, C9, and C4 are needed for the test cases TC1, TC3, TC6, TC7, TC12, TC13 and TC15. Similarly, for the naive green color cluster. The above is the new ideology for the clustering method in test cases for software application development.
3.1. Methodology 1
The first approach for test case selection uses the rank order clustering methodology. The algorithm is given below:
Rank order clustering algorithm:
Step 1: Convert the ordinal values to cardinal values.
Step 2: Assign binary weight and determine the total weight for each row, say
where
m is the features,
i is the number of rows.
has a value between 1 and 5, depending on the matrix.
The binary number for test cases(n) and features(m) is denoted as . Where, is simply a matrix.
Step 3: Reorder the rows in the descending order of values.
Step 4: Assign binary weight and determine the total weight for each column, say .
The expression can be understood as follows:
where
n is the total number of test cases,
j is the number of columns.
Step 5: Reorder the columns in the descending order of values.
Step 6: Fix the threshold value.
Step 7: Cluster (CR) initialized with zero DataPoints.
Step 7.1: Mark DataPoint (DP) with value 1 as visited.
Step 7.2: Find NeighborsSet (NS) of the selected DataPoint (DP)
Step 7.3: If (NeighborsSet (NS) has more than three 1’s) AND If
(DataPoint (DP) is not yet part of any cluster (CR)).
Step 7.4: DataPoints (DP) selected according to the requirement.
Step 7.5: Add DataPoint (DP) to Cluster (CR).
Step 7.6: For each unvisited DataPoint in NeighborsSet, Perform from Step
Step 7.7: Else,
Step 7.8: Mark DataPoint as NoisePoint.
3.2. Initializing the Agent for the Proposed Algorithm
The next step is calculating the similarity or rank order between the data points.
The Rank Order Clustering algorithm agents represent the initial cluster centers or centroids. These agents need to be initialized to start the clustering process.
Once the agents are initialized, the algorithm proceeds with an iterative process to assign data points to clusters based on their similarity to the agents’ centroids.
After the clustering process converges, the quality of the resulting clusters is evaluated using appropriate metrics, such as within-cluster sum of squares or other domain-specific performance measures.
3.3. Algorithm 1. Rank Ordering and Clustering
The application of the above method for education is explained in
Table 2 as follows: The test problem in
Table 2 is prepared according to the number of connected values. The properties are listed in chronological order. These attributes are given coefficients of 2
0, 2
1, 2
2 … 2
m from right to left. The cost of training for each test is equal to the coefficient of behavior and income. Then, the tests are sorted by the number of values. In the next step, serial totals are calculated on a column-by-column basis for the test data set for the previous step’s results. These tests gave coefficients of 2
0, 2
1, 2
2 … 2
m from bottom to top. The training value for each attribute is multiplied by the coefficient of the relevant data to get the number. The product is then rearranged to the lower part of that price. In our method, the default position is 3. Therefore, more than three values are considered 1 and smaller values are considered 0.
Table 3 is converted to the binary matrix and groups are formed according to the written process. This process looks like this in
Table 4 for our training process: The table is clustered with intensities 1s using Algorithm 1. The following information can be taken into account from the table above: Factors 15, 12, and 5 when focusing on critical illness, needs, time, weak needs, failure proneness, cover LOC, complexity, and detection of errors when using functions such as complexity, 13, 9, 11 and 7, recovery can be selected with 100% confidence. When focusing on performance (e.g., critical illness, required coverage, and duration), test data including 3, 1, 6, 2, 14, 10, 4, and 8 can be selected for repeated measures with a confidence level of 83%. While focusing on performance (i.e., need for change, failure rate, and LOC of coverage), test takers 3, 1, 6, 2, 14, 10, 4, and 8 can be safely selected for repeated measures at the 75% level. When focusing on performance (i.e., using complexity, length, and customer importance), tests 3, 1, 6, and 2 can be selected for regression analysis with a confidence level of 75%. Chapter Consider weight to score.
Weights are 1, 2, 4, 16, etc., in the workshop from right to left and from bottom to top. Therefore,
Table 2 is the base table for collecting the series. The first step is to sort the training in the paragraph below. Then, count the rows line by line and sort them in the following order. The resulting matrix is then converted to a table containing only binary values. Binary conversion is conducted using the threshold of 3. Values greater than 3 will be converted to 1, and values less than 3 will be converted to 0. Because of this conversion, the results in
Table 3 are heavily positive with 1s. Dense 1s are grouped according to the algorithm to be grouped. A group of test cases contain a certain percentage of the characteristics identified in that group. Therefore, these tests can be selected from the set of test data available to validate specific functions. This is a technological know-how in case selection. This method is more useful in the selection of retrospective tests.
3.4. Methodology 2—Fuzzy-Based Similarity Coefficient-Based Clustering
In this methodology also, test cases along with the 11 different features are considered. These features are the same set of attributes that were used in Methodology 1. The inputs for this approach are purely binary values. These binary values are obtained by converting the matrix values ranging from 1 to 5 into binary values by keeping a threshold value. The values equal to or greater than the threshold value are 1, and the remaining are 0s. Hence, the test case values in
Table 3 are transformed into binary based on a threshold value of 3. So,
Table 3 is converted to
Table 5 as given below:
As a next step, the similarity among test cases concerning 11 features is found using the following formula:
where,
= number of common 1s in both rows i and j,
= number of 1s in row 1.
= number of 1s in row j.
For the values in
Table 10, the similarity coefficient values are found using the Formula (4). The similarity coefficient values for the training set values are formed in
Table 6, as given below.
The above fuzzy relation on a single universe TC is also a relation from TC to TC. This will become fuzzy equivalence when it satisfies the following three properties:
then
, where λ ≥ min [
,
,
] and
is the membership fuzzy relation.
In fuzzy set theory, a fuzzy relation is reflexive if every element of the set is related to itself with a degree of membership equal to 1. Mathematically, a fuzzy relation R on a fuzzy set F is reflexive if: This means that the membership degree of each element in F concerning itself is equal to 1. Reflexivity in the context of , implies that there is a strong correlation or similarity between two entities and . The software application’s capacitance conversion functionality for membership fuzzy (µF) to fuzzy (F) and vice versa has been tested and is functioning correctly. The application accurately converts values within the valid range and handles invalid input gracefully.
Where and are the membership degrees of the fuzzy relations between elements and and between elements and , respectively. Then, transitivity requires that λ ≥ min [, , ], indicating that the membership degree between and should be greater than or equal to the minimum of the membership degrees between and , and and .
The maxmin composition must be performed until the relation attains transitivity to transform the tolerance into an equivalence relation. The number of times the max–min compositions can be applied will be (n–), where n represents the number of elements in the relation.
The fuzzy relation in
Table 6 is the fuzzy tolerance relation. His should be converted into a fuzzy equivalence relation. The fuzzy equivalence relation has properties: reflexivity, symmetry, and transitivity. Already, the values in
Table 6 possess reflexivity and symmetry properties. To achieve transitivity, applying fuzzy maxmin composition is necessary. Hence, applying fuzzy maxmin compositions for achieving transitivity is performed, and the result is given below:
Clusters are formed with test cases having the same similarity scores. These clusters show the degree of strength in the relationship among test cases. As a result, it is enough to choose one test case per cluster as these are similar to a certain degree. And highly dissimilar test cases are ignored, as it establishes noise. Ultimately, a few test cases are not selected. The remaining selected cases yield coverage among all the 11 considered features, which serves the purpose. From
Table 8, the TC4 can be selected by ignoring the test cases TC5, TC6, TC7, TC9, TC10, TC11, TC12, TC13, TC14, and TC15 since they are equivalent. Hence, the test cases selected for a test suite at a 0.9 confidence level would be TC1, TC2, TC3, TC4, and TC8.
Similarly, test cases can be selected for a test suite at various confidence levels. The challenge of not compromising on quality is achieved because of equivalence classification. Another significance of this method is all 11 features are covered with the help of selected test cases.
3.5. Test Case Functionality for E-Commerce Application
Test Case Title: User Registration with Valid Data.
Test Case Description:
This test case verifies the functionality of the user registration process in the e-commerce application, specifically focusing on registering a new user with valid data. The objective is to ensure that the system accurately processes and accepts valid user input during registration.
Preconditions:
Test Steps:
Launch the e-commerce application.
Navigate to the registration page.
Enter valid user data in the registration form:
Full Name: enter a valid full name (e.g., John Doe).
Email Address: Enter a valid email address in the correct format (e.g., john.doe@example.com).
Password: enter a valid password that meets the specified criteria (e.g., at least 8 characters long with a mix of uppercase, lowercase, and numbers).
Confirm password: re-enter the same valid password to confirm.
Phone number: enter a valid phone number (e.g., 1234567890) in the correct format.
Address: enter a valid address (e.g., 1234 Street Name, City, State, Zip Code).
Click the “Register” or “Sign Up” button.
Verify that the system accepts the provided data and successfully registers the user.
Check for a confirmation message or email indicating successful registration.
Log in with the registered credentials to confirm successful registration.
Expected Result:
The system should accept the valid user data in the registration form and successfully register the user. A confirmation message or email should be received, and the user should be able to log in using the registered credentials.
Pass/Fail Criteria:
- −
Pass: the system accepts the valid data, registers the user successfully, and provides confirmation of the registration.
- −
Fail: the system does not accept the valid data or encounters errors during the registration process, preventing successful registration.
A crucial aspect of creating effective test cases is to include all essential information required for successful execution. For instance, when verifying the login functionality on a website, the test case must encompass both the login and password details. Without these credentials, the test case would be insufficient and unable to achieve the desired testing objectives. In summary, comprehensive and accurate information within each test case is pivotal for their effectiveness and ensuring the intended testing goals are met, in this case, authenticating login functionality on the site.
3.6. Test Case for E-Commerce Application
Test Case Identifier: TC_ECOM_001.
Title: Adding a Product to the Cart.
Description: Verify the functionality of adding a product to the cart in the e-commerce application.
Preconditions:
User is registered and logged in.
The application is accessible and properly functioning.
Steps:
Open the e-commerce application.
Log in with valid credentials.
Browse the product catalog and select a product to add to the cart.
Click on the product to view its details.
Locate the “Add to Cart” button and click on it.
Verify the product is added to the cart.
Expected Outcome:
The application successfully adds the selected product to the cart.
The cart displays the product added with the correct details and quantity.
In an effective test case, certain elements should be avoided to ensure clarity and accuracy. Firstly, dependencies on other test cases should be minimized, as each test case should be standalone to facilitate easy execution and interpretation. Secondly, unclear formulation of steps or expected results hamper the test’s purpose and effectiveness, making it essential to maintain clear and precise instructions. Thirdly, including all necessary information is crucial for a test case to be passable and meaningful. Lastly, excessive detail should be avoided to maintain focus and relevance, ensuring that the test case remains concise and to the point, enhancing efficiency in testing processes. These principles promote well-structured and effective test cases that contribute to robust software testing practices.
5. Results and Discussion
The experiments were performed rigorously with the available test cases mentioned in
Table 4. The results of the experimental study are detailed in
Table 4. As per the results available in
Table 4, selected test cases cover the same number of defects. The cosine similarity coefficient is a measure of similarity between two non-zero vectors defined in an inner product space. Cosine similarity is its low complexity, especially for sparse vectors, where only the non-zero coordinates must be considered. Hence, the quality is not at all compromised. In
Table 10, similarity has been calculated using cosine similarity measures. TC1 is compared with TC1. It is one. TC1 with TC2, TC1 with TC3, TC1 with TC4 and so on up to TC1 with TC15. The same other rows are compared to these results, and they exhibited the same in
Table 10. A value of 1 represents high similarity, and 0.9, 0.8, and 0.6 represent 90%, 80%, and 60%, respectively.
In
Table 11, 1.0 value of test cases are clustered, 0.9 value of test cases are clustered, 0.8 value of test cases are clustered, and 0.0 value of test cases are clustered as such. Herewith, it represents some of the test cases that are 100% required, 90%, 80%, and 60% required according to the need of the software applications development. In
Table 12, software packages are taken from different domains, and the corresponding attributed values are measured and the same in the table. In
Table 13, results, methodologies, and measures are shown.
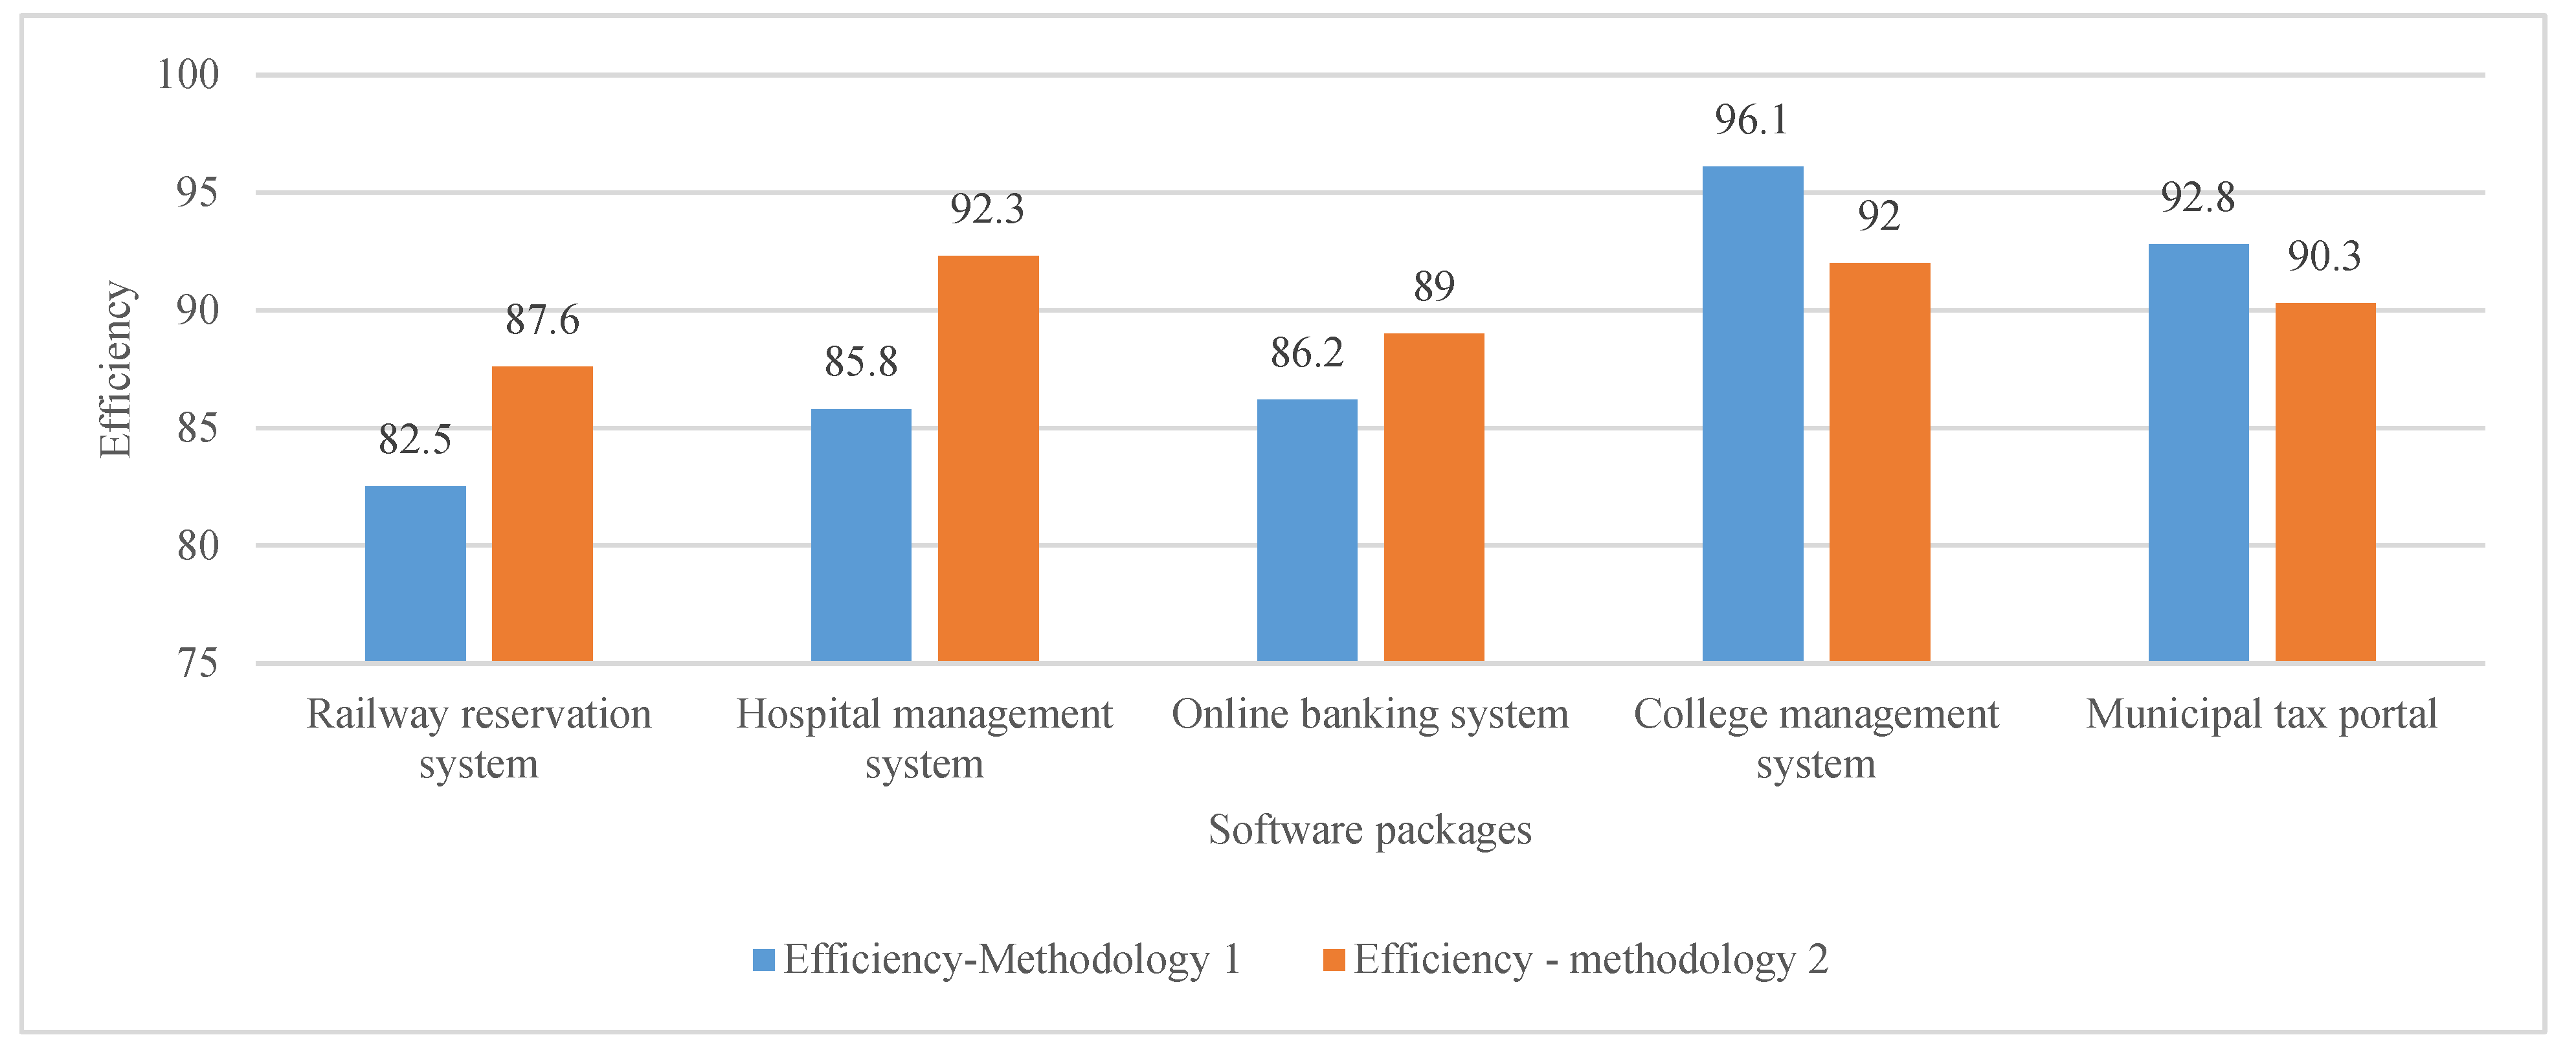
Through the second methodology, similarity index and fuzzy inference, the research noticed one good idea: to understand the amount of test case percentage needed to test the software application’s real motive. In
Figure 1, an efficiency chart shows the software application’s real efficiency after being deployed into the testing. Everything has been calculated using Methodology 1 and Methodology 2. In
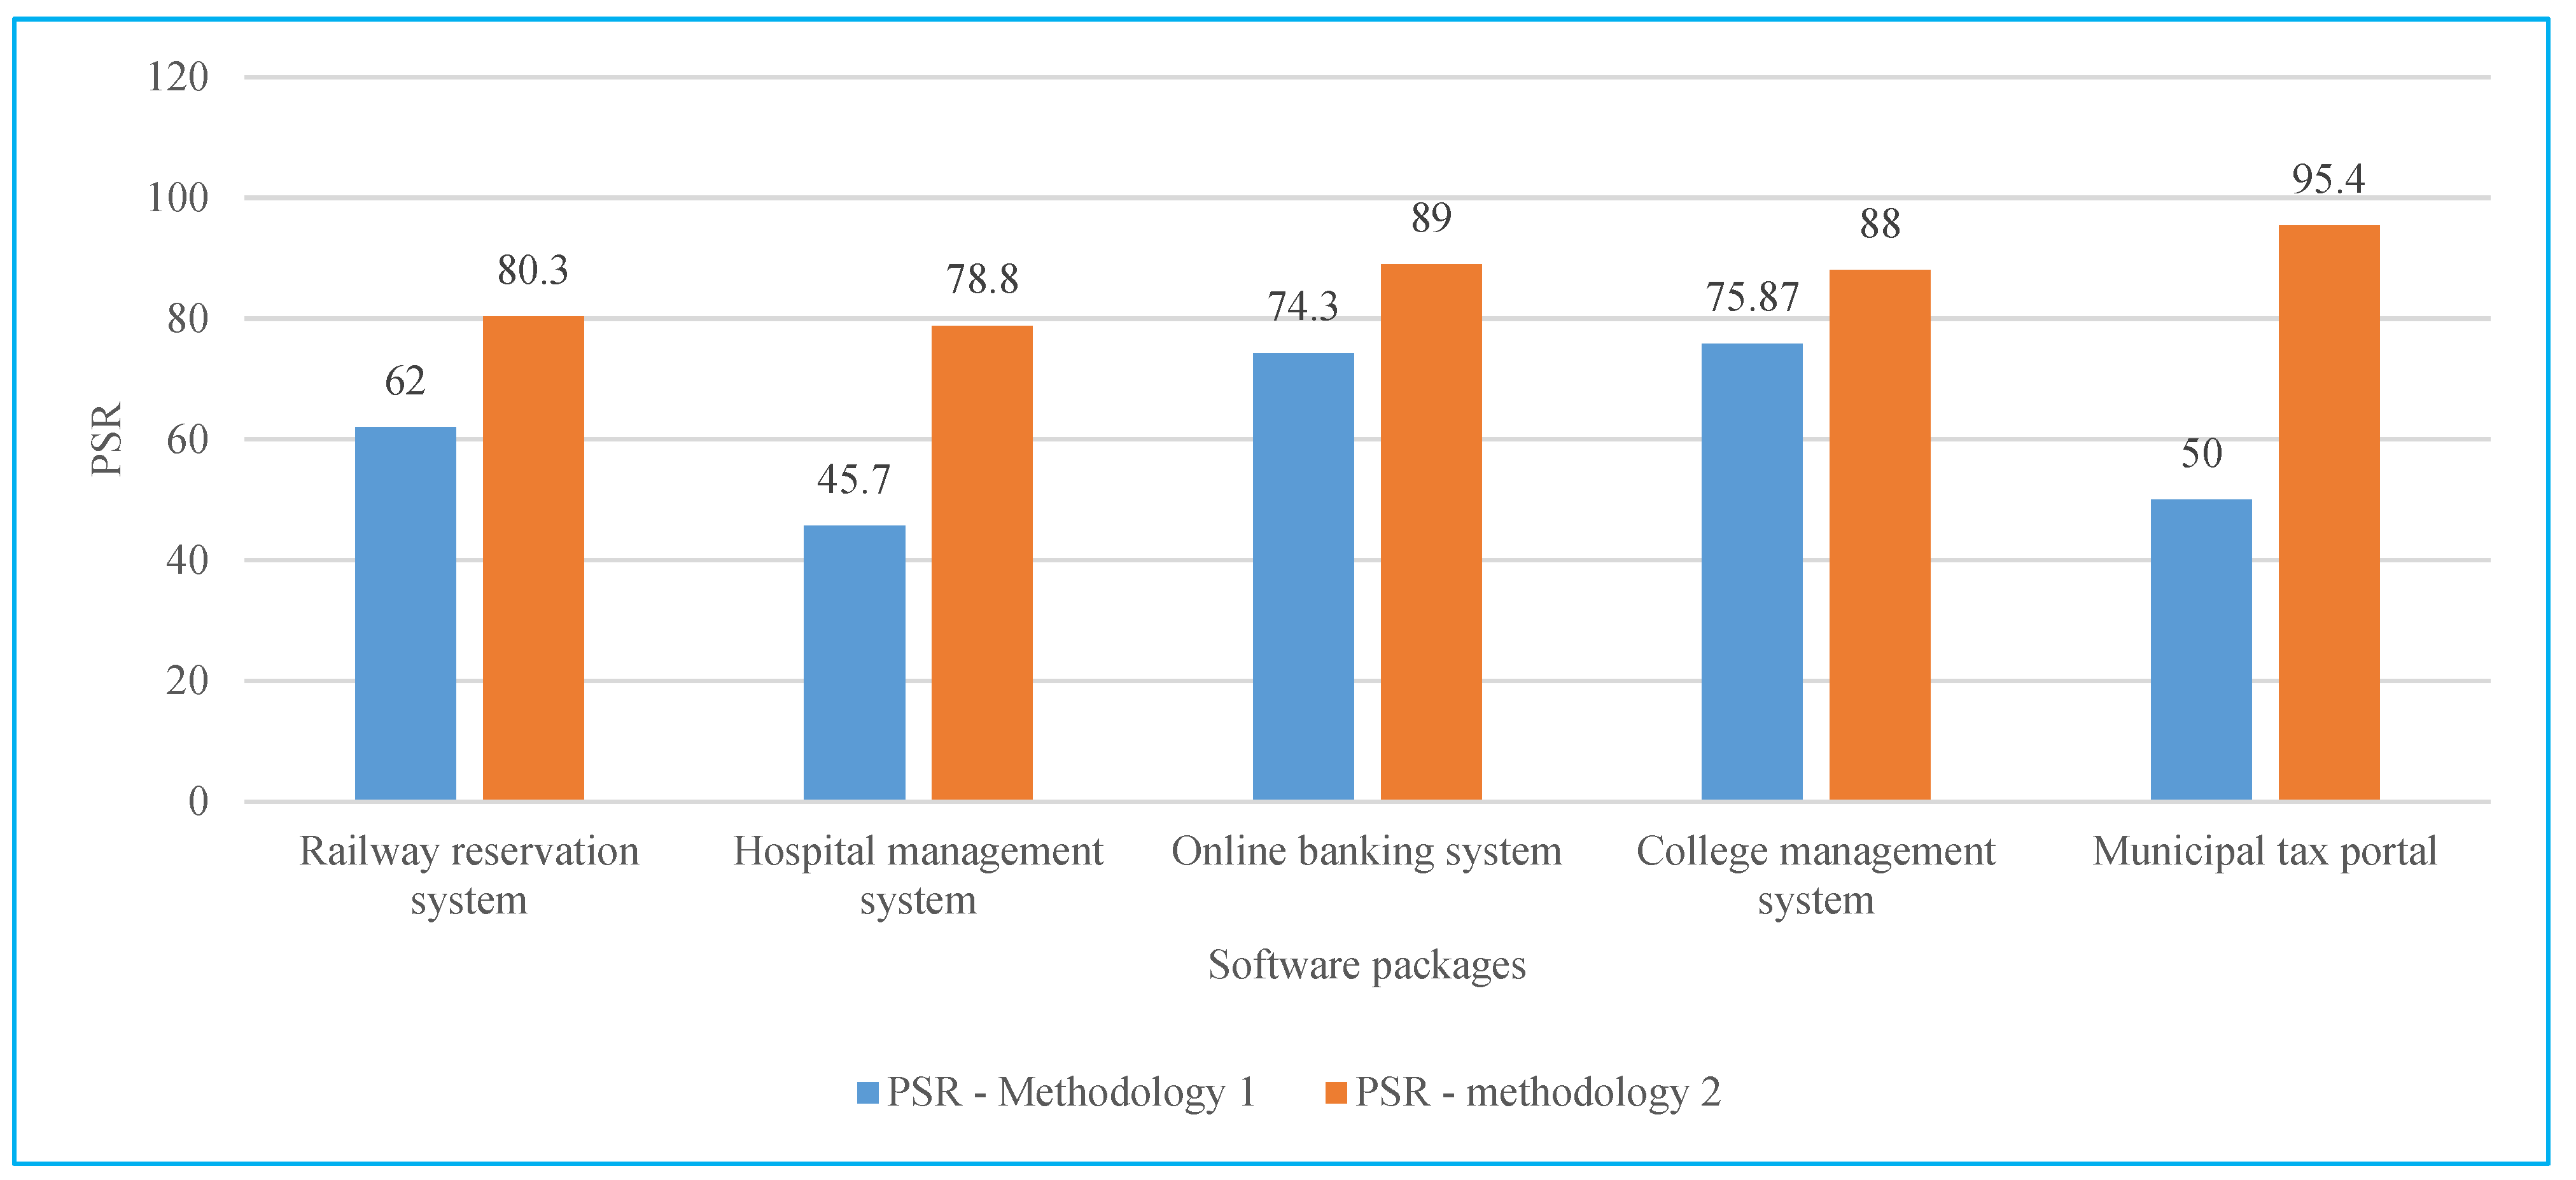
Figure 2, the percentage of selection reduced chart was deployed using PSR (percentage of selection reduced) methods 1 and 2 using Equations (8) and (9).
Figure 1.
Efficiency chart.
Figure 1.
Efficiency chart.
Figure 2.
Percentage of selection reduced chart.
Figure 2.
Percentage of selection reduced chart.
Table 12 evaluates the values as per the mathematical equations of (10) and (11). All the results have been found through the Python implementations. The fuzzy similarity index and Lambda cut have been used to overcome the issue of testing time optimization, as shown in
Table 2,
Table 3,
Table 4,
Table 5,
Table 6,
Table 7,
Table 8,
Table 9,
Table 10 and
Table 11. The undefined similarity index is a technique used for approximate string matching and is valuable for various data science tasks. On the other hand, “Lambda Cut” appears to be a concept related to fuzzy logic.
In the first methodology, test cases are selected for the attributes being focused. Whereas in the second methodology, all the considered attributes are covered. Also, the second methodology gives a higher reduction percentage among test cases. Both methodologies were found to be highly efficient in fault detection and reduction in test cases. Moreover, both methodologies have considered 11 attributes that were never used in the earlier research. Hence, regarding attribute coverage, efficiency, and percentage of selection reduced in test cases, the methods implemented have proved to be highly successful in selecting regression test cases.
In
Table 13, all the measurements are taken according to the mathematical formula exhibited for reference by Equations (7) and (12).
In
Table 14, the e-commerce application, each test case includes a test case ID, description, input data, expected outcome, and potential reductions in time, cost, and complexity. These reductions are hypothetical and should be based on a detailed analysis and evaluation of the application and the testing process.
The acronym PSR represents “Priority to Severity Ratio”, a notable metric employed within software testing. This metric is pivotal in establishing the optimal sequence for addressing defects or issues encountered during testing phases. Its chief utility is enabling teams to allocate their resources judiciously, considering two vital aspects: the severity of a particular defect and its corresponding priority. The underlying formula used to compute the PSR value is articulated as follows:
Analysis of the Result
The research study results provide useful results for improving error detection in a short time. Applying competitive analysis using the ranking and similarity coefficient can improve the method’s performance. The results from the experiment show that there has been a significant improvement in the detection of errors, and thus, the testing process has been improved. This advancement is essential for software development, where time and resources are limited to optimize test suites. An integrated grey-box testing approach allows software developers to simplify testing while providing comprehensive coverage. As other studies in this area have shown, empirical results are based on the necessity of selection to obtain good results and the importance of empirical problems in the sources. Sorting is ordering data points according to a particular measure or measure. In production process analysis, sort clustering is an algorithm for classifying machines according to their needs for different products. The steps involved in the group analysis are as follows: For each row (item), calculate the number representing the activity of each machine.
Select the following line as the count number.
For each column (machine), calculate the number representing the product that needs to be processed on that machine.
Check the columns in order by the number of numbers.
If there is no change in steps 2 and 4, stop; otherwise, repeat the process.
The final result is the ranking of machines according to their importance in processing different products.
Clustering or cluster analysis is a method for grouping data points based on their similarities.
In traditional integration, data points are assigned to different groups, and each data points to only one group. Clusters can be defined using different metrics such as distance, connectivity, and power. The aim is to maximize similarity within the group while minimizing similarity between different groups. Fuzzy clustering or soft k-means is a form of clustering where each data point can belong to more than one cluster. Unlike traditional clustering, where clustering of data points is difficult, fuzzy clustering assigns membership levels to data points and indicates how often each group belongs. The fuzzy C-means (FCM) algorithm is a widely used fuzzy clustering algorithm. It involves assigning coefficients to each group’s data points, calculating each group’s centroid, and re-adjusting the membership coefficients until they converge. Lambda Slice is a fundamental technique that turns fuzzy membership into an intelligent classification. It helps to convert fuzzy members in binary assignments. Choosing an appropriate lambda value means assigning data points with membership levels higher than the threshold to a particular group. Instead, those below the threshold are not included in the group.
Research in bioinformatics has also explored the use of fuzzy-based clustering techniques to combine multivariate data. Based on fuzzy logic, fuzzy equivalence relations, and fuzzy similarity of Łukasiewicz values, the FH-Clust method has been proposed to identify subsets of patients from different omics data such as gene expression, miRNA expression, and methylation. This approach focuses on integrating patient data from multiple omics sites using a consensus matrix as analysis of single omics data ultimately leads to better results and greater clinical relevance. In
Table 14, comparative analysis is an essential part of software testing. It involves comparing the actual output of a program or system with the expected output to ensure that it functions correctly.
Table 15, the proposed model, utilizing a measure of closeness, predictive modeling, and handling imprecise data, excels in quantifying resemblance and predicting outcomes based on variables. Unlike traditional models, it effectively navigates data scale challenges and offers superior predictive capabilities, making it an innovative and versatile choice for diverse applications.


 ,
, 

