Article

Improved Gorilla Troops Optimizer-Based Fuzzy PD-(1+PI) Controller for Frequency Regulation of Smart Grid under Symmetry and Cyber Attacks

by
Rajivgandhi Pachaiyappan
1,*,
Elankurisil Arasan
1 and
Kannan Chandrasekaran
2
1
Department of Electrical and Electronics Engineering, Adhiparasakthi Engineering College, Melmaruvathur 60319, India
2
Department of Electrical and Electronics Engineering, Arunai Engineering College, Tiruvannamalai 606603, India
*
Author to whom correspondence should be addressed.
Symmetry 2023, 15(11), 2013; https://doi.org/10.3390/sym15112013
Submission received: 29 September 2023 / Revised: 21 October 2023 / Accepted: 26 October 2023 / Published: 2 November 2023
(This article belongs to the Section Engineering and Materials)

Abstract

:
In a smart grid (SG) system with load uncertainties and the integration of variable solar and wind energies, an effective frequency control strategy is necessary for generation and load balancing. Cyberattacks are emerging threats, and SG systems are typical cyber-attack targets. This work suggests an improved gorilla troops optimizer (iGTO)-based fuzzy PD-(1+PI) (FPD-(1+PI)) structure for the frequency control of an SG system. The SG contains a diesel engine generator (DEG), renewable sources like wind turbine generators(WTGs), solar photovoltaic (PV), and storage elements such as flywheel energy storage systems (FESSs) and battery energy storage systems (BESSs) in conjunction with electric vehicles (EVs). Initially, the dominance of the projected iGTO over the gorilla troops optimizer (GTO) and some recently suggested optimization algorithms are demonstrated by considering benchmark test functions. In the next step, a traditional PID controller is used, and the efficacy of the GTO method is compared with that of the GTO, particle swarm optimization (PSO), and genetic algorithm (GA) methods. In the next stage, the superiority of the proposed FPD-(1+PI) structure over fuzzy PID (FPID) and PID structures is demonstrated under various symmetry operating conditions as well as under different cyberattacks, leading to a denial of service (DoS) and delay in signal transmission.

1. Introduction

Environmental pollution due to the usage of fossil fuels in generating stations has motivated researchers to focus on alternative sources like renewable energy. As an alternative, a concept called smart grid (SG) was recently proposed, which provides better performance when combining distributed generation sources [1,2]. RESs exhibit frequency regulation problems, which result in the net inertia reduction in the SG system [3]. Due to the variations in RESs and load, the unbalancing of power occurs, which may lead to frequency instability, thereby hindering SG system consistency and stability [4].
To overcome the issues regarding the frequency stability due to the high-level integration of RESs into the existing grid, recently published articles have suggested novel control approaches [5,6]. One approach with exhaustive power management integrates hybrid storage elements for voltage control and energy management during the on/off-grid mode operation of an active distributed system [7]. In [8], the supportive control approach for interconnected SG systems involves effective voltage/frequency regulation and power-sharing. Due to load fluctuations, the intermittent operational events that occur in system performance can be stabilized via the integration of centralized observer-controlled electric vehicles [9]. A cascade PD-(1+I) controller was proposed for the frequency analysis of an SG system using various energy storage devices [10]. An equilibrium-optimization-based fuzzy type-2 controller was proposed in [11] for frequency regulation. An adaptive control strategy was developed for frequency regulation via modulating micro turbines and power when photovoltaic sources are integrated into an SG [12]. The operating cost and system efficiency can be improved by the smart management of various distributed sources of an SG system [13]. The impact of rapid-acting ESDs in an SG system for improved frequency regulation was described in [14]. Many advanced controllers, such as modified equilibrium optimization tune multistage PID, have been proposed for frequency control schemes [15]. The effect of wind power was also analyzed in a frequency-control study [16]. A hybrid power system with more than one source was developed with a tilted PID for the regulation of frequency control issues [17]. The grasshopper-optimization-algorithm-based multistage PDF+(1+PI) structure for frequency control was proposed in [18]. The effect of different energy storage devices with a cascade controller structure on the frequency stability was studied in [19].
It can be seen from the literature that many theoretical and practical schemes and computationally intelligent methods for frequency control have been developed, mainly focusing on the attenuation of physical disturbances. Nevertheless, when cyber intrusions occur, disturbances begin to dramatically take cyber–physical forms, and the disorder can even cause cascading failures of existing schemes [20]. Therefore, it is essential to take cyber attacks into consideration and analyze the designed controller under various types of cyber attack. Denial of service is a type of cyber attack that needs serious attention so that the reliability and frequency stability of an SG can be maintained. This paper presents the design and analysis of a frequency-tolerant controller that can overcome data transmission delays when data are transmitted through an unreliable communication channel and can work effectively under denial of service of the signals to the distributed energy resources.
Novel optimization methods have been employed in modified controller structure frequency regulation schemes [21,22,23,24]. A modified sine cosine algorithm (SCA)-based PID for the frequency control of an SG was proposed in [25]. In [26], a PDF-PI controller optimized via coyote optimization was proposed for the frequency regulation of a power system. A may fly optimization (MFO)-optimized fuzzy PD-(1+I) controller was suggested for microgrid frequency control in [27].Atom search optimization (ASO)- and gray wolf optimization (GWO)-tuned fractional-ordered PID controllers have been recommended for the frequency control of a hybrid power system [28,29].A Salp swarm algorithm (SSA)-optimized fuzzy PID (FPID) controller was proposed in [30] to regulate the frequency of a realistic power system with a redox flow battery.
A review of the literature shows that numerous schemes with different control and optimizing methods have been suggested for the frequency control of different systems. But no specific approach gives suitable outcomes for all systems. Thus, this provides the opportunity to explore another scheme by developing anew controller structure and an improved optimization technique for creating a better frequency control scheme. The gorilla troops optimizer (GTO) is a newly developed optimization method inspired by gorilla troops’ collective aptitude in nature [31]. The dominance of GTO over the gravitational search algorithm (GSA), GWO, MFO, multiverse optimizer (MVO), PSO, SCA, whale optimization algorithm (WOA), and tunicate swarm algorithm (TSA) has been demonstrated using benchmark test functions [31]. Although GTO has exhibited encouraging results in resolving different real-world problems, it can become trapped in local minima with early convergence. This paper proposes improved GTO (iGTO) employing a scaling factor and other variations to attain an improved equilibrium among the exploration and exploitation phases of the GTO method.
The main contributions in this research work are summarized as follows:
  • An improved adaptation of GTO, i.e., iGTO, was developed by changing some parameters of the GTO algorithm and introducing sine-cosine-based scaling factors to control the movement of gorillas during the search procedure.
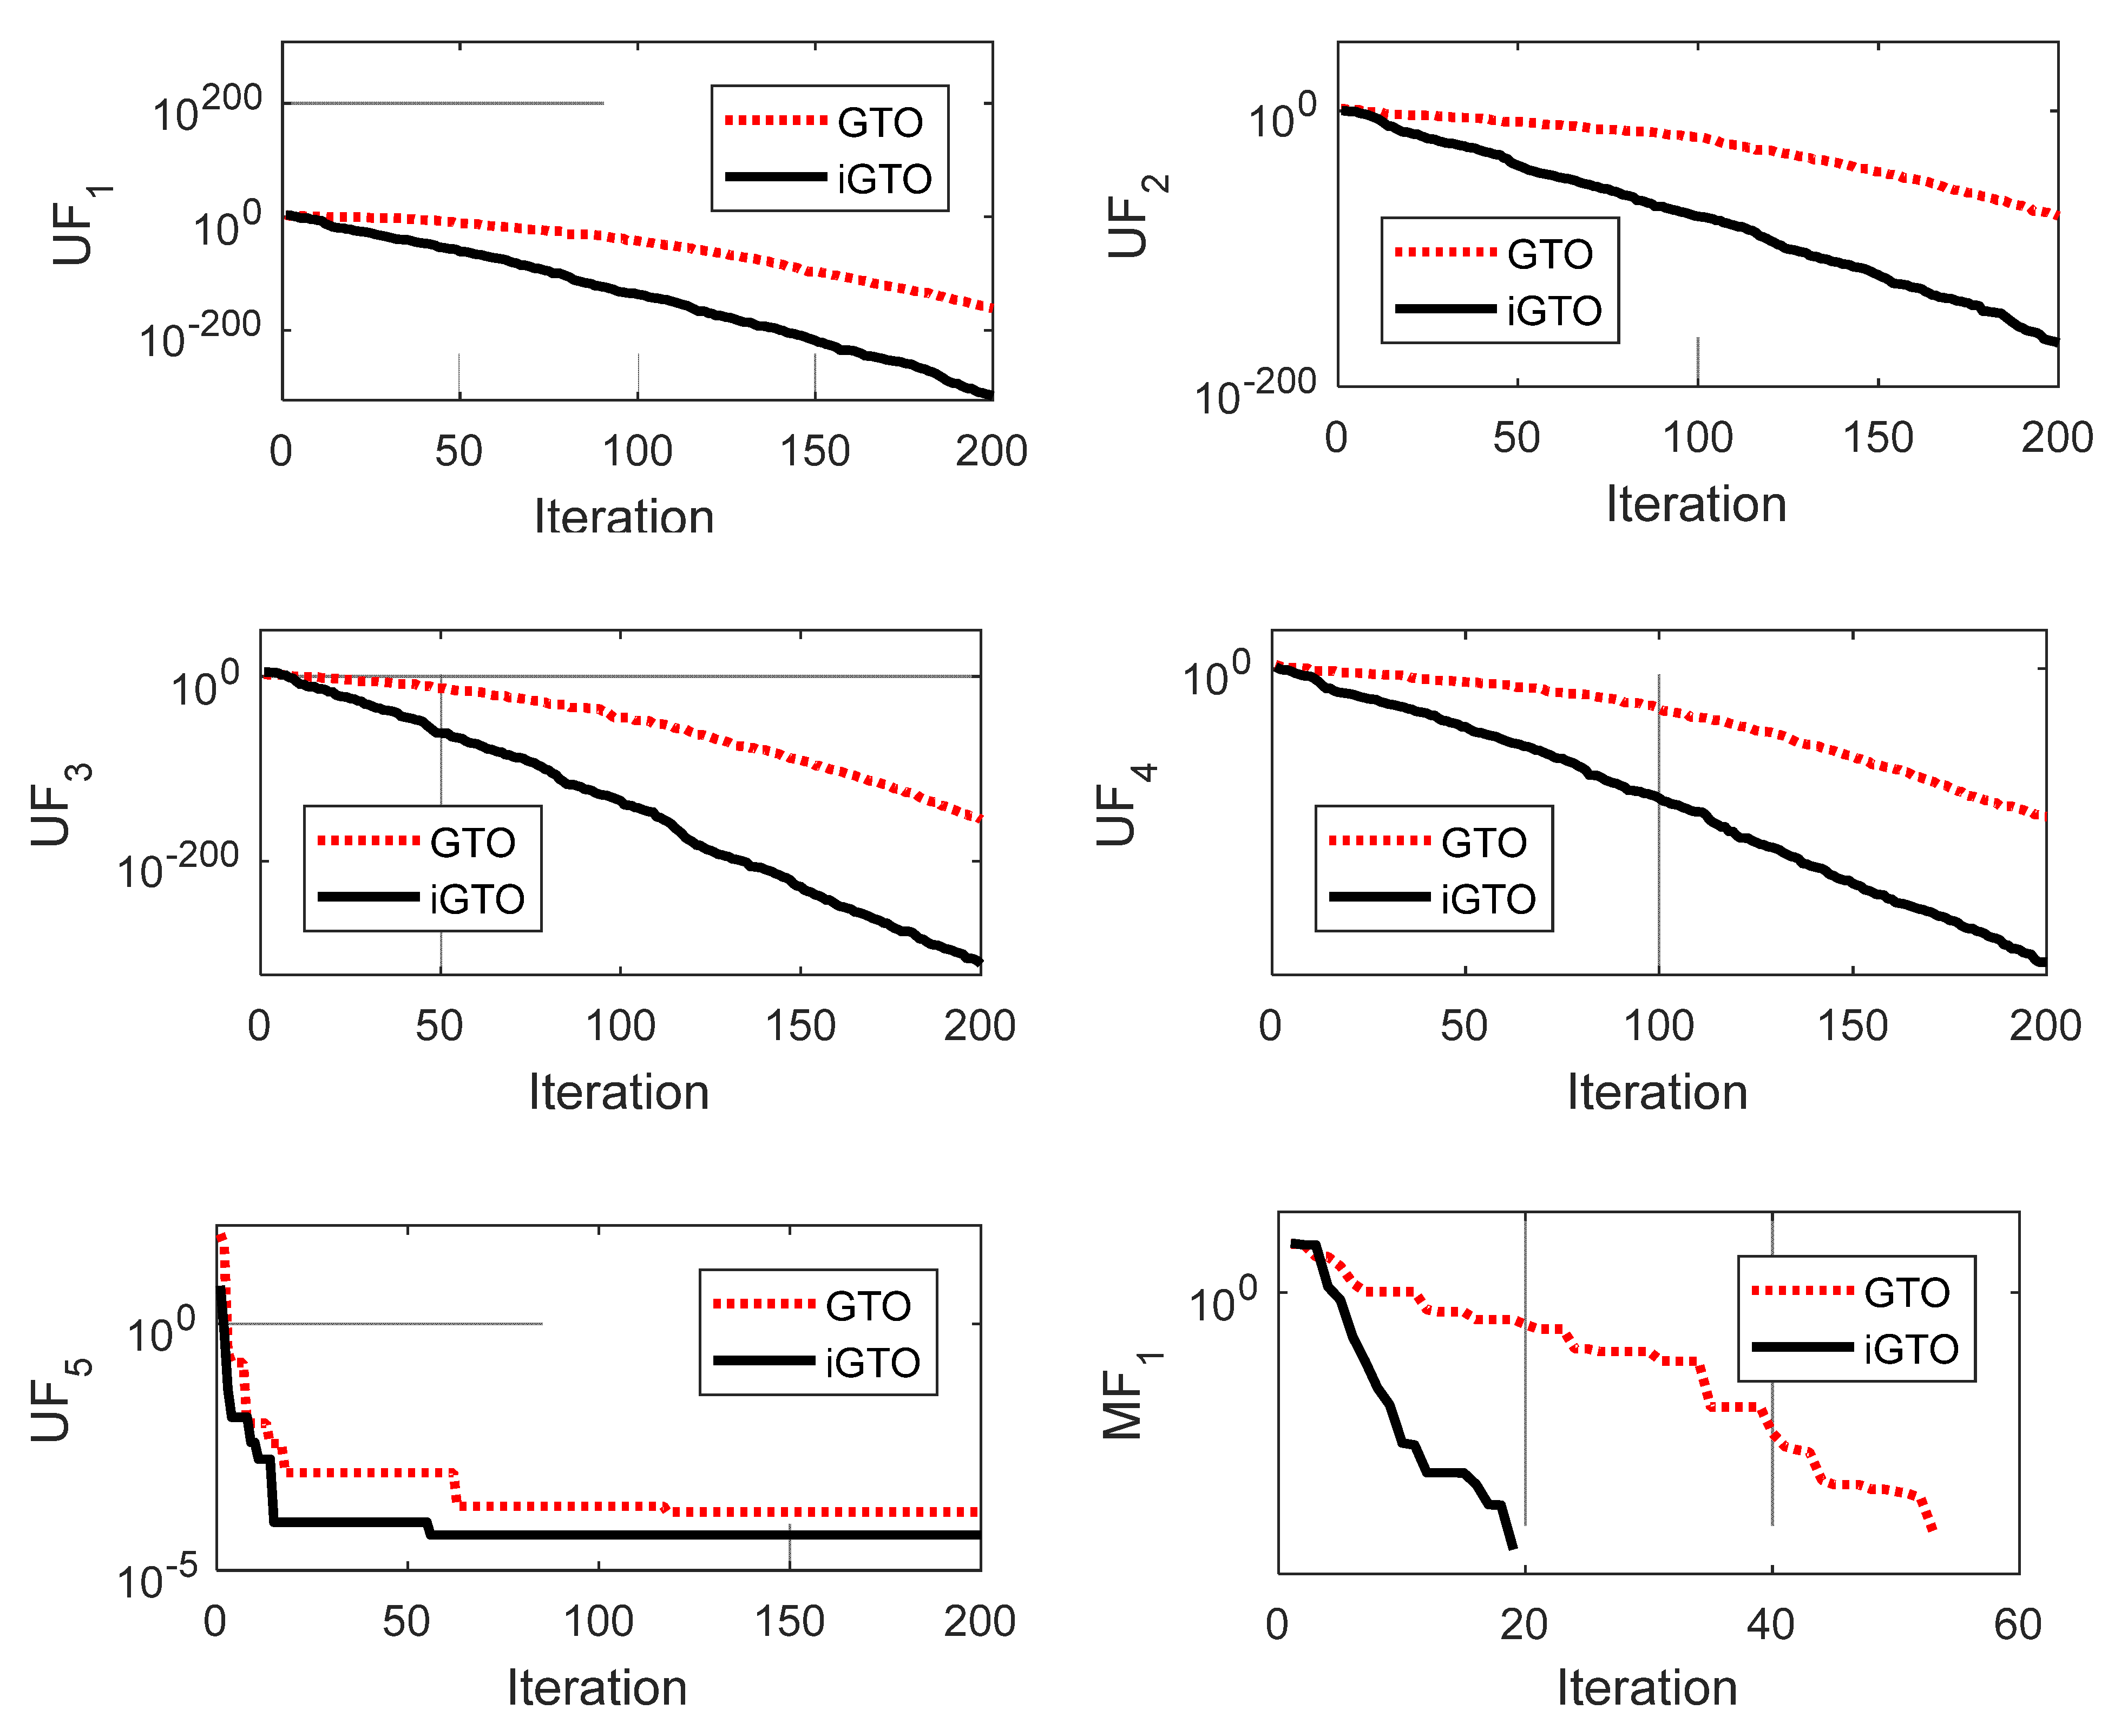
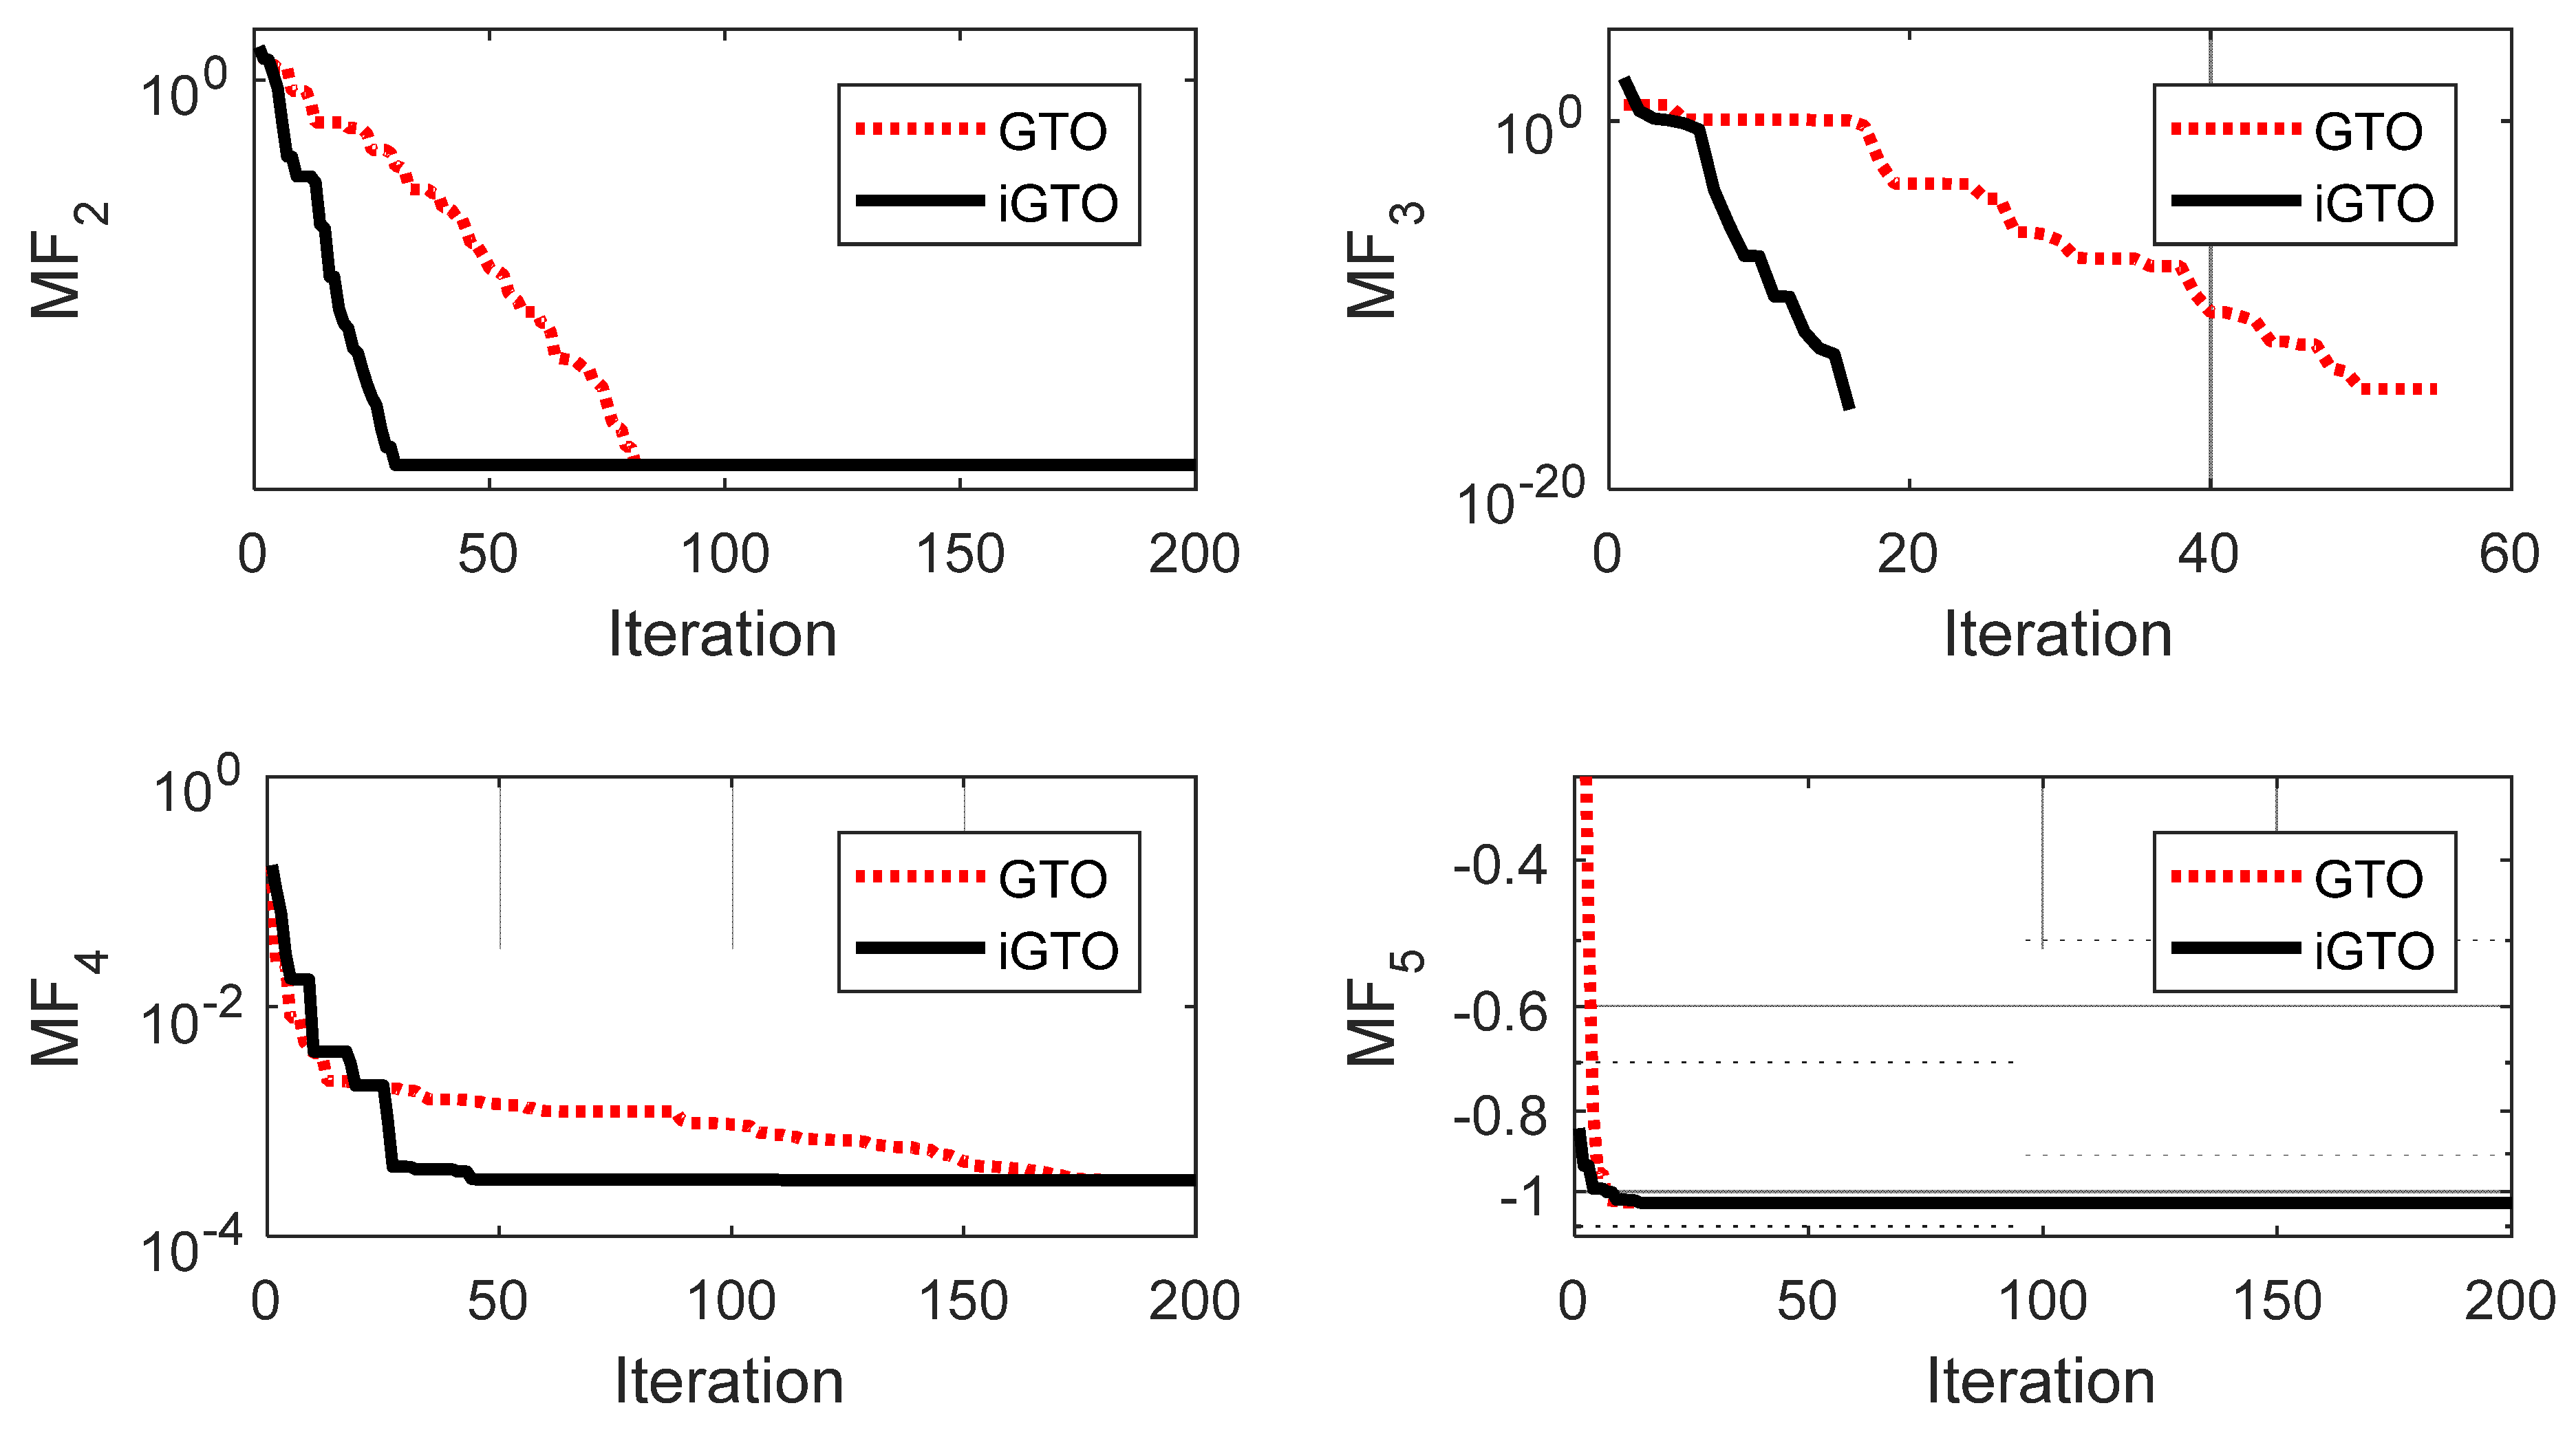
  • The effectiveness of iGTO is verified over GTO, GJO, GWO, GSA, PSO, TLBO and ALO techniques using numerous benchmark functions.
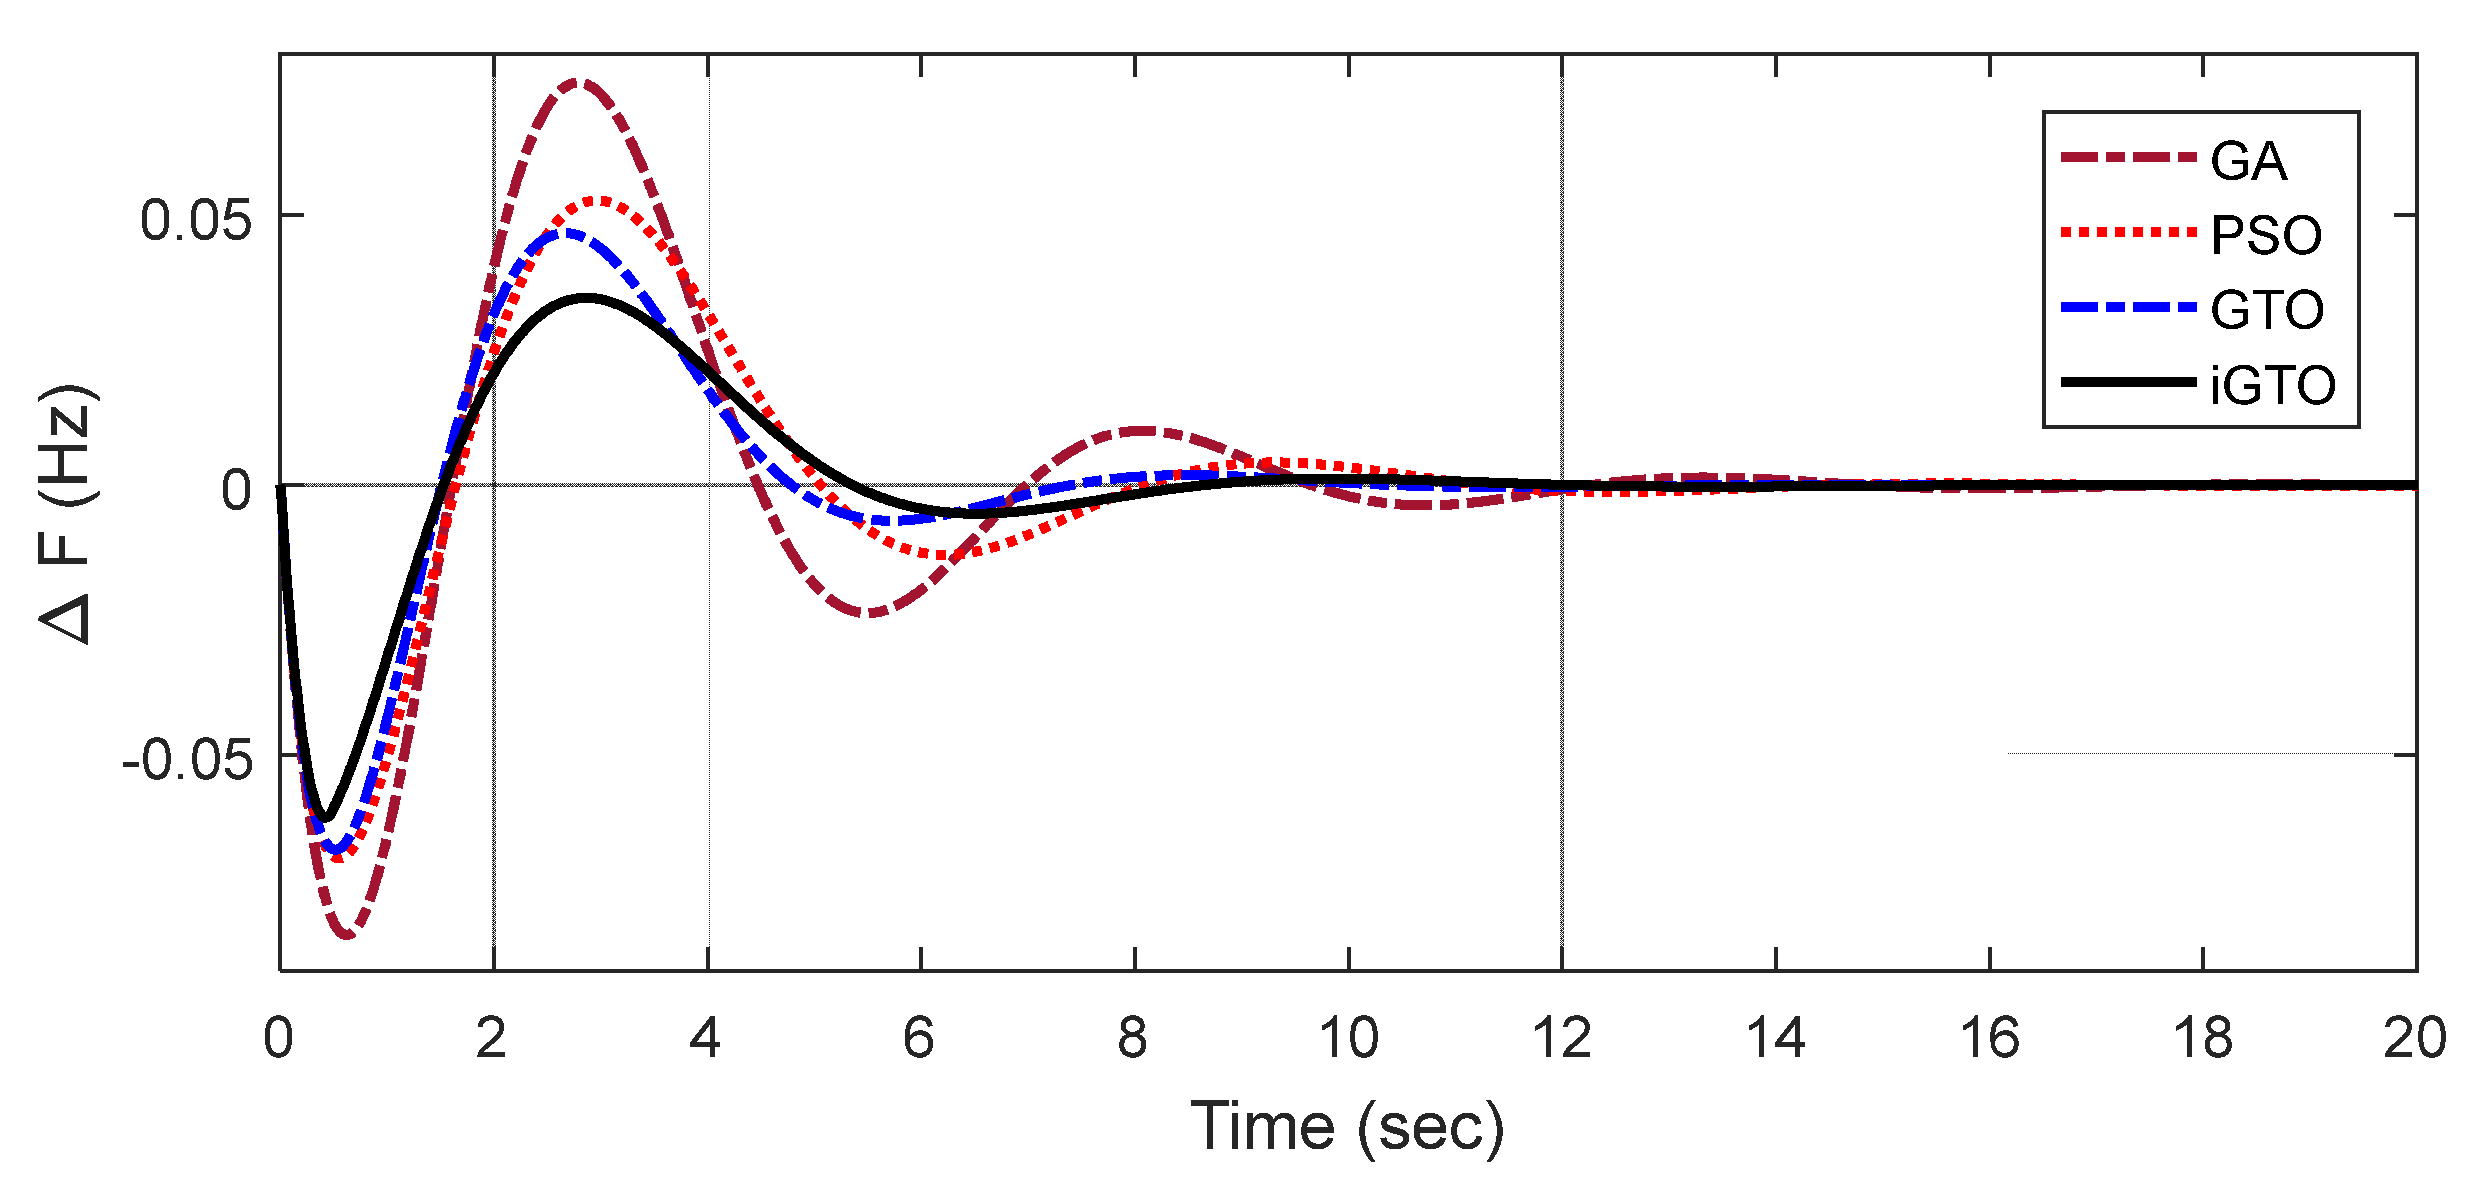
  • The effectiveness of iGTO in engineering problems is also demonstrated over GTO, PSO and Genetic Algorithm (GA).
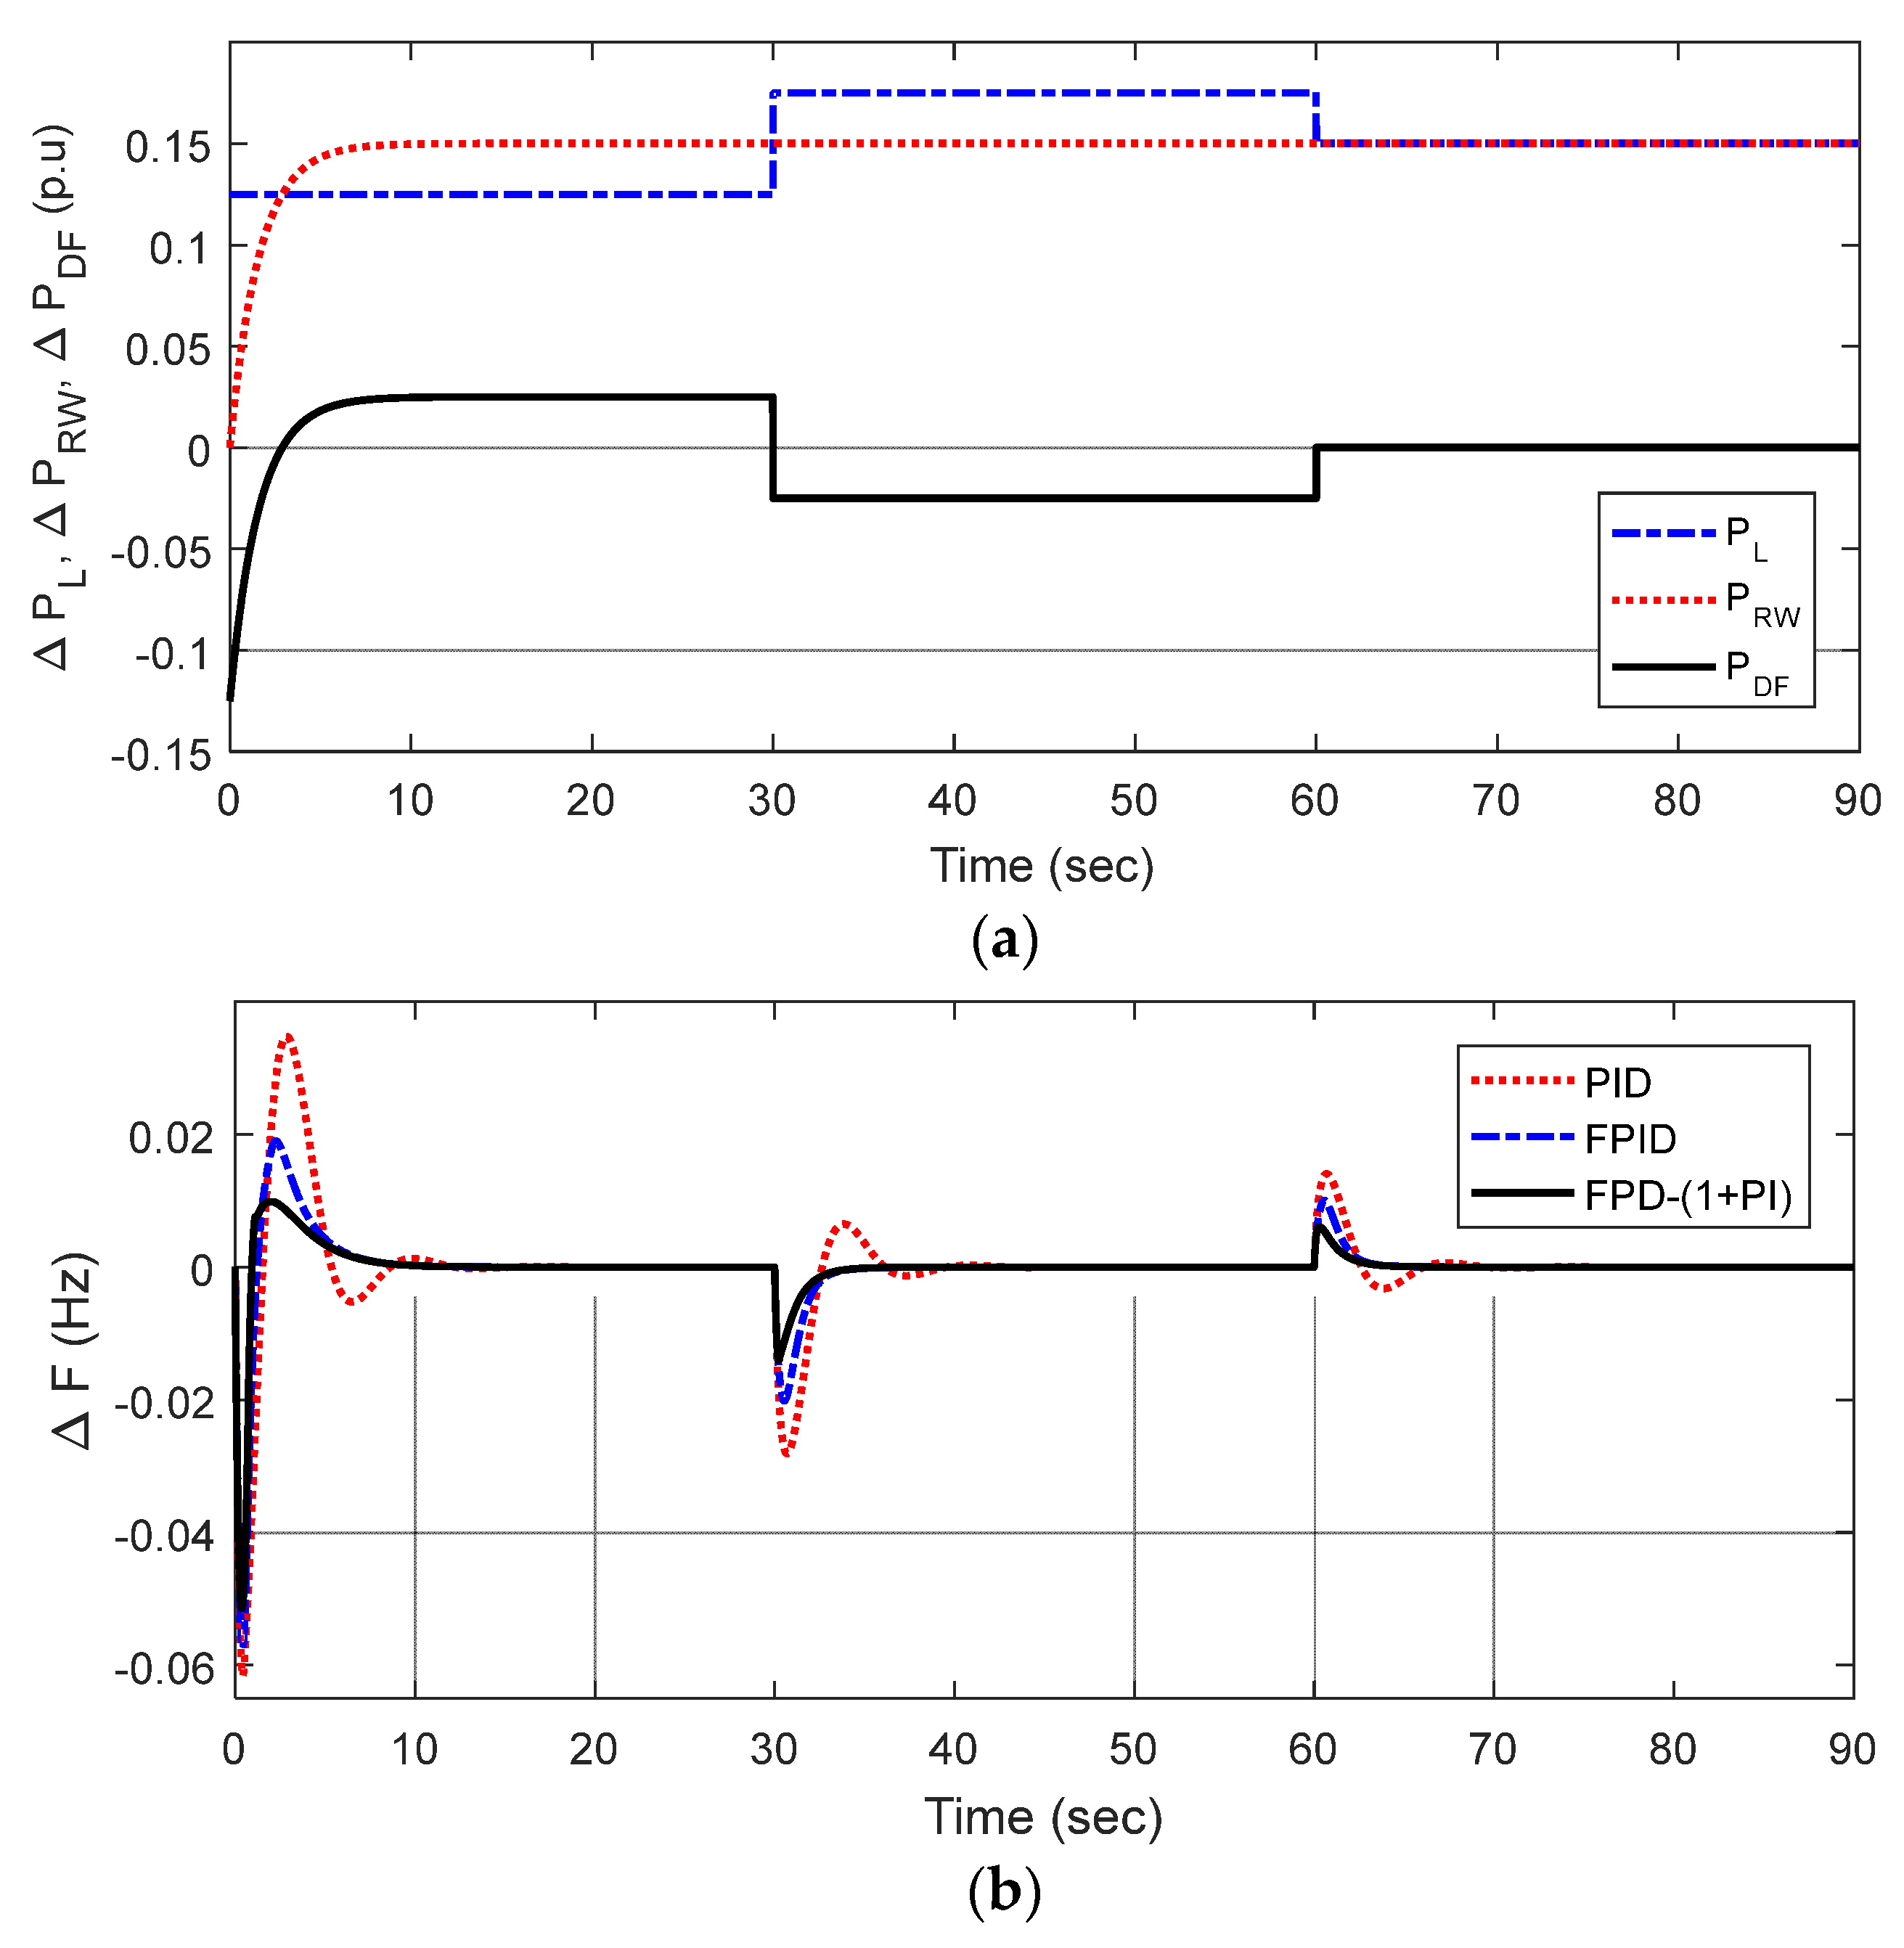
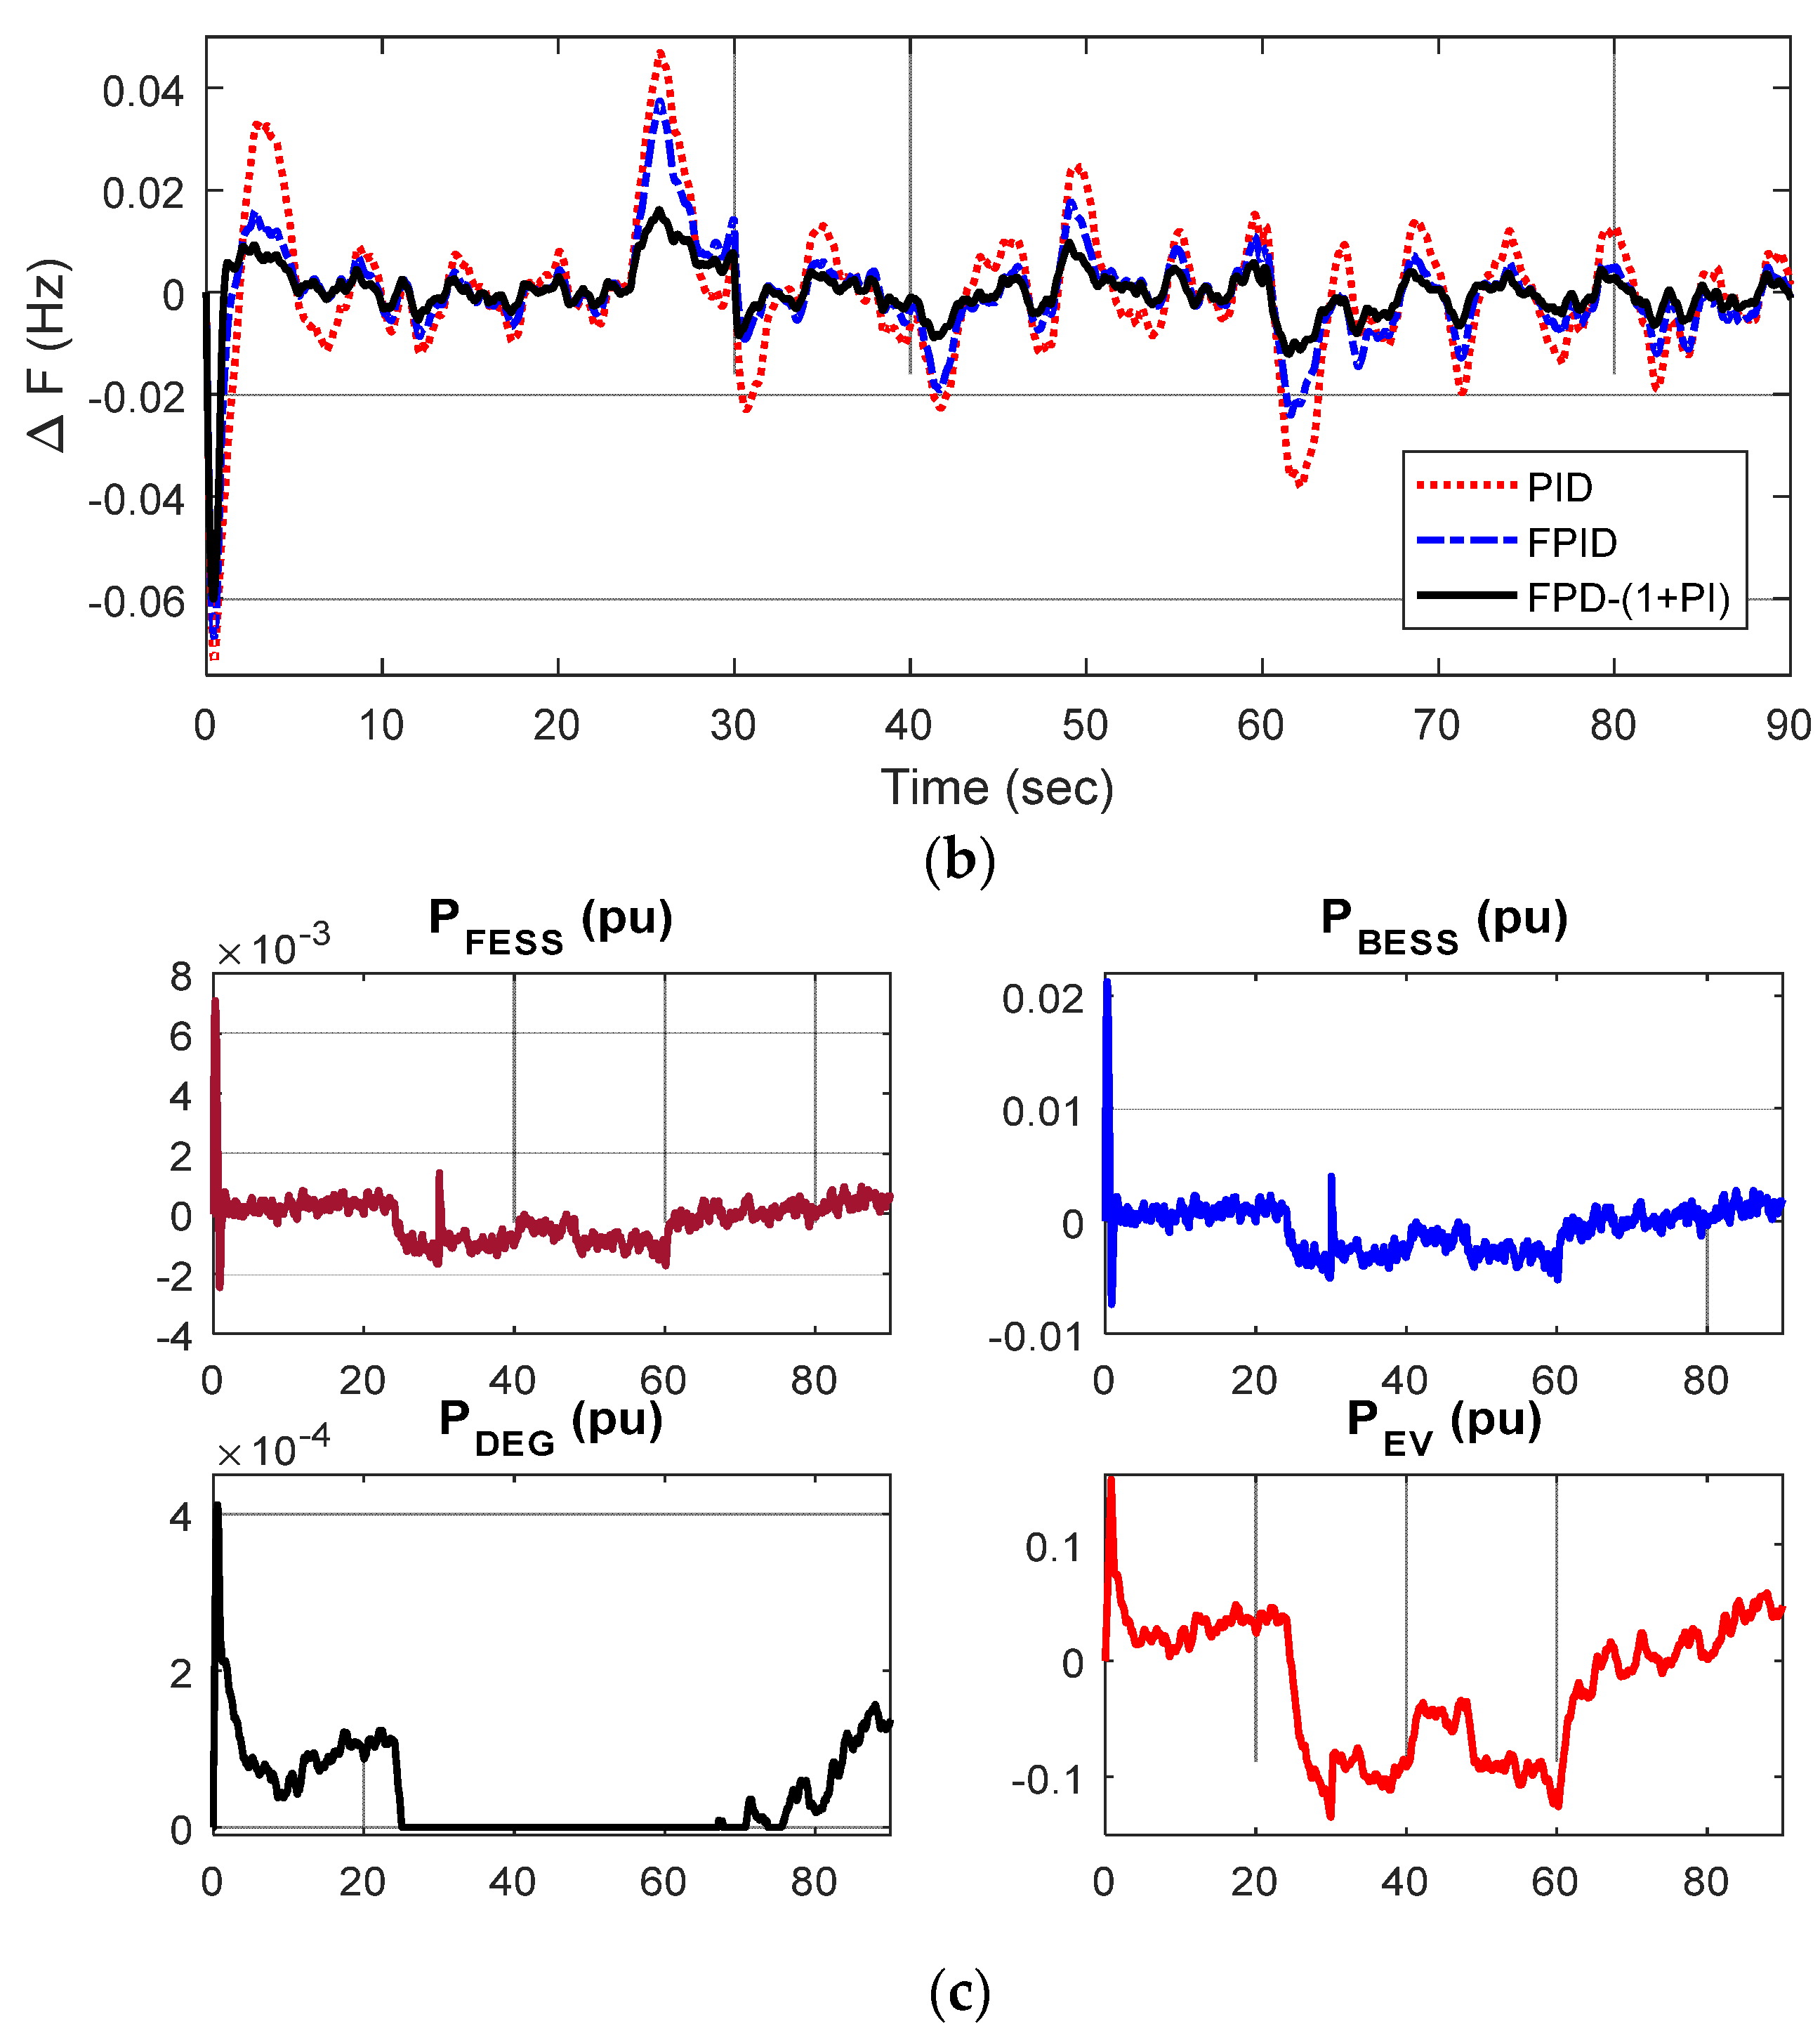
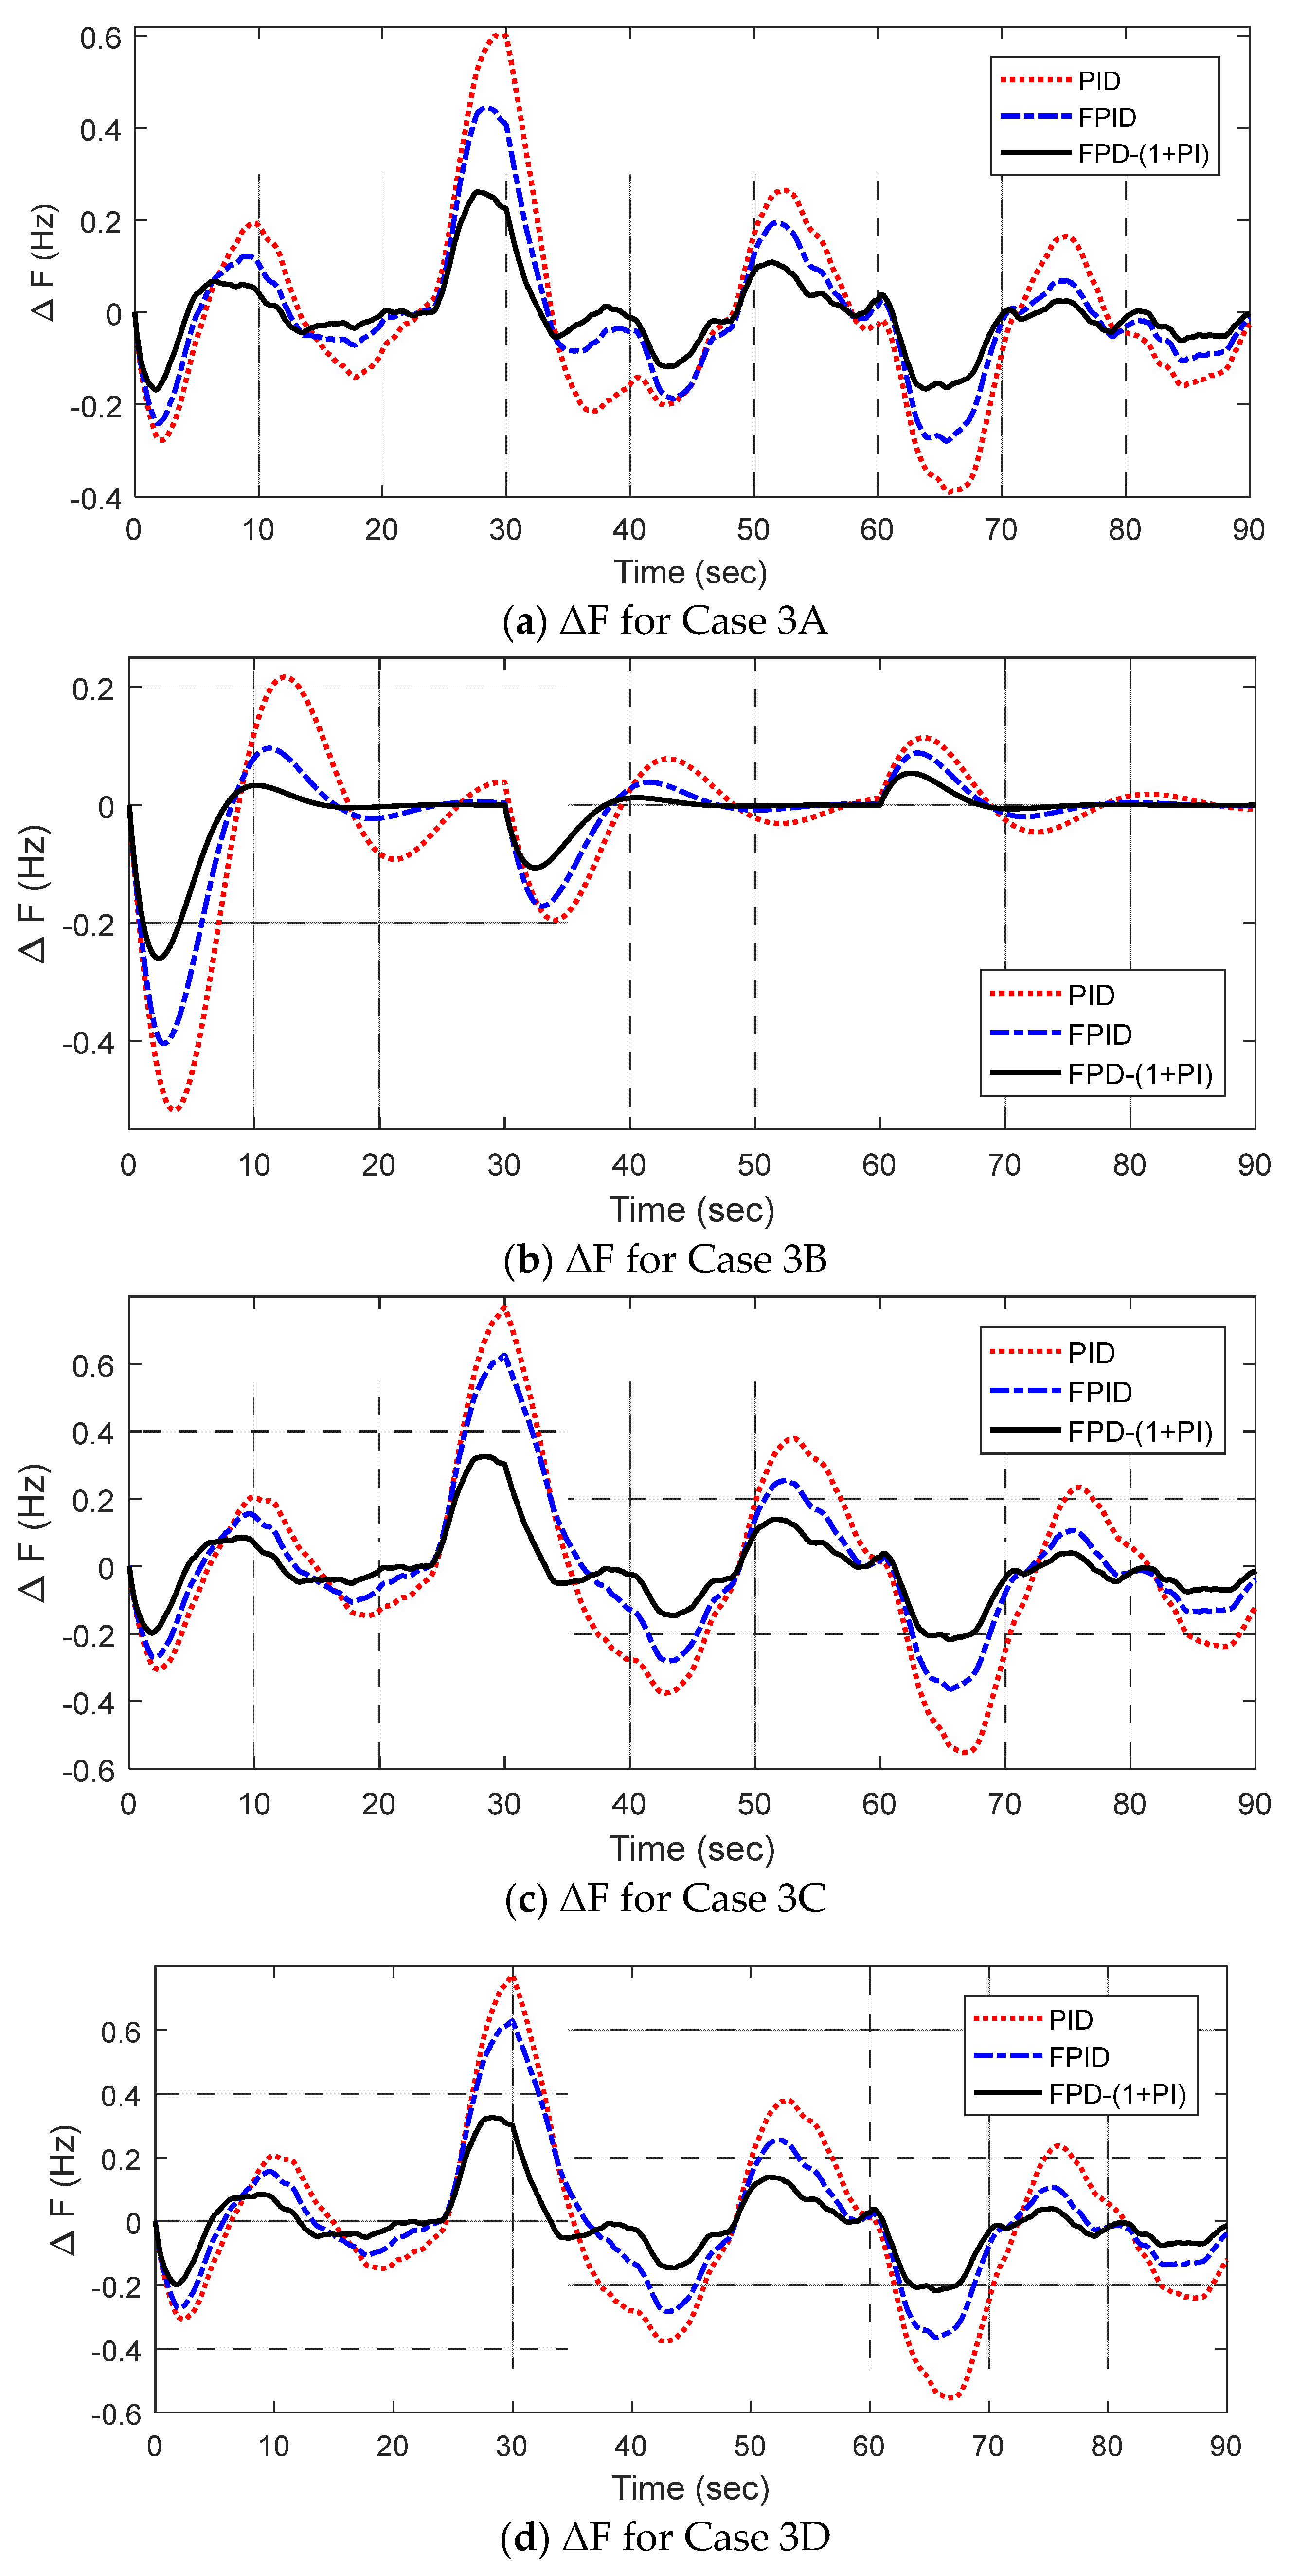
  • Furthermore, the iGTO is used to design a fuzzy PD-(1+PI) i.e., FPD-(1+PI) structure for the frequency control of a smartgrid system and the superiority of FPD-(1+PI) over the FPID and PID structure is demonstrated.
  • The effectiveness of the projected frequency control scheme under various cyberattacks, like denial of service (DoS) and data transmission delay, is investigated.
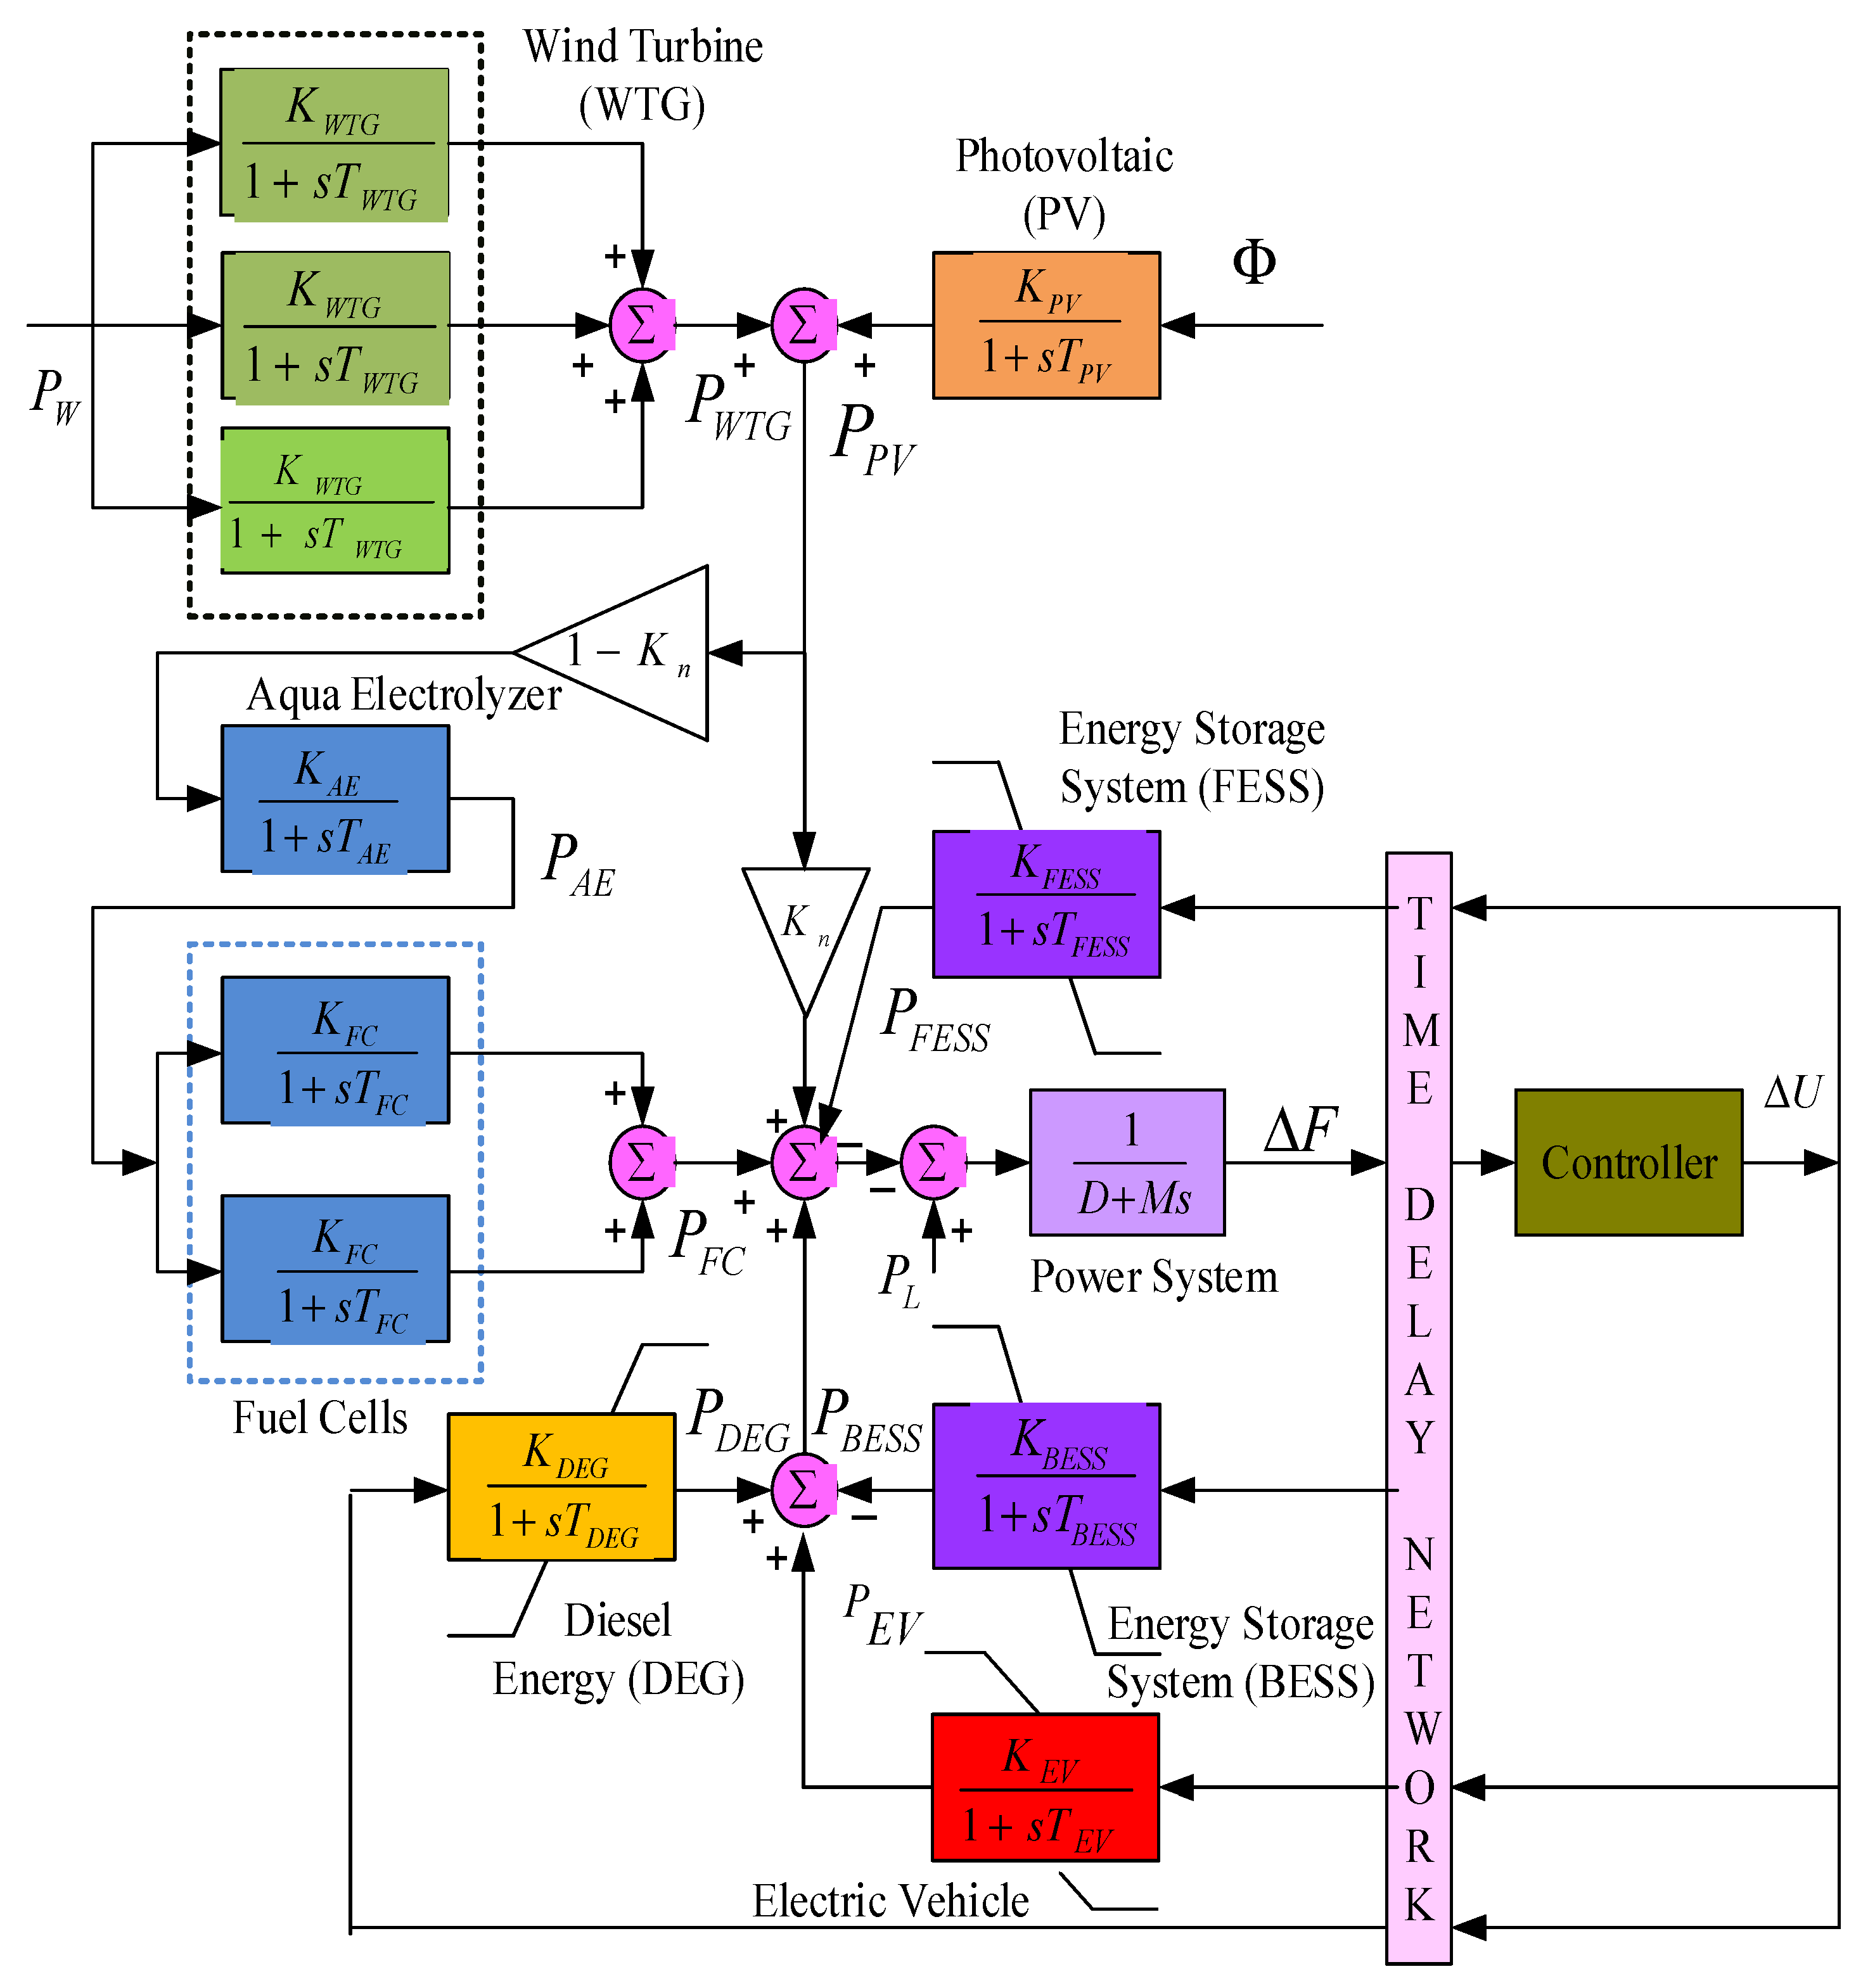
2. Test System

For the design and investigation of the projected controller, the smartgrid (SG) system revealed in Figure 1 is used. The SG system contains a battery energy storage system (BESS), flywheel energy storage system (FESS), diesel engine generator (DEG),wind turbine generators (WTGs), solar photovoltaic (PV), aqua electrolyzer (AE), fuel cell (FC), and electric vehicle (EV). A centralized controller is employed for all the controllable sources of the SG system. This results in an easier control system (fewer control parameters) with less maintenance. For all the controllable sources, the rate limiters are included to make the system more realistic.

2.1. Modeling of Components
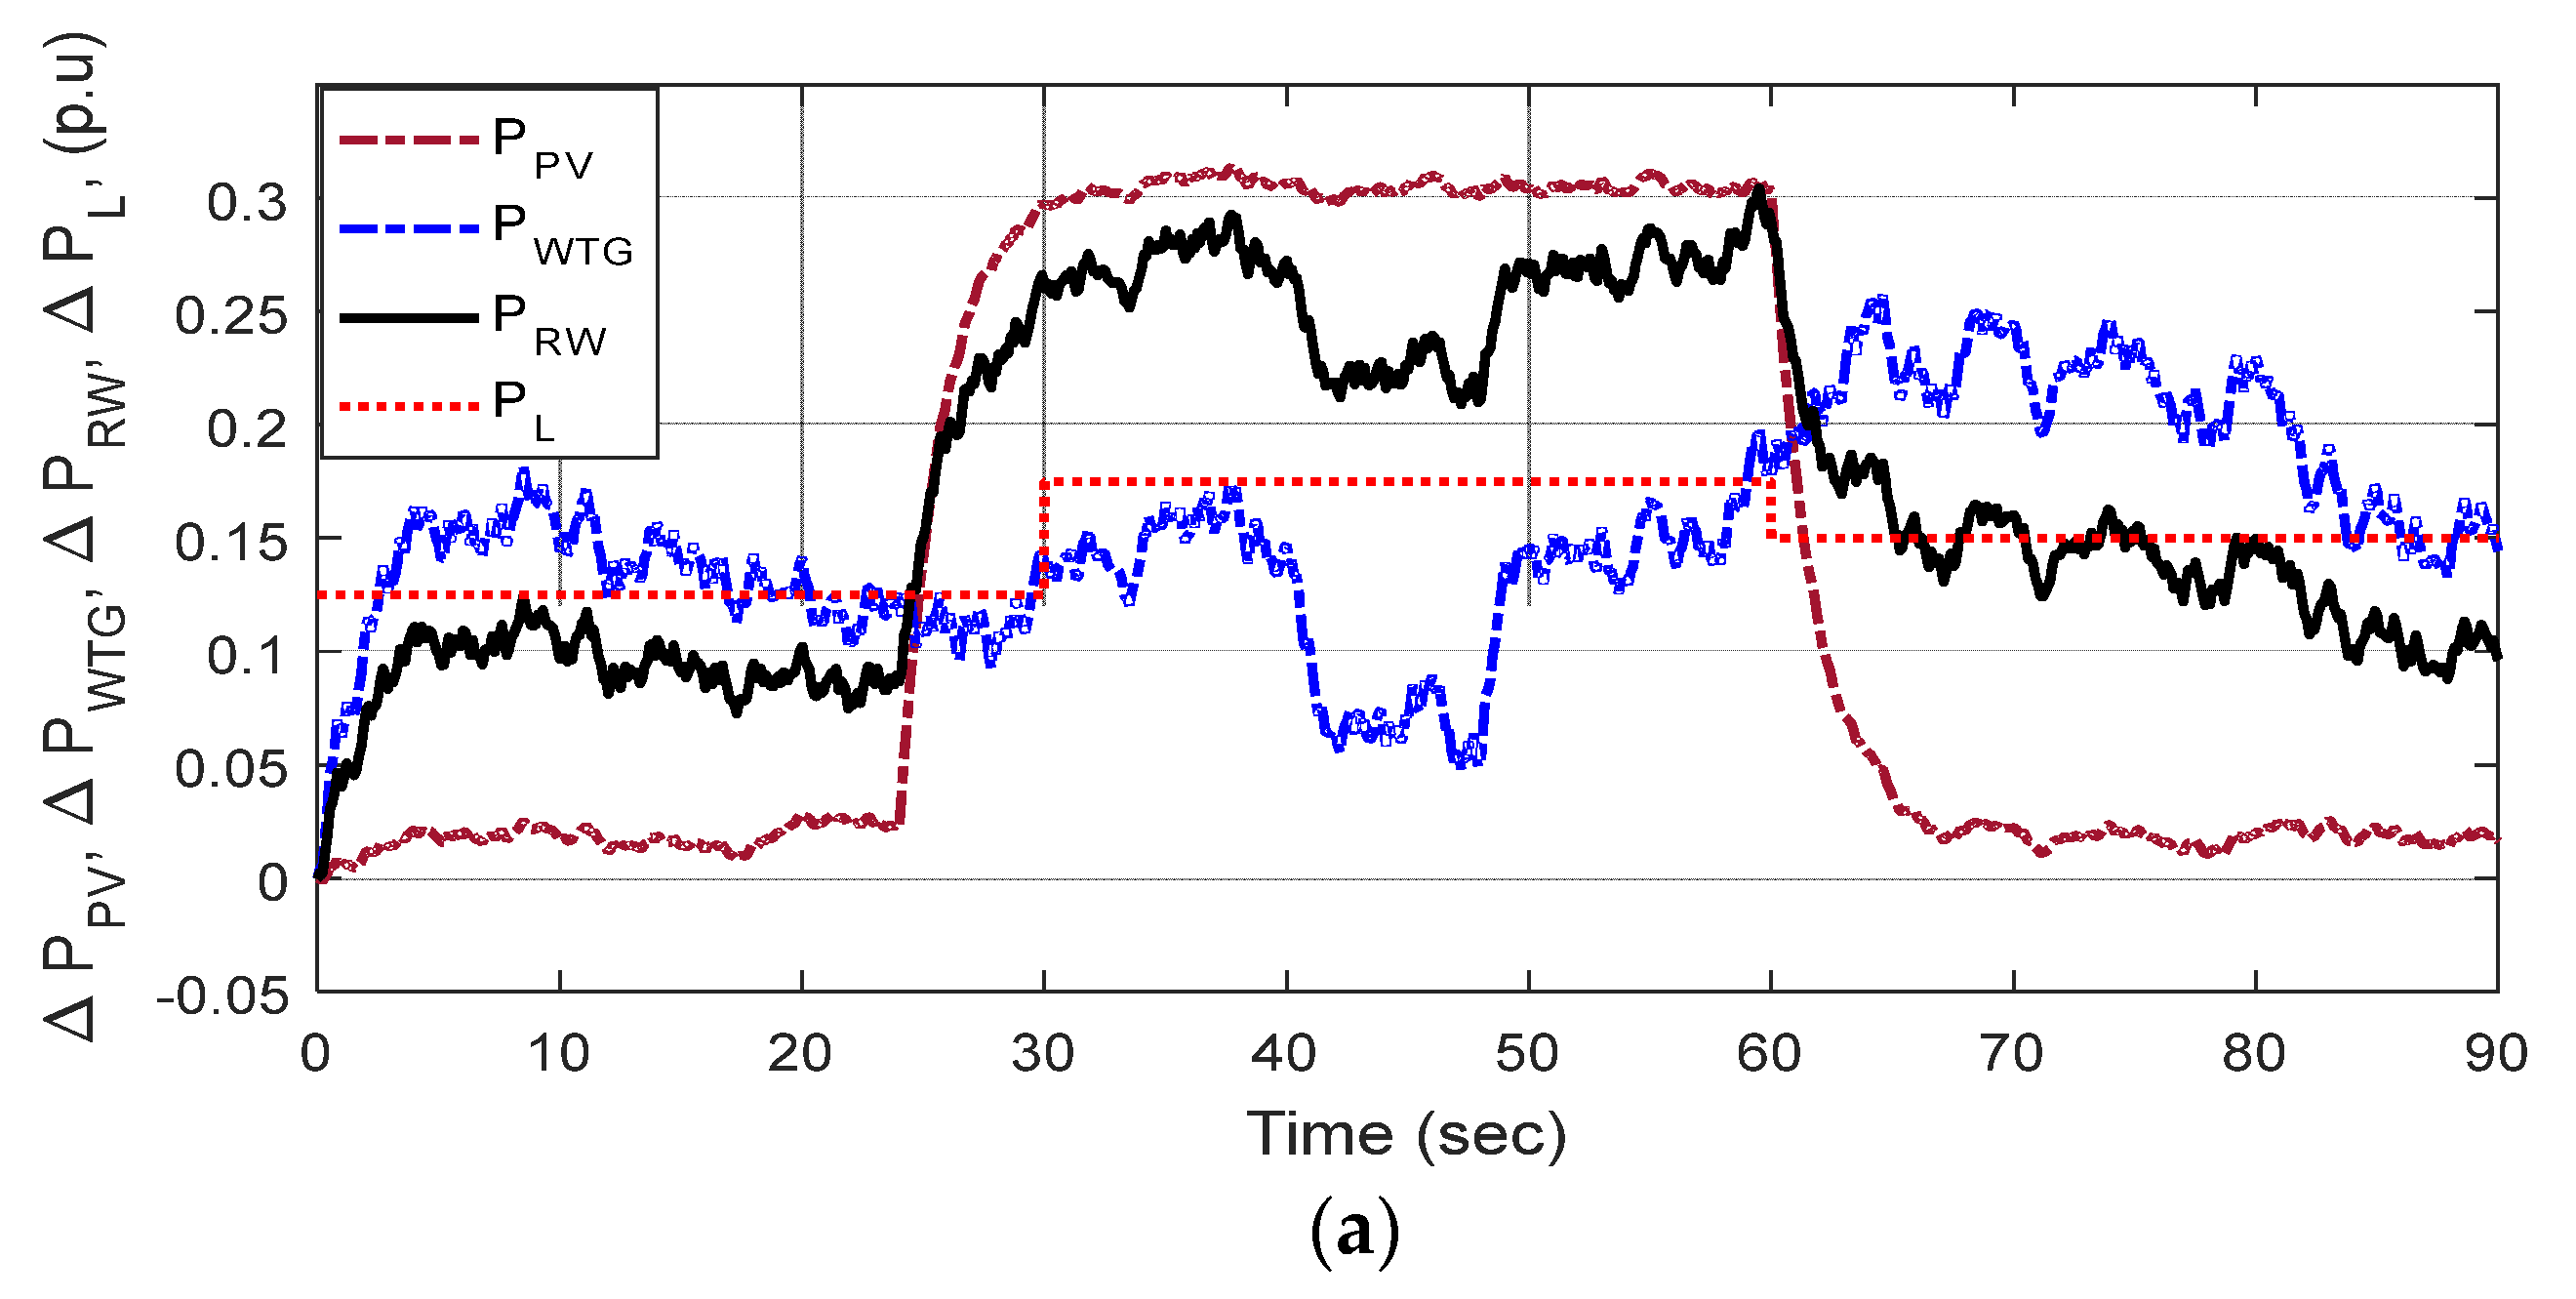
The modeling of components present in the SG system can be represented by the transfer function (TF).

2.1.1. Wind Turbine

The WTGs have numerous nonlinearities. The wind power output is given by [32]
P W P = 1 2 ρ A R C P V W 3
where ρ , C P , A R , and V W denote the air density ( ρ = 1.25 kg/ m 3 ), power coefficient, swept area ( A R = 1735 m 2 ), and wind speed, respectively.
The TFof the WTG is given below (lstandsforno. of units).
G W T G l ( s ) = K W T G 1 + S T W T G = Δ P W T G Δ P W P
where l = 1, 2, 3.

2.1.2. Photovoltaic Cell

The power output of the PV [32] system is represented by
P P V = η S φ 1 0.005 T a + 25
where η indicates the conversion efficiency of the PV (taken as 10%), Sindicates the PV array area (taken as 4084 m2) and ϕ indicates the solar irradiation in kW/m2. The PV system TF is expressed as:
G P V s = K P V 1 + s T P V = Δ P P V Δ ϕ

2.1.3. Aquaelectrolyzer

Part of the energy (40%) produced by the WTG and PV is consumed by the AE to produce hydrogen for the FC. The TF of the AE is given as [32]
G A E s = K A E 1 + s T A E = Δ P A E U 2
Fuel cell
The TF of the FC system is given by:
G F C l s = K F C 1 + s T F C = Δ P F C l Δ P A E
where l = 1, 2.

2.1.4. Diesel Engine Generator

The DEG is capable of supplying the deficient power and can minimize the power disparity among the generation and load demand. The TF of the DEG is given as [32]
G D E G ( s ) = K D E G 1 + s T D E G = Δ P D E G Δ U

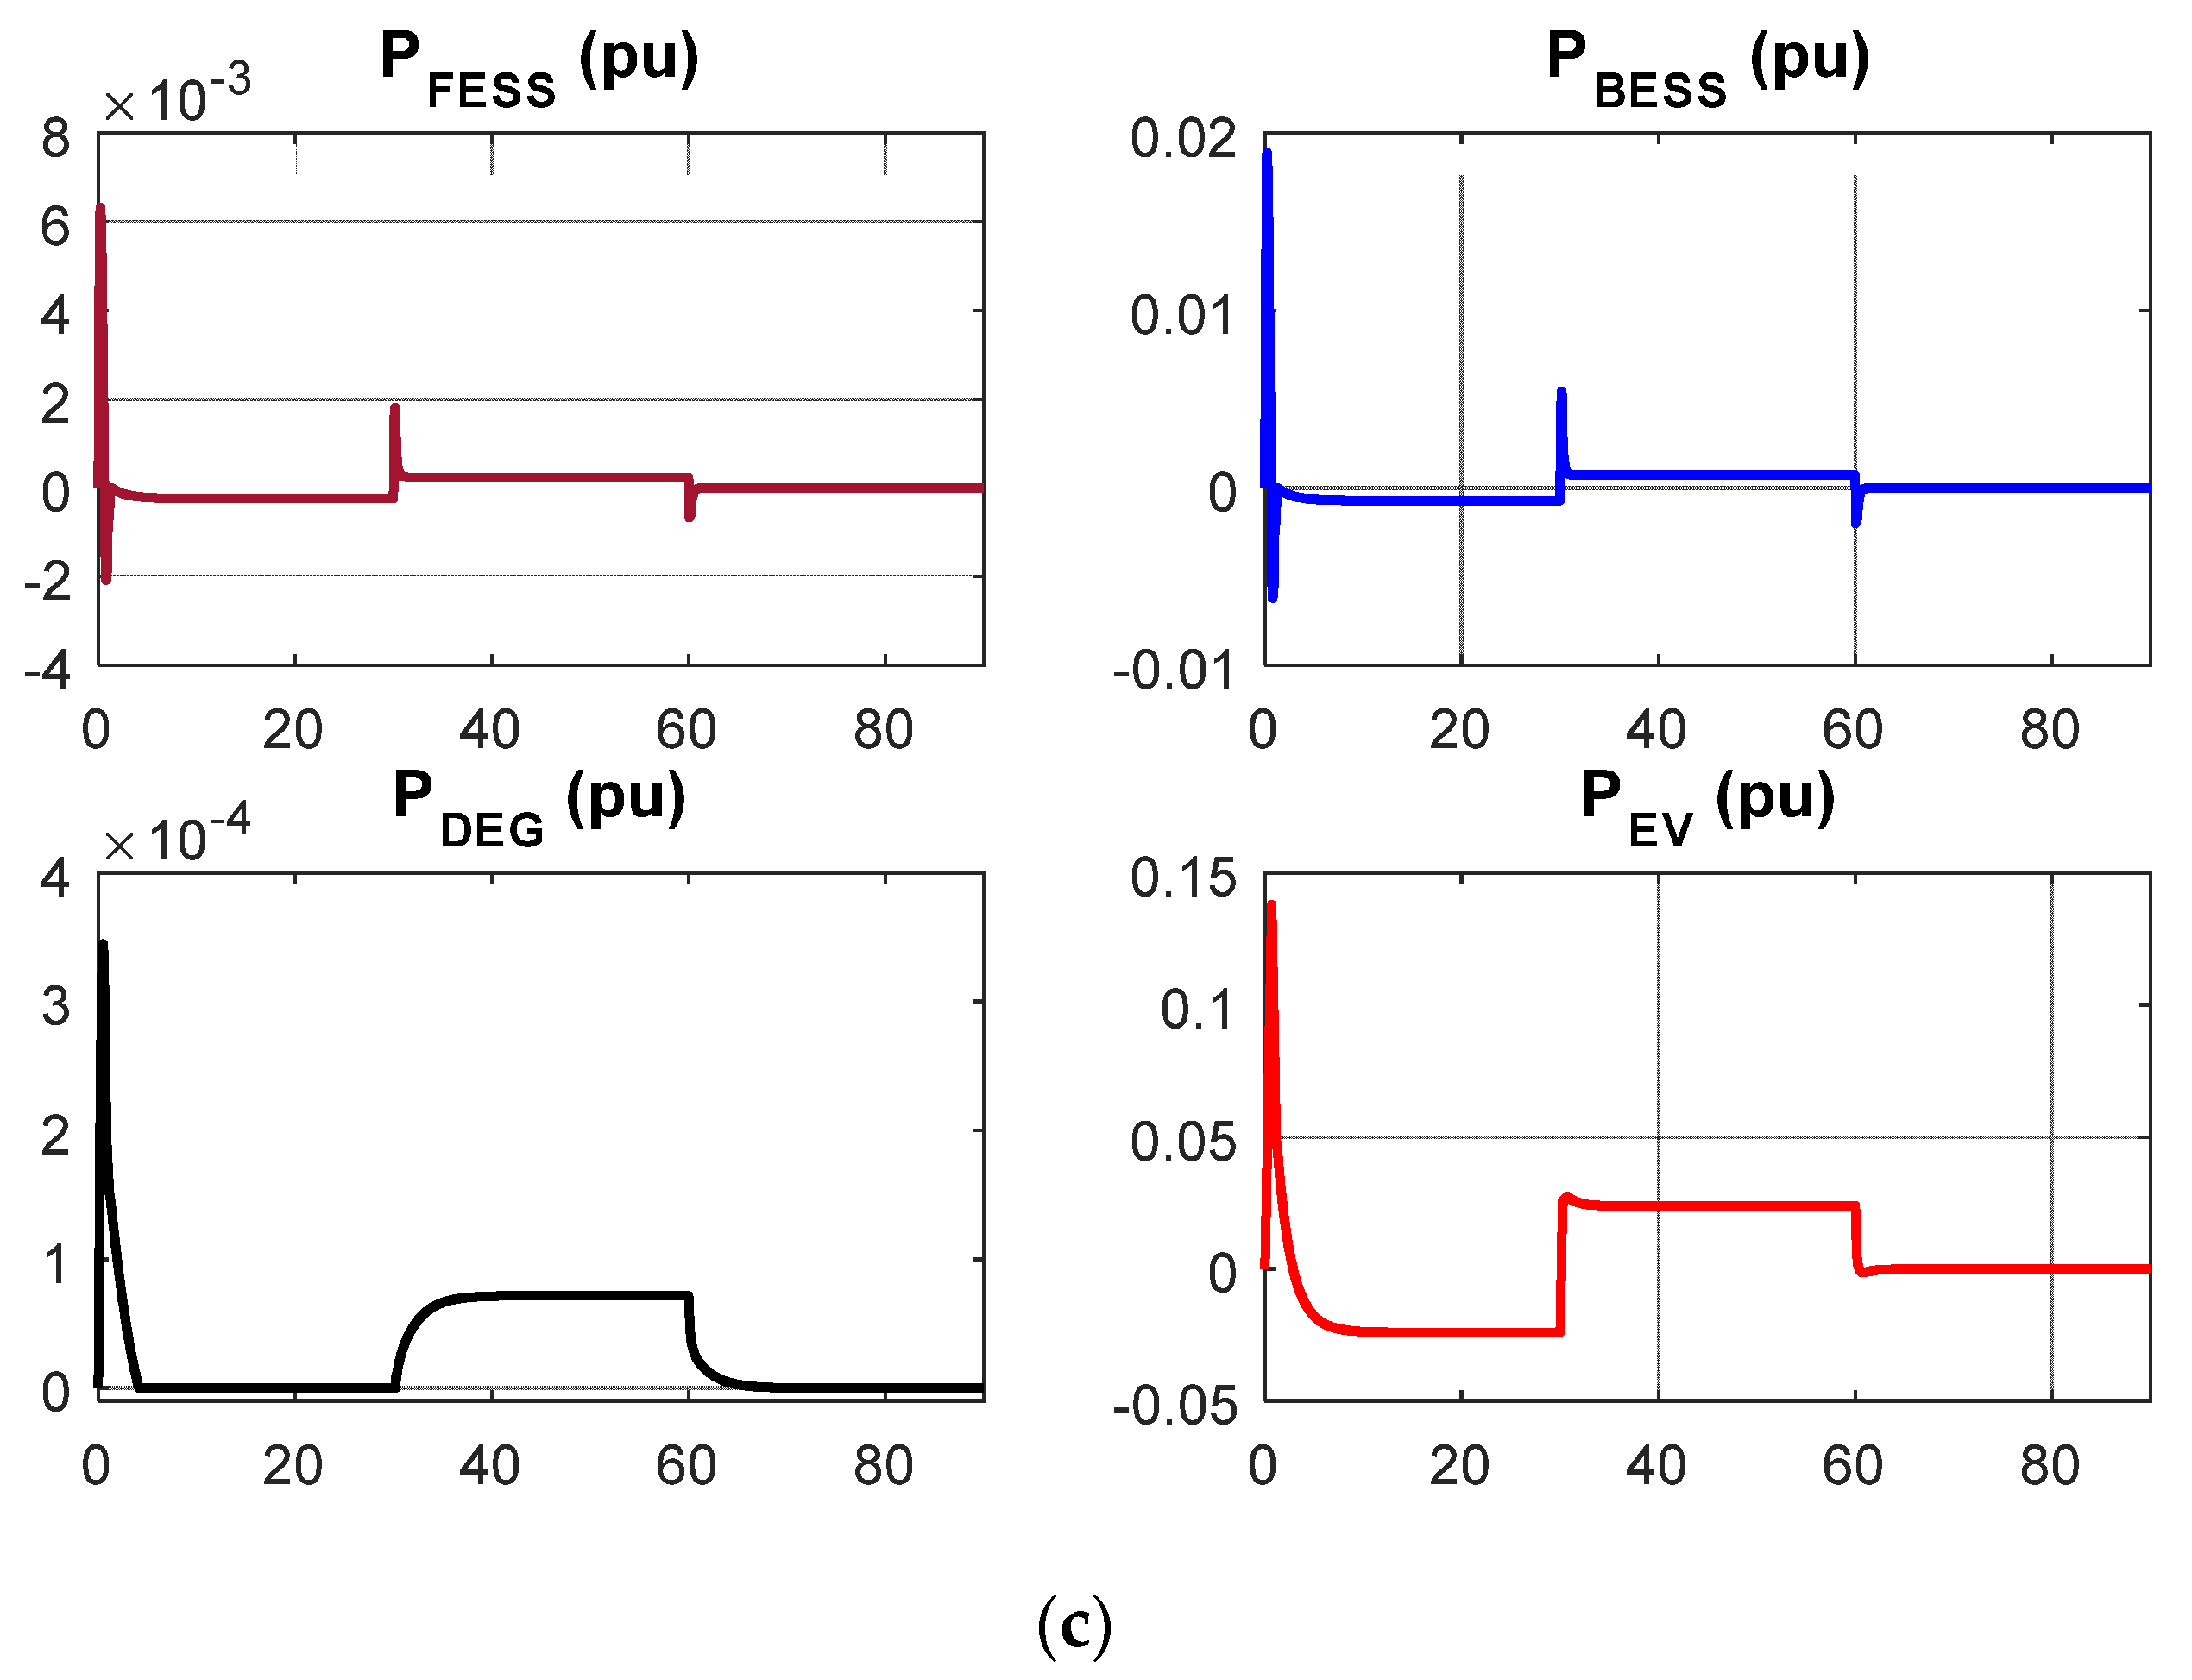
2.1.5. Energy Storage System Modelling

The BESS, FESS and EV are included in the control scheme. They are controlled by the signal sobtained from the controller output. These elements act as the source/load asper the needs of the SG for frequency control. Their TFs are [32]:
Flywheel   Energy   Storage   System : G F E S S s = K F E S S 1 + s T F E S S = Δ P F E S S Δ U
Battery   Energy   Storage   System :   G B E S S s = K B E S S 1 + s T B E S S = Δ P B E S S Δ U
The nonlinearities are given by P ˙ D E G < 0.01 , P ˙ E V < 0.01 , P F E S S < 0.9 , P B E S S < 0.2 , and 0 < P D E G < 0.45 .

2.1.6. Electric Vehicle

The EVs are used in the SG and they can consume (charging) or supply (discharging) real power. For frequency control, a 1st order TF is used [9].
G E V s = K E 1 + s T E

2.1.7. Power System

Variation in power in a power system (PS) is due to the change in its input resulting in a change in frequency. The TF of PS is:
G s = Δ F Δ P = 1 D + M s
The value for the damping constant, shown here as D, is taken at 0.03, while the value for the inertia constant, shown here as M, is taken at 0.4 for the current study.

3. Controller Structure and Objective Function

Generally, PID controllers are used in control systems for their modest design, lower cost, and their practicality suitable for linear systems. However, these traditional PI structures are usually not competent for nonlinear systems. Alternatively, fuzzy logic control (FLC) is flexible, simple to comprehend and easy to put into practice. The performance of a control system can be improved by an FLC-based PID (FPID) controller. In FPID, an integral part is essential to eliminate the steady-state error. But, slowing down the system response results in raising the integral gain. To overcome these issues, a multistage structure adopted. Various studies demonstrate that moving the integral part to the second section of the cascaded controller enhances the performance. In view of the above, a Fuzzy PD-(1+PI) i.e., FPD-(1+PI) controller is proposed in the present study as shown in Figure 2.
A fuzzy logic control (FLC)-based structure increases the system performance as fuzzy logic can deal with nonlinearities. The design of an appropriate FLC involves the choice of appropriate membership functions (MFs), and the construction of rules is a complex job. Conversely, a common rule base and MFs can be selected, and the scaling factors (SFs) and controller parameters can be optimized for satisfactory operation. The error and its derivative is amplified through SFs (K1 and K2) and given as inputs to FLC. The FLC output is passed through a 1st stage PD structure and a 2nd stage (1+PI) structure, as shown in Figure 2. The FPD-(1+PI) outputs manage the powers of controllable sources.
Usually, triangular MFs are preferred, as its real-world execution can simply be attained. It also requires lowest storage requirements and can be functioned economically to meet the stiff real-time necessities. The same MFs for both inputs/output are typically preferred from a computational adeptness viewpoint in addition to memory management ability. In the present work, it is believed that the FLCs are based on (a) fixed MFs and (b) fixed rules. Triangular membership functions are taken with three linguistics classes as po_bi (positive big), z_o (zero) and ne_bi (negative big) for input/output in FLC, as shown in Figure 3.
Table 1 describes the principles that identify the input and output.
For controller design, an Integral Squared Error (ISE) criterion to reduce the ∆F and control actions ( Δ U ) is chosen as:
J = 0 t [ K w 1 ( Δ F ) 2 + ( Δ U ) 2 / K w 2 + ]   d t
where t is the time, K w 1 and K w 2 are weights, which are taken as 100 and 2, respectively. These weights make both parts in Equation (12) important in the search process.
The optimization task is now expressed as shown below:
Minimize J
Subject to
K P 1 M i n K P 1 K P 1 M a x ,   K I M i n K I K I M a x ,   K D M i n K D K D M a x ,   K P 2 M i n K P 2 K P 2 M a x ,   K 1 M i n K 1 K 1 M a x ,   K 2 M i n K 2 K 2 M a x
where the subscripts Min and Max indicate the ranges of the parameters chosen from limit 0 to 2.

4. Improved Gorilla Troops Optimizer

4.1. Gorilla Troops Optimizer (GTO)

The group activities of the gorillas lead to the development of an intelligent algorithm, namely GTO. It requires a few parameters to be optimized for obtaining the global solution, which makes it simple for implementation in engineering applications. The three important parts in GTO such as initialization, exploration and exploitation are based on the different strategies of gorillas, which include movement to the unknown area, migrating to the known locations, moving to the other gorillas, following the decisions of the silverback and challenging for the mature feminine gorillas. Once the initialization phase is over, the exploration phase depends on the three strategies including migrating to the unknown area, migrating to the identified locations and moving to other gorillas. Similarly, the exploitation phase in GTO is designed by employing the two strategies of gorillas, which are following the silverback and competition for the mature feminine gorillas. The three phases in GTO are described as follows.

4.1.1. Initialization Phase

The position of the nth gorilla is defined as:
X n = rand ( 1 ,   D ) × ( u b l b ) + l b
where n N and N is the number of gorillas present in the D dimensional search area. The position vector of gorillas can be written as X = { X 1 , X 1 , X n , , X n } .

4.1.2. Exploration Phase

At each stage, all N gorillas are measured as contender solutions, and the best solution is supposed to be the silverback. Migration to unknown locations enhances the exploration in GTO, whereas the balance between the exploitation and exploration is obtained by moving to the other gorilla groups. Transfer to the identified location implies a diverse optimization search space. Based on those three strategies, the exploration phase is mathematically formulated as
G n ( i t + 1 ) = { ( u b l b ) × r 2 × l b , r 1 < α ( r 3 C ) × X A ( i t ) + P × Q × X n ( i t ) , r 1 0.5 X A ( i t ) P × ( P × X n ( i t ) X B ( i t ) + r 4 × X n ( i t ) X B ( i t ) ) , r 1 < 0.5
where it represents the current iteration. X n ( i t ) is the nth gorilla’s current position vector. G n ( i t + 1 ) is a contender for the next iteration’s gorilla job. The random numbers, r1, r2, r3, and r4, vary from 0 to 1. X A ( i t ) and X B ( i t ) depict the position vector that was chosen at random during the itth iteration. In addition, the parameter is a possible number between 0 and 1. The variables C, P and Q can be mathematically computed as shown below:
C = ( cos ( 2 × r 5 ) ) × ( 1 i t i t max )
P = C × y y [ 1 , 1 ]
Q = Y × X n ( i t ) , y [ C , C ]
where cos ( . ) denotes the cosine function. r5 is the random number ranging from 0 to 1 and i t max represents the maximum iteration taken in the optimization algorithm. In the similar manner, the candidate solution G n ( i t + 1 ) is evaluated for all N. After the completion of the exploration phase, fitness functions obtained from G n ( i t + 1 ) and G n ( i t ) are evaluated. If F ( G n ( i t + 1 ) ) < F ( X n ( i t ) ) , then the fitness function obtained from G n ( i t + 1 ) is better than the fitness function obtained from G n ( i t ) . Hence, G n ( i t + 1 ) replaces the original vector G n ( i t ) . The optimal solution obtained from the above computation is referred to as the silverback, i.e., X s i l v e r b a c k .

4.1.3. Exploitation Phase

This phase is based on two strategies; those are subsequent to the silverback and competition for mature females. Let z be the constant parameter which decides to switch between these two strategies. The silverback gorilla’s decision is followed by C z . The mathematical expression representing the above behavior can be shown as follows:
G n ( i t + 1 ) = P × M × ( G n ( i t ) X s i l v e r b a c k ) + G n ( i t )
where X s i l v e r b a c k is the best result obtained so far. The value of M is calculated as:
M = ( | n = 1 N X n ( i t ) / N | 2 L ) 2 1 L
The second strategy is chosen if C < Z, which is represented as:
G n ( i t + 1 ) = X s i l v e r b a c k ( X s i l v e r b a c k × I X n ( i t ) × I ) × J
l = 2 × r 6 1
j = φ × W
W = { N 1 , r 7 0.5 N 2 , r 7 < 0.5
In the above equations, I signifies the impact force, where r6 is a random value between 0 and 1. j represents the violence intensity, and φ is a constant. r7 is a random value between 0 and 1.
After the completion of exploitation phase, the fitness functions are evaluated. If F ( G n ( i t + 1 ) ) < F ( G n ( i t + 1 ) ) ,   G n ( i t + 1 ) replaces the original vector X n ( i t ) . The best solution is referred to as the X s i l v e r b a c k .

4.2. Improved Gorilla Troops Optimizer (iGTO)

In the original GTO algorithm, the algorithm parameters P and Q are dependent on the variable C, which is calculated using Equation (11). These parameters influence the exploration and exploitation process of the GTO method. Excessive exploration capability could lead to a lower chance of becoming stuck in local minima. Elevated exploration capability will bring in extra uncertainty, and the best results may not be found. Also, overindulgence in the exploitation process causes less uncertainty, and the method might not provide best result. Hence, equilibrium among the exploration and exploitation stages should be preserved throughout the iterations. In the GTO method, C is controlled by it/it max, which linearly decreases with each iteration, as given in Equation (15). In the proposed algorithm, the parameter C is calculated using Equation (24) as shown below:
C = ( cos ( 2 × r 5 ) ) × ( 1 i t α i t max α )
In the above Equation (24), the inclusion of parameter α changes the variation in C from linear to nonlinear. For the proper selection of α , many values above 1 and below 1 are tried, and it is observed that the algorithm works in the most efficient manner when α = 0.2 is used.
In the GTO method, the detection of the gorilla’s best positions at the early phases is not clear. Thus, a large step size at the initial phases of the GTO may move the gorilla’s positions from the ideal positions. Accordingly, to regulate the gorilla’s movement in initial phases, a sine cosine-adopted scaling factor (SCaSF) is engaged in the present work. This alters the gorilla’s positions and hence enhances the search potential of GTO. The cyclic shapes of trigonometric functions facilitate a gorilla to be relocated to another location. This scheme will be able to enhance the exploration/exploitation potential of GTO.
At the end of the exploration and exploitation phases in each of the iteration, the new gorilla’s location ( X ( t ) N e w ) is adjusted in the proposed iGTO using SCaSF and the old gorilla’s location ( X ( t ) O l d ) can be calculated as shown below:
X ( t ) N e w = S C a S F   × X ( t ) O l d
where ScaSFis calculated as:
S C a S F = { sin ( W T 1 W T 2 ( i t / i t max ) i f   R D < 0.5 cos ( W T 1 W T 2 ( i t / i t max ) i f   R D 0.5
where RD is an arbitrary value from 0 to and WT1 and WT2 are weighting parameters. To suitably select WT1 and WT2, different values are tested, and it is noted that the best outcomes are obtained when WT1 and WT2 are selected as 10 and 9.
The flow chart for the improved gorilla troop’s optimizer is given in Figure 4.

5. Results and Discussions

5.1. Assessment of iGTO

At first, the efficacy of the recommended iGTO method is demonstrated by considering several benchmark test functions (BTFs), as given in Table 2 [9]. To substantiate the worth of the recommended iGTO method, it is equated with GTO and some recently proposed optimization algorithms like GJO, PSO, GSA, GWO, TLBO and ALO methods, taking the same algorithm parameters (200 iterations, 30 search agents, 30 independent runs) as presented in [9] for various dimensional BTFs. The outcomes are collected in Table 3. It is seen that iGTO dominates other algorithms for nearly all functions. The better convergence feature of GTO over GSA, GWO, MFO, MVO, PSO, SCA, TSA and WOA has been established using BTFs in [31]. In the present study, the convergence characteristics of the proposed iGTO and GTO are compared and shown in Figure 5, from which it is evident that a superior convergence characteristic is achieved with the proposed iGTO compared with GTO.

5.2. Application of iGTO for Controller Design

The proposed iGTO is now employed for the controller design problem of the SG system shown in Figure 1. The parameters of the SG are provided in Appendix A. In the beginning, PID controllers are considered, and iGTO, GTO, PSO and GA methods are applied to tune the PID parameters. The limits of the controller parameters are taken as [0, 2] for all the structures. The optimized values are given in Table 4.
It is clear from Table 4 that with PID, a lower J value is attained with GTO (J = 3.2751) compared to GA (J = 4.3437) and PSO (J = 3.3486). The J value is further decreased to 2.2011with iGTO. The percentage decreases in the J value with iGTO compared to GA, PSO, and GTO are 49.32%, 34.26% and 32.79%, respectively. This authenticates that iGTOis a better fit than GTO, GA and PSO for solving the controller design problem of the considered SG system.
Figure 6 shows the system’s response to a 10% load increase perturbation with constant WTG and PV power. It is clear from Figure 5 that the iGTO approach outperforms the GA, PSO, and GTO methods. The numerical values of the system performance are gathered in Table 4. It is apparent from Table 4 that iGTO-based PID yields the smallest integral errors compared to the GA, PSO, and GTO-based PID controllers. This substantiates the dominance of iGTO over the GA, PSO and GTO methods in the present controller design task.
Next, the iGTO scheme is used to optimize the FPID and FPD-(1+PI) controller to improve the performance further. The tuned parameters are shown in Table 4, from which it is evident that with the same iGTO technique, when the FPID controller is used, a lower J value is realized compared to the PID controller. The J value is further reduced when the proposed FPD-(1+PI) controller is used. The percentage reductions in the J value with FPD-(1+PI) compared to FPID and PID are 21.09%, and 57.21%, respectively. This validates that FPD-(1+PI) outperforms FPID and PID.
To measure the designed controllers, various cases are considered as given below.
Case 1: Load variation (ΔPL) with constant renewable power ΔPRW (ΔPRW = solar power (ΔPPV) + wind power(ΔPWTG) + Fuel cell power (ΔPFC));
Case 2: Load variation with the change in sun irradiance and wind speed;
Case 3: Various cyber-attack conditions.
Case 1:
In this case, only load variation (ΔPL) with constant renewable power (ΔPRW) as revealed in Figure 7a is considered. The power difference ΔPDF = ΔPRW − ΔPL is also revealed in Figure 7a. The dynamic responses with iGTO-tuned PID, FPID and FPD-(1+PI) are presented in Figure 7b. It can be observed from Figure 7b that the performance with FPD-(1+PI) is better than that with the PID and FPID controllers. The power supplied by controllable sources with the proposed iGTO optimized FPD-(1+PI) controller is shown in Figure 7c. It can be seen from Figure 7c that when the power imbalance is positive (up to 30s), which indicates that ΔPRW > ΔPL, controllable sources receive the real power to minimize the power imbalance. From 30s to 60 s, when generation is less than load demand, controllable sources supply power from the SG to minimize the power imbalance. During the time period from 60 to 90 s, the power imbalance becomes zero, and the controllable sources neither supply nor receive the power, as evident from Figure 6c. Various integral errors, MOs and MUs of ΔF for Case 1 are given in Table 4. It is detected that the arithmetical values J (J = 0.3321), integral errors (ISE = 0.0016, ITAE = 1.2037, ITSE = 0.0073, IAE = 0.0916), MUs (−0.0515) and MOs (0.009) are attained with the FPD-(1+PI) controller. The percentage decrease in the J value with FPD-(1+PI) compared to FPID and PID is 18.34%and 46.83%, respectively, for Case 1.
Case 2:
In Case 2, there are changes in ΔPL, ΔPPV and ΔPWTG, as shown in Figure 8a. The system responses with iGTO-tuned PID, FPID and FPD-(1+PI) are shown in Figure 8b. It can be observed from Figure 8b that the performance with FPD-(1+PI) is better than that with PID and FPID. The output powers of the controllable sources with the iGTO-tuned FPD-(1+PI) controller are revealed in Figure 8c, from which it can be noticed that when ΔPRW > ΔPL, all the controllable sources receive power and vice versa.Various integral errors, MOs and MUs of ΔF for Case 2 are given in Table 4. It is detected that the FPD-(1+PI) controller attains arithmetical values, J (J = 0.7103), integral errors (ISE = 0.0034, ITAE = 11.8140, ITSE = 0.0636, IAE = 0.3113), MUs (−0.0601) and MOs (0.0162). The percentage decreases in the J value with the FPD-(1+PI) controller compared to FPID and PID are 35.88% and 63.04%, respectively, for Case 2.
Case 3:
A cyberattack on the frequency control scheme usually degrades the system performance, leading to frequency instability. Therefore, it is essential to analyze the system performance under various cyber-attack scenarios. In the present study, four cyber-attack cases have been considered as given below:
Case 3A: Denial of service (DoS) attack on EV unit;
Case 3B: Denial of service (DoS) attack on EV and renewable units;
Case 3C: DoS attack on EV and FESS unit;
Case 3D: Cyberattack on communication system and DoS attack on EV unit.
The system responses with iGTO-tuned PID, FPID and FPD-(1+PI) are presented in Figure 9a–d. It is worth mentioning here that when a DoS attack occurs for a particular unit, that unit no longer participates in the frequency control scheme. A cyberattack on the communication system results in increased signal transmission delay (from 10 to 20 ms). Various integral errors, MOs and MUs of ΔF for Case 3 are given in Table 4. It can be observed from Figure 9b that under different cyber-attack scenarios, the system performance with the suggested FPD-(1+PI) is better than that of PID and FPID. However, the system performance degrades with increased performance indexes, as shown in Table 4 for Case 3.

6. Conclusions

An improved GTO method (iGTO) is projected to optimize the FPD-(1+PI) parameters for the frequency control of a smart grid system in the present study. In the proposed iGTO technique, equilibrium between exploration and exploitation stages is better balanced throughout the iterations by using modified algorithm parameters as well as by introducing sine cosine-adopted scaling factors. The superiority of the proposed iGTO over GTO, GJO, PSO, GSA, GWO, TLBO and ALO is demonstrated by considering the benchmark test functions. It is observed that iGTO dominates the other algorithms for nearly all functions with superior convergence characteristics compared to GTO. In the next step, PID controllers are considered, and the iGTO, GTO, PSO and GA methods are applied to tune the PID parameters. It is noticed that with same PID controller, an improved performance is obtained with iGTO compared to the GTO, PSO and GA methods. The percentage decreases in the J value with the iGTO method compared to GA, PSO, and GTO are found to be 49.32%, 34.26% and 32.79%, respectively. Then, FPID and FPD-(1+PI) structures are considered, and it is noticed that the percentage decreases in the J value with FPD-(1+PI) compared to FPID and PID are 21.09%and 57.21%, respectively. For the analysis, various cases like the constant and variable renewable/load powers are considered, and it is noticed that for all the cases, the performance with FPD-(1+PI) is better than that of the PID and FPID structures. Finally, the analysis is carried out under various cyber-attack scenarios. It is observed that under different cyber-attack scenarios, the performance with FPD-(1+PI) is superior to that with PID and FPID. However, the system performance degrades with increased performance indexes. In future studies, the proposed results will be compared with real-time simulation results using the OPAL-RT platform.

Author Contributions

Conceptualization, Methodology, Supervision, E.A.; Formal analysis, Validation, K.C.; Writing, R.P. All authors have read and agreed to the published version of the manuscript.

Funding

This research received no external funding.

Institutional Review Board Statement

Not applicable.

Informed Consent Statement

Not applicable.

Data Availability Statement

Not applicable.

Conflicts of Interest

The authors declare no conflict of interest.

Appendix A

KEV = 1.000, TEV = 1.000, KWTG = 1.000, TWTG = 1.500, KAE = 0.002, TAE = 0.50, KFC = 0.010, TFC = 4.000, KFESS = −0.010, TFESS = 0.100, KBESS = −0.003, TBESS = 0.100, KDEG = 0.003, TDEG = 2.000, KPV = 1.000, TPV = 1.800.

References

  1. John, T.; Lam, S.P. Voltage and frequency control during microgrid islanding in a multi-area multi-microgrid system. IET Gener. Transm. Distrib. 2017, 11, 1502–1512. [Google Scholar] [CrossRef]
  2. Olivares, D.E.; Mehrizi-Sani, A.; Etemadi, A.H.; Cañizares, C.A.; Iravani, R.; Kazerani, M.; Hajimiragha, A.H.; Gomis-Bellmunt, O.; Saeedifard, M.; Palma-Behnke, R.; et al. Trends in microgrid control. IEEE Trans. Smart Grid 2014, 5, 1905–1919. [Google Scholar] [CrossRef]
  3. Khooban, M.-H. Secondary Load Frequency Control of Time-Delay Stand-Alone Microgrids With Electric Vehicles. IEEE Trans. Ind. Electron. 2017, 65, 7416–7422. [Google Scholar] [CrossRef]
  4. Ahmed, M.; Meegahapola, L.; Vahidnia, A.; Datta, M. Stability and Control Aspects of Microgrid Architectures—A Comprehensive Review. IEEE Access 2020, 8, 144730–144766. [Google Scholar] [CrossRef]
  5. Gheisarnejad, M.; Khooban, M.H. Secondary load frequency control for multi-microgrids: HiL real-time. Soft Comput. 2019, 23, 5785–5798. [Google Scholar] [CrossRef]
  6. Nayak, P.C.; Prusty, U.C.; Prusty, R.C.; Panda, S. Imperialist competitive algorithm optimized cascade controller for load frequency control of multi-microgrid system. Energy Sour. Part A Recover. Util. Environ. Eff. 2021, 1–23. [Google Scholar] [CrossRef]
  7. Pannala, S.; Patari, N.; Srivastava, A.K.; Padhy, N.P. Effective Control and Management Scheme for Isolated and Grid Connected DC Microgrid. IEEE Trans. Ind. Appl. 2020, 56, 6767–6780. [Google Scholar] [CrossRef]
  8. Wu, X.; Xu, Y.; He, J.; Wang, X.; Vasquez, J.C.; Guerrero, J.M. Pinning-Based Hierarchical and Distributed Cooperative Control for AC Microgrid Clusters. IEEE Trans. Power Electron. 2020, 35, 9865–9885. [Google Scholar] [CrossRef]
  9. Pham, T.N.; Trinh, H.; Van Hien, L. Load Frequency Control of Power Systems With Electric Vehicles and Diverse Transmission Links Using Distributed Functional Observers. IEEE Trans. Smart Grid 2016, 7, 238–252. [Google Scholar] [CrossRef]
  10. Nayak, P.C.; Bisoi, S.; Prusty, R.C.; Panda, S. Performance Analysis of PDF+(1+PI) Controller for Load Frequency Control of the Multi Microgrid System Using Genetic Algorithm. In Proceedings of the International Conference on Information Technology (ICIT), Amman, Jordan, 9–11 April 2019; Volume 18, pp. 448–453. [Google Scholar]
  11. Khadanga, R.K.; Kumar, A.; Panda, S. Frequency control in hybrid distributed power systems via type-2 fuzzy PID controller. IET Renew. Power Gener. 2020, 15, 1–18. [Google Scholar] [CrossRef]
  12. Mu, C.; Zhang, Y.; Jia, H.; He, H. Energy-Storage-Based Intelligent Frequency Control of MicrogridWith Stochastic Model Uncertainties. IEEE Trans. Smart Grid 2020, 11, 1748–1758. [Google Scholar] [CrossRef]
  13. Wang, Y.; Li, F.; Yu, H.; Wang, Y.; Qi, C.; Yang, J.; Song, F. Optimal operation of microgrid with multi-energy complementary based on moth flame optimization algorithm. Energy Sour. Part A Recover. Util. Environ. Effects 2019, 42, 785–806. [Google Scholar] [CrossRef]
  14. Zhao, H.; Hong, M.; Lin, W.; Loparo, K.A. Voltage and Frequency Regulation of MicrogridWith Battery Energy Storage Systems. IEEE Trans. Smart Grid 2017, 10, 414–424. [Google Scholar] [CrossRef]
  15. Kumar, A.; Khadanga, R.K.; Panda, S. Reinforced modified equilibrium optimization technique-based MS-PID frequency regulator for a hybrid power system with renewable energy sources. Soft Comput. 2021, 26, 5437–5455. [Google Scholar] [CrossRef]
  16. Bevrani, H.; Daneshmand, P.R. Fuzzy Logic-Based Load-Frequency Control Concerning High Penetration of Wind Turbines. IEEE Syst. J. 2011, 6, 173–180. [Google Scholar] [CrossRef]
  17. Khadanga, R.K.; Kumar, A.; Panda, S. A novel sine augmented scaled sine cosine algorithm for frequency control issues of a hybrid distributed two-area power system. Neural Comput. Appl. 2021, 33, 12791–12804. [Google Scholar] [CrossRef]
  18. Nayak, P.; Prusty, R.; Panda, S. Grasshopper optimization algorithm optimized multistage controller for automatic generation control of a power system with FACTS devices. Prot. ControlModern Power Syst. 2021, 6, 1–15. [Google Scholar]
  19. Murugan, S.; Jaishankar, M.; Premkumar, K. Hybrid DC–AC Microgrid Energy Management System Using an Artificial Gorilla Troops Optimizer Optimized Neural Network. Energies 2022, 15, 8187. [Google Scholar] [CrossRef]
  20. Li, Z.; Shahidehpour, M.; Alabdulwahab, A.; Abusorrah, A. Bilevel Model for Analyzing Coordinated Cyber-Physical Attacks on Power Systems. IEEE Trans. Smart Grid 2015, 7, 2260–2272. [Google Scholar] [CrossRef]
  21. Sekar, K.; Arasan, E.; Chandrasekaran, K. Grey Wolf Optimization and Fed Fast Terminal Sliding Mode Controllers Based on Interleaved Boost Converters for Symmetric PV Systems under Asymmetric Partial Shading. Symmetry 2023, 15, 1339. [Google Scholar] [CrossRef]
  22. Govindaraju, S.K.; Sivalingam, R.; Panda, S.; Sahu, P.R.; Padmanaban, S. Frequency Control of Power System with Distributed Sources by Adaptive Type 2 Fuzzy PID Controller. Electr. Power Compon. Syst. 2023, 1–22. [Google Scholar] [CrossRef]
  23. Raghuraman, S.; Subramani, C.; Dash, S. A modified whale optimization algorithm-based adaptive fuzzy logic PID controller for load frequency control of autonomous power generation systems. Automatika 2017, 58, 410–421. [Google Scholar]
  24. Raghuraman, S.; Subramani, C.; Dash, S. A hybrid stochastic fractal search and local unimodal sampling based multistage PDF plus (1+PI) controller for automatic generation control of power systems. J. Franklin Inst. 2017, 354, 4762–4783. [Google Scholar]
  25. Khokhar, B.; Dahiya, S.; Parmar, K.S. Load frequency control of a microgrid employing a 2D Sine Logistic map based chaotic sine cosine algorithm. Appl. Soft Comput. 2021, 109, 107564. [Google Scholar] [CrossRef]
  26. Abou El-Ela, A.A.; El-Sehiemy, R.A.; Shaheen, A.M.; Diab, A.E.G. Design of cascaded controller based on coyote optimizer for load frequency control in multi-area power systems with renewable sources. Control Eng. Pract. 2022, 121, 105058. [Google Scholar] [CrossRef]
  27. Shayeghi, H.; Rahnama, A.; Alhelou, H.H. Frequency control of fully-renewable interconnected microgrid using fuzzy cascade controller with demand response program considering. Energy Rep. 2021, 7, 6077–6094. [Google Scholar] [CrossRef]
  28. Irudayaraj, A.X.R.; Wahab, N.I.A.; Umamaheswari, M.G.; Radzi, M.A.M.; Sulaiman, N.B.; Veerasamy, V.; Prasanna, S.C.; Ramachandran, R. A Matignon’s Theorem Based Stability Analysis of Hybrid Power System for Automatic Load Frequency Control Using Atom Search Optimized FOPID Controller. IEEE Access 2020, 8, 168751–168772. [Google Scholar] [CrossRef]
  29. Padhy, S.; Panda, S. Application of a simplified Grey Wolf optimization technique for adaptive fuzzy PID controller design for frequency regulation of a distributed power generation system. Prot. Control Mod. Power Syst. 2021, 6, 1–6. [Google Scholar] [CrossRef]
  30. Sharma, M.; Dhundhara, S.; Arya, Y.; Prakash, S. Frequency stabilization in deregulated energy system using coordinated operation of fuzzy controller and redox flow battery. Int. J. Energy Res. 2020, 45, 7457–7475. [Google Scholar] [CrossRef]
  31. Abdollahzadeh, B.; Gharehchopogh, F.S.; Mirjalili, S. Artificial gorilla troops optimizer: A new nature-inspired metaheuristic algorithm for global optimization problems. Int. J. Intell. Syst. 2021, 36, 5887–5958. [Google Scholar] [CrossRef]
  32. Pan, I.; Das, S. Fractional Order AGC for Distributed Energy Resources Using Robust Optimization. IEEE Trans. Smart Grid 2015, 7, 2175–2186. [Google Scholar] [CrossRef]
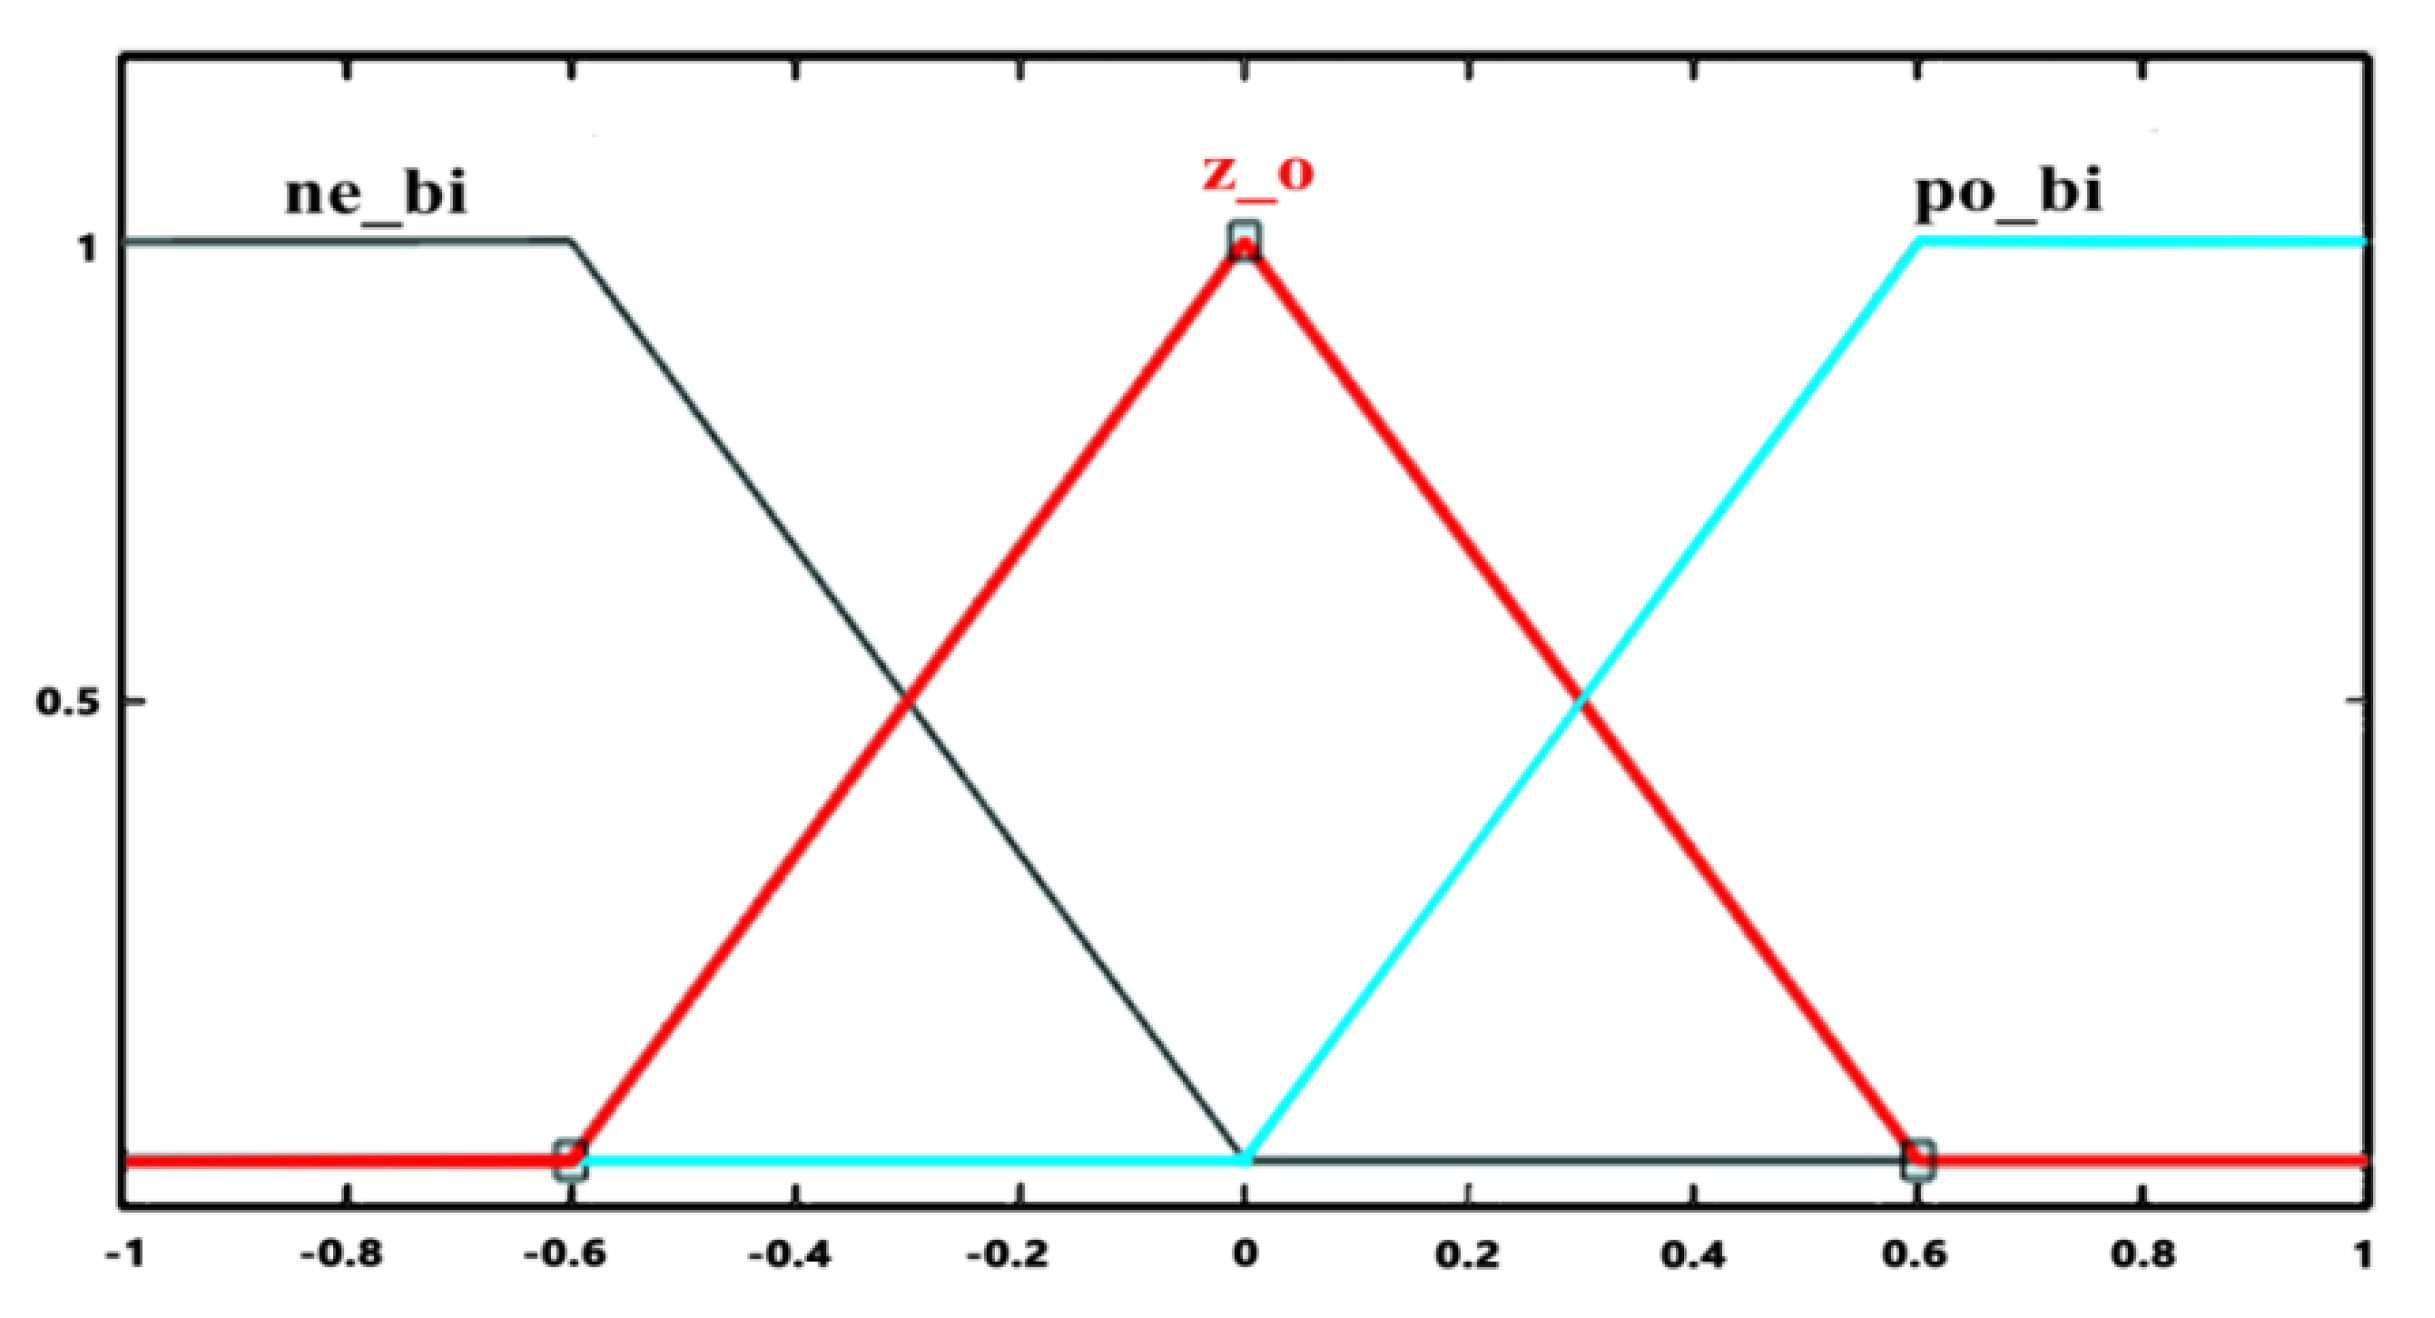
Figure 1. Smart grid system under study.
Symmetry 15 02013 g001
Figure 2. Fuzzy PD-(1+PI) configuration.
Symmetry 15 02013 g002
Figure 3. Membership functions of error and derivative of error of FLC.
Symmetry 15 02013 g003
Figure 4. Flow chart of iGTO algorithm.
Symmetry 15 02013 g004
Figure 5. Convergence characteristic of iGTO and GTO.
Symmetry 15 02013 g005aSymmetry 15 02013 g005b
Figure 6. Frequency response with PID showing comparison of techniques.
Symmetry 15 02013 g006
Figure 7. System response for Case1: (a) ΔPRW, ΔPL, ΔPDF, (b) ΔF, (c) ΔPFESS, ΔPBESS, ΔPDEG, ΔPEV.
Symmetry 15 02013 g007aSymmetry 15 02013 g007b
Figure 8. System response for Case 2: (a) ΔPPV, ΔPWTG, ΔPRW, ΔPL, (b) ΔF, (c) ΔPFESS, ΔPBESS, ΔPDEG, and ΔPEV.
Symmetry 15 02013 g008aSymmetry 15 02013 g008b
Figure 9. System response for Case 3.
Symmetry 15 02013 g009
Table 1. Fuzzy rule base for FLC.
e\e*ne_biz_opo_bi
ne_bine_bine_biz_o
z_one_biz_opo_bi
po_biz_opo_bipo_bi
Table 2. Benchmark functions.
Function NameExpressionRangeD
Sphere F1 U F 1 y = i = 1 n y i 2 [−100, 100]30
Schwefel-1 F2 U F 2 y = i = 1 n y i + i = 1 n y i [−10, 10]30
Schwefel-2 F3 U F 3   y = i = 1 n j 1 i y j 2 [−100, 100]30
Schwefel-3 F4 U F 4 y = m a x i { y i , 1 i n } [−100, 100]30
Quartic F7 U F 5 y = i = 1 n i y i 4 + r a n d o m [ 0,1 ) [−1.28, 1.28]30
Generalized Rastrigin F9 M F 1 y = i = 1 n y i 2 10 cos 2 π y i + 10 [−5.12, 5.12]30
Ackley F10 M F 2 y = 20 exp 0.2 1 n i = 1 n y i 2 e x p 1 n i = 1 n c o s 2 π y i + 20 [−32, 32]30
Generalized Griewank F11 M F 3 y = 1 4000 i = 1 n y i 2 j = 1 n c o s y i i + 1 [−600, 600]30
Kowalik F15 M F 4 y = i = 1 11 a i y 1 ( b i 2 + b i y 2 ) b i 2 + b i y 3 + y 4 2 [−5, 5]4
Six-Hump Camel-Back F16 M F 5 y = 4 y 1 2 2.1 y 1 4 + 1 3 y 1 6 + y 1 y 2 4 y 2 2 + 4 y 2 4 [−5, 5]2
Table 3. Results for benchmark functions.
FunctionIndicesiGTOGTOGJOGWOGSAPSOTLBOALO
U F 1 y
(Min = 0)
Best01.94 × 10−1702.83 × 10−461.22 × 10−231.57 × 10−091.63 × 10−102.59 × 10−431.23 × 10⁻⁶
Worst2.16 × 10−3002.07 × 10−1476.4 × 10−402.97 × 10−201.53 × 10−062.09 × 10−075.1 × 10−412.72 × 10⁻⁵
Ave.7.23 × 10−3026.91 × 10−1496.3 × 10−413.37 × 10−217.21 × 10−093.42 × 10−081.03 × 10−419.09 × 10⁻⁶
SD03.77 × 10−1481.51 × 10−406.45 × 10−213.78 × 10−095.35 × 10−081.47 × 10−417.74 × 10⁻⁶
U F 2 y
(Min = 0)
Best 1.64 × 10−1786.68 × 10−852.28 × 10−253.75 × 10−141.66 × 10−41.5 × 10−51.38 × 10−227.28 × 10⁻⁴
Worst9.92 × 10−1604.21 × 10−762.17 × 10−222.99 × 10−134.45 × 10−47.56 × 10−47.83 × 10−2133.87
Ave.5.47 × 10−1611.94 × 10−772.23 × 10−236.12 × 10−132.42 × 10−41.18 × 10−41.53 × 10−215.08
SD1.89 × 10−1607.76 × 10−774.3 × 10−237.08 × 10−135.91 × 10−51.14 × 10−41.45 × 10−217.81
U F 3 y
(Min = 0)
Best 01.74 × 10−1653.69 × 10−268.64 × 10−111.85 × 10−22.66 × 10−32.13 × 10−190.701
Worst6.44 × 10−2943.27 × 10−1441.6 × 10−193.38 × 10−737.291.41 × 10−11.94 × 10−161551.35
Ave.2.23 × 10−2962.26 × 10−1461.51 × 10−202.4 × 10−87.112.43 × 10−22.99 × 10−17294.37
SD07.39 × 10−1453.53 × 10−206.89 × 10−810.012.89 × 10−24.9 × 10−17353.97
U F 4 y
(Min = 0)
Best 2.42 × 10−1702.62 × 10−834.93 × 10−185.52 × 10−82.93 × 10−57.06 × 10−41.77 × 10−189.39 × 10⁻³
Worst6.62 × 10−1505.89 × 10-75 4.66 × 10-158.25 × 10-68.95 × 10-53.74 × 10-23.51 × 10-1714.68
Ave.2.21 × 10−1512.24 × 10−761.28 × 10−151.08 × 10−66.25 × 10−51.01 × 10−27.68 × 10−183.26
SD1.21 × 10−1501.07 × 10−751.27 × 10−151.64 × 10−61.56 × 10−58.42 × 10−37.04 × 10−183.62
U F 5 y
(Min = 0)
Best 1.62 × 10−061.64 × 10−056.73 × 10−052.35 × 10−42.85 × 10−34.79 × 10−33.41 × 10−31.59 × 10⁻²
Worst3.15 × 10−047.27 × 10−042.85 × 10−34.69 × 10−33.67 × 10−23.55 × 10−23.162 × 10−31.75 × 10−1
Ave.1.21 × 10−042.07 × 10−047.77 × 10−41.37 × 10−31.58 × 10−21.81 × 10−21.71 × 10−36.65 × 10−2
SD9.96 × 10−051.68 × 10−040.0006571.06 × 10−37.91 × 10−37.87 × 10−37.19 × 10−43.68 × 10−2
M F 1 y
(Min = 0)
Best 00 00 0.994961 2.992063 0.013259 7.95967
Worst00 18.137749.140608 14.92438 16.24605 14.22896 49.74783
Ave.00 0.6045912.653841 7.429027 8.659233 5.500317 23.74631
SD00 3.3114832.834879 3.404116 3.173189 3.437944 11.01983
M F 2 y
(Min = 0)
Best 8.88 × 10−168.88 × 10−164.44 × 10−152.08 × 10−128.09 × 10−51.07 × 10−54.44 × 10−155.57 × 10⁻⁴
Worst8.88 × 10−168.88 × 10−167.99 × 10−151 × 10−101.88 × 10−44.44 × 10−47.54 × 10−155.191245
Ave.8.88 × 10−168.88 × 10−164.8 × 10−152 × 10−111.22 × 10−41.51 × 10−44.9 × 10−151.389097
SD001.08 × 10−152.13 × 10−112.7 × 10−51.15 × 10−41.9 × 10−151.345589
M F 3 y
(Min = 0)
Best 00 00 2.166916.15 × 10−20 5.52 × 10⁻²
Worst00 0.1736430.101945 11.33721 3.00736 9.65 × 10−20.32496
Ave.00 1.32 × 10−22.98 × 10−25.60349 0.9394 1.65 × 10−20.179803
SD00 3.9472 × 10−20.026988 2.647036 0.760557 2.3714 × 10−27.5028 × 10−2
M F 4 y
(Min = 3 × 10⁻⁴)
Best 3.074 × 10−043.075 × 10−043.13 × 10−43.38 × 10−49.23 × 10−43.43 × 10−43.07 × 10−46.27 × 10−4
Worst5.84 × 10−041.51 × 10−32.04 × 10−22.10 × 10−21.40 × 10−21.35 × 10−32.04 × 10−22.11 × 10⁻²
Ave.3.24 × 10−043.68 × 10−041.40 × 10−32.65 × 10−33.42 × 10−38.74 × 10−41.76 × 10−32.66 × 10−3
SD5.14 × 10−052.32 × 10−041.47 × 10−46.08 × 10−33.24 × 10−31.91 × 10−45.06 × 10−33.67 × 10−3
M F 5 y
(Min = −1.0316)
Best −1.0326−1.0326−1.03163−1.03163−1.03163−1.03163−1.03163−1.03163
Worst−1.0326−1.0326−1.03162−1.03163−1.03163 −1.03163 −1.03163 −1.03163
Ave.−1.0326−1.0326−1.03163−1.03163−1.03163 −1.03163−1.03163 −1.03163
SD001.63 × 10−61.28 × 10−71.56 × 10−105.38 × 10−165.61 × 10−163.17 × 10⁻¹³
Table 4. Tuned controller values.
Method/Controller K1 K2 Kp KI KD KppJ Value
GA:PID--1.29191.12050.4004-4.3437
PSO:PID--1.19291.17810.8990-3.3486
GTO:PID--1.28450.99900.8657-3.2751
iGTO:PID--1.67511.47431.3569-2.2011
iGTO:FPID1.51161.86551.17641.54990.0683-1.1935
iGTO:FPD-(1+PI)1.35050.08981.62621.41802.18810.18430.9417
Disclaimer/Publisher’s Note: The statements, opinions and data contained in all publications are solely those of the individual author(s) and contributor(s) and not of MDPI and/or the editor(s). MDPI and/or the editor(s) disclaim responsibility for any injury to people or property resulting from any ideas, methods, instructions or products referred to in the content.

