1. Introduction
Bolted connections are among the most used machine components and are practically irreplaceable in technical practice. It might seem that nowadays this issue is already clarified, but the opposite is true. It is the commonness and experience of this component that leads many to the opinion that the bolt is a simple machine component that can also be easily calculated in terms of strength. In engineering practice, rather primitive calculations are sometimes used. Often a simple bolted joint diagram is used, but no attention is given to the correct definition of the components stiffness. It is necessary to define exactly which parts of the bolted connection are further compressed by the operating force and which are, on the opposite, relieved. It is also very important to define the position of the operating force in relation to the contact surface of the flanges and the bolt axis. In terms of stress distribution, the bolt itself is a very complex component. The situation becomes even more difficult if it is a multi-bolted joint with complicated (asymmetrical) flange shapes or complex operating force applications in critical ambient conditions (e.g., intercoolers in nuclear power plants, pressure vessels in the petrochemical and chemical industries, automotive components, etc.). Pre-tensioned bolted joints are often critically stressed and are often part of critical equipment. The progress of these devices has not stopped nowadays, and for this reason it is very important to continue research in the field of bolts, which are an integral part of them.
The issue dealt with in this article arose based on requirements made by the rolling mill operator. The aim was to determine the rolling forces generated during the passage of rolled products through the rollers. The initial solution was to propose a suitable methodology for measuring this load without the need for any significant modification of the existing mill structure. Two measurement methods were considered, namely installing a commercial force sensor or installing strain gauges on a suitable part of the structure.
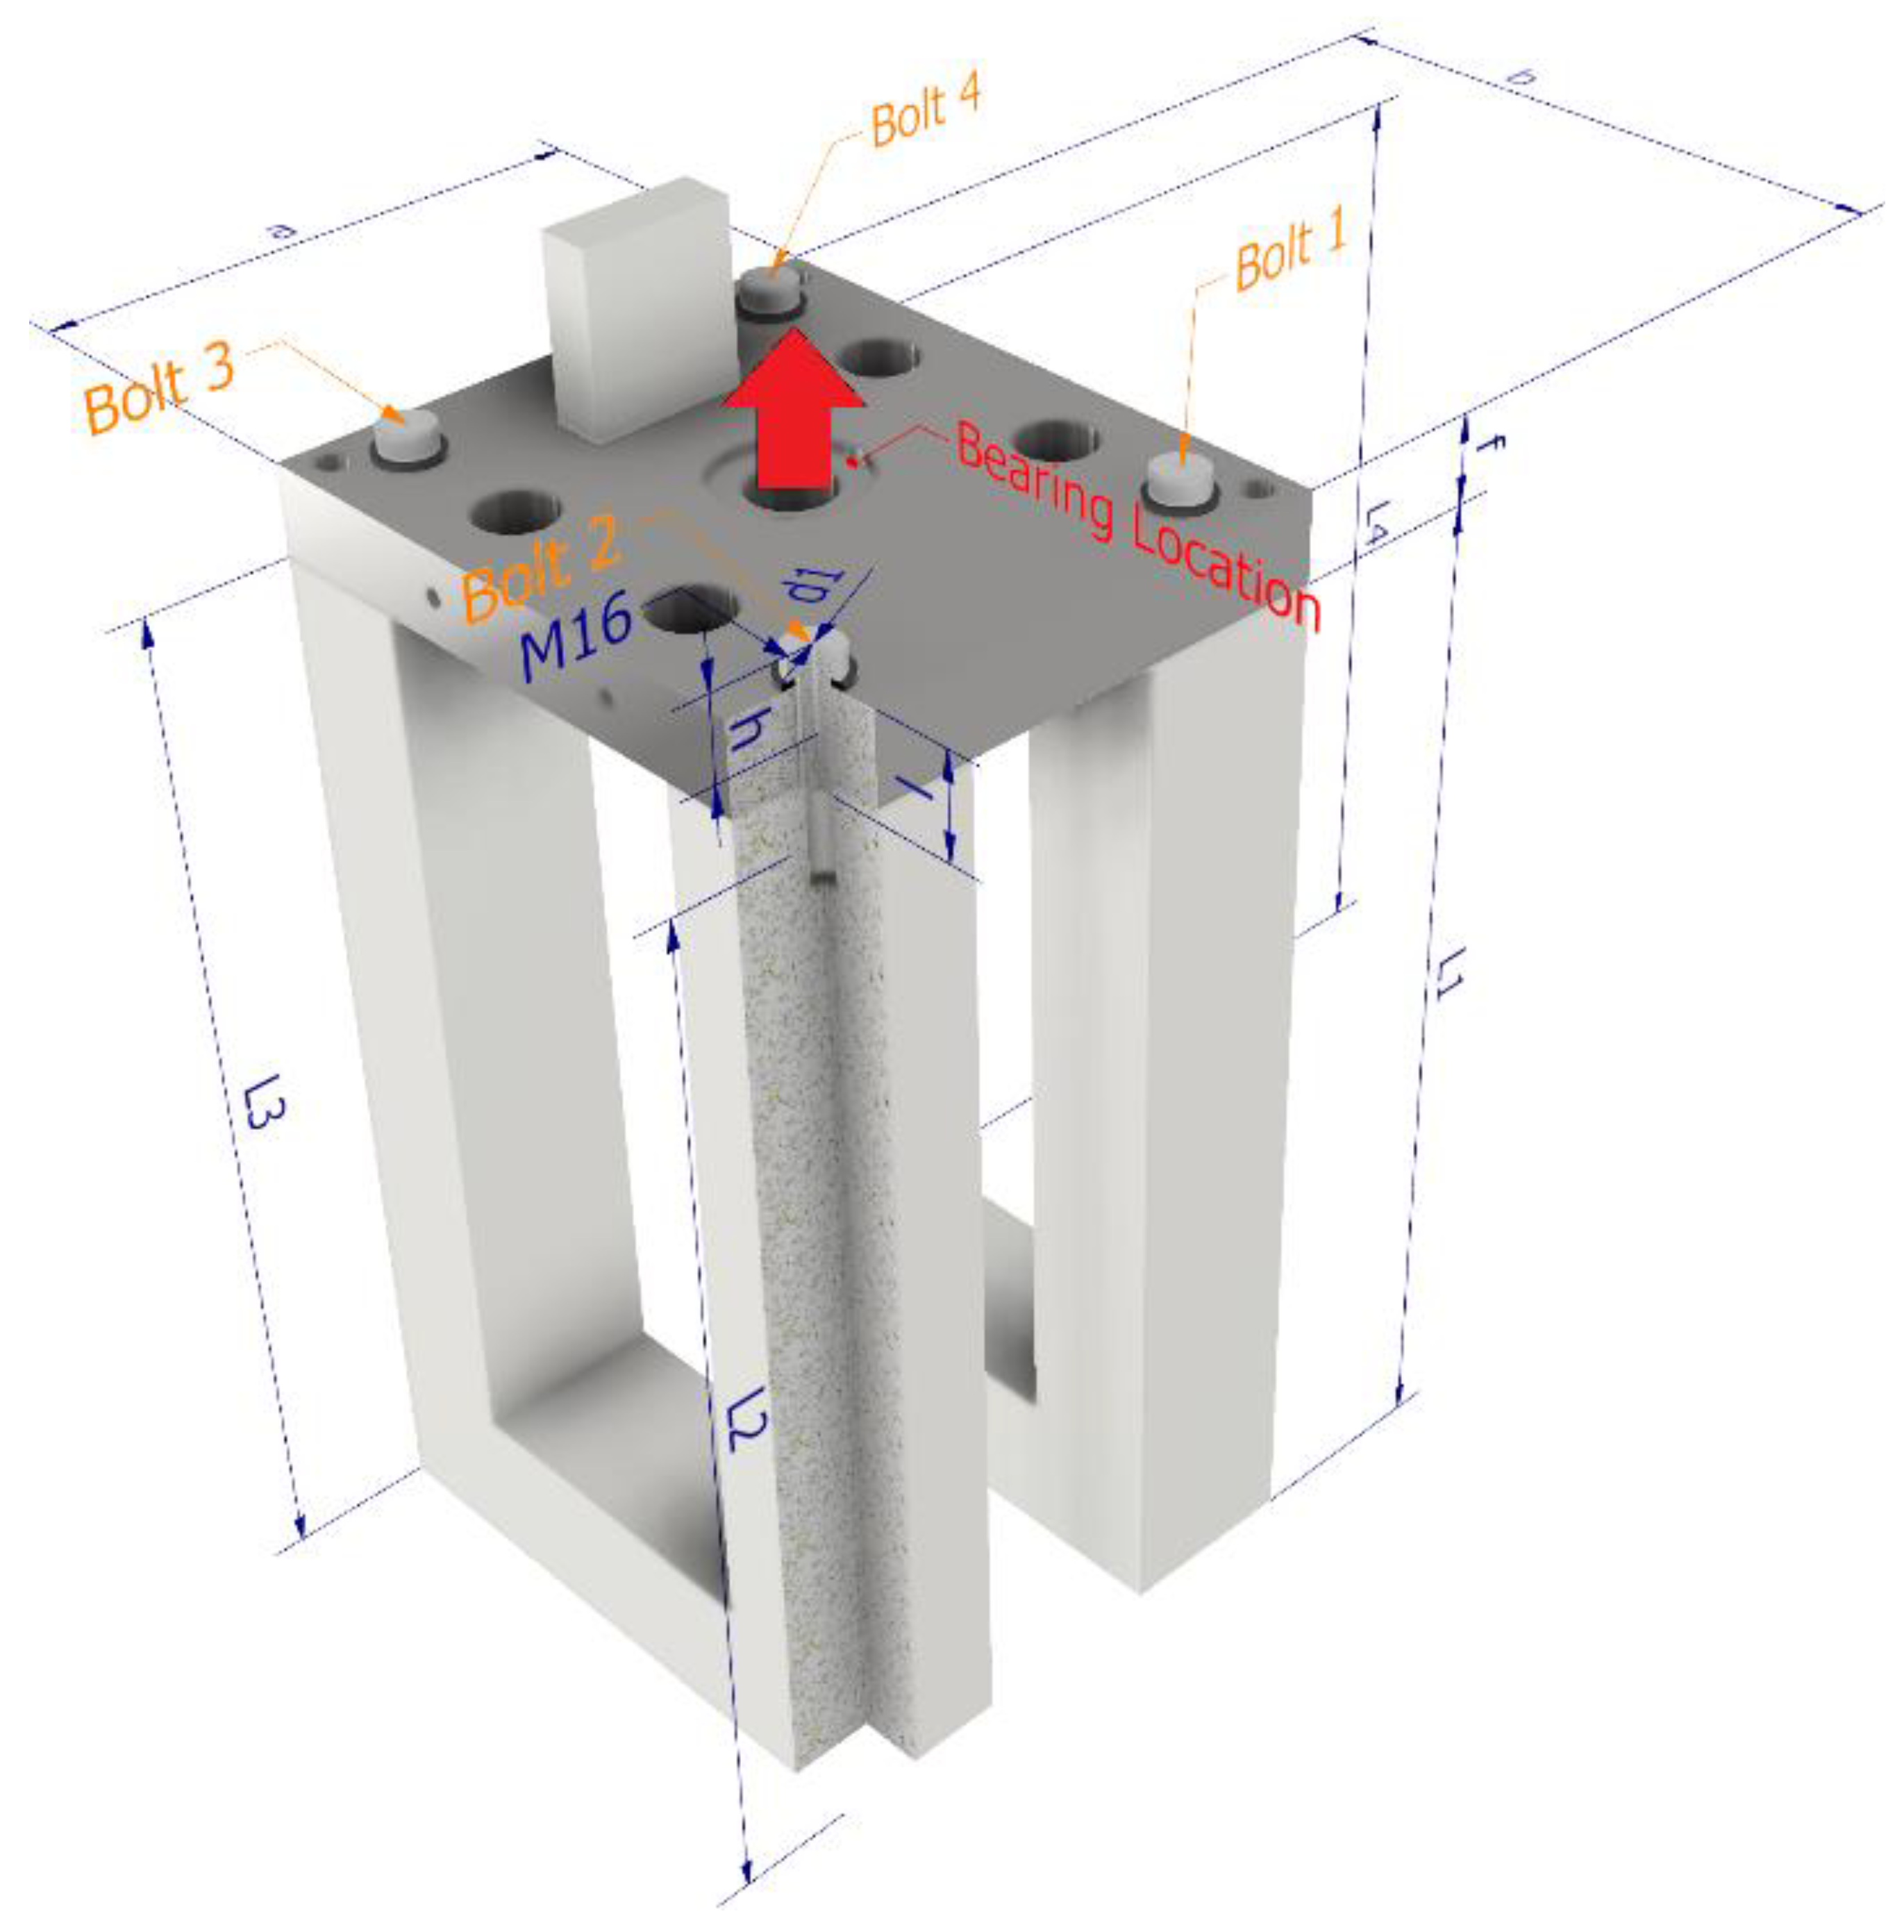
For this rolling mill, the model of which is displayed in
Figure 1, the pressure force of the rollers is generated by the central bolt and nut in bearing location. All connected parts of the rolling mill were made of S355J2G3 steel.
In the area of this bolt placement, no suitable space was found either for the installation of the sensor, if the bearing plate was not reconstructed, or for the strain gauges. Another suitable place to mount strain gauges was on the four legs of the frame. However, this option was rejected due to relatively little expected stress values and thus the small values of the signal from the strain gauges. Another reason was the installation of a number of holders for other technological equipment and covers that, as result, changed the stiffness of these legs and brought considerable uncertainty to the resulting value of the measured forces. Finally, four M16 bolts with property class 8.8 were used for measurements, which symmetrically attached the top plate to the legs of the frame.
As part of the research into the current state of the field of bolted joints, the first phase of the literature search focused on various methods of measuring bolt preload other than the use of strain gauges, such as using ultrasound, piezoelectric sensors, special impact testing of a bolt head [
1] or using automatic digital image correlation [
2]. However, it is necessary to consider the fact that the measurement will take place during operation (i.e., there is influence of dynamic impacts, noise, vibrations). Furthermore, the aim would be to achieve low production costs.
As part of the research of the current state of the field of bolted joints, the literature focusing on various alternative measurement methods, such as in [
1,
2], was investigated in the first phase. In the following, the study of literature sources focused on existing theoretical calculation procedures, which are presented, e.g., in [
3] and [
4]. Attention was also given to new methods of calculations as reported by Y. Tian [
5]. Previous research on the effect of the asymmetry of a multi-bolted connection on the asymmetry of the connected pressure vessel shell has also provided an important basis for solving the problem, see [
6]. A key source of information is the book by F. Pospisil [
7], which is still one of the most detailed summaries of knowledge about bolted connections based on experiments and practical experience. Numerical calculation methods (FEM), as an alternative to existing theoretical approaches, have also been studied further in [
8,
9,
10]. It has also proved very appropriate to combine the numerical approach with the experimental one as did T. Benhaddou [
11]. For the simplified FE computational model, the information in [
12] was helpful. The FEM calculations verified the nature of the stress flow with the already known assumptions given in the literature [
13,
14]. This step served mainly as a verification of the correctness of the computational model. An important section in the development of the computational model was also its simplification. For this purpose, the information presented in [
15,
16,
17], which describes the load and stress behavior across the contact threaded region of the bolt, was very useful. Other references were crucial in terms of the design and execution of the experiment, e.g., basic information [
18] or advanced information from N. Fric [
19] about the limitations of strain gauging when using internal strain gauges in bolts. Publications [
20,
21,
22] dealing with the issue of bolt tightening accuracy (achieving bolt preload) were also examined. This information serves mainly to show the scope of the bolted connections issue. Furthermore, this knowledge was used to design the first phase of the experiment, which was precisely the verification of the achieved bolt pre-tension. Since bolted connections have a wide range of applications, it was easy to get into areas that are far from the topic of the article at first view. As an example, in reference [
23], they dealt with the problem of a bolt fasten wedge active joint for braced excavations. However, it is in this paper that one can see the asymmetric behavior of loads with relation to bolts for apparently symmetric components. The limitation of the measurements by a single strain gauge placed on the outer shell of the bolt shank is also well seen. Additionally, there have been publications by P. Sharos [
24] and V. Belardi [
25]. In one paper [
24], a finite-element model capable of modeling bolted joints under different loading rates was proposed. The design was made for an epoxy composite material joint with carbon fibers. The bolt material was defined as titanium alloy. Furthermore, a shear quasi-static load of up to 10 m/s perpendicular to the bolt axis was applied. The elements of the computational model were designed as shells. However, the problem solved in this paper differs not only in the material (all elements are steel) but also in the loading, which is time independent and, in a direction, parallel to the bolt axis. In addition, the ANSYS software, which is used here, has a custom object used to efficiently solve bolted connections. Another approach to solving composite bolted joints using FE modelling, which are loaded by a force perpendicular to the bolt axis, is presented in [
25]. However, here the relationship between the bolt and the plates has been modelled as a beam on an elastic base.
The main aim of this article is to examine the issue of symmetry deviations of clamped parts (see
Figure 1) in the calculation of pre-tensioned bolt joints loaded with an operating load parallel to the bolt axis. Preloaded bolted joints are usually highly stressed machine components. Thus, even seemingly small effects of the asymmetry of the clamped assembly can have a significant effect on the reliability and safety of the component. Using experiments and FEM, some influence of asymmetry has been demonstrated. This knowledge can be particularly useful for applications where critically loaded bolted joints are involved. The results obtained have been described in more detail in the conclusion.
2. Description of the Basic Approach to Solving Bolted Joints
The use of bolts to provide measurements of the operating force, in this case, offers a number of advantages, such as sufficiently large measured stresses, the possibility to prepare measuring bolts in laboratory conditions, and the control of the real achieved pre-tension. Nevertheless, it is also related to the need for an analytical recalculation of the measured values, which can introduce some inaccuracies into the measurement.
Theoretical recalculation is commonly used and seems to be a very simple method. The basic procedure is given, for example, in [
3] or in [
4]. The basic principle is that the operating load
F acting on the tightened bolt (see
Figure 2) is not reflected in its entirety in the bolt load
FS, but only a part of it (another part is also reflected in the clamping of the flanges
FF). The size of this part depends on the stiffness of both the bolt and the compressed parts (hereinafter referred to as the “flange“). Stiffness is defined here as the ratio of force
F to the current deformation, i.e., the compression of the flange or stretching of the bolt by Δ
l.
The basic principle of the simplified theoretical calculation can also be clearly seen in the bolted connection diagram (see
Figure 3), which is used to depict the force and deformation relationships in a prestressed bolted connection. The bolted joint diagram is in principle based on the stress–strain curve of the material, but only for the linear region (up to the proportional limit). In the elastic limit region, both the stiffness angle
α and the modulus of elasticity
E are constant. The final form of the diagram was obtained by combining the stiffness lines of the tension-loaded components (
a-line for bolt) with the stiffness line for the compression-loaded components (
b-line for flanges) so that the sum of their deformations (Δl
S, Δl
F) is the deformation of the whole system Δ
l. For this purpose, the stiffness line of the compressed parts is moved to point
C where the prestressing effect
FB is the same, only with the opposite load polarity (see
Figure 3). Then, Δ
FS is the force increase in the bolt and ΔF
FF is the clamping force decrease in the contact between the flanges. The force
F represents the operating tensile load. The
FS is the total force in the bolt during operation. The parameter F
F is the residual clamping force in the flange contact, which also characterizes the tightness of the joint. In the case of the example shown in
Figure 3, it is possible in principle to calculate the stiffness of bolt
CS and flange
CF using the following general relations:
where:
CS Bolt stiffness
CF Flange stiffness
E Modulus of elasticity defined by a low index
S Load bearing (deformable) cross-section defined by a low index
α Angle of inclination for stiffness line, defined by a low index
The low index “S” is the designation for the bolt and low index ”F” is for the flange.
In the case of Force [N], a variable cross section along the length of the bolt, the total elongation or shortening λ is calculated as:
FB Pre-tensioning of the bolt
ES Modulus of elasticity of the bolt
l Analyzed axial length
Sx Elementary axial surface of the shape
Y The entire surface of the shape
For a bolt with a simple shape, the calculation can be simplified by dividing the bolt into sections of the same cross section. The resulting stiffness of the entire bolt is then determined from the sum of the elastic compliances of the partial sections according to the relationship:
where:
CS Bolt stiffness
ES Modulus of elasticity of the bolt
li Partial lengths of the bolt parts
Si Relevant load-bearing cross-sections
The bolt head in this case is calculated as an extension of the diameter under the head up to 2/3 of the head height, in the case of a thread as an extension of the threaded part by 1/2 of the matrix height (see
Figure 4).
In the case of flanges, the determination of stiffness is a bit more complex, as only a part of the flange in close proximity to the bolt-bearing surface is involved in the deformation due to pre-tensioning. Most often, the deformed area is approximately bounded by the so-called Bach’s double cone (frustum double cone) joint with the angle of inclination of 45° for steels. It should be stated that in reality, the size of this angle (see
Figure 5) can differ. Moreover, this angle is very important from a technical point of view and also serves as a basis for new calculation methodologies, e.g., see [
5]. However, this issue will be described in more detail in
Section 3. For the calculation, this double cone can be simply replaced by a Rötscher cylinder (dashed line in
Figure 5) with an internal diameter corresponding to the drilled hole
Do and outer dimension
DR.
where:
DR Outer dimension of Rötscher cylinder
s Outer diameter of of bearing surface (Width across flats)
α Angle of frustum double cone
The area of the Rötscher frustum cone envelope is then:
where:
DO Diameter of drilled hole
l Clamped length
It is therefore a simplified calculation for the cases where it is not possible to determine the stiffness of the flanges in any other way. More accurate values can be obtained either by experiment or using Finite Element Method (FEM) analysis. Complications arise if the bolt joint is not equipped with a nut and is tightened into a threaded hole (
Figure 6), which was the case that was being sold.
The distribution of stress is more complex and its replacement using Bach´s double cone joint is then rather speculative. Only a one-sided cone in the direction of the drilled bolt head is considered (see
Figure 7).
Then the relationship applies:
Note. All symbols in Equation (7) correspond to the description in Equation (6).
However, there is another issue. The size of the force increase in the bolt
ΔFS (see
Figure 3) from the operational force is not dependent only on the stiffnesses
CS and C
F. Previous research in the field of flanges (especially circular) joints has shown that the behavior of the load force in the bolt is also influenced by the position of the point of the operational force, see [
7] (p. 161) and [
6]. This location may be subject to change during operation, especially in the case of joints where significant deformations occur due to the operating load (e.g., the flange joints of thin-walled vessels). Even more complicated is the situation when using a gasket that can change its stiffness nonlinearly (according to the material used) depending on the load, allowing for even greater deformation. In addition, the gasket is permanently deformed. In the area of the circular joints of pressure vessels, it turned out that the asymmetry of the connected envelope also has a significant influence on the magnitude of the operating force in the bolt. A detailed description of this issue is given in [
6].
The diagram of the pre-tensioned bolt connection shown in
Figure 3 assumes an unchanged stiffness between the mounting and operating states. It also assumes that the bolt is lengthened (loaded) by the operating force, while the flanges are only lightened. Operating loads directly affect the bearing surface of the bolt head and its nut. This is a very simplified case that rarely occurs in practice. In reality, the assembly and operation diagrams may differ (usually such diagrams are displayed together). This difference can be due, for example, to a change in ambient temperature, or the already mentioned change in the point of application of the operating force in relation to the mounting pre-tensioning. Thus, there can be also a change in the parts that are further loaded due to the operating load and the parts that in turn are lightened. Defining the stiffness of loaded or lightened parts is not easy, and, in some cases, is not even theoretically possible [
7] (p. 164). This also prevents an accurate recalculation of the force increment parameter in the bolt
ΔFS, which in our case is necessary for the calculation of the resulting rolling force
F (see
Figure 8). The above-mentioned aspects greatly influenced the following steps of the experiment preparation.
3. Finite Element Analysis of Force Behavior in the Bolt
As mentioned earlier, the special design of the rolling mill did not allow us to make an experimental determination directly to find the magnitude of the operating rolling force. It was necessary to measure the influence of this force on partial increases in forces acting in the bolt and then recalculate them. As a result of certain concerns about the behavior of the force in the bolt that is in operation, mentioned in
Section 2, it was decided that the recalculation would not be carried out based on the theory mentioned in
Section 2, but FE analysis using ANSYS software will be carried out.
This method of solution is typical for similar more complex cases of loading of multi-bolt connections, either for assembly or operating conditions [
8,
9]. An example of how the finite element method can be useful in improving or replacing existing calculation methods of a bolted connection of an end-plate cantilever beam can be found, for example, in [
10]. Especially if it is combined with measurement in real conditions, i.e., with an experiment, the numerical approach has also proven successful in solving the effect of axial preload on the fatigue life of fastened joints in the aerospace industry [
11]. Thus, in the first phase, a calculation model was created (see
Figure 8).
Ideal geometry of Solid type was used for modelling, without considering the clearances in contacts, production inaccuracies, bolt threads, etc. The threaded part of the bolt was replaced by a cylinder with a diameter of 13.546 mm, which corresponds to the minor diameter of M16 bolt size. Contacts were set up as Frictional support with a coefficient of friction of 0.1. A shear friction coefficient of 0.2 was set between the contact surfaces of the leg and the pressure plates. To connect bolts with the individual legs, a binding Bonded was used. The base of the legs for the rolling mill was anchored using a Fixed Support. Pre-tensioning in the bolts was carried out using the object Bolt Pre-tension, which splits a bolt into two parts joined by a constraint of equations to define the tension behavior. Pre-tensioning of the bolt FB for assembly status was always set to 60,000 N. The bolt preload value was determined on the basis of the prescribed tightening torque specified in the operating documentation of the equipment.
Figure 9 shows the mesh character used in the computational model. A higher order 3D 20-node solid element that exhibits quadratic displacement behavior was used to create the mesh, or ossibly a high-order 3D, 10-node element if there was no other option. The maximum element size for the legs and flange was set to 8 mm, for the bolts and washers the maximum element size was set to 2 mm. The analysis of mesh convergence was performed by varying the size of the mesh until it was proven that the size of the elements had no significant effect on the results. It should be taken into account that in this case the primary result is not the stress flow, but the value of the change in the working force in the bolt. It is assumed that in this case the effect of mesh size is not as impactful with regard to the results.
Figure 9a depicts the mesh character of the computational model of the coupling assembly.
Figure 9b then shows the mesh on the bolt shank.
The material properties of the computational model are given in
Table 1. A linear elastic model was used for the calculation. Due to the nature of the problem to be solved, no significant influence of the plastic behavior of the material was expected.
The graph (see
Figure 10) shows several ways of behavior of the operating load in the bolt. Progress marked as
Real FEM represents an analysis at the real point of application of the operational force
F as in
Figure 8. The course of
Theoretical FEM 1 then represents only the setting of the location that complies with the theory outlined in
Section 2, thus, even with a diagram from
Figure 3. The point (place) of operational force application is, in this case, identical to the application of pre-tensioning (i.e., the contact of the nut and the flange), see
Figure 11a. The designation
Theoretical FEM 2 was then used for the case when the point of application of the operational force was placed in the contact plane (see
Figure 11b). The course of the
Theoretical line represents a purely theoretical recalculation of the load following the basic theory from
Section 2, i.e., without the use of FEM.
The application of the operating force in the plane of the bearing surface of the nut or bolt head is depicted in
Figure 11a. See
Figure 11b for the plane of action of the operating force identical to the plane of flange contact. For the theoretical recalculation, the following relationships were used:
Assuming a uniform distribution of forces in a symmetrical bolted connection, the following applies:
where:
∆FS Force increase in the bolt
F Total operating load
F1 Operating load to one bolt
CS Bolt stiffness
CF Flange stiffness
For the arrangement of
Figure 11a, the bolt is lengthened by the operating force, while the compression of the clamped parts is equally reduced. Here, the place of the operational force application is identical to the point of pre-tensioning. Examples of the application of the loads depicted in
Figure 11a may include the through bolt connection of a towing eye or crane hook. However, if the point of the operational force application is shifted to the contact surface of the clamped parts (see
Figure 11b), a different situation arises. The operating force action increases the extension of the bolt, but the clamped parts are compressed even more. This arrangement changes the stiffness of both the compressing and compressed parts, which affects the change in the form of the diagram used to describe the operating state. This case may occur in a bolted connection of a heat shield, where the bolt is clamping a thermally influenced sheet metal insert. Another example, according to
Figure 11b, may occur with some special sealed pressure vessel joints (engine head cover) where the pressure of the medium acts on the area of contact being clamped. In the case of conventional pressure vessels, the problem is the one-sided effect of the operating force at the area of the clamped contact.
In the interval from 0 kN to to 30 kN (see
Figure 10) of operating force
F it is clear that force increase in the bolt
∆FS for
Theoretical FEM 1 and
Theoretical assumption, are much higher compared to “
Real FEM” behavior. This means that the overall “real” stiffness of components that are even more stressed due to the operating force (e.g., bolt and nut or screwing area) is lower than theoretically predicted, or components that are unloaded due to operating force (e.g., flanges) have a higher value of real stiffness than expected. If the results were to be compared with true reality, the influence of the thread profile in contact would have to be included, but this influence is not the issue in this graphic comparison (the same simplified model was used here for all cases). Nevertheless, Molnar [
12] states that by simplifying the “bonded” contact, the stiffness of the tested bolt is increased by 9% (tested on M20 and M24 thread size), which should not interfere with a relevant comparison between the numerical model and the actual state in technical practice.
It should be mentioned that
Figure 12 is mainly used for visualization of the stress flow, for this reason the stress legend has been modified. Stresses of magnitude greater than the yield stress of the bolt material (640 MPa) are only negligible in the bolt volume and do not interfere with the linear elastic behavior of the computational model. As shown in
Figure 12, the stress (at F
1 = 8750 N) spreads to the flange at a smaller angle than the assumed 45° (especially in this case between 34° and 38°). Furthermore, many other publications specify this angle for steels less than 45°, e.g., [
13]. This angle can typically be in the range 25° to 33°. The same issue has already been explored in the past. For example, Nassar and Abboud worked together on improving the stiffness model, which is based on a more accurate determination of the effective area of the flange connection (i.e., experimental determination of the strain cone angle) [
14]. In this solved case, according to
Theoretical FEM 1 (see
Figure 12), it would theoretically mean even less flange stiffness and therefore a greater result of increase in force in the bolt. A similar nature of the stress flow was also found for the
Real FEM course and thus a different shape of the frustum cone shell is not important for this comparison, as it is not the main cause of the differences in the nature of the curves (see
Figure 10).
The assumption named
Theoretical FEM 2 is closer to “real” behavior (see
Figure 10), but this is only true for a limited interval (form 0 kN to 25 kN). After that, the curve begins to incline to a larger additional bolt working load. This behavior is probably affected by the characteristics of the total deformation, which is also connected to operating load position against the bolted joint.
The theory further assumes that about one-half of the width of the nut is involved in the stiffness of the bolt. Until the FE analysis was done, it proceeded from the assumption that the first carrier metric thread transfers about 30% of the total load, according to Birger calculation [
7] (p. 91), and together with the other two threads they can share more than 60% of the total load. In the distant past, Birger dealt with this issue for metric threads. Hetenyi [
15], Jehle [
7] (p. 91) and Maduschka [
16] dealt with other types of threads (e.g., Whitworth thread). Relatively recently, this problem was also solved using numerical methods such as FEM [
17]. The results from experimental measurements and calculations are relatively close together. Due to the simplification of the calculation model, where thread profiles were neglected, and only a cylinder with a defined “bonded“ contact was used instead, a screw was used to a depth corresponding to three effective threads.
It has been confirmed that the real behavior of the force increase in the bolt is significantly different compared to the theoretical assumption, despite the fact that at first sight it is a relatively simple, symmetrical, multi-bolted joint (see
Figure 8). This fact is already described in [
7] (p. 164). At the first stage of loading, there is even a decrease in the bolt force (see detail in
Figure 10). This will also be subject to experimental validation. Without the FE analysis, the recalculation of the operating force would be highly implausible.
The obtained dependence showed signs of a power function. With sufficient precision, it was possible to obtain the recalculation equation employing regression (see
Figure 10):
where:
F Total operating load
∆FS Increase in the bolt force
This obtained function should be used to convert from the measured bolt working load to the operating load.
5. Measurement
Before the measurement itself, it would be necessary to perform correct installation of the bolts on the rolling mill (see
Figure 16) and record preliminary data to confirm the correctness of the settings and the polarity of the signal. For technological reasons, the final tightening of the bolts should always be carried out in two steps (see
Table 2).
Figure 17 depicts the first step of tightening. This measurement is also used to check each bolt pre-tension that assemblers are able to achieve in real conditions when using a torque wrench. Because, as is known e.g., in [
20] or in [
21], the assembly tightened by the torque control method can vary considerably in the bolt pre-tension achieved, especially in the case of hand tightening. For that reason, many devices have been developed for complex screw fasteners, as for example in [
22]. With regard to the fact, that result is the final value of the operating load subsequently determined from the additional force in the bolt, not bolt pre-tension, and the accuracy of the achieved preload can be considered sufficient.
This was followed by the measurement of the rolling (operating) forces during the passage of the rolled product. However, the initial measurements already indicated that the theoretical assumptions are not confirmed in the real measurement. All four measured courses should have approximately the same size and polarity, which was only reflected in the signal from bolts 1 and 2 (Channel 1 and Channel 2). The signal from bolt 3 had a significantly larger value and the signal from bolt 4 was significantly smaller and, moreover, negative (see
Figure 18).
This phenomenon was reflected in all 17 records, which necessitated a re-evaluation of the original conversion curves for the calculation of the rolling force.
An example of a symmetrical component, which in reality may not behave completely symmetrically, can be found e.g., in [
23]. Their component was stressed more on one side during the experiment, which also caused the earlier occurrence of a critically stressed bolted joint. However, their numerical simulation no longer included this asymmetry.
The question is what causes similar deviations of apparent symmetry. It can be the eccentricity of the loading device itself, or the deviation in the achieved bolt pre-tension between the bolts or the imperfect geometry of the clamped parts. There is also another question of how to modify a perfect numerical model to reach a better match with reality.
6. Simulation of the Operating Condition Using FEM
By analyzing the operating conditions and measuring the production tolerances on the measuring equipment, it was found that the parallelism of the contact surfaces between the lid and the body of the rolling mill was not observed during the production of the equipment, which is not significant for the equipment, but for our measurements it is. The actual position of the operating force was also analyzed directly at the measurement location, but without confirmation of the deviation. This condition was also verified by numerical calculation. It has been proven that to achieve the results from
Figure 18, the position deviation would have to be significant. The effect of the squareness (flatness) of the bearing surface under the nut to clamp force was previously demonstrated [
21]. However, they dealt with force measurement (detection) error in the assembled state or during joint maintenance (after the operation has stopped) in relation to their measurement methodology. In our case, we are dealing with a spatial rupture of symmetry (that is, flatness), which affects the operating force in relation to multiple bolts. A reverse FE analysis was therefore carried out. In other words, such manufacturing deviations of the contact flatness were sought, which would affect the resulting increases in forces in the partial bolts similar to those recorded in the measurements (see
Figure 18), where it was first necessary to recalculate the signal values according to the calibration results (see
Figure 15). For purpose of reverse analysis, an extensive iterative process was used, where, using the ANSYS software, the lengths of legs L1, L2, L3 and L4 (see
Figure 1) were gradually changed, until the desired result was reached (see
Figure 19). It was, therefore, necessary to apply controlled asymmetry to the ideally symmetrical model. For this purpose, it was necessary to shorten the length L1 by 0.266 mm, length L2 by 0.49 mm and length L3 by 0.36 mm. The length of the
L4 leg remained unchanged. The steps on the horizontal axis of the graph (see
Figure 19) only represent the progressive loading of the operating force
F.
The following graph shows the resulting dependence of the operating rolling force
F on the additional force in the bolt. Based on these curves, conversion equations were defined (see
Figure 20).
For FEM analysis, the values of bolt pre-tension from
Table 2 were used. A variant with a preload of 60 kN for each bolt was also verified to show the effect of tightening accuracy. However, this had no significant effect on the character of the curves. Certain differences were visible only in absolute values. For example, the additional operating load to Bolt 1 was then in average 6% lower, Bolt 2 approx. 6.8% higher, Bolt 3 about 2.8% lower and Bolt 4 up to 14.9% lower.
For regressions, it was also possible to use the power function in a limited interval, but in the end, polynomial regression was used, especially with regard to the fact that with the help of the polynomial function, it was possible to achieve a higher reliability value R
2 and the interval of the expected operating force was known in advance. The results of the recalculated values of the operating forces from each bolt are shown in the following graph (
Figure 21). The aim was to achieve the most uniform values of the operating force F across the measuring bolts (Bolt1, Bolt2, Bolt3 and Bolt4). The need for greater signal CH4 amplification also caused an increase of visible “signal noise“ and slight value differences as well. However, still, the result can be considered satisfactory. For other measured channels (CH1, CH2, CH3), a strong consensus was reached in the resulting value of the operational force, which proves that the equations from the FEM (see
Figure 20) work correctly. The marking of the measured channel (see
Figure 21) corresponds to the marking of the bolts in
Figure 1.
As already mentioned in the introduction of the article, the aim of the measurement was to obtain the value of the operating force
F, which could not be measured directly without structural modifications of the whole device. However, these modifications were not allowed. The only option was to measure the bolt pre-tension and then reverse the approach using a FEM. The validity of the methodology and the results obtained (see
Figure 21) was verified by practice. In fact, the analyzed rolling mill had experienced problems in the past from overloading the system. The calculated results of the operating force not only corresponded to the level and type of damage, but also served as a solution to the problem.
7. Conclusions
The results of the measurements have shown that for some joints it is very difficult to determine the specific stiffness value of the compressed or compressing parts of the joint during operating conditions. This is mainly due to the complex application of the operational force, which can change its point of action depending on the deformation of the joint parts. This research achieved the following results:
The influence of asymmetry (deviations from the ideal geometry) of a multiple bolted connection on the working loads of the partial bolts has been proved. Thus, performing an accurate calculation of the operational force increase in the bolt, using the standard calculation procedure specified in
Section 2, may not even be possible.
It has also proved useful to use software based on the FE method. Using the experiment, it was possible to verify that a correctly set FEM calculation can be in strong mutual agreement with reality if any deviations from the ideal model are also included in the calculation model. In other words, FEM software and experiments (e.g., using strain gauges) can complement each other.
In this particular case, the combination of both approaches made it possible to obtain the value of the otherwise immeasurable magnitude of the operating rolling force F of the rolling device.
The finite element method has thus extended the range of strain gauge measurement. As has been shown, e.g., in [
10], sometimes even the experiment itself may not be conclusive due to the fact that additional operating bolt load is not only tensional but a combination of tension and bending and it is not possible to place strain gauges in the ideal position. For that reason, it is also not always advisable to put only one strain gauge per bolt (especially if it is on the outside of the shell of the bolt shank), as for example in [
23] (p. 10.). It depends on the type and setting of the experiment, because sometimes there can be a problem with the reproducibility of the measurements.
Of course, there are influences that cannot be completely included in the finite element model. However, if it concerns some effects of geometric deviations of the component or assembly, there is a possibility. It seems that in the case of bolted joints, it is important to consider the prescription and compliance with construction geometric tolerances not only from the point of view of assembling, but also with regard to the operating load (e.g., by maintaining symmetry) of these highly loaded machine parts.
Since the issue of the working force behavior in the bolt also concerns a very important issue of sealed circular flange joints on pressure vessels, the next phase of the research will be aimed at performing similar tests under laboratory conditions.


