Article

Symmetries of Scan Patterns of Laser Scanners with Rotational Risley Prisms

by
Alexandru-Lucian Dimb
1 and
Virgil-Florin Duma
1,2,*
1
Doctoral School, Polytechnic University of Timisoara, 1 Mihai Viteazu Ave., 300222 Timisoara, Romania
2
3OM Optomechatronics Group, Faculty of Engineering, Aurel Vlaicu University of Arad, Str. Elena Dragoi No. 2, 310177 Arad, Romania
*
Author to whom correspondence should be addressed.
Symmetry 2023, 15(2), 336; https://doi.org/10.3390/sym15020336
Submission received: 27 December 2022 / Revised: 21 January 2023 / Accepted: 24 January 2023 / Published: 25 January 2023
(This article belongs to the Special Issue Advance in the Applied Optics with Symmetry/Asymmetry)

Abstract

:
Laser scanners with rotational Risley prisms produce scan patterns that can be classified as a type of rhodonea curve, because of their symmetry. The present study builds upon the novel, graphical method that we have developed to simulate and analyze such patterns using a commercially available mechanical design program, CATIA V5R20 (Dassault Systems, Paris, France). This graphical method has both the advantage of simplicity (regarding analytical methods) and of generating exact scan patterns (in contrast to approximate methods). The aim of this work is to utilize this method to study symmetry properties of scan patterns produced by a pair of rotational Risley prisms. A multi-parameter analysis is performed, considering the characteristic parameters of the approached scanner: refractive indexes and angles of the prisms, as well as their rotational velocities. Furthermore, Marshall’s parameters are considered: ratios of the rotational velocities and of the prism angles. Because the symmetries are identical for scan patterns generated by all the four possible configurations of a pair of prisms (and only their dimensions are different), the shape of these patterns is studied only for one of these configurations. Therefore, without losing generality, the symmetries of the patterns produced by such scanners are determined, as well as some of their characteristic dimensions. Rules-of-thumb were obtained to be able to generate patterns that are appropriate for a specific application. Moreover, we demonstrated that the existing symmetries simplify the process of obtaining the scan patterns by identifying repetitive parts (defined as structures of symmetry) of a pattern.

1. Introduction

Optical and laser scanners with Risley prisms are one of the most utilized two-dimensional (2D) scanning devices [1,2,3,4,5,6,7,8,9,10,11,12,13,14,15,16,17,18,19]. They are employed in a large range of applications, from commercial to industrial and at high-end, the latter especially in biomedical imaging and in Remote Sensing. For such applications, Risley prisms scanners compete with:
(i)
Dual axis galvanometer scanners (GS) [20,21,22,23], which are the most precise optomechanical scanning system regarding beam positioning, as well as the most compact and cost-effective [1,2]. Regarding scanning modalities, GSs can work in raster [23,24,25], spiral [26,27], Lissajous [28,29], or (lately in) adaptive scanning [30].
(ii)
2D scanning heads with a polygon mirror (PM)—to produce the scan line for the fast scan axis—and a GS (for the slow axis scanner) to precisely position this scan line in order to produce raster scanning [31,32,33,34].
(iii)
The increasingly utilized Micro-Electro-Mechanical Systems (MEMS) with oscillatory mirrors [35,36,37], which function similarly to 2D GSs, with the advantage of the focusing of the beam on the single mirror, which is oscillating on two perpendicular axes. However, their field-of-view (FOV) is (still) much smaller than for GSs.
Regarding the above scanning systems, rotational Risley prisms are faster and more compact, have lower-cost, and they allow for a wide dimensional range of their diameter, from sub-millimeter (e.g., for endoscopes) [38] to hundreds of millimeters (e.g., for satellite positioning) [39]; furthermore, they can have a large FOV. The drawbacks of such scanners are related to the highly non-linear, rather complicated scan patterns that they produce [10,11,12,13,14,15,16,17,18,19]. These patterns are generated and studied today with three (types of) methods:
-
The approximate method, which considers the first order/paraxial approximation for optical wedges (i.e., small angle prisms) [15], is simple and fast, but it only provides approximate scan patterns.
-
Analytical methods, which are exact but rather complex [16,17,18,19].
-
The graphical method that we have introduced [40] and developed [41], for which ray-tracing is performed using a mechanical design program, in our case CATIA V5R20 (Dassault Systems, Paris, France). In this way, the simulation of exact scan patterns of Risley prisms can be achieved, in an intuitive, time-effective, and easy way.
Building on this latter method, the aims of the present study were:
  • To explore the symmetries that can be obtained for scan patterns generated by a pair of rotational Risley prisms. Such symmetries are definitely present, as these patterns are, from a mathematical point of view, a type of rhodonea curve [42]. This can be seen from their shapes, which have been approached both by early works employing approximate methods [15] and by our (exact) graphical method studies [40,41].
  • To perform a multi-parameter analysis that is necessary for such systems, by considering the different characteristic parameters of the scanner, to determine their impact on the symmetries of the patterns.
  • To extract rules-of-thumb regarding the shape of scan patterns. Thus, existing symmetries can be helpful in simplifying the way such patterns are generated. Eventual symmetries could be applied in using only a portion of a pattern (that is precisely obtained) and then multiply it in a repetitive way to draw the entire pattern.

2. Laser Scanners with a Pair of Rotational Risley Prisms

The schematics of a laser scanner with a pair of Risley prisms is presented in Figure 1a, as extracted from simulations that we have performed using CATIA V5R20. A characteristic feature of such scanners is that each prism is oriented with one of its diopters (noted with “a”) perpendicular on the optical axis (O.A.) of the system, which is its axis of symmetry. Only the other diopter of each prism (noted with “b”) is tilted with regard to the O.A. Considering this aspect, the four possible configurations of this system (as pointed out in the entire literature on this topic) are presented in Figure 1b to e. Without losing the generality of the symmetry study, in the present work only one of these four configurations (specifically, ba-ab) is approached, because we demonstrated in [41] that the scan patterns that different configurations generate have the same shape; they differ only in dimensions.
Prisms 1 and 2 are rotating with the angular velocities ω1 and ω2, respectively. The incident (center axis of the) laser beam is oriented through the O.A., and is refracted through the four diopters towards a scanned plane/screen perpendicular on the O.A. The current relative position of the prisms produces an emergent beam that has a center that intersects the screen in a current point P. The position of this point can be characterized in systems of rectangular or polar coordinates (to be defined in Section 4), both with the center in the point O. This point is the intersection between the O.A. (i.e., the direction of the axis of the incident beam) and the screen.
Throughout the study, to highlight only symmetry aspects, the laser beams are considered reduced to their axes of symmetry, therefore their intersections with the screen are reduced to points P that define specific curves—the scan patterns. Considering the finite diameter of the beams and therefore their distortions of the laser spots in the scanned plane has been approached in the literature [43,44], it is not the topic of the present study.
The other two characteristic parameters of the Prisms 1 and 2 are the refractive indexes n1 and n2, as well as the prism angles, θ1 and θ2, respectively. They define, using the small angles approximation, the well-known deviation angle of each prism in paraxial:
D i = ( n i 1 ) · θ i ,   i = 1 , 2
These characteristics of scanners with rotational Risley prisms led Marshall to define his elegant parameters: M, the ratio of the rotational speeds and k, the ratio of the angles of the prisms (initially defined as the ratio of the deviation angles D2 and D1 of optical wedges) [15]:
M = ω 2 / ω 1   and   k = θ 2 / θ 1 = D 2 / D 1
These parameters, together with the dimensions of the system must be considered in any analysis of these scanners, therefore, they are utilized in the present study, as well.

3. Graphical Method to Study the Symmetry of Scan Patterns

Considering the two prisms in CATIA V5R20 and using the basic prisms equations
ε 1 = θ 1 ;   sin ε 1 = n 1 sin ε 1 ;   ε 1 + ε 2 = θ 1 ;   n 1 sin ε 2 = sin ε 2 ;   ε 2 = ε 3 ; sin ε 3 = n 2 sin ε 3 ;   ε 3 + ε 4 = ± θ 2 ;   n 2 sin ε 4 = sin ε 4 ,
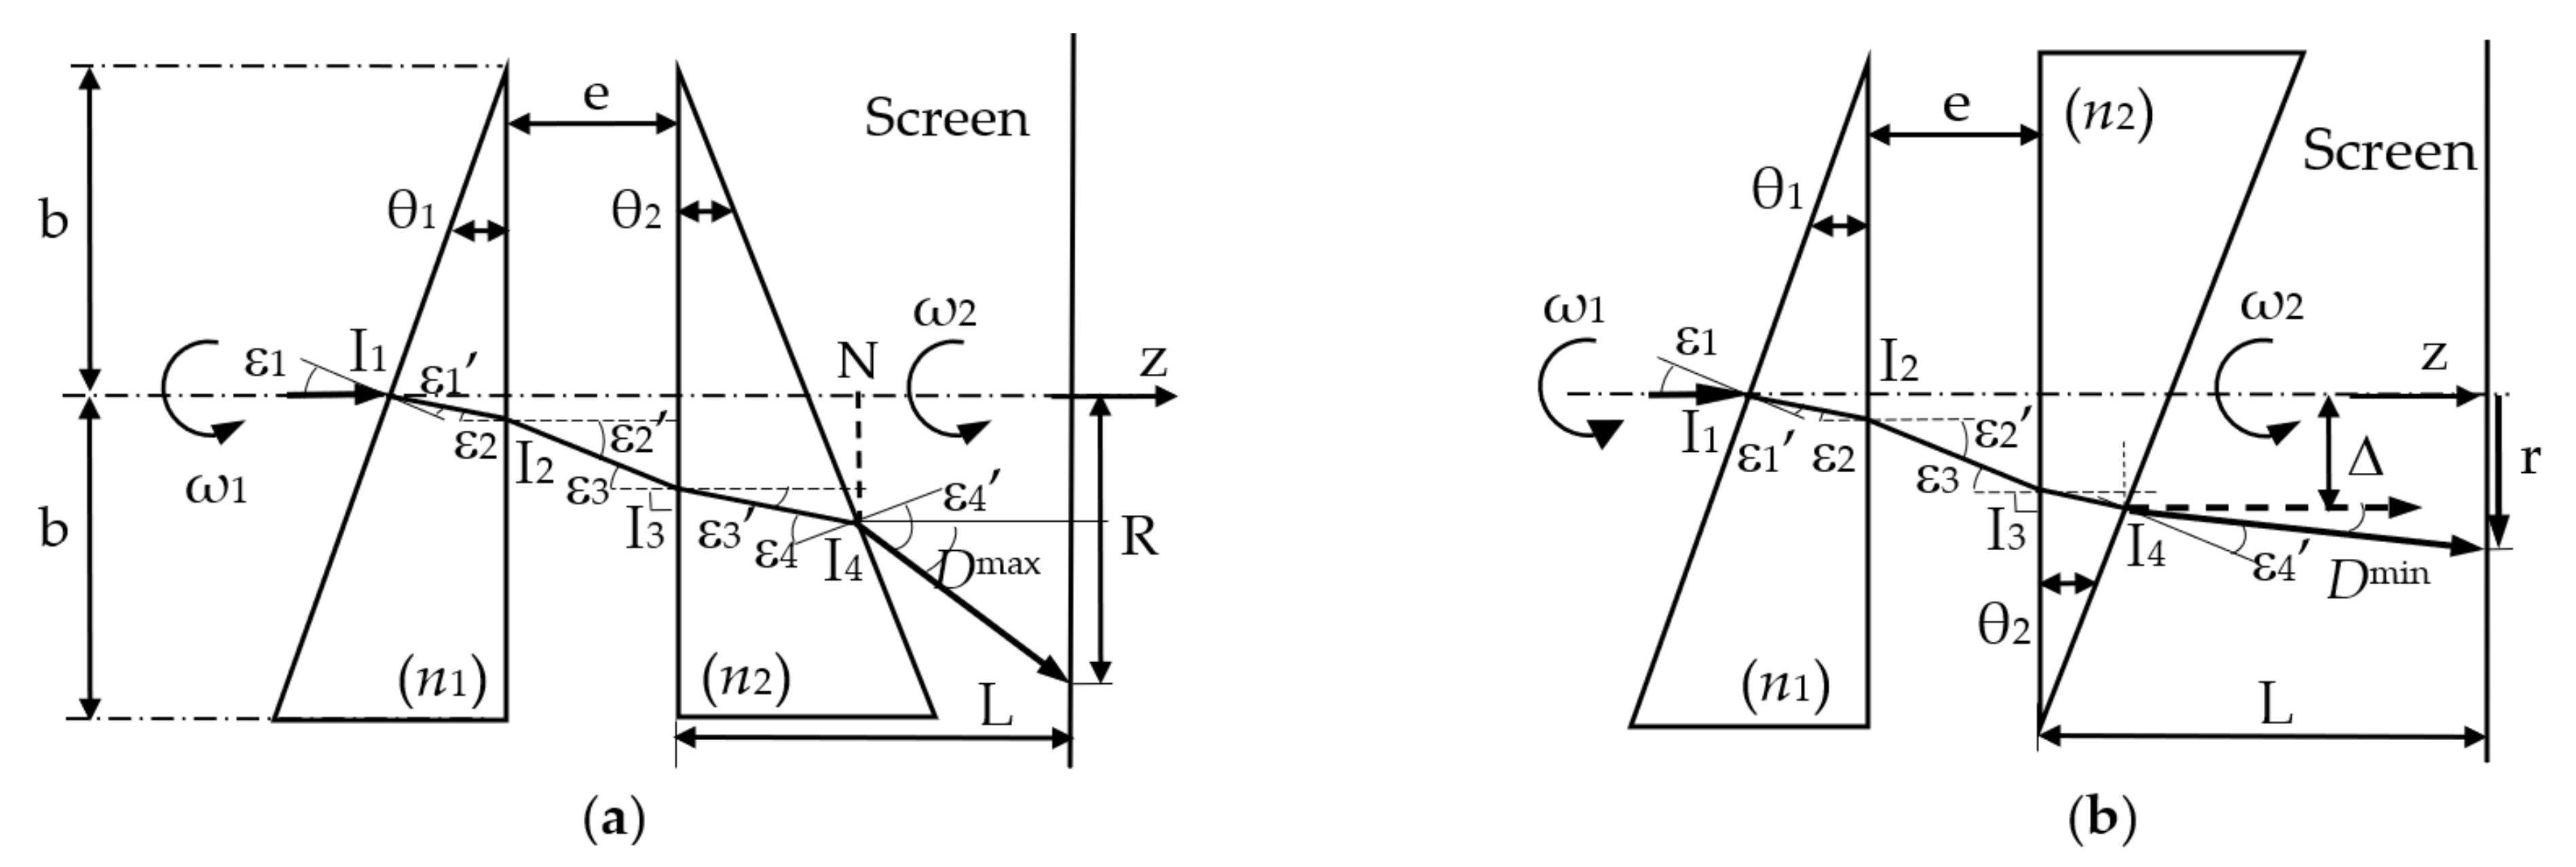
written with the notations in Figure 2, the light bundles produced when the two prisms rotate with regard to one another can be obtained, as shown in the examples in Figure 3. To simulate their relative rotations (i.e., with the ratio M), the two prisms are rotated incrementally with angular steps that are in this M ratio. By intersecting these bundles with a plane perpendicular on the O.A., the produced scan pattern is obtained (Figure 3).
From Figure 2, with Equation (3), the maximum and minimum angular deviations through the scanner are obtained:
D m a x , m i n = arcsin n 2 sin ± θ 2 + arcsin n 1 n 2 sin θ 1 arcsin sin θ 1 n 1 θ 2 ,
for the two prisms rotated with an angle of 0 and π (rad) regarding each other, respectively—as studied in detail for all four scanner configurations in [41].
For the (common) particular case of optical wedges, using the first order/paraxial approximation, Equations (1) and (4) provide the expressions of the linearized (i.e., approximate) deviation angles of the system:
D l i n m a x ,   m i n = D 1 ± D 2 .
Therefore, for two identical wedges (i.e., for n = n 1 = n 2 and θ = θ 1 = θ 2 ),
D l i n m a x = 2 n 1 θ   and   D l i n m i n = 0 .
In the case of identical prisms (not necessarily wedges), as Dmin = 0, the beam emerges parallel to the O.A. (i.e., the dotted line in Figure 2b). From Equation (3), using the geometry in Figure 2b, the linear deviation of the emergent beam regarding the O.A. is [41]
Δ θ = b · tan   θ · tan ε 2 + e · tan arcsin n · sin ε 2 ,   where   ε 2 = θ arcsin   sin θ / n ,
where e is the distance between the two prisms (i.e., between their “a” diopters), b is their radius, and L is the distance from the “a” diopter of Prism 2 to the scanned plane. In all the simulations that follow, the considered scanner parameters are (when not pointed out otherwise): e = 25 mm; L = 1000 mm; n = 1.517; b = 25 mm.

4. Results: Simulated Scan Patterns for the Different Scanner Parameters

There are certain symmetries that can be observed in scan patterns generated by rotational Risley prims scanners [15,16,17,18,19], including from our previous studies [40,41]. Using the graphical method presented in the previous section, the scan patterns were obtained in the following, referring to all the parameters pointed out above: Marshall’s ratios M and k, the prism angles θ1 and θ2, as well as the refractive indexes n1 and n2.

4.1. Scan Patterns Generated for Integer Values of M

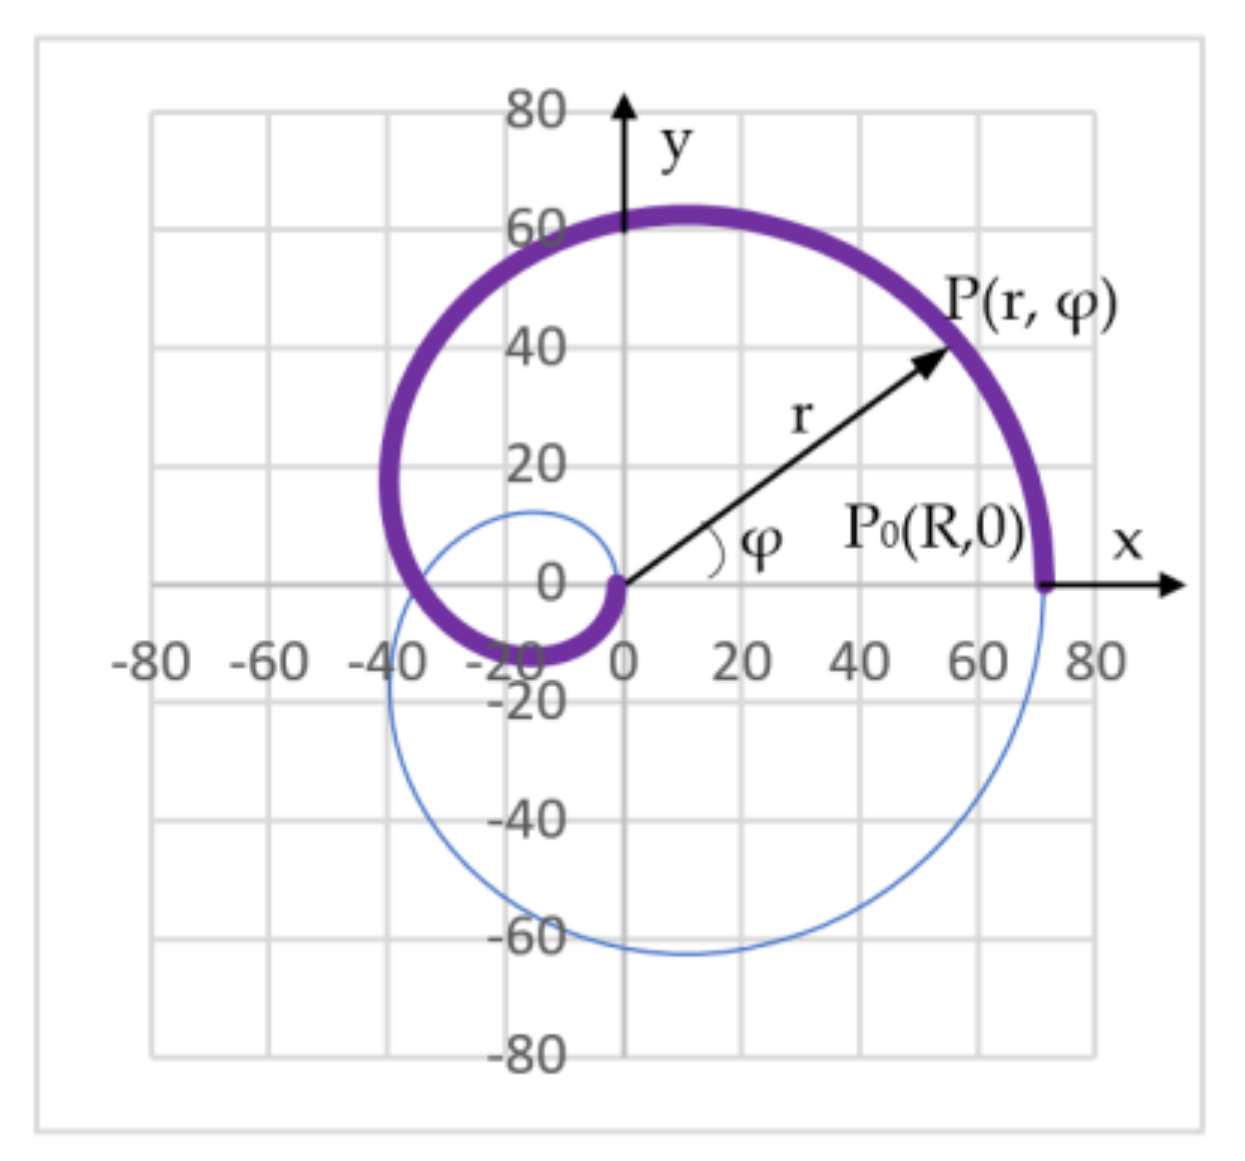
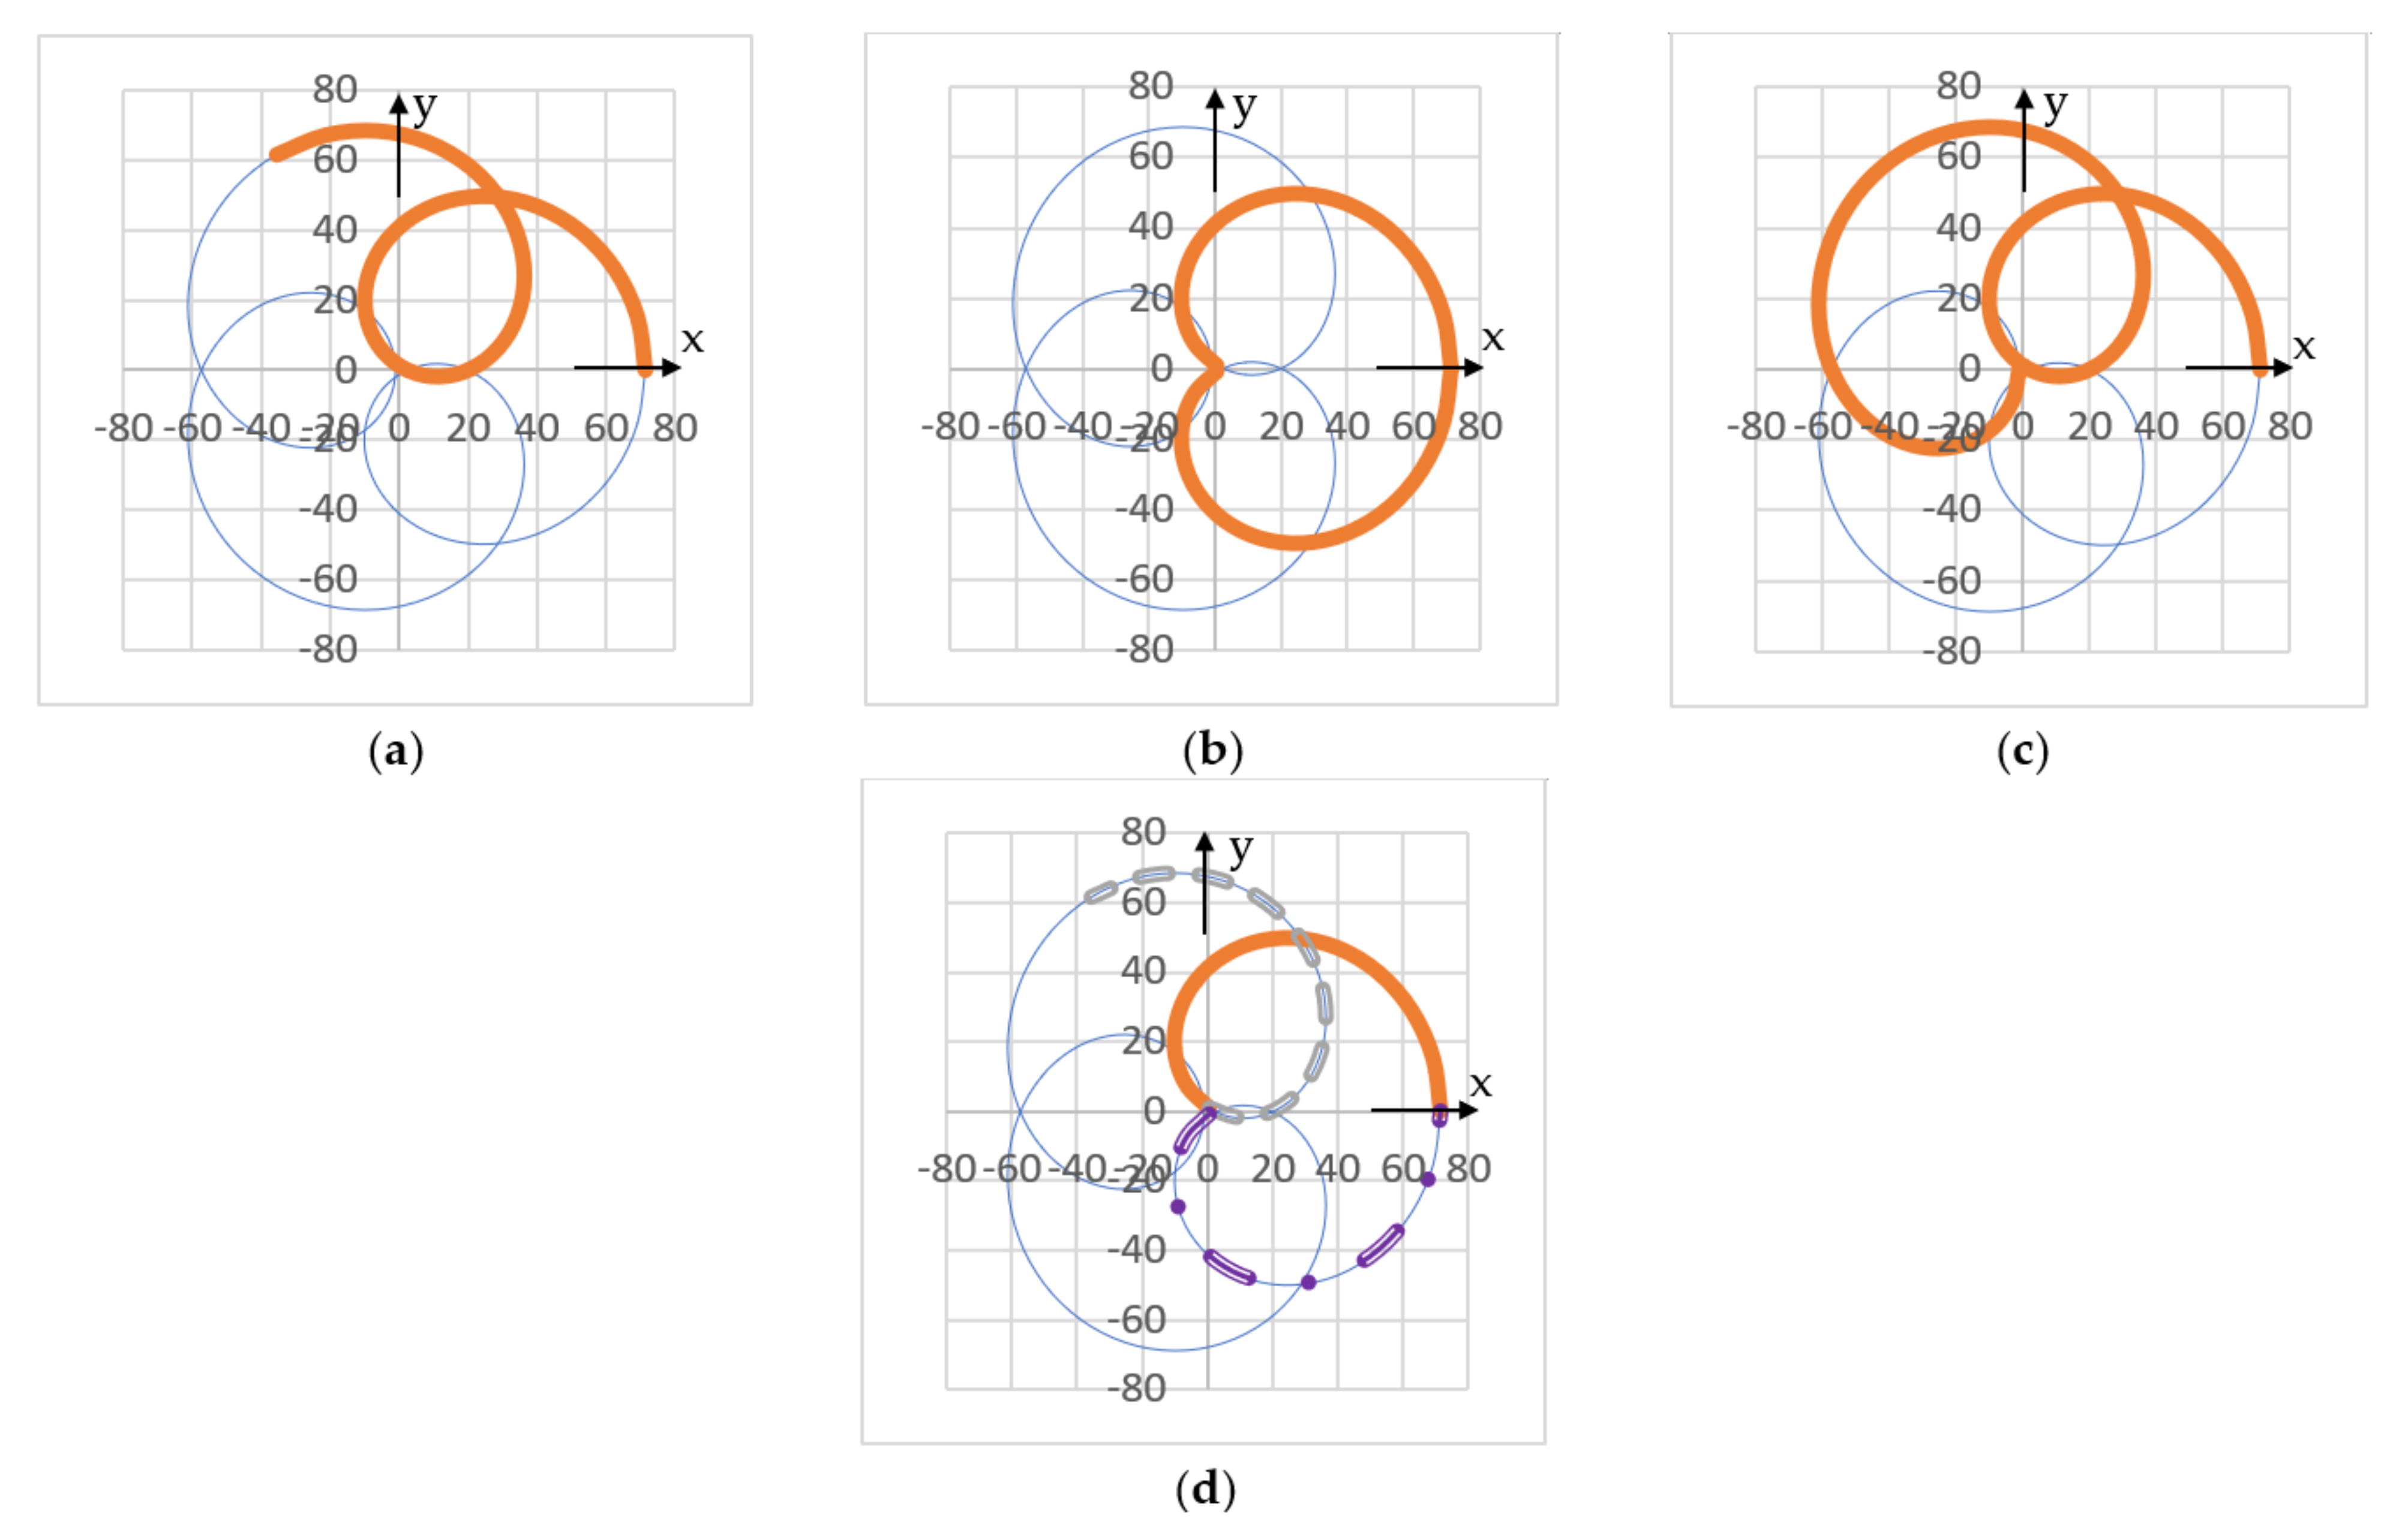
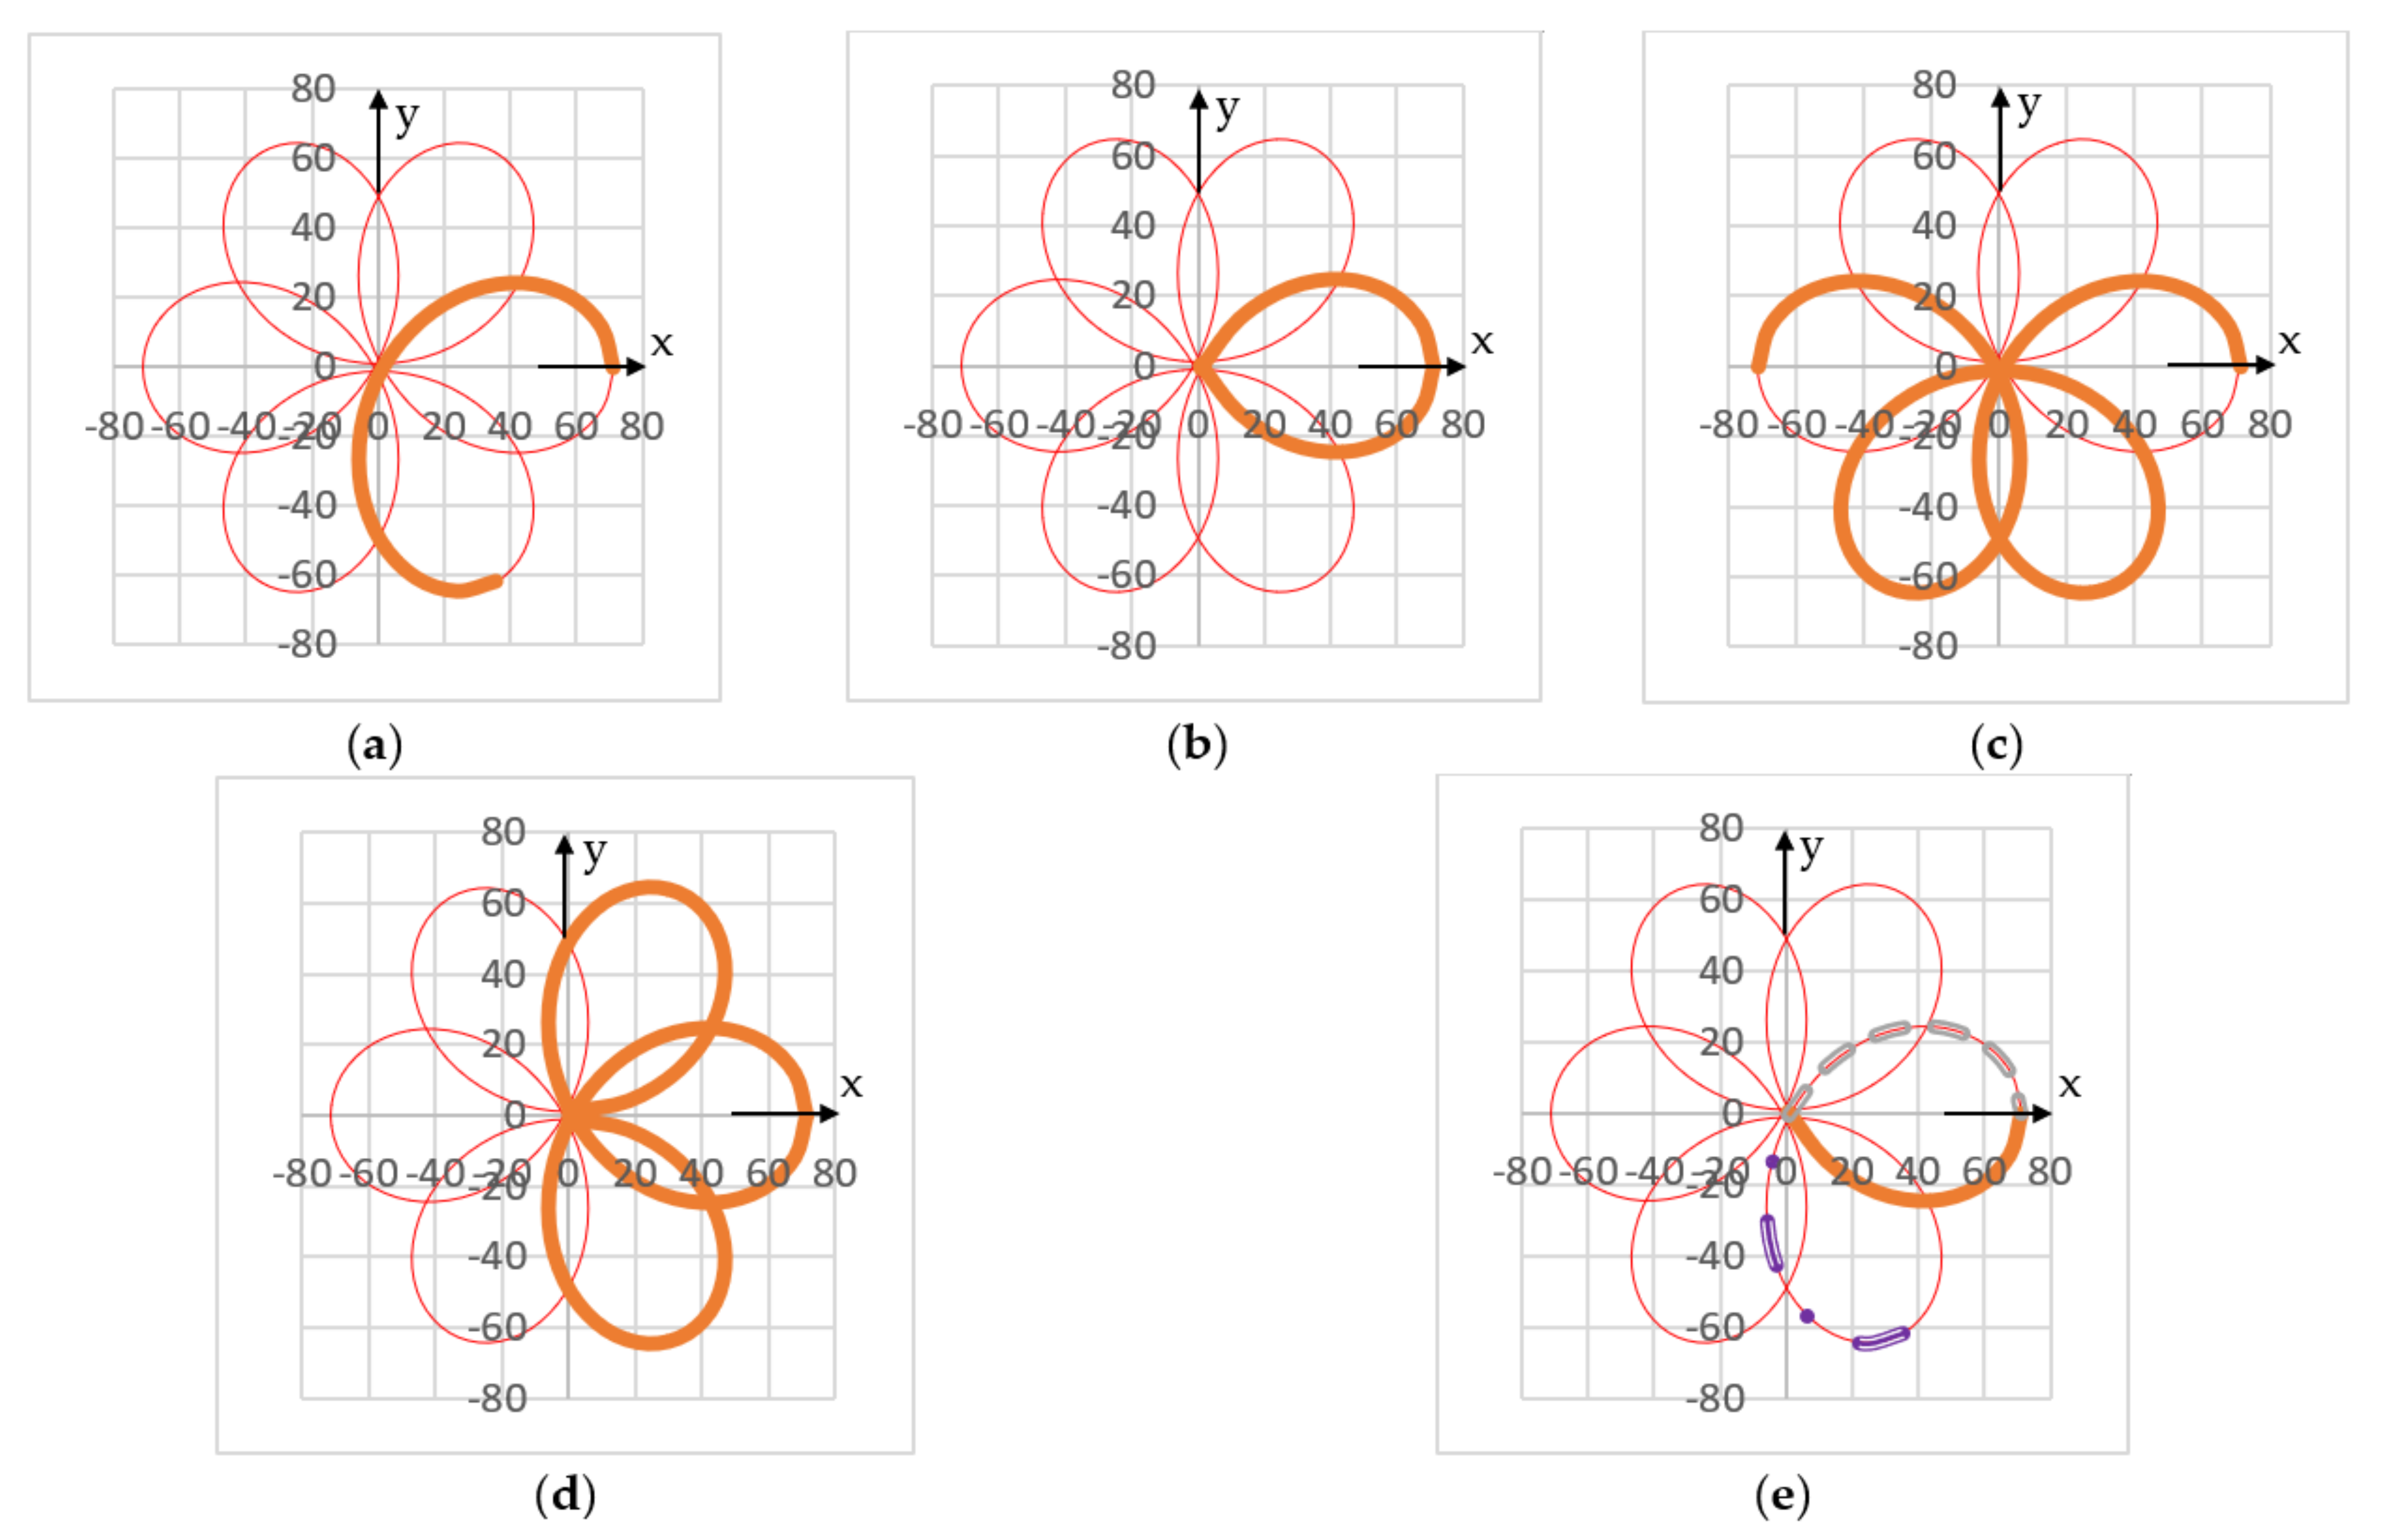
In order to observe the existing symmetry of the loops in the scan patterns (Figure 3), as well as their dimensions in the x and y axes (Figure 4), several integer values of M were first considered. They were chosen both even and odd, each of them both positive and negative. In this way, a total of eight cases were approached, for M equal to ±2, ±3, ±4, and ±5. In this subsection two identical prisms are considered, with D1 = D2 = 2°, therefore k = 1. The scan patterns for M = 2 and M = −2 are presented in Figure 4 and Figure 5, respectively.
These simulations, as well as the ones that follow were made starting with the prisms placed in the initial position in Figure 2a. Therefore, the initial point of each pattern is P 0 ( R , 0), with these coordinates in both the rectangular and the polar systems (i.e., Oxy and O, respectively), as shown in Figure 4 (and valid for all other figures from the simulations, as well). All scan patterns were generated in the clockwise sense, with the first point P0 that corresponds to the “tip” of a loop placed on the Ox axis. It is also placed on the circle that circumscribes the pattern, corresponding to the scanner’s FOV.
Figure 6 and Figure 7 present the scan patterns for the next two values, M = 3 and M = −3, respectively. Figure 8 and Figure 9 follow with the scan patterns for M = 4 and M = −4, respectively, while Figure 10 and Figure 11 show the patterns obtained for M = 5 and M = −5, respectively.
Other two integer values of M, equal to ±1 can be considered. From the initial study in [40], but also from Figure 2a, a circular trajectory of radius R is obtained for M = 1. For M = −1, an elliptic trajectory is obtained, as pointed out from [15].
Clockwise rotation was defined in Figure 2 as the direction of both rotational angular velocities—thus highlighting the M > 0 case in Figure 3a. In consequence, the scan patterns were generated clockwise for M > 0. In the M < 0 case in Figure 3b, ω1 was chosen clockwise, while ω2 had the counterclockwise direction. Therefore, the scan patterns in Figure 5, Figure 7, Figure 9 and Figure 11 were generated in a clockwise direction, as well (i.e., in the negative sense of the angle φ marked in Figure 4). If the directions of ω1 and ω2 were both changed, the scan patterns would still be the same for M < 0, but they would be generated counterclockwise.
Symmetries of the scan patterns can be obtained from all the above simulations performed regarding M. They are discussed in the following section, after completing in the next subsections the rest of the simulations, regarding all the scanner’s characteristics. It is worth pointing out that such simulations have been validated experimentally, for certain different values of M, but also for different configurations of scanner with a pair of Risley prisms, in several preliminary studies, including [45,46]. Certain experimental validations were also performed in the initial study [40] for the ab-ba configuration, as well as, in a more complete approach, in [41]. An experimental validation, for other cases than those considered in our previous studies is performed in this work in Section 7.

4.2. Scan Patterns for Fractional Values of M

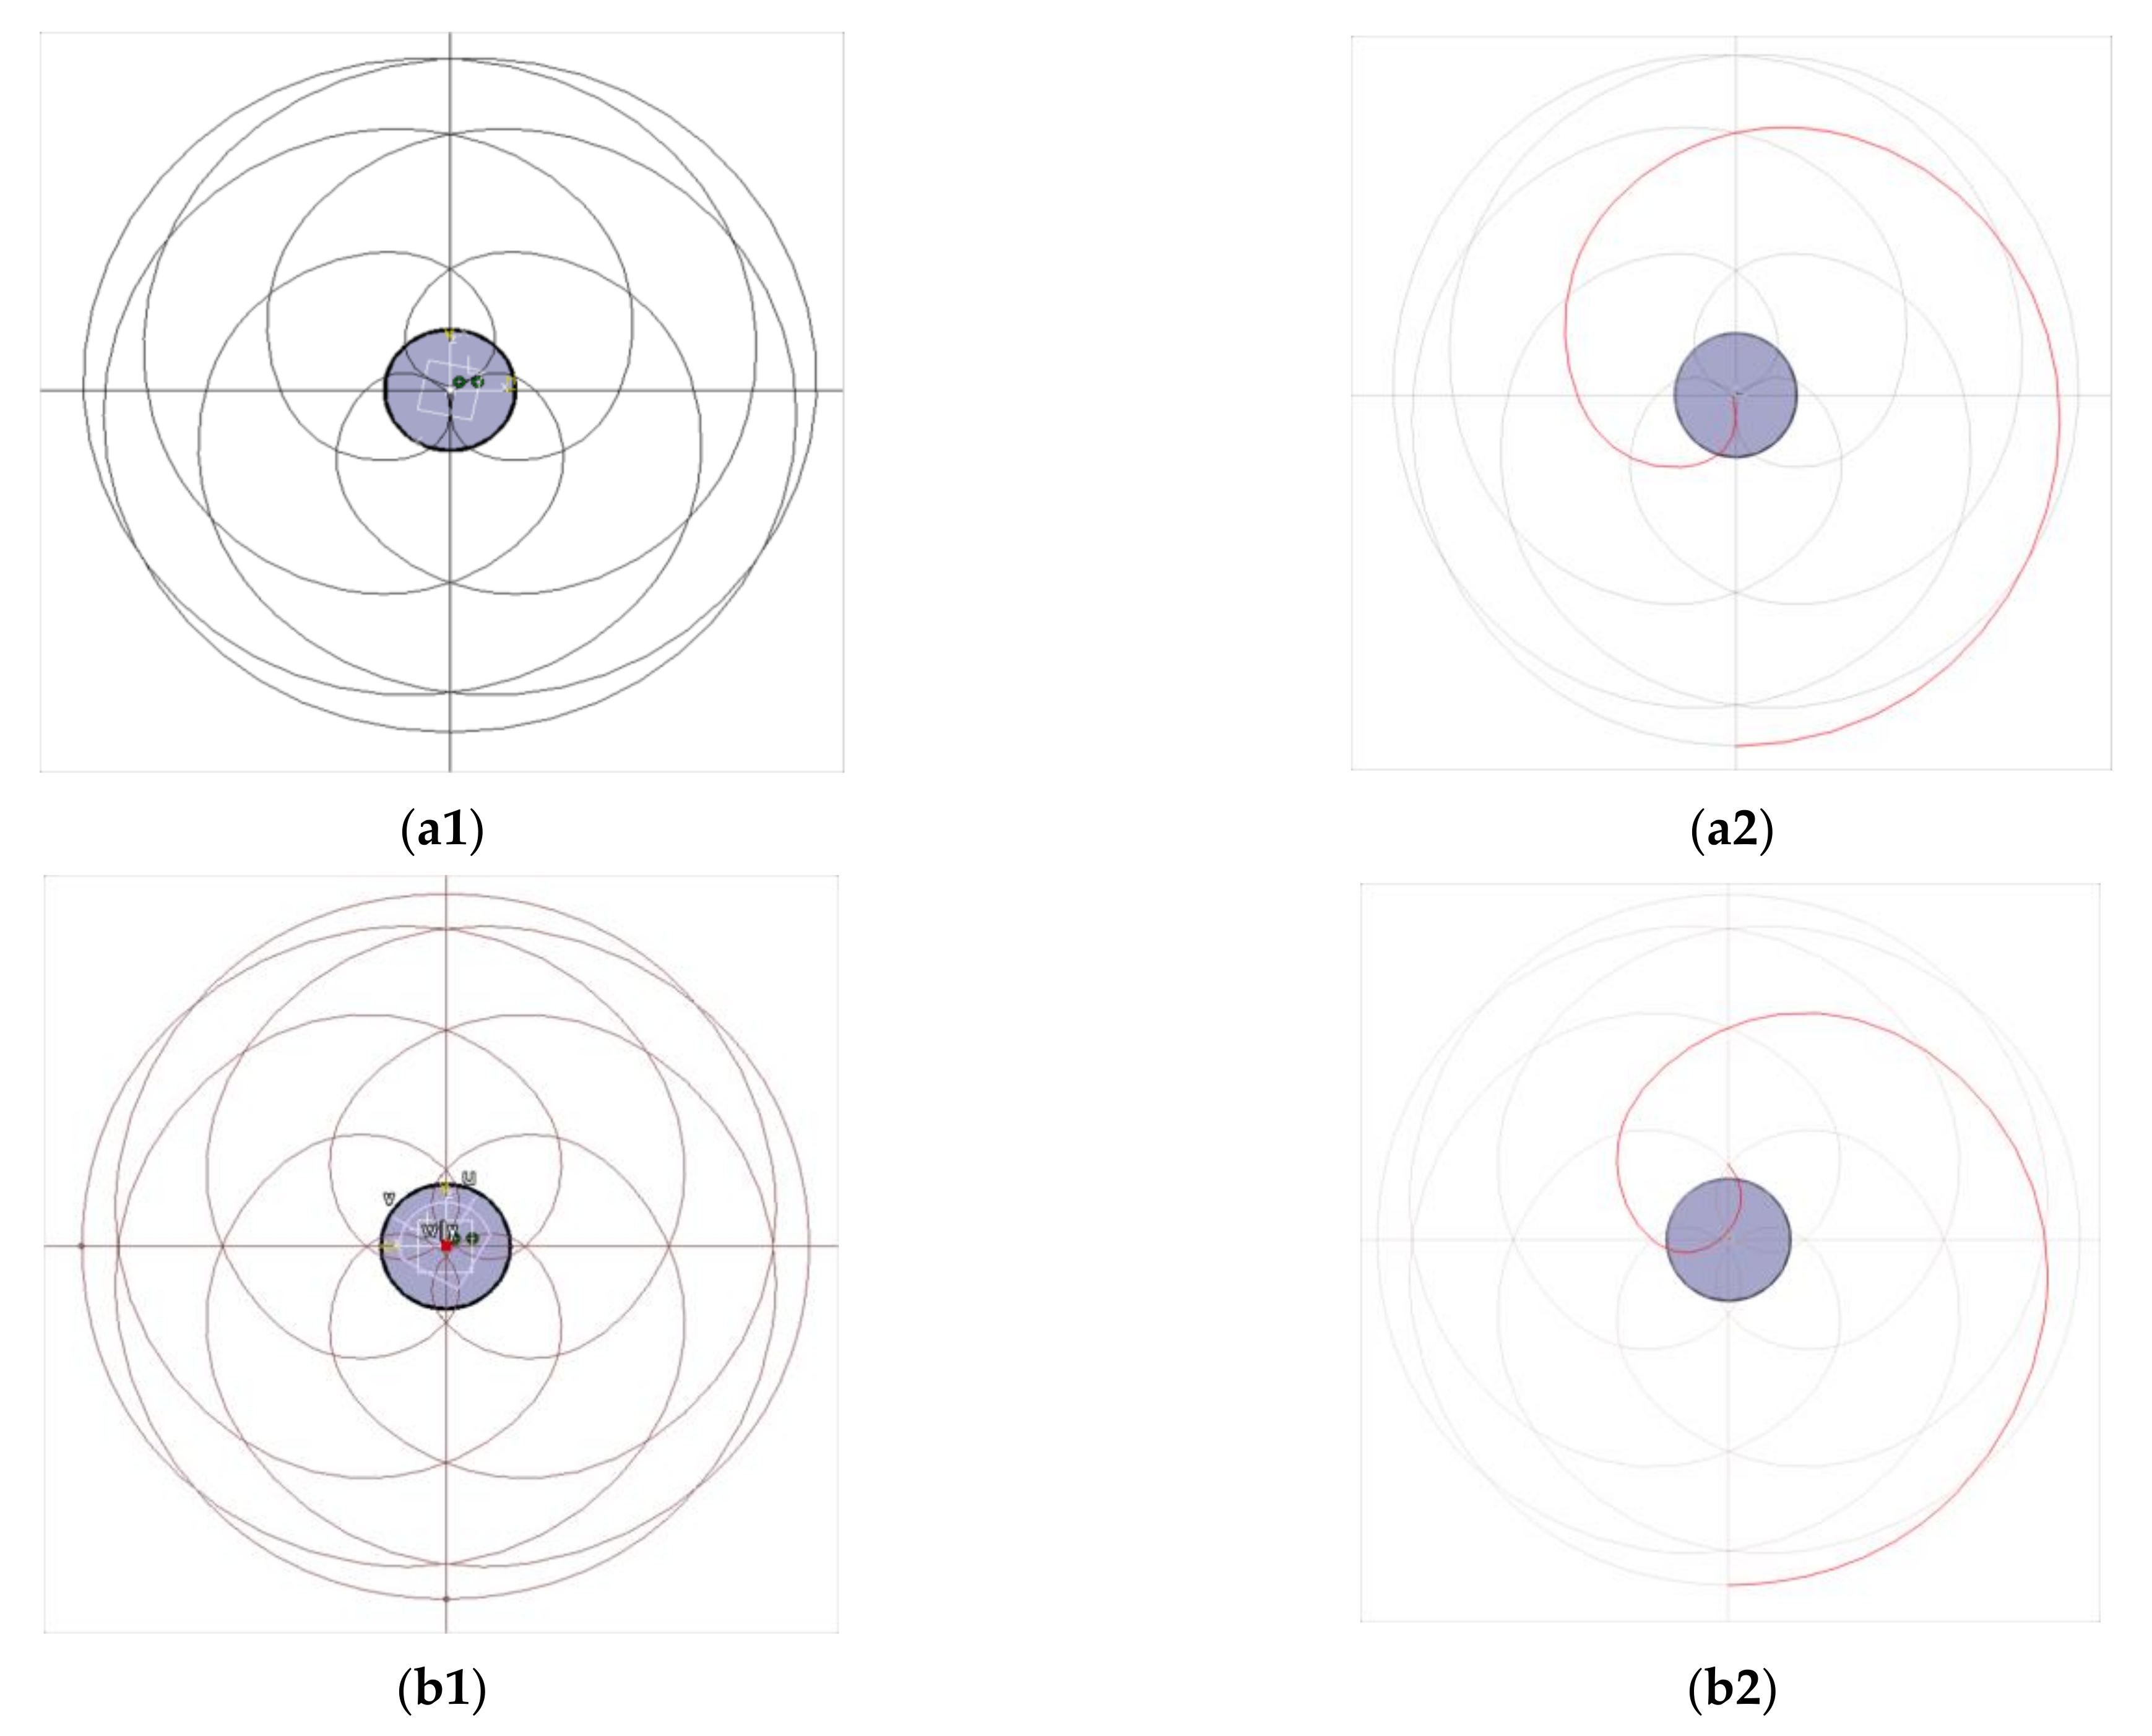
Scan patterns produced for fractional values of M are of lesser interest in applications. If M is a rational fraction, a certain symmetry exists, as it can be observed in the examples in Figure 12.
Consequently, for M = 1 + j/10, where j = 2,4,6, and 8, there are j such symmetry structures/spiral-like patterns, as they are extracted in Figure 12(a2,b2) from the entire trajectories that are presented in Figure 12(a1,b1). As the number j is even in these examples, j/2 spiral curves are right oriented and j/2 curves are left oriented. If M is not a rational fraction, then the produced pattern is not closed, and symmetries cannot be extracted for that specific shape, as shown for example in [40].

4.3. Scan Patterns for Two Particular Cases of M

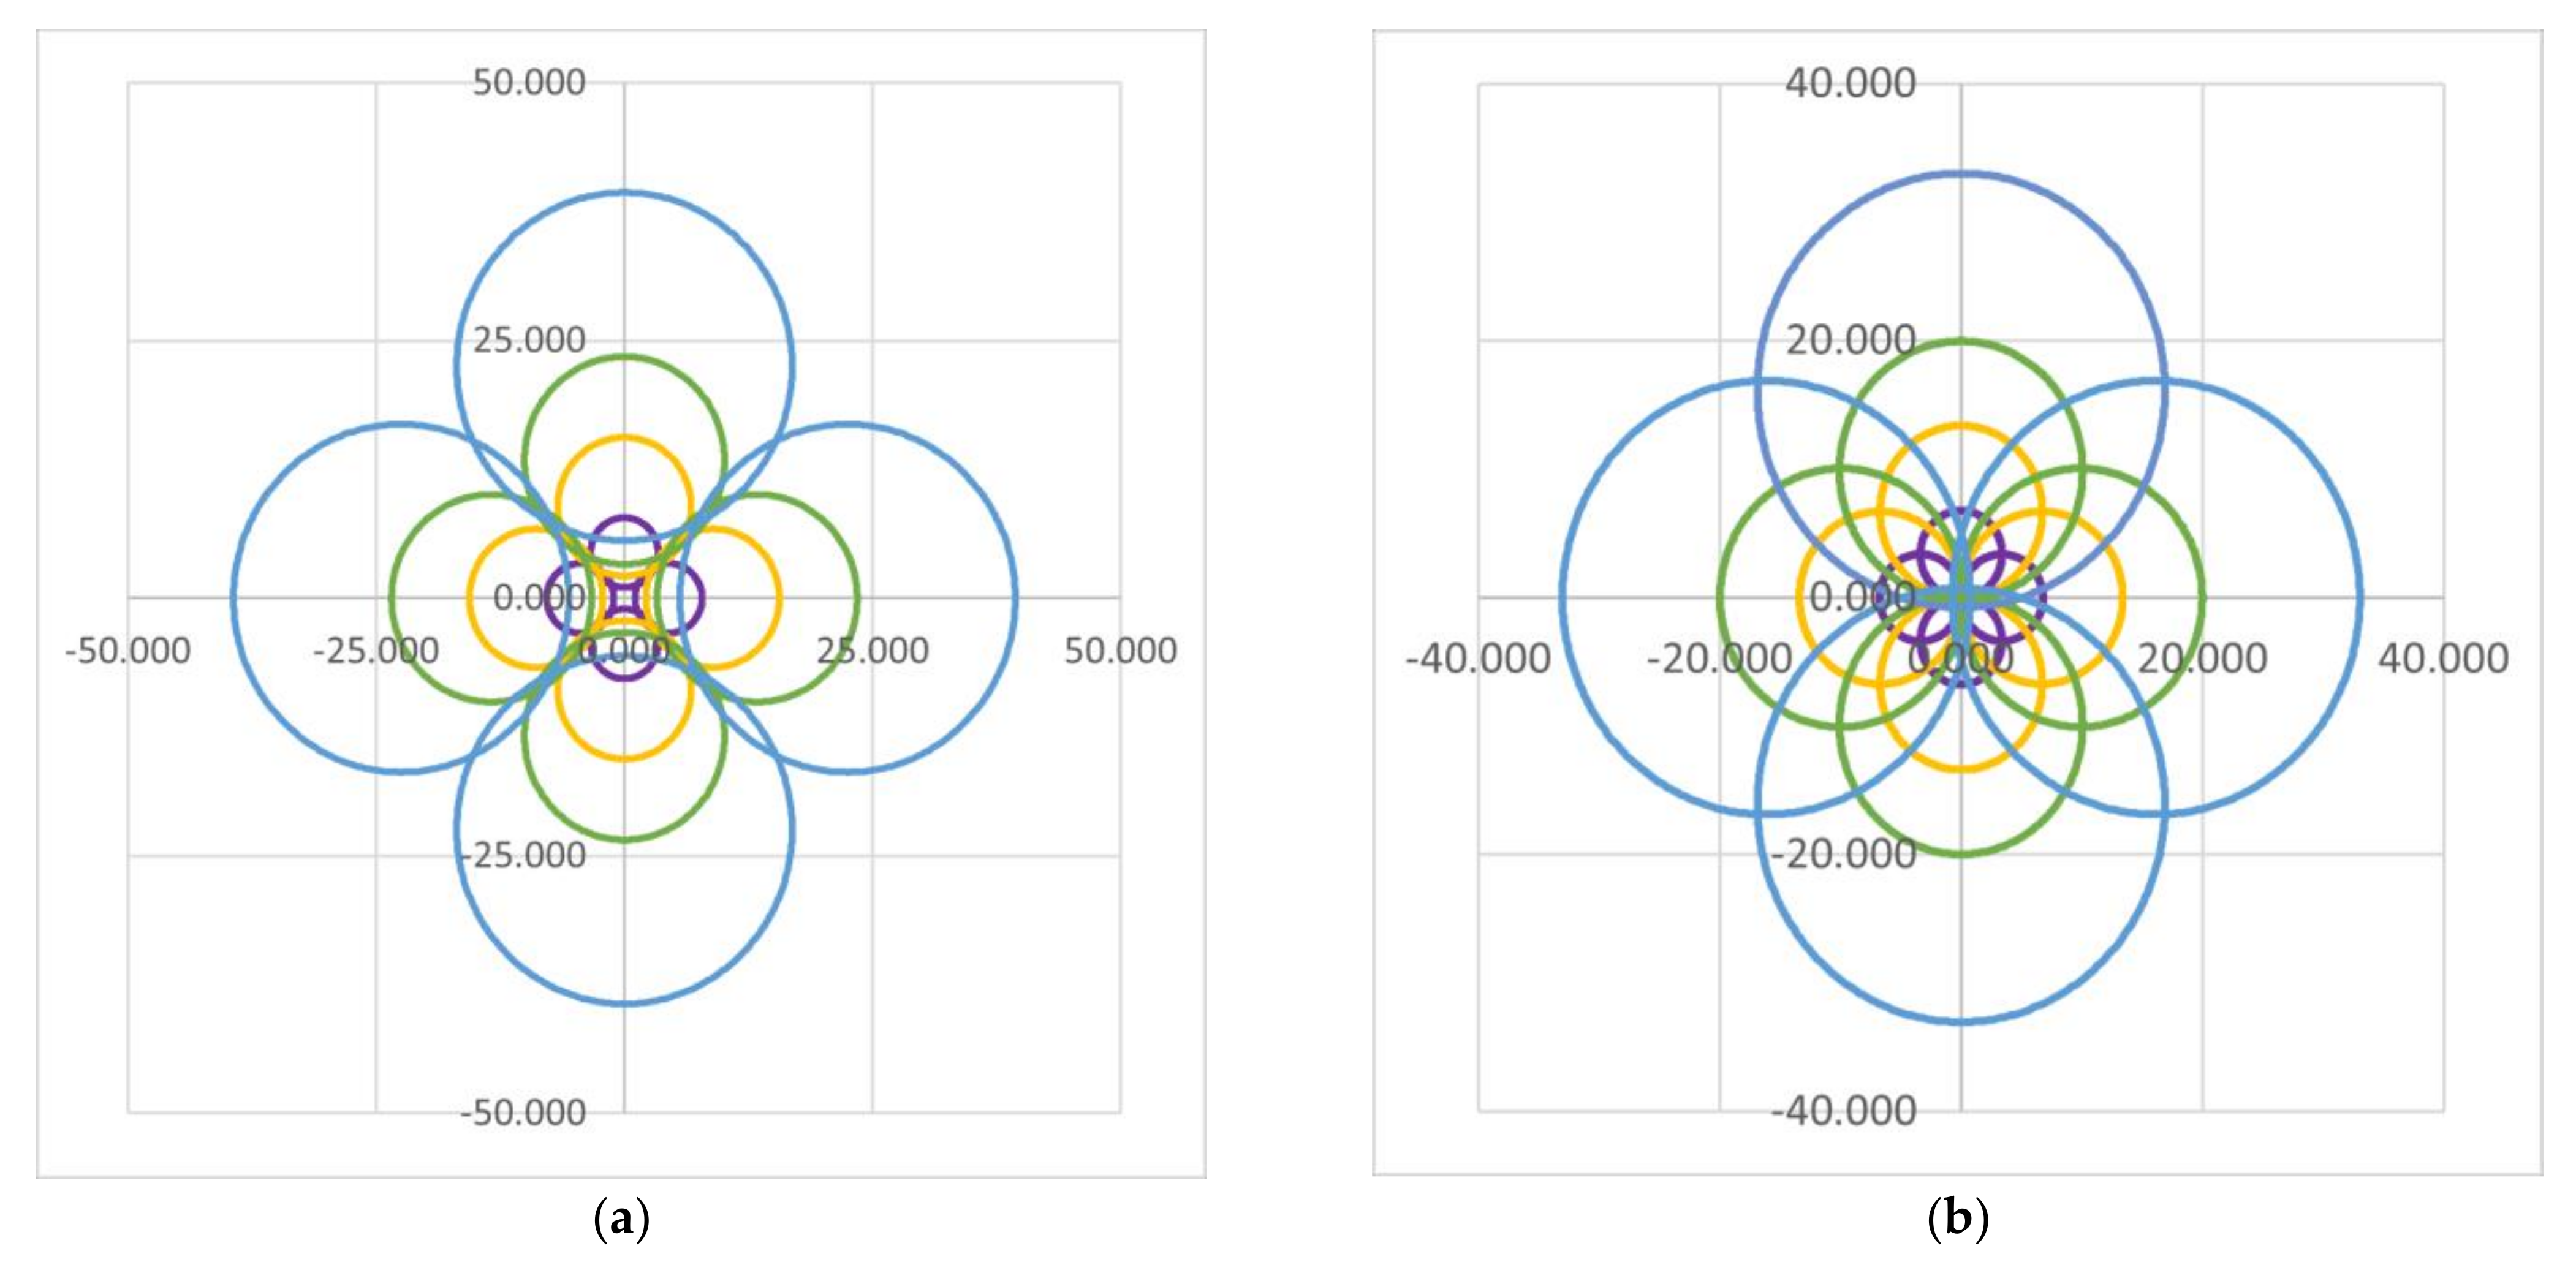
Two particular cases are obtained when one of the prisms is fixed and only the other one is rotational. Such a study, regarding the initial phase of the prisms is common for numerous works that approach such systems [47]—as the starting point of a study on scanning with prisms [40,41]. The scan performed for such cases is presented in Figure 13:
(a)
Prism 1 is fixed in four successive positions, equally spaced with an angle Δφ1 = 90° regarding one another, while Prism 2 is mobile. Therefore, from Equation (2), M = ω2/0 = ∞ (where the notations in Figure 1 were utilized).
(b)
Prism 1 is mobile, and Prism 2 is fixed, with the latter positioned in four positions, each with an angle Δφ2 = 90° regarding one another. Therefore, in this case M = 0/ω1 = 0.
One may notice that the obtained circular scan patterns have a larger radius in the case in Figure 13b, as the rotating of the laser beam is performed from a larger distance (i.e., L + e) from the screen (Figure 2a). In the case in Figure 13a, the obtained circles are smaller, as the beam is rotated by the prism placed closer (i.e., at the distance L) to the screen.

4.4. Scan Patterns Generated for Different Values of k

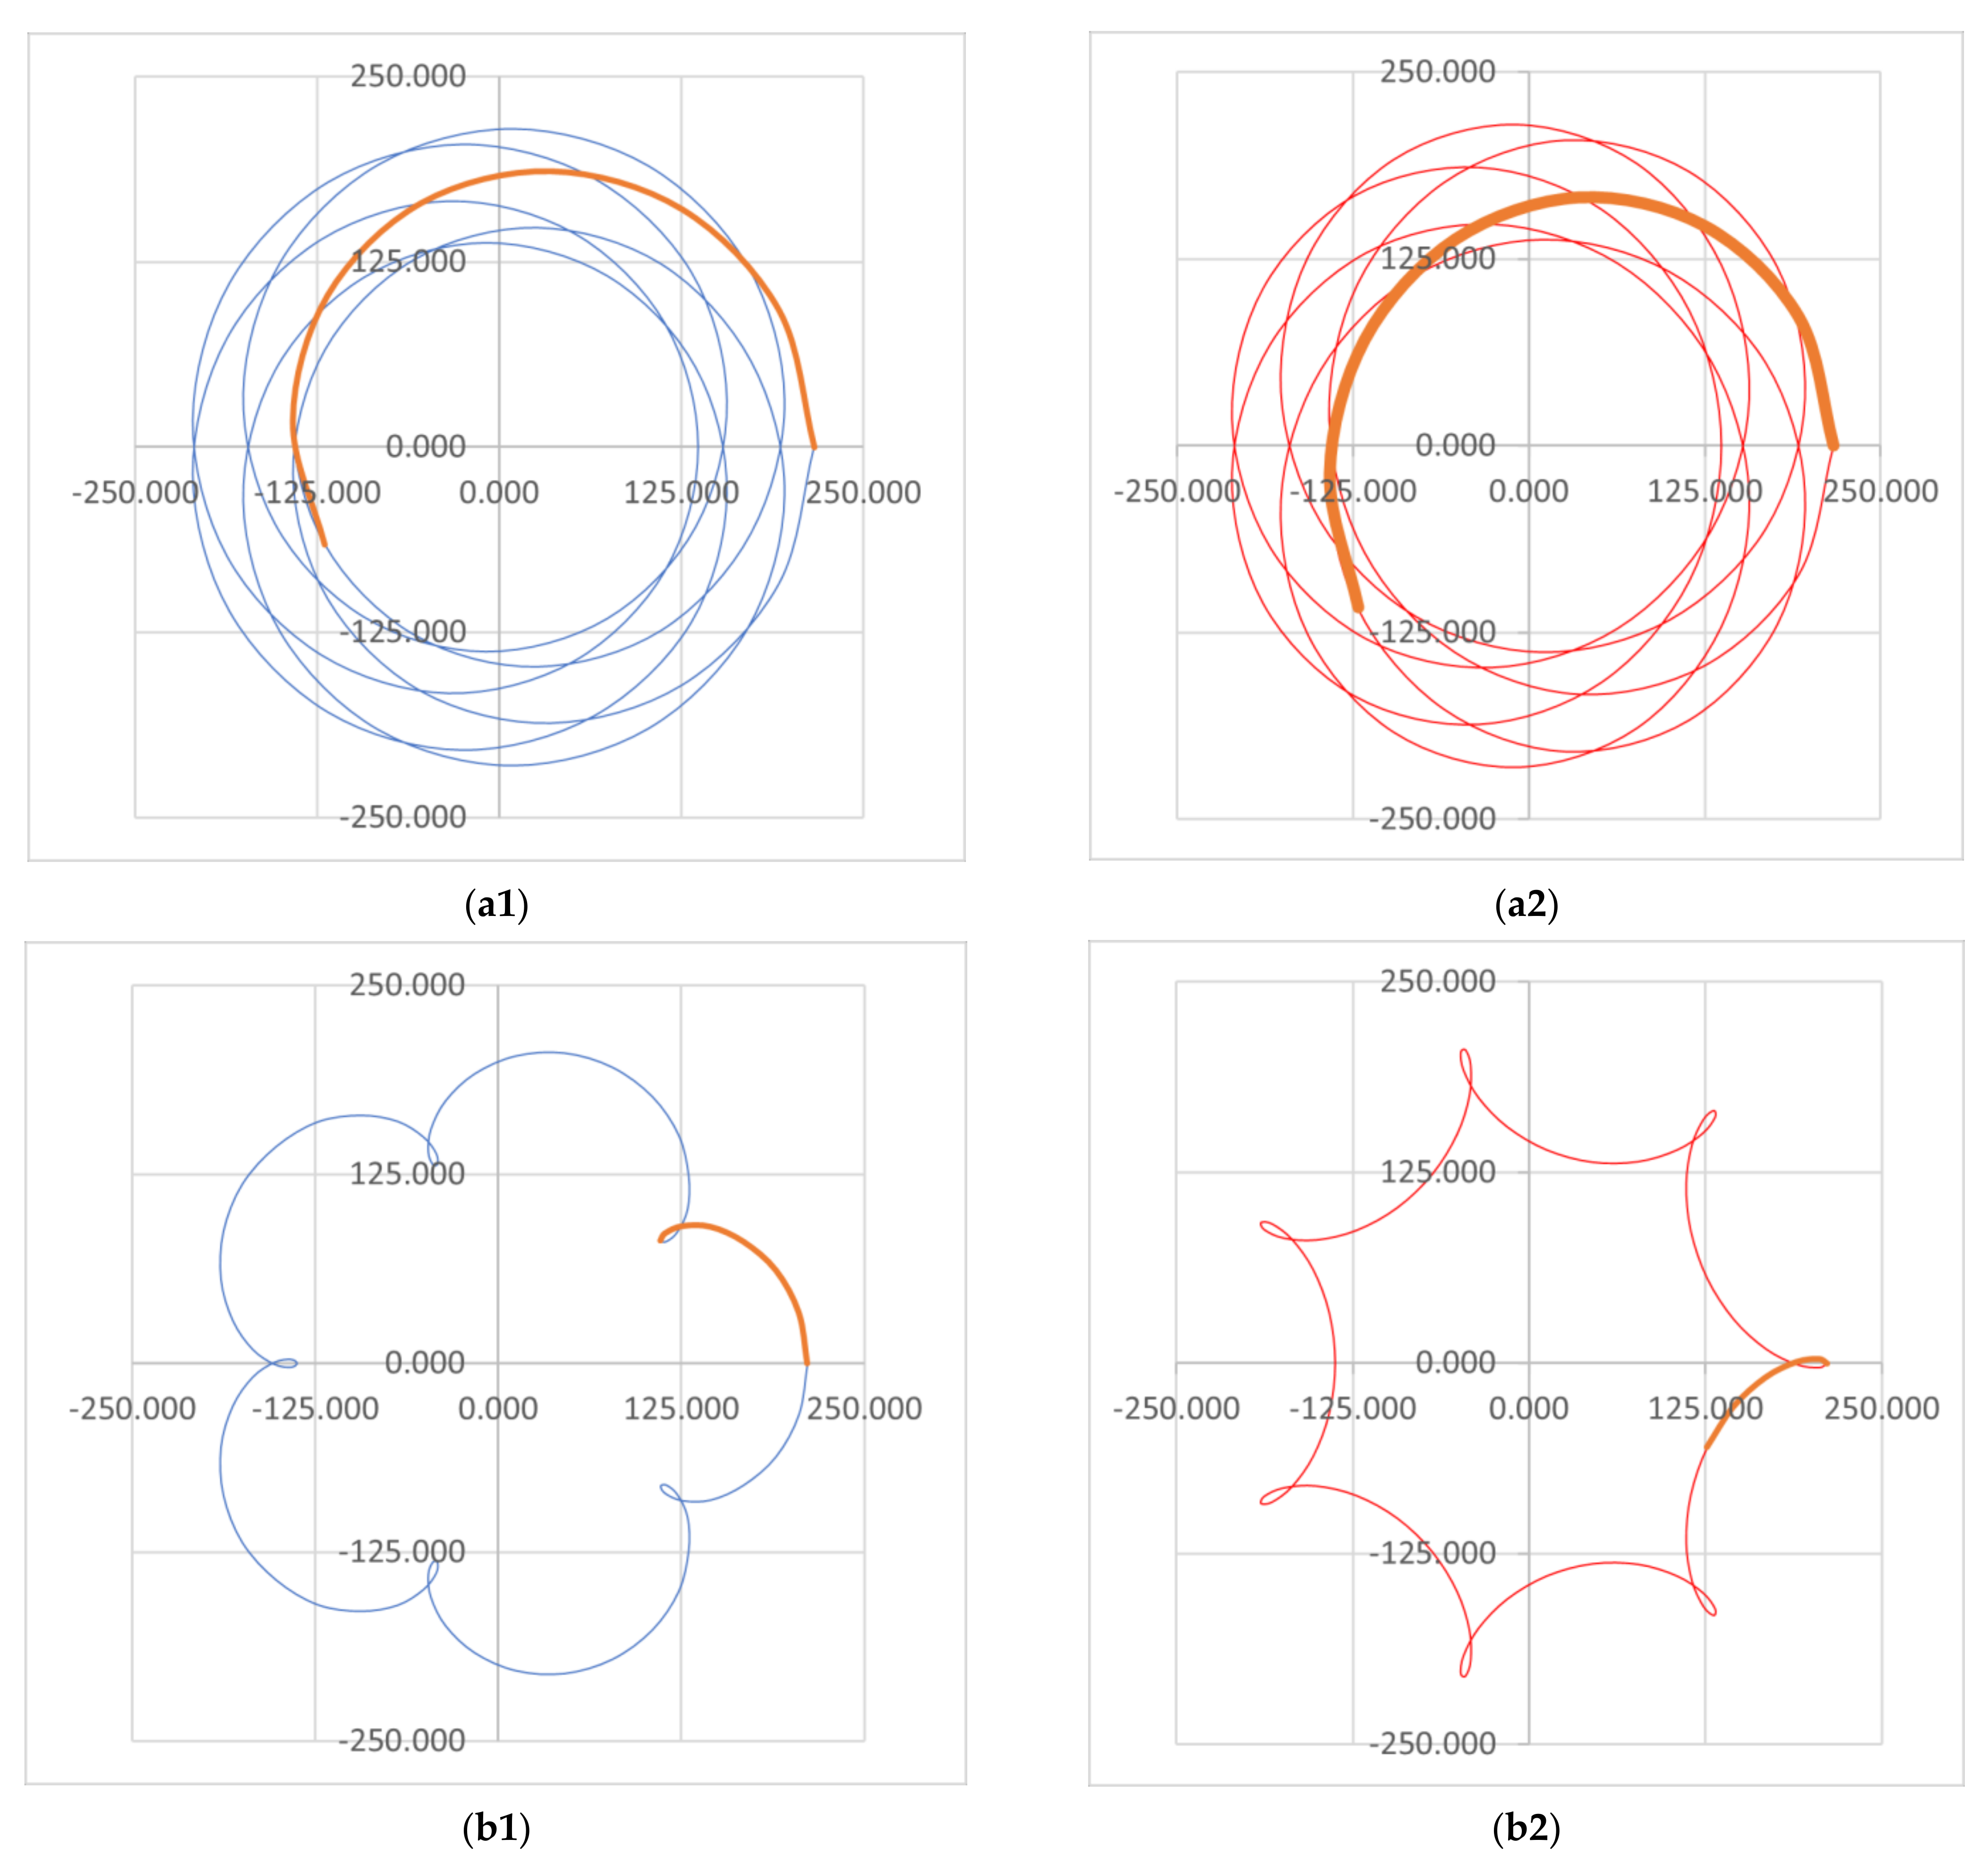
A simulation of the patterns is performed in Figure 14 for |M| = 6 (and for both values, positive and negative of M), considering two values of Marshall’s ratio k = θ2/θ1 = D2/D1: (a) k = 10°/2° = 5 and (b) k = 2°/10° = 1/5. One may see the impact the difference in k has on the shape of the patterns; this was the reason for choosing these values of the ratio. However, the symmetries of the patterns are the same.

4.5. Scan Patterns Generated for Different Values of the Prism Angle θ = θ1 = θ2

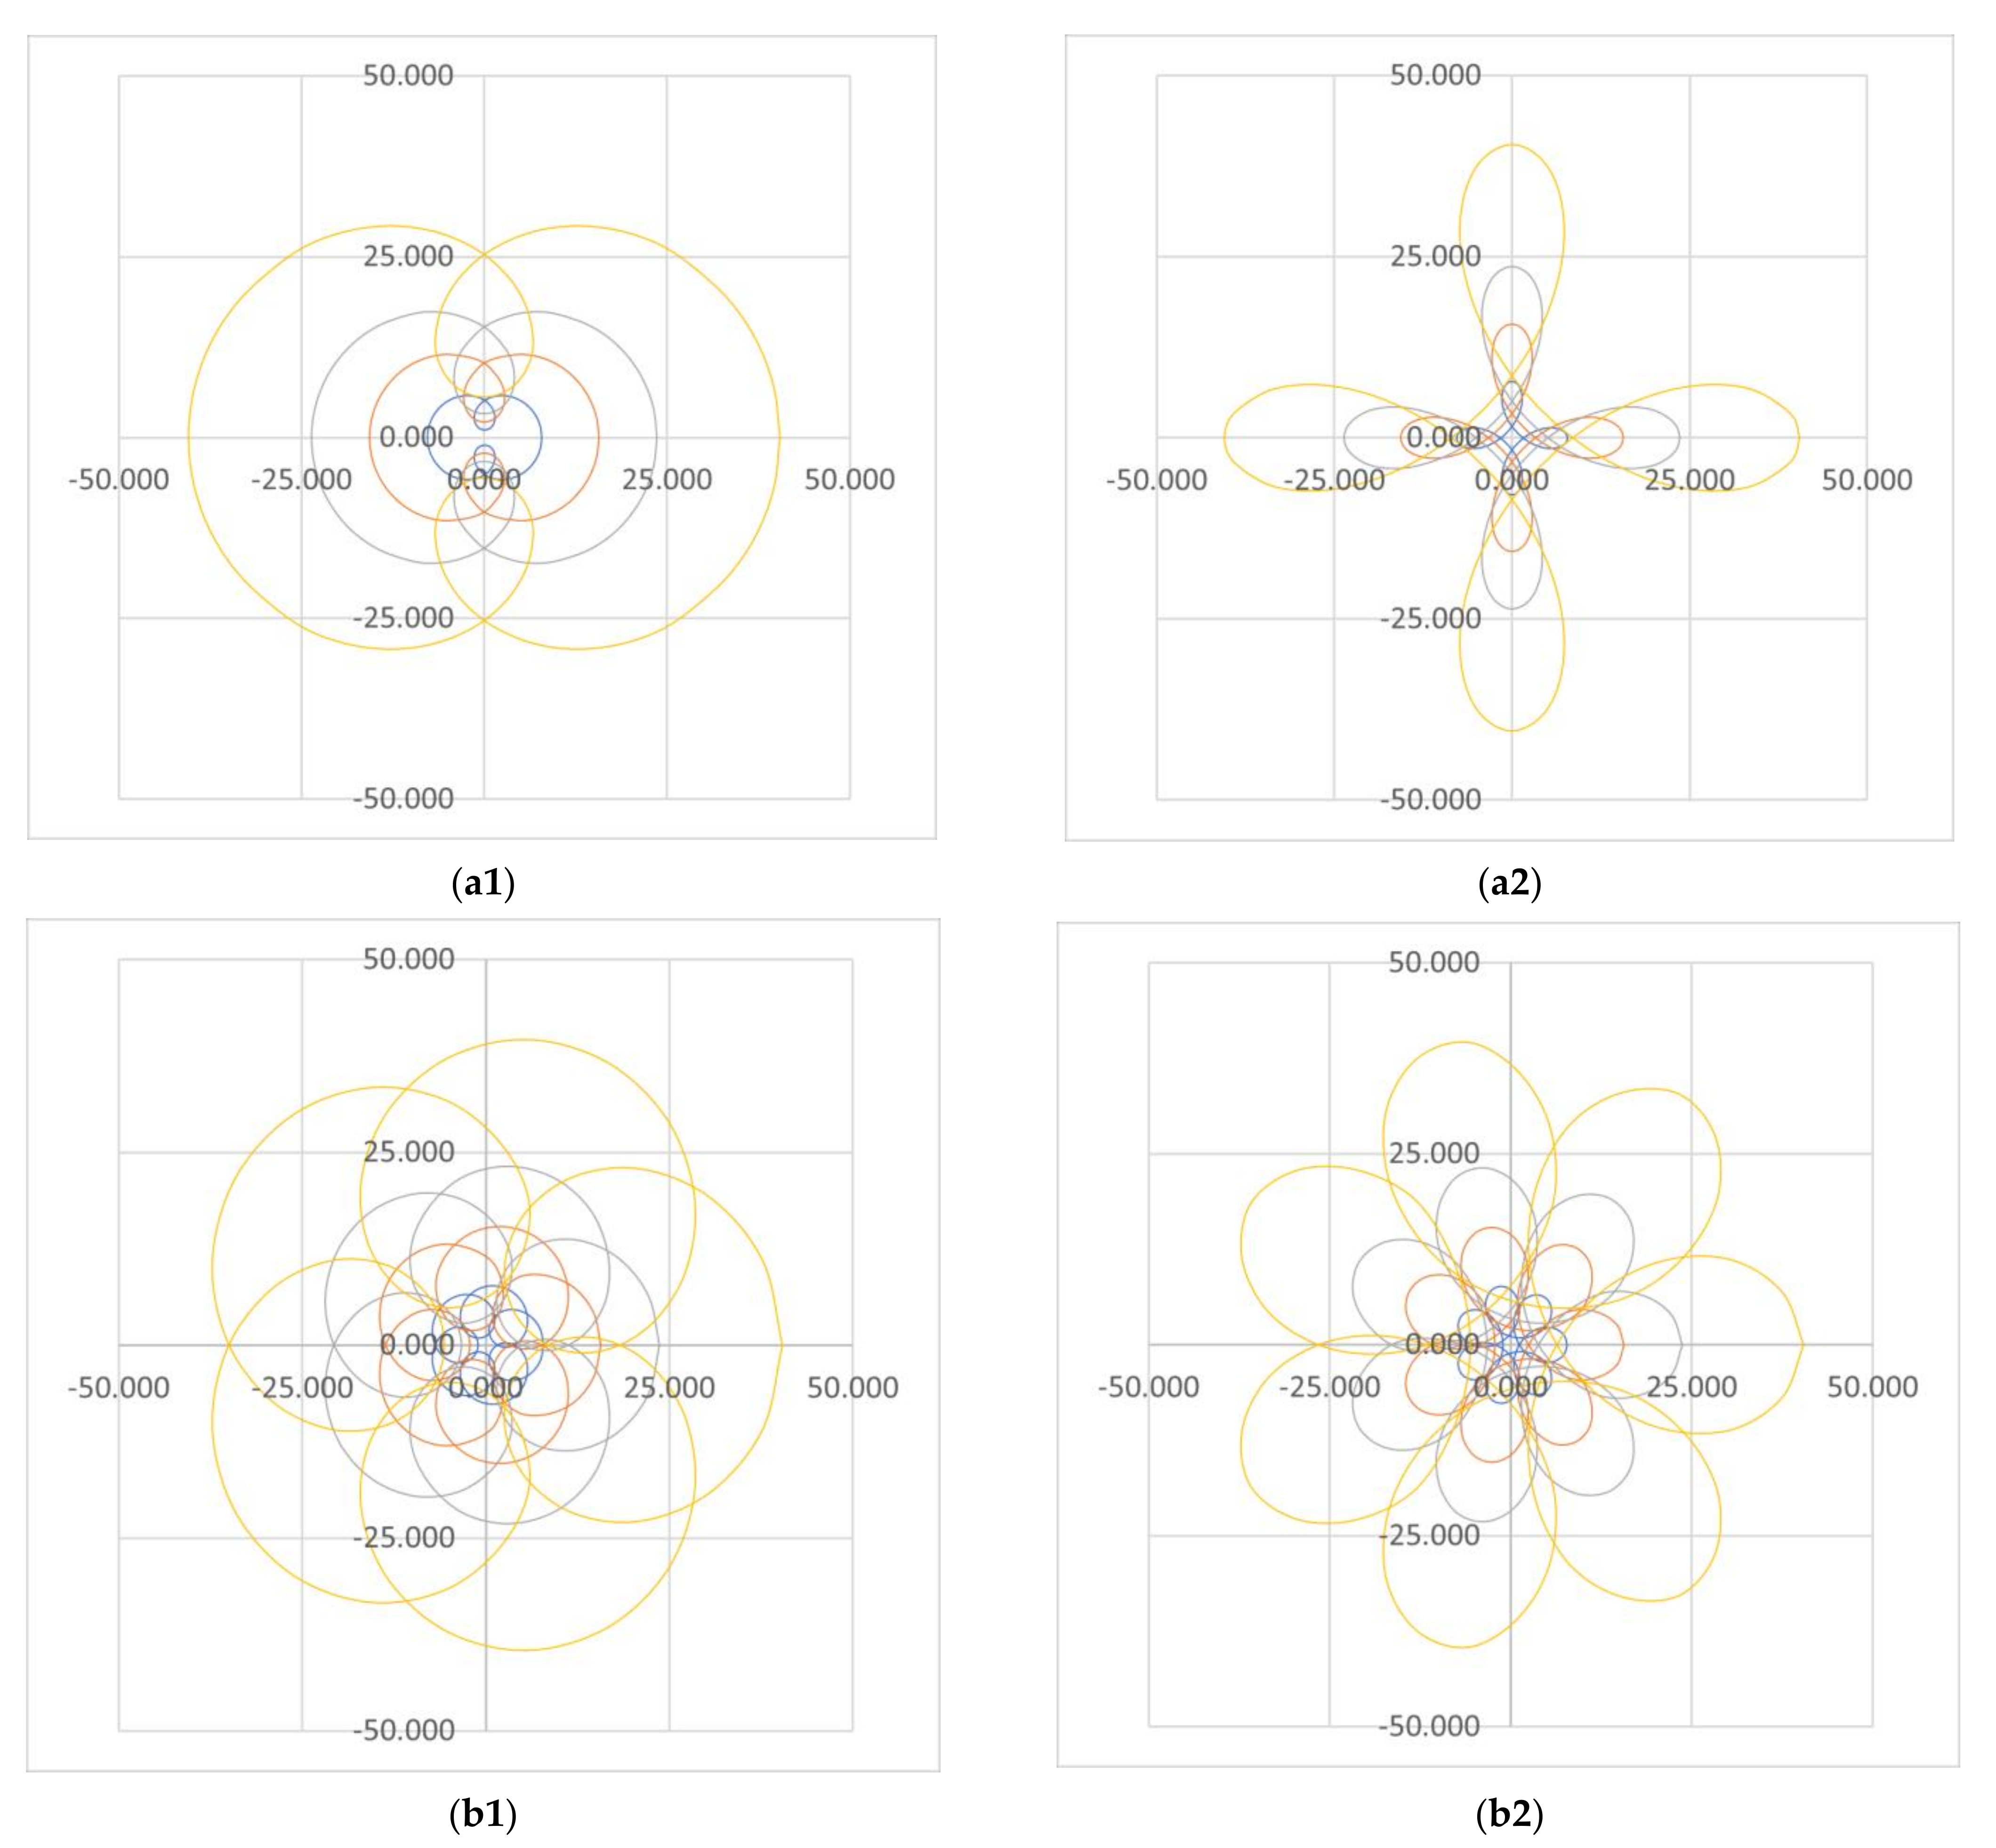
Figure 15 presents a simulation of the patterns obtained for two values of |M|, equal to 3 and 6, for both positive and negative values of M. Pairs of identical prisms were considered (therefore scanners with k = 1), with (equal) prism deviation angles D1 = D2 = 2° (blue pattern); 4° (orange pattern); 6° (gray pattern); 10° (yellow pattern). Prisms with these deviation angles have been chosen throughout the study because they are commercially available [48]. For the same reason, they have been utilized in experimental validations of theory and simulations related to the developed graphical method [40,41,45,46].
One can observe how the FOV of the generated scan patterns increases in each figure with the deviation angle of the prism. This is according to the trajectory of the beam in Figure 2a, which defines the maximum linear deviation R on the scanned plane (i.e., the radius of the FOV)—to be analyzed in the following sections.

4.6. Scan Patterns Generated for Different Values of the Refractive Index n = n1 = n2

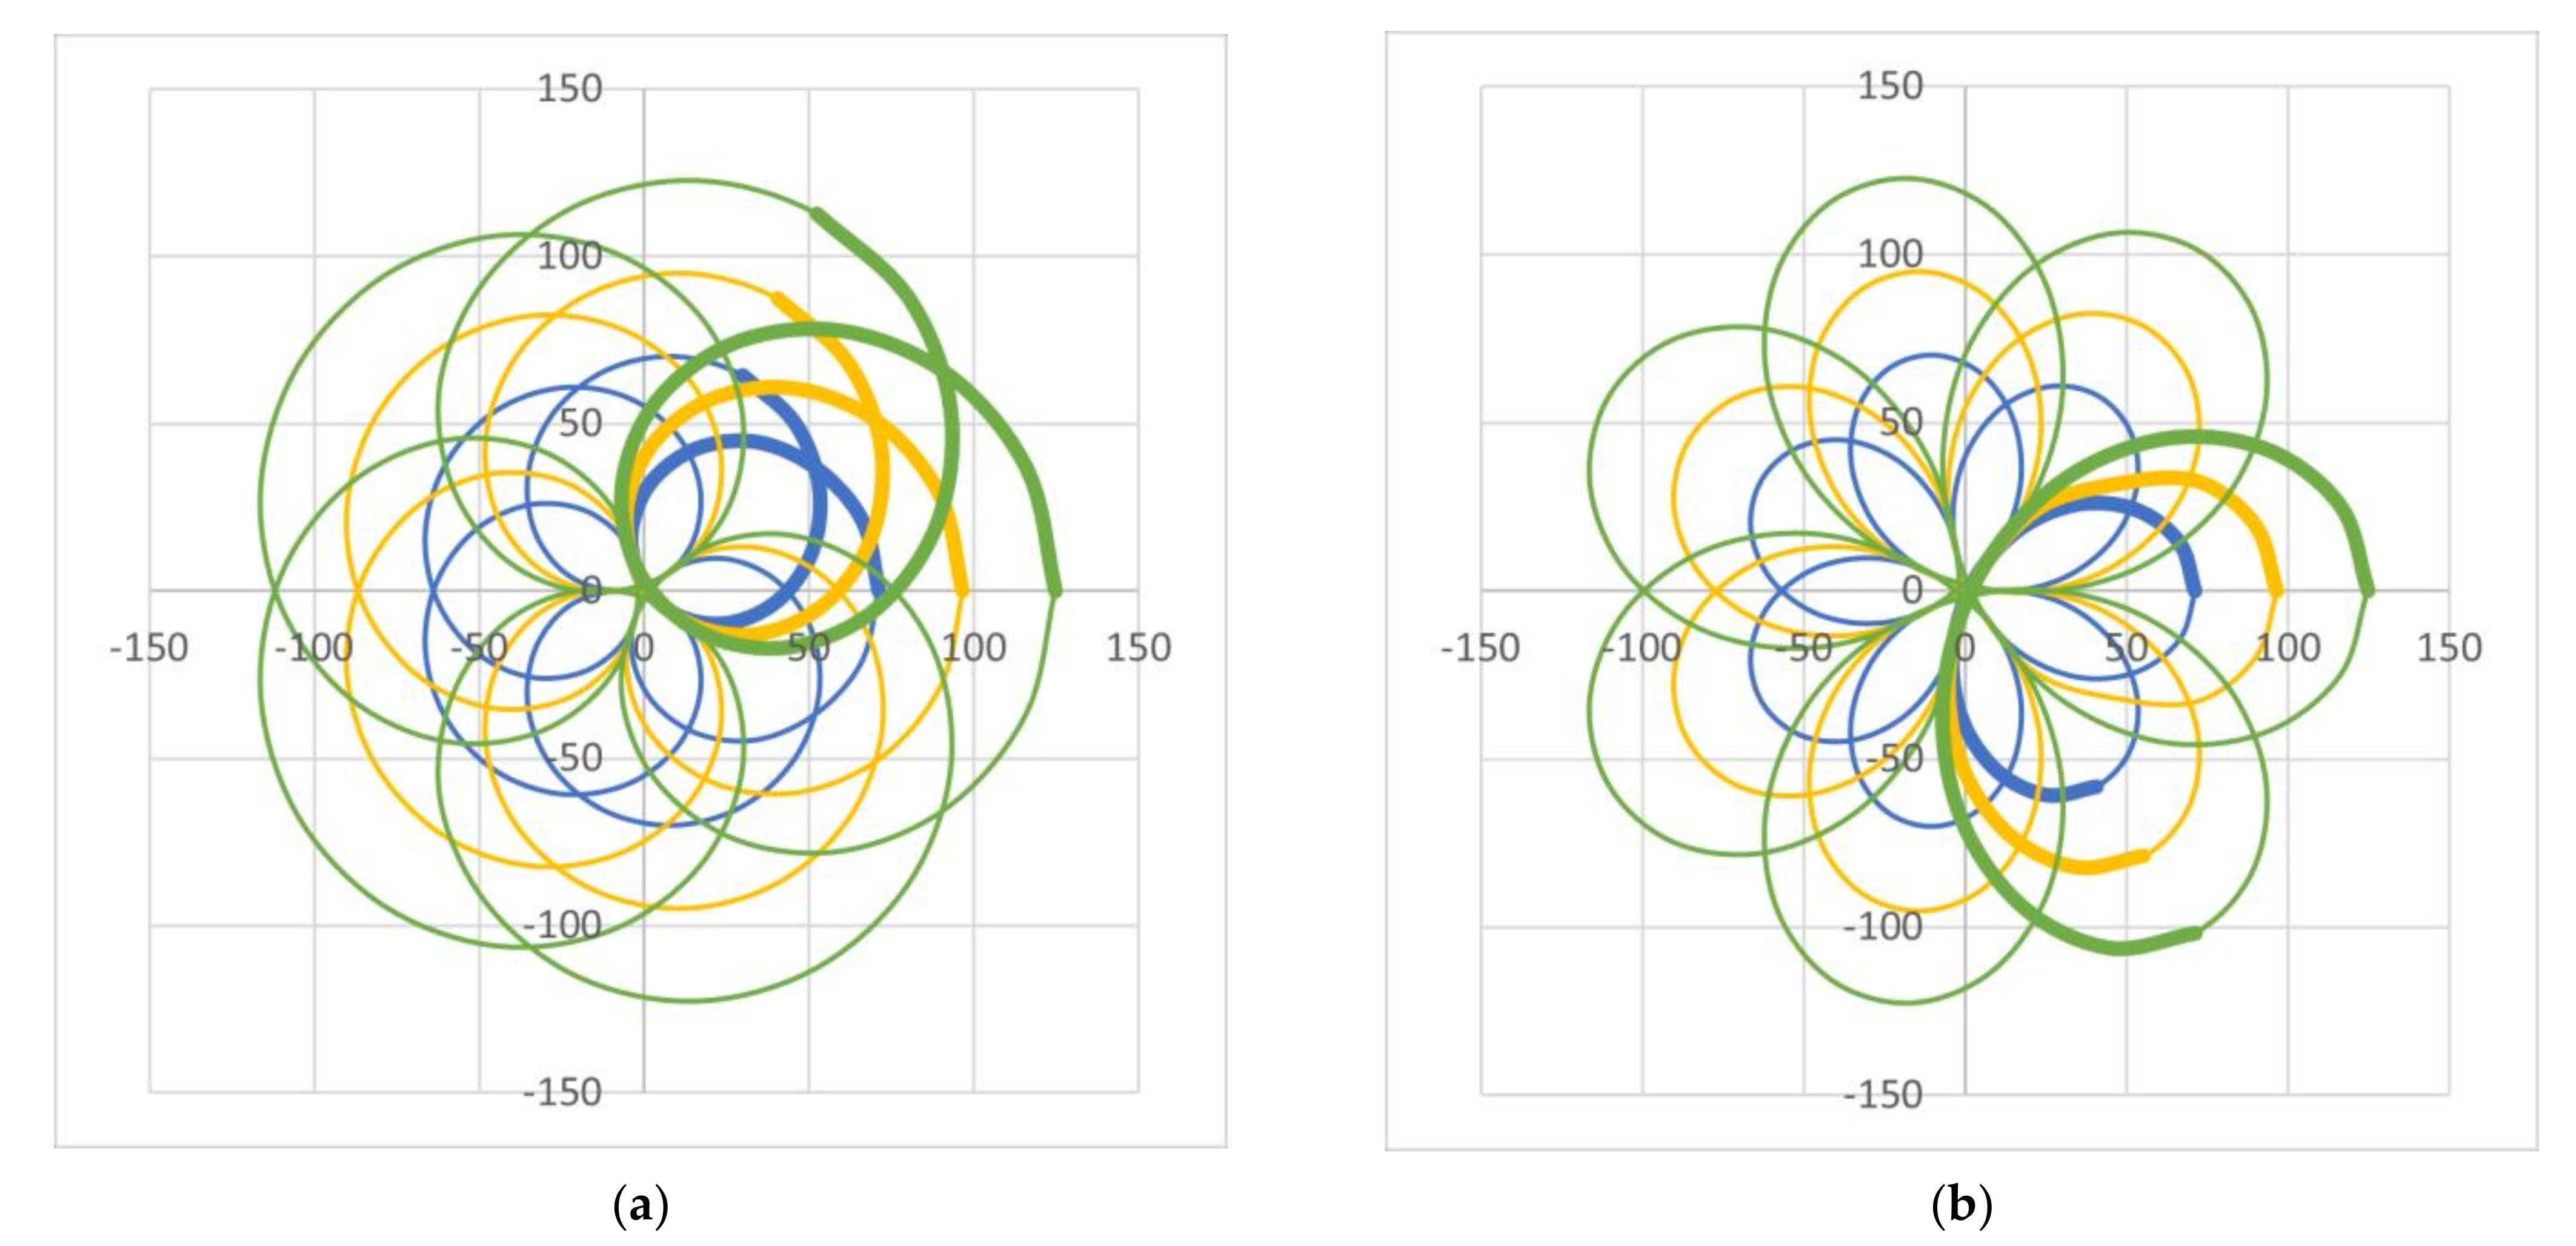
Figure 16 presents the simulations of the patterns for |M| = 6, considering three values of the (equal) refractive index of the two (identical) prisms: n = 1.517, n′ = 1.7, and n″ = 1.9. One can observe how, for the increasing values of the index, the (outer) dimension R of the corresponding scan patterns (as noted in Figure 2a) successively increases as well—in an almost arithmetic progression but which is actually determined by the maximum deviation angle Dmax, as discussed in the following section. However, the shape, therefore the symmetries of the patterns remain the same, regardless of this parameter.

5. Multi-Parameter Analysis of the Scan Patterns

Several conclusions related to symmetry aspects can be extracted from the simulations, to serve as rules-of-thumb for designing a scanner (i.e., for optimally choosing its parameters), to obtain desired scan patterns.

5.1. Analysis Regarding Integer Values of M

  • The symmetries of the patterns are identical for the same M, but with a different number of axes of symmetry about the sign of M—from all the simulations, i.e., from Figure 4, Figure 5, Figure 6, Figure 7, Figure 8, Figure 9, Figure 10, Figure 11, Figure 12, Figure 13, Figure 14, Figure 15 and Figure 16.
  • Inner loops are obtained for M > 0, while outer loops (or petals) are obtained for M < 0, the latter with a reference to rhodonea curves [42]. This aspect can be observed from all the performed simulations, but it has been pointed out in different studies, starting with seminal ones [15]. It does not influence symmetry, but it can be utilized to control the width of the generated loops, as well as their overlap (as pointed out in the following section), to eventually adjust the fill factor (FF) of the patterns.
  • The number of the axes of symmetry of a scan pattern is equal to its number of loops μ, because from [15,40,41], but also from all the simulations performed for M equal to ±2, ±3, ±4, ±5, and ±6 (i.e., from Figure 4, Figure 5, Figure 6, Figure 7, Figure 8, Figure 9, Figure 10, Figure 11, Figure 15 and Figure 16), one has
    μ = M 1 .
    We can conclude that the M ratio is the parameter that essentially determines the symmetries of the patterns. This rule can be verified from each simulation above. For example, for M = 2, there is only one symmetry axis, while for M = −2, there are three such axes (as noticed in Figure 4 and Figure 5, respectively). This rule is valid for all values of M, except for the particular cases of ±1, 0, and ∞, as presented in Table 1.
  • The angle between two consecutive symmetry axes is (as the axes are equally spaced)
    α = 2 π / μ .
  • From Equation (8) and observing the results of the performed simulations, a relationship between the number of loops (therefore, between the number of axes of symmetry) can be obtained [41]:
    μ M < 0 = μ M > 0 + 2 .
  • A higher number of loops is important when a specific application requires to maximize the FF—as most applications do. In such cases, using negative values of M is a method of optimization.
  • The number A of axes of symmetry can be observed from the performed simulations, from Figure 4, Figure 5, Figure 6, Figure 7, Figure 8, Figure 9, Figure 10, Figure 11, Figure 12, Figure 13, Figure 14, Figure 15 and Figure 16 (Table 1). One may notice from the obtained patterns that for an odd value of μ, A = μ, while for an even value of μ, A = 2μ/2. Therefore, in all situations
    A = μ ,     M N * 1 .
    i.e., except for the particular case of M = 1, for which the pattern becomes a circle centered in O, therefore it has an infinity of symmetry axis.
  • From the analysis in Table 1, another form of Equation (10) can be obtained, regarding the number of symmetry axes:
    A M < 0 = A M + 2 .
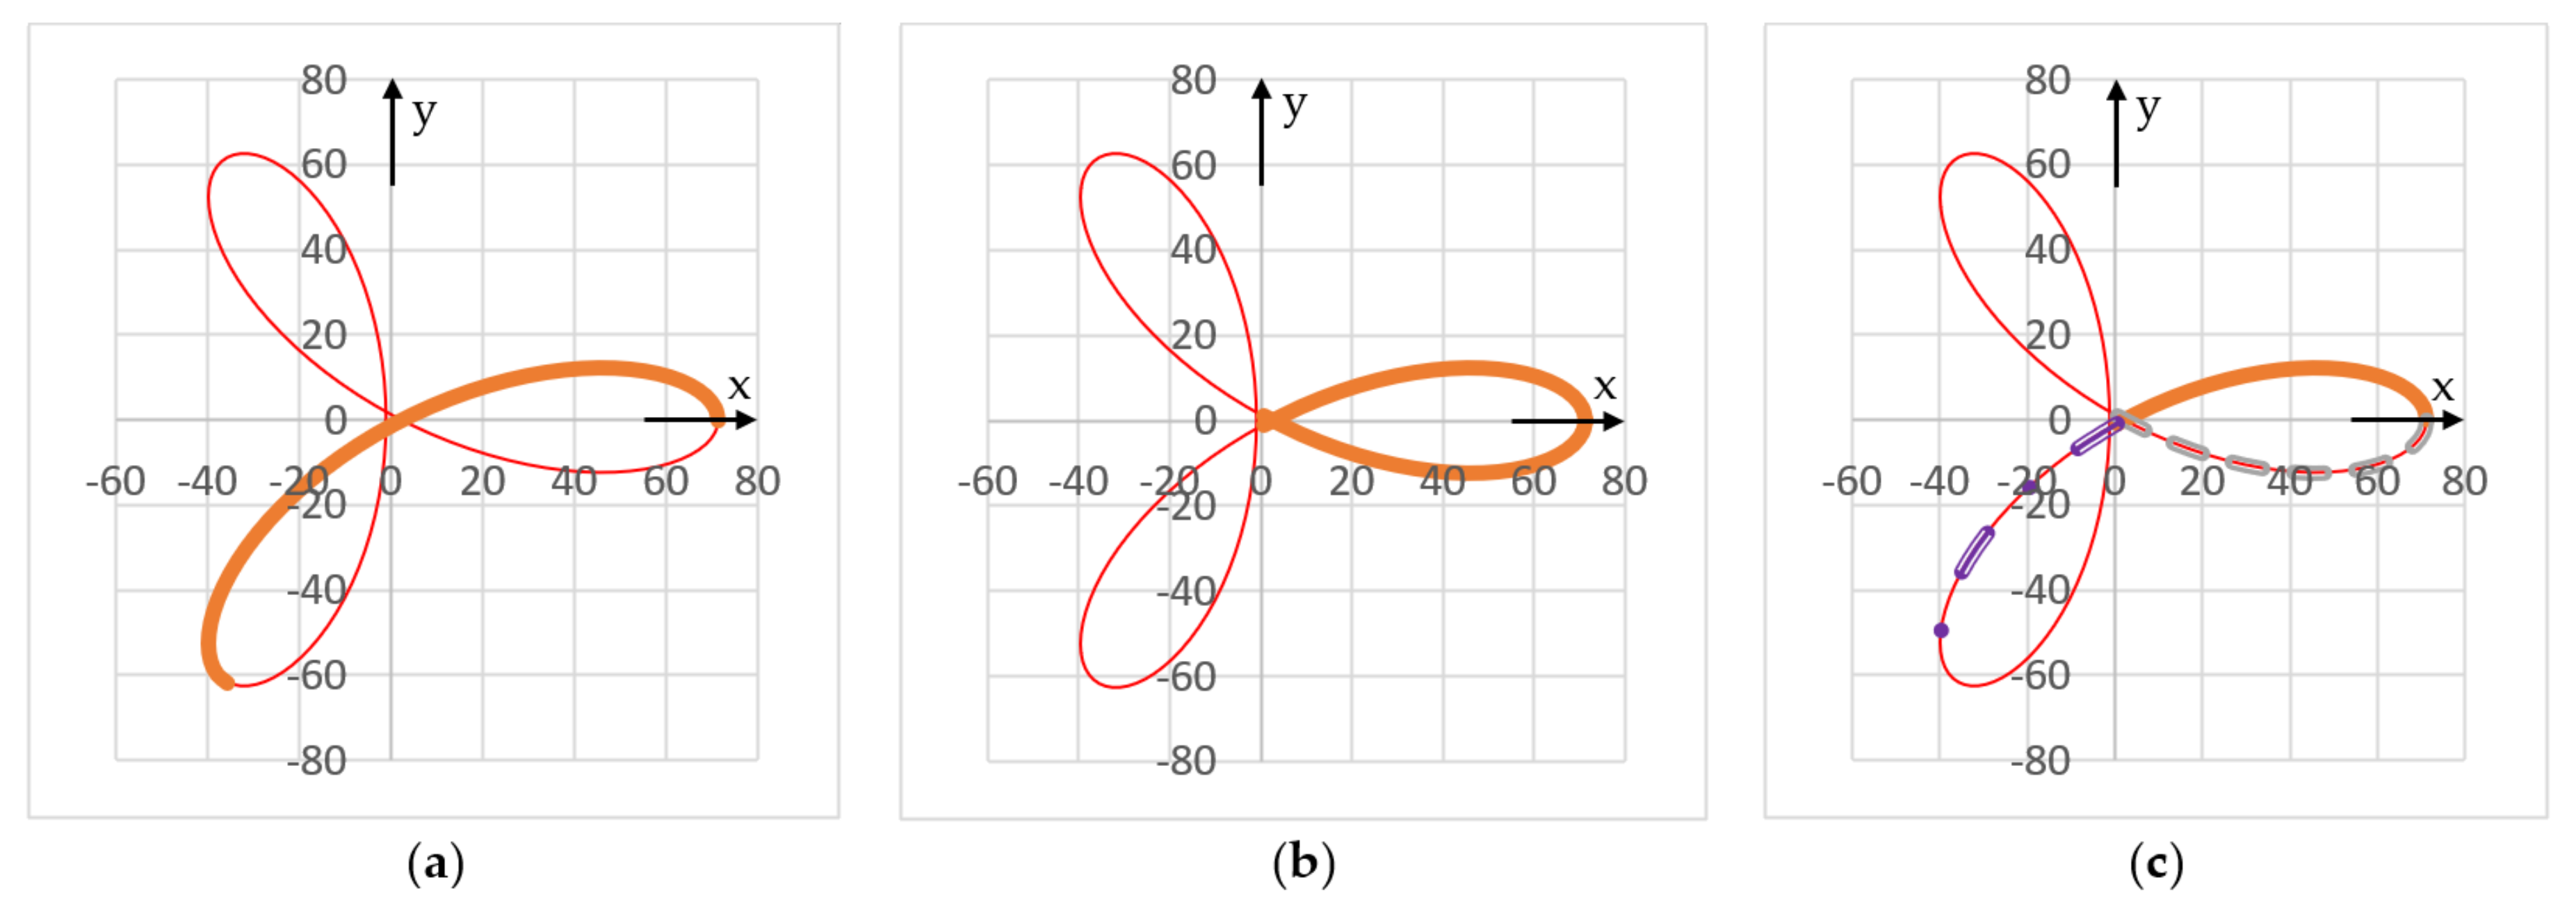
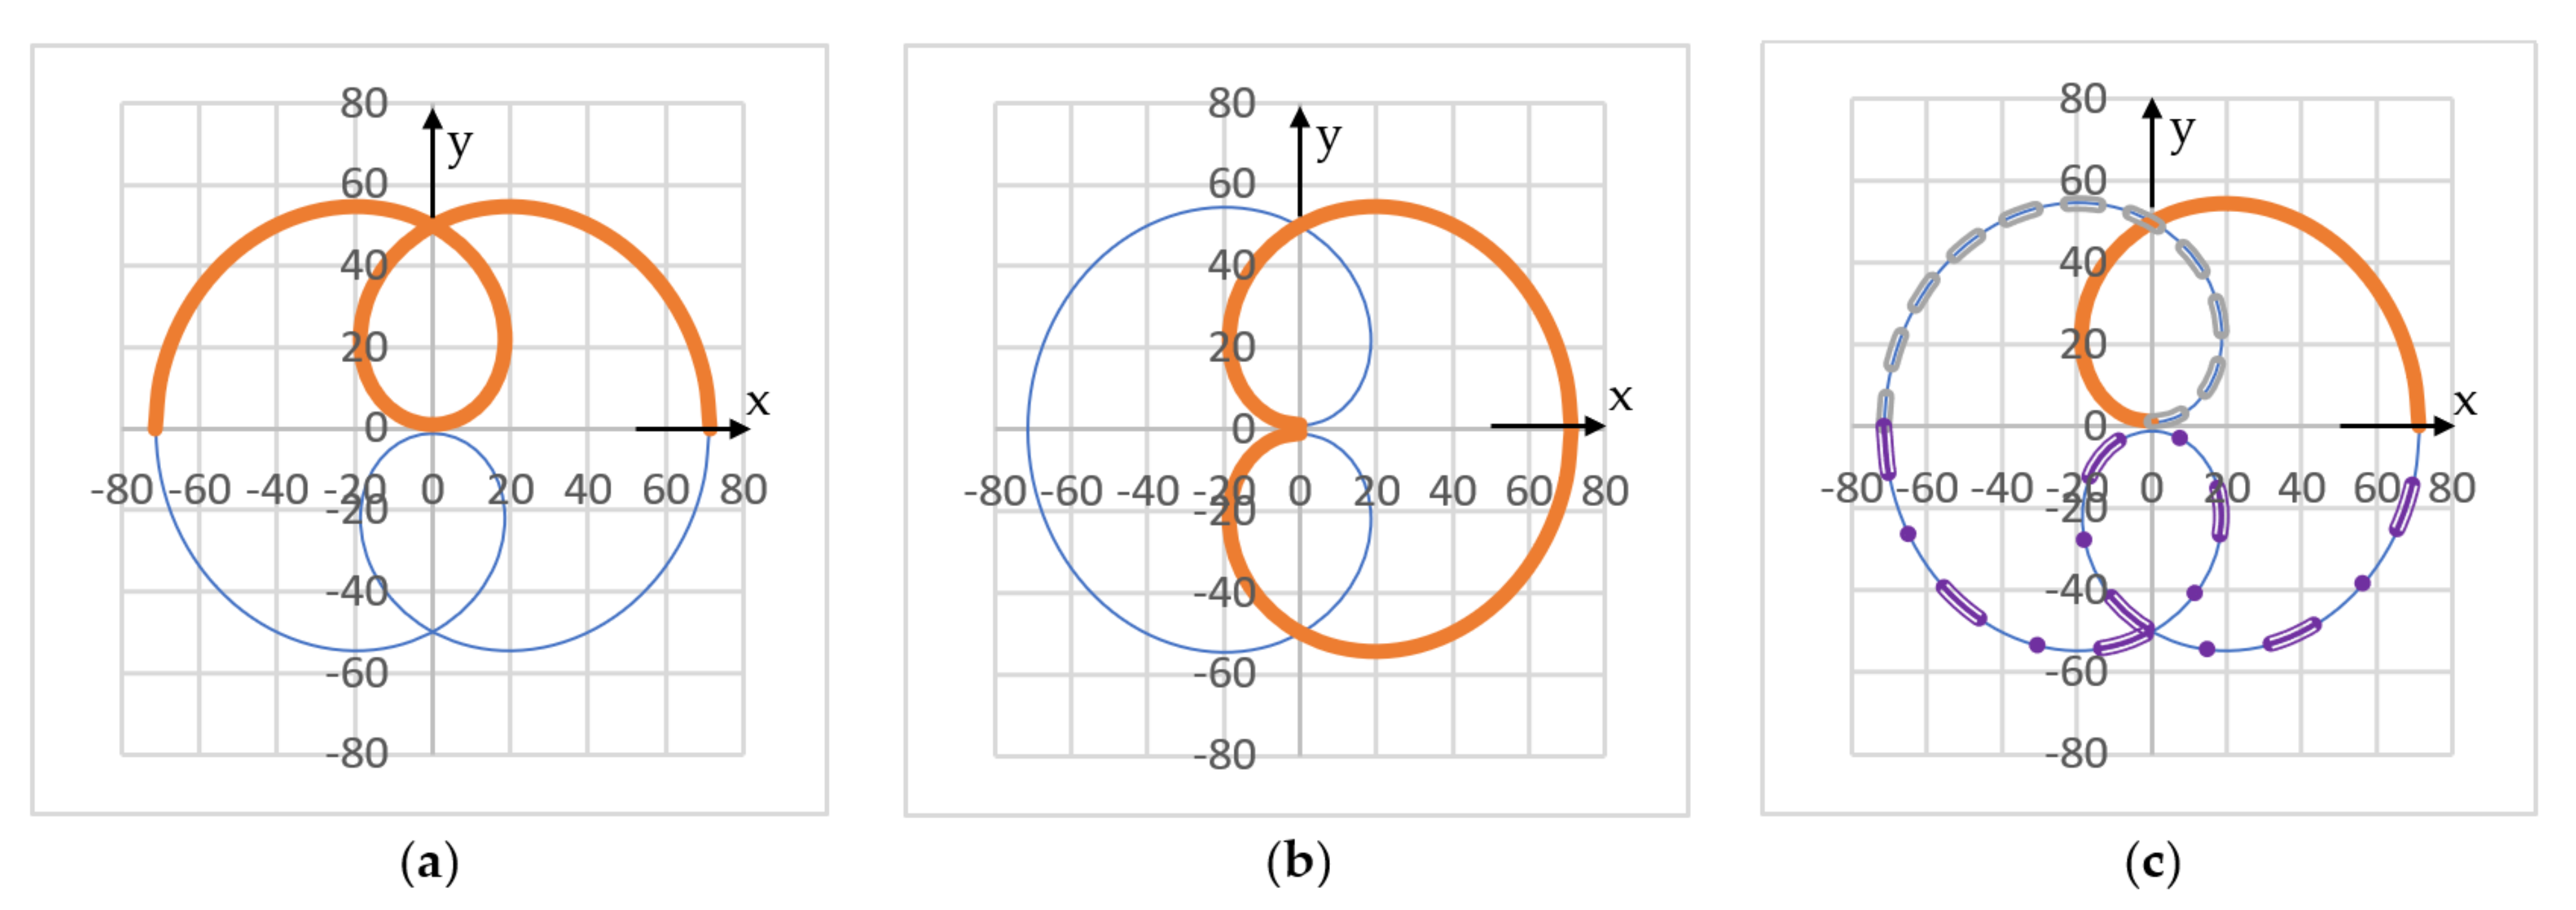
  • Structures of symmetry can be defined using (or extracted from) the patterns. We define such a structure of symmetry as a continuous part of the scan pattern that starts from a symmetry axis and can generate the entire pattern by being replicated with certain angles of rotation for an integer number of times.
The scope of defining and approaching such structures is to ease the process of obtaining the patterns. If one (precisely) obtains such a structure, which has a limited angular extension, by multiplying the structure of symmetry the entire scan pattern can be obtained. Therefore, one does not have to simulate point-by-point the entire pattern; obtaining a structure of symmetry would be enough.
From the definition above, it can be observed that a structure of symmetry is characterized by its angular limits [φmin, φmax] in the polar system of coordinates O defined in Figure 4. Theoretically, an infinity of symmetry structures could be extracted; for example, for M = 3, they could have the angular extension [φmin, φmax + π], where φmin could be chosen with any value between 0 and π. To avoid the number S of structures of symmetry to be undetermined in such a way, we added to the definition above the condition to start each symmetry structure from a symmetry axis (which in practice is Ox).
The limit angles [φmin, φmax] are identified in Table 1, as they are determined for each of the S structures of symmetry that can be identified for each pattern obtained in Section 4.1. This number S is in clear relationship with the values of M and μ. Therefore, from Table 1, the limit angles of the symmetry structures can be obtained:
- For M = 2 => μ = 1 and S = 1, with
φ m i n , φ m a x = 0 ,   π .
Therefore, the full pattern can be obtained by using its only symmetry, regarding Ox.
- For M 1 , 2 ,   3 => μ 2 ,   3 and S = 2, with
φ m i n , φ m a x = 0 ,   2 π / μ π / μ ,   π / μ .
Therefore, the full pattern can be obtained by using its symmetry regarding Ox or regarding Oy, respectively.
- For M = 4 => μ = 3 and S = 3, with
φ m i n , φ m a x = 0 ,   2 π / μ π μ , π μ 0 ,   π .
Therefore, the full pattern can be obtained by rotating the structure of symmetry with angles of 2π/μ for μ times (for the first two structures) or by using a symmetry regarding Ox (for the third structure).
- For M 3 , 4 or |M| > 5 => μ 4 and S = 4, with
φ m i n , φ m a x = 0 ,   2 π / μ π μ , π μ 0 ,   π π / 2 ,   π / 2 .
Therefore, the full pattern can be obtained by rotating the structure of symmetry with 2π/μ for μ times (for the first two structures) or by using a symmetry with regard to Ox or with regard to Oy, for the third and fourth structure, respectively. The former case is presented for M = 5 in the Supplementary Material, Video S1—besides the constructions in Figure 7, Figure 9, Figure 11 and Figure 14, Figure 15 and Figure 16. The specific procedure in the example presented in the Supplementary Material was performed using the structure defined in Figure 10a.
We must highlight that, in order to further simplify the process of obtaining a pattern, one may utilize only half of the loop (that is generated precisely), pointed out in each of the last graph in Figure 4, Figure 5, Figure 6, Figure 7, Figure 8, Figure 9, Figure 10 and Figure 11. This half-loop can be then multiplied using symmetries to draw the entire pattern.
  • In applications, in order to be able to precisely predict the positioning of the (laser) spot at every moment and thus, to have repeatability, integer values of |M| > 1 are of the highest interest, because such values have the fundamental property of generating closed patterns, identical at every full rotation of the slow-moving prism (which is always Prism 1—Figure 1, Figure 2 and Figure 3). Moreover, such closed patterns simplify the control of the scanning process, which is always an issue—regarding both sensors and control structures for scanners of all types, both with oscillatory and with rotational elements [49,50,51].

5.2. Analysis Regarding Fractional Values of M

  • Fractional values of M were only briefly considered in the present study because, as shown in Figure 12, such M ratios produce multiple spiral-like curves. Such patterns are closed if M is a rational fraction, and in that case, there is a certain symmetry; however, such patterns may be utilized only in part, i.e., for one of the spiral-like patterns. From the point of view of the scanning process, such cases are not of particular interest, as from Equation (1) they are obtained for ω1 > ω2. Therefore, the scan time is the same as in the M > 1 cases, equal to the rotation period of the slow-moving prism (which is, in the M > 1 case, Prism 2—Figure 1, Figure 2 and Figure 3), while the FF is not necessarily higher (as the latter only depends on |M| and the sign of M).
  • If M is an irrational fraction, then the generated pattern is not closed, and symmetries cannot be extracted for such specific shapes; however, this latter case can be of interest when a high density (i.e., FF) of the patterns is the scope, in which case symmetries (as well as repeatability and eventually control) of the process might become less important.
  • For the particular cases of M = 0 or M = ∞ (i.e., when the second prism or the first one is fix, respectively, and only the other one is mobile), the produced scan pattern is a circle that is eccentric to the point O. Such a circle has as axis of symmetry the line OP0 = OxFigure 13. These circles can be placed in different positions, by modifying the initial phase of the movement, i.e., by shifting the position of the fixed prism.

5.3. Analysis Regarding Other Parameters of the Scanner

  • The parameter k determines only the shape of the loops, as shown for example in Figure 14. One may observe that regardless of the value of k, the symmetries given by the parameter M are observed, as well.
  • Scan patterns generated for different refractive indexes n of the two (identical) prisms have the same symmetries that are obtained according to the M parameter. However, different dimensions of the scan pattern are obtained (as shown in the examples in Figure 16), according to the minimum and maximum angles, respectively. These angles Dmin, max are provided by Equation (4). They produce the linear deviations (thus, the FOV) deduced and validated experimentally in [41] for all the four possible configurations of such scanners. Such dimensional characteristics are also briefly pointed out in Section 6.
  • Similar to the case of the index n, the angle θ of the (identical) prisms produces only a scaling of the scan patterns (Figure 15). These patterns respect the symmetries achieved for the parameter M, as well, with dimensions according to Equation (4).
  • The distance e between the two prisms and the distance L from the “a” diopter of the second prism and the scanned plane have no effect on symmetries. As studied in [41], these parameters determine only the dimensions and not the shape of the patterns.
As a general conclusion to this section, the ratio M proves to be the essential characteristic to be considered, as it is the only parameter of the scanner that dictates the symmetries of the scan patterns.

6. Symmetry-Related Geometrical Aspects of the Scan Patterns

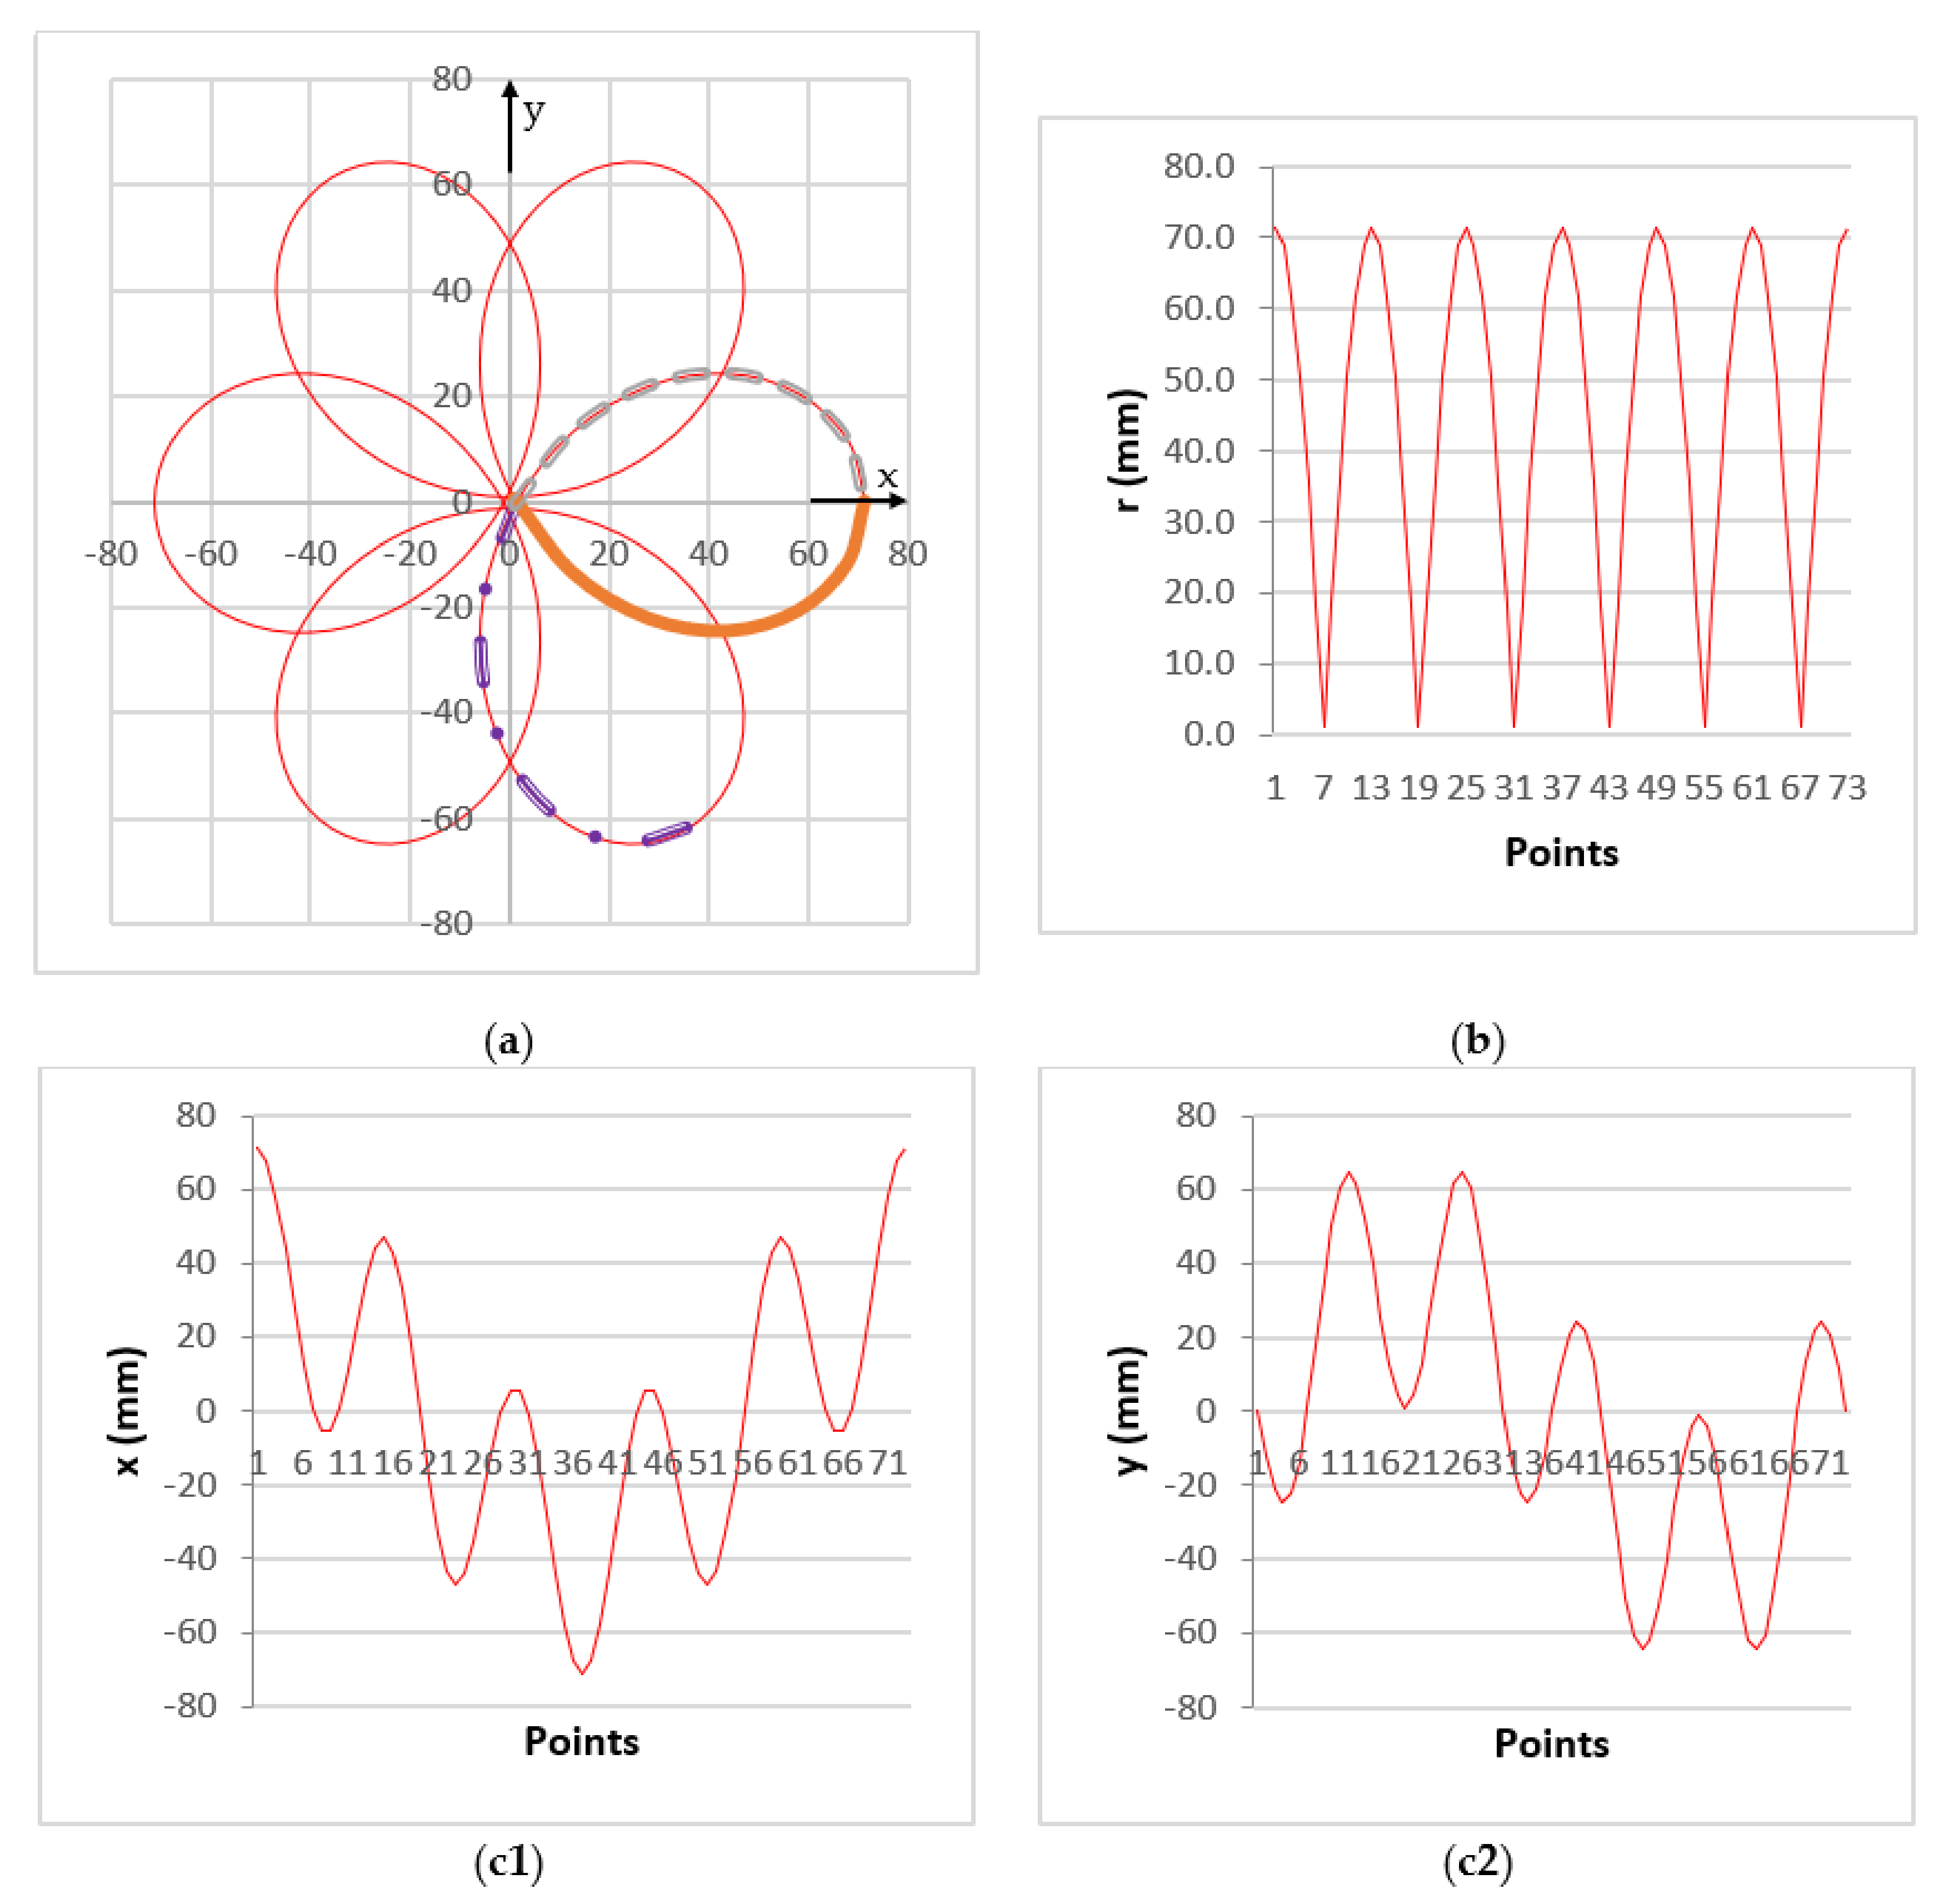
For all the scan patterns obtained using simulations, the rectangular (x, y) or the polar coordinates (r, φ) of the current point P of the patterns (pointed in Figure 4) can be obtained by using the graphical method—as shown in the examples in Figure 17 and Figure 18 for M equal to 5 and −5, respectively. In both Figure 17 and Figure 18, a total of 72 points were considered for the full 2π (rad) rotation of the slow-moving Prism 1 (Figure 1, Figure 2 and Figure 3). Therefore, an incremental angular movement of π/36 = 10° corresponds to the angle between two successive points P(r, φ) considered on the laser spot trajectory.
The r(φ) graph has clear symmetries, with several peaks equal to the number μ of loops for a rotation period of the slow-moving Prism 1 of the system in Figure 1. The x(φ) graph is symmetric regarding the middle of the period, as Ox is an axis of symmetry for each simulation. The y(φ) graph would be symmetric if the origin of movement was moved to the middle of the rotation period (i.e., at φ equal to π).
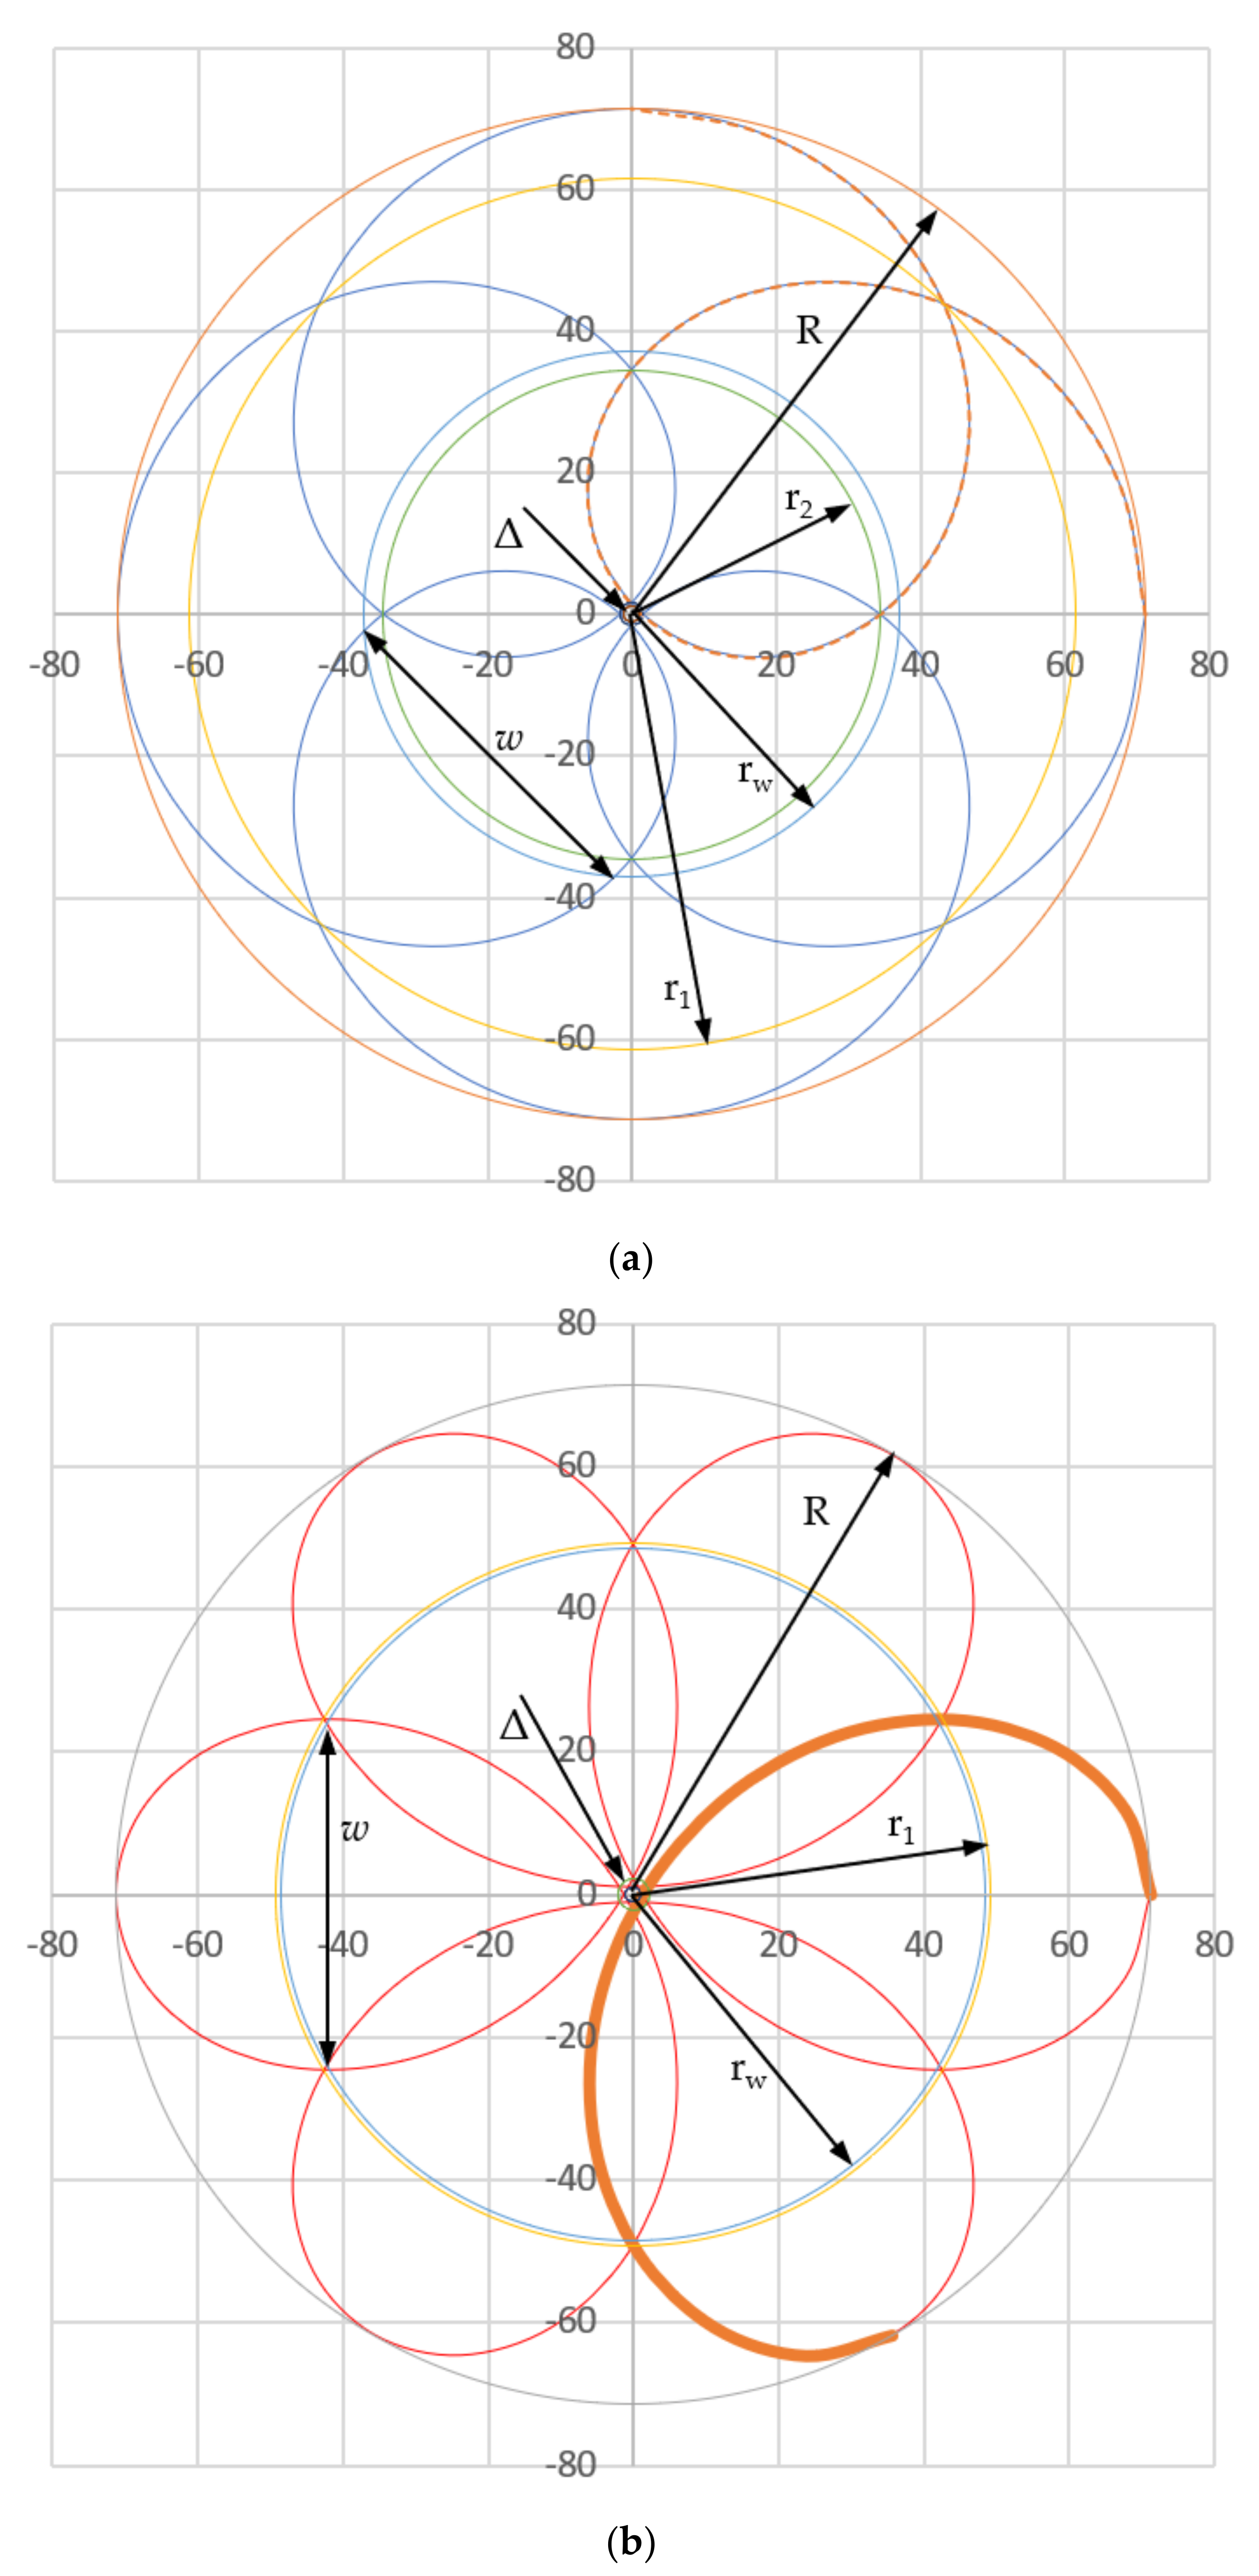
While in the previous section several aspects regarding symmetries were extracted, in the following several dimensional features of the patterns that can be obtained using the graphical method are pointed out, as obtained from the example in Figure 19 for |M| = 5 and for k = 1 (i.e., for identical prisms). The values of these dimensions are provided in Table 2 for M = ±5 (and for the scanner parameters pointed out in Section 3).
  • The FOV of the scanner corresponds to the circle circumscribed to the scan pattern and is characterized by the radius R (Figure 2a). The value of R can be obtained graphically using the simulated pattern in Figure 19 (Table 2). Analytically it has the expression
    R = N I 4 + L · tan D m a x ,
    obtained using the linear deviation N I 4 through the two prisms (determined analytically in [41]) and the maximum deviation angle expressed in Equation (4) (Figure 2a).
  • The radius Δ of the inner circle, inscribed in the scan pattern can be obtained (Table 2), in accordance with the value provided by Equation (7)—identical for M = 5 and M = −5.
  • The radii of the intersections of the loops can be determined graphically: r1, r2, and r3 for M = 5 (Figure 19a), as well as r1 and r2 for M = −5 (Figure 19b), while analytically they would be difficult to obtain.
  • The width w of a loop can also be easily obtained graphically, equal to the double of the maximum y coordinate of a loop regarding the symmetry axis of the loop; this ymax can also be obtained from the graph in Figure 17(c2) and Figure 18(c2).
  • The radius rw that unites the points of the ymax coordinate is obtained directly from Figure 19, but it could also be obtained as (x(ymax)2 + ymax2)1/2, using values extracted from Figure 17 and Figure 18.

7. Experiments

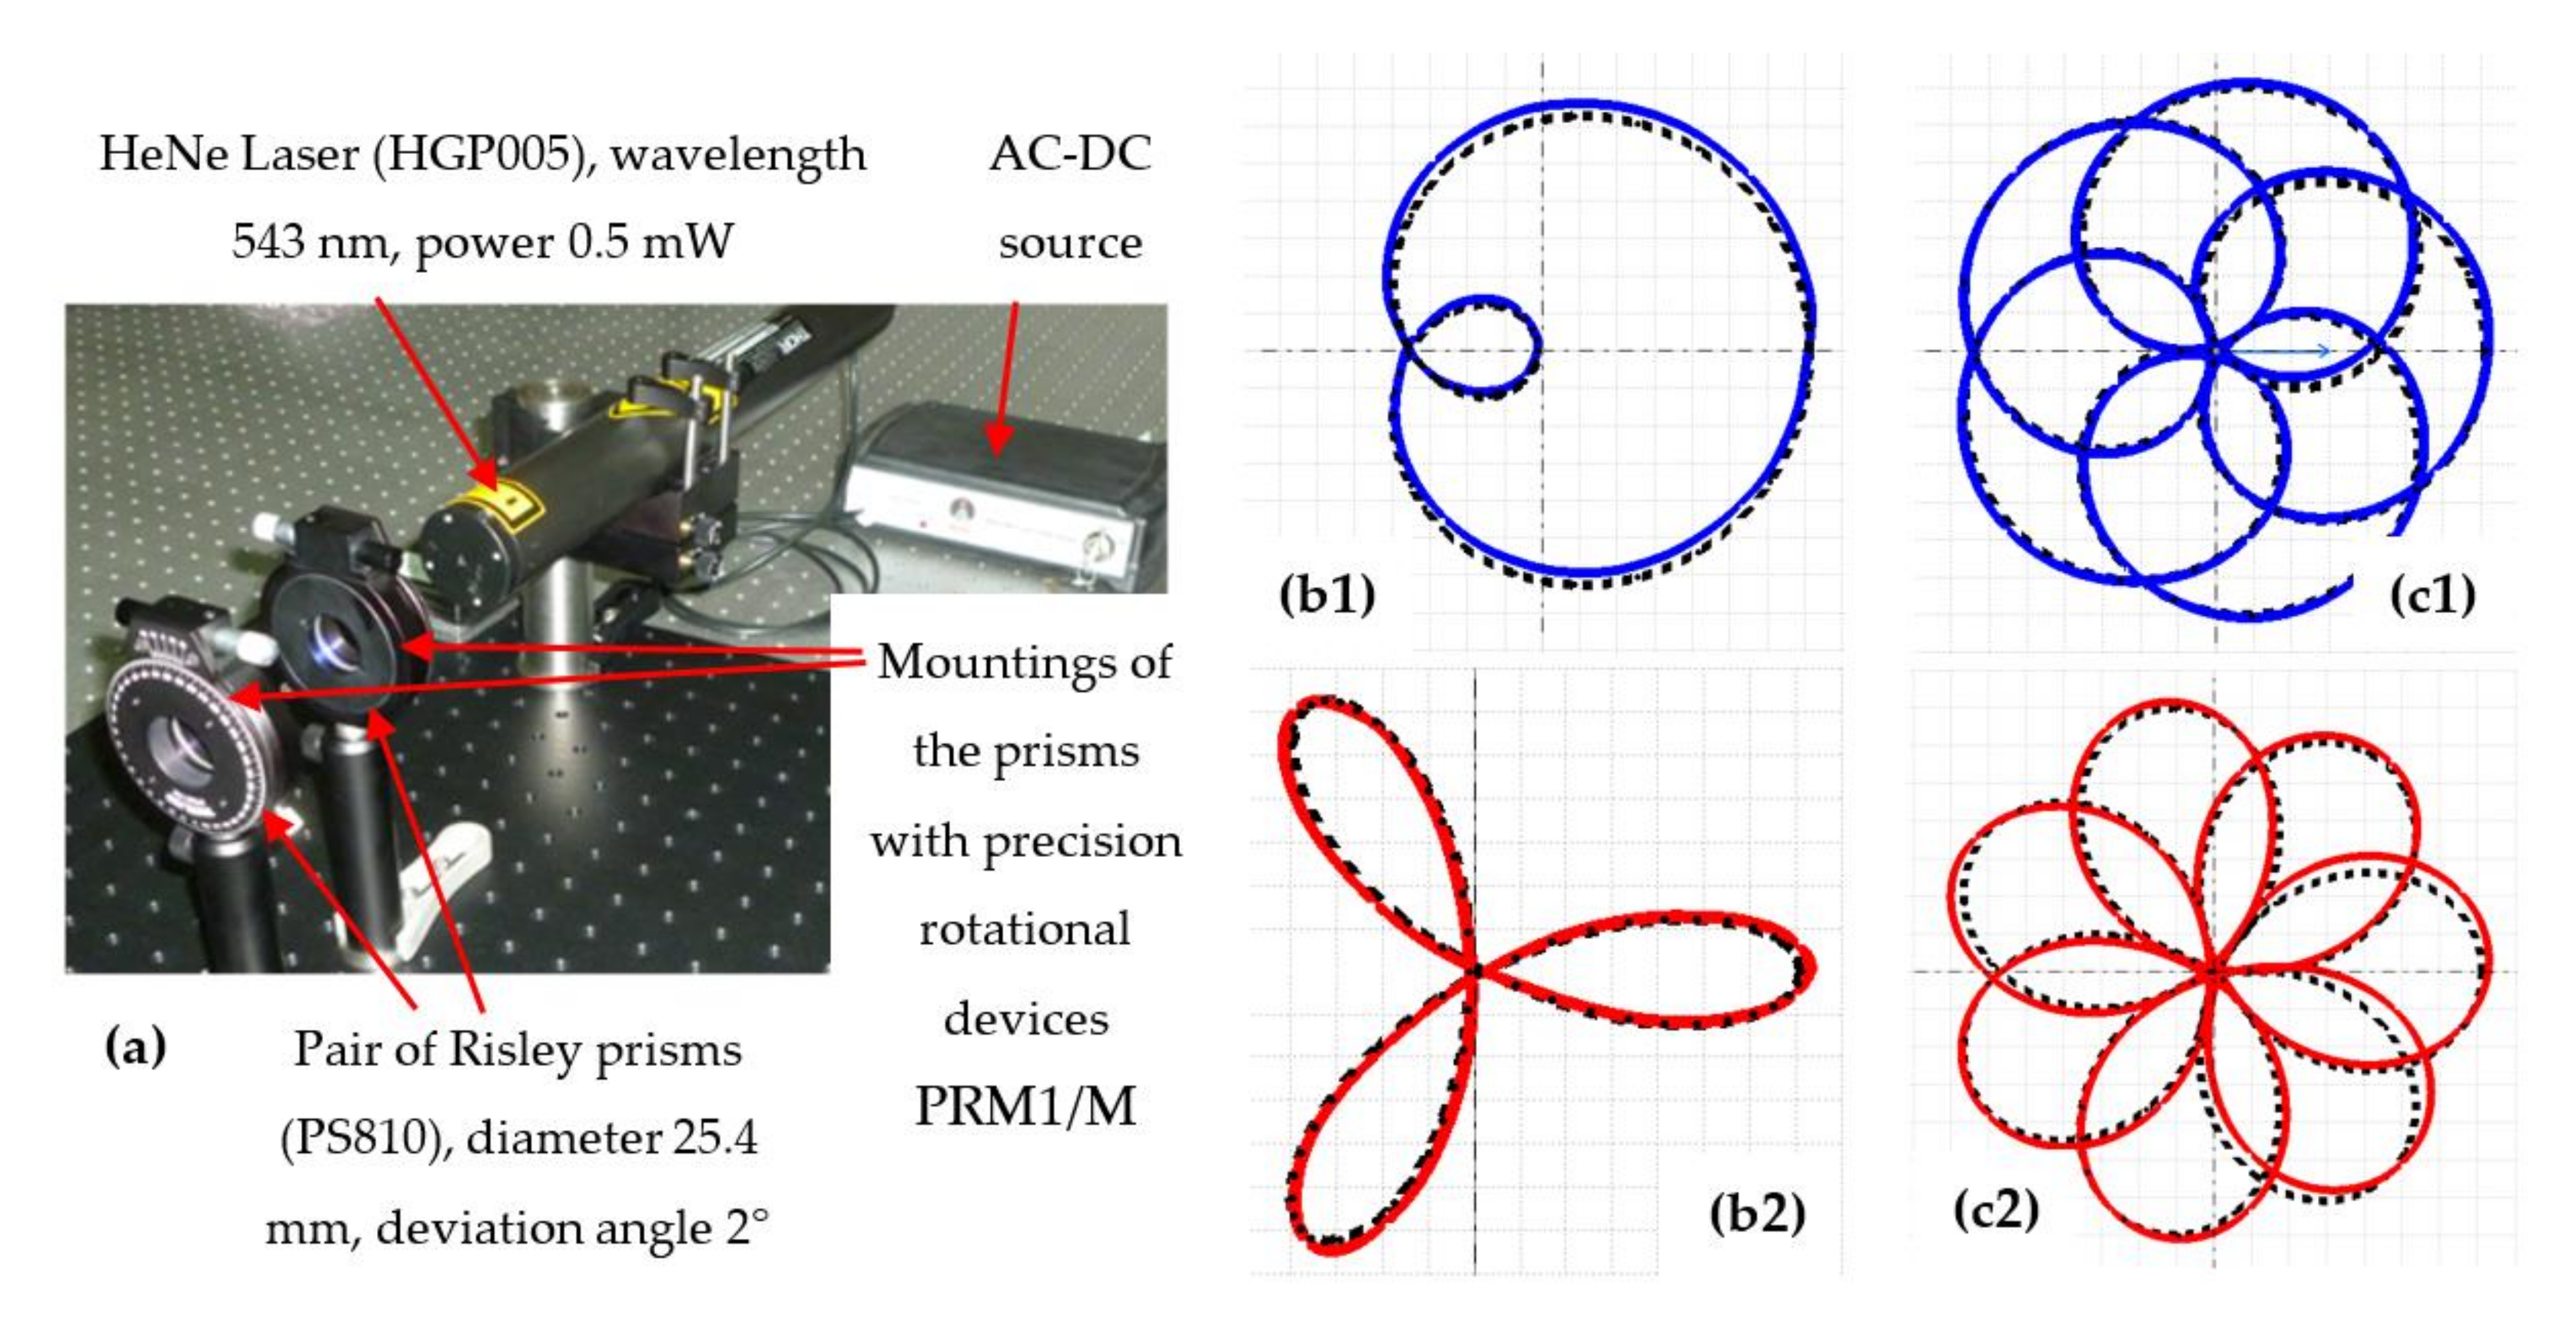
As in our previous works [40,41,45,46], a simple experimental setup was utilized in order to validate the results of the simulations of scanning with a pair of Risley prisms (Figure 20a). All utilized components were commercially available [48], with a pair of Risley prisms; each prism is rotated separately, with a minimum available step of 2′. The HeNe laser produces a beam that passes through the system and produces a scan pattern on a screen (not shown in the figure).
The desired ratio M, Equation (2), has been simulated by producing incremental angular movements Δφ1 and Δφ2 of the two prisms, respectively (where Prism 1 is, as in the simulations, the one close to the laser). In this way, one obtains M = Δφ2φ1. The parameters of the system are e = 25 mm and L = 1 m (i.e., the distances between the two prisms and from the Prism 2 to the screen, respectively—Figure 2), while the prisms are characterized by D = 2°.
Four examples of experimental validations are presented in Figure 20, for |M| = 2 and |M| = 6. The simulated scan patterns (drawn in blue for M > 0 and in red for M < 0) were compared to the experimental patterns (drawn in black) in all the four cases. In order to distinguish the two types of patterns, they were considered with a certain rotational shift with regard to one another. A good agreement was concluded between simulations and experiments, like our previous works [40,41], where other values of M have been considered. This validation is obtained from the relative errors ε between the simulated (R) and the experimental radius R e of the FOV of the pattern (Table 3). In the entire analysis, the experimental radiuses R e were measured for each of the μ loops (Figure 20).
There are certain limitations of this experimental study that cause differences such as those in Table 3 between simulated and experimental patterns: errors in aligning the setup components, in adjusting the e and L distances, as well as in the difference from the refractive index of the prism considered in simulations and the real one, for the utilized light wavelength. Development of more accurate experimental setups is one of the directions of work in our group.

8. Conclusions

The study determined the symmetries of scan patterns produced by a pair of rotational Risley prisms, which is the most common type of laser scanners with such refractive elements. We utilized the graphical method previously introduced [40] and developed [41]. Based on the performed simulations, a multi-parameter analysis was performed. We concluded that Marshall’s ratio M of the rotational velocities of the two prisms is the parameter that determines the symmetries of the patterns.
Other parameters such as prisms angles (as well as their ratio), indexes of refraction, and dimensions of the scanner, impact the dimensions of the patterns. While this latter aspect was approached in detail in our previous study [41], the present work only revealed dimensional features of the scan patterns that are related to symmetry. However, from the analysis regarding to (especially integer values of) M, rules-of-thumb were extracted regarding the number of symmetry axes and the geometrical characteristics of patterns. A novel notion, of structures of symmetry was introduced and defined in a convenient way to allow for generating the full pattern by obtaining only a part of it and then replicating this part using symmetry. In addition to all the scan patterns presented in Figure 4, Figure 5, Figure 6, Figure 7, Figure 8, Figure 9, Figure 10 and Figure 11 (as well as Figure 14, Figure 15 and Figure 16), an example regarding generating the entire pattern using a structure of symmetry is presented for M = 5 in the Supplementary Material, Video S1.
Specific cases were illustrated, as well as other ranges of scanner parameters, such as fractional values of M, to provide the community with a comprehensive study on the subject. Applications of scanners may benefit from this graphical method approach to pattern symmetry, which simplifies the analysis and design of Risley prisms scanners—previously performed by using approximate or complex analytic methods. Future works in our group envision such applications, especially related to biomedical imaging and non-destructive testing. However, the potential of Risley prisms scanning for fields such as laser manufacturing, optical metrology, or Remote Sensing is still to be fully exploited, and these are other avenues of research.

Supplementary Materials

The following supporting information can be downloaded at https://www.mdpi.com/article/10.3390/sym15020336/s1. Video S1: Generating the entire scan pattern of a pair of rotational Risley prisms for M = 5 by using a single loop and then replicating it by rotating it for three times with a successive π/2 angle.

Author Contributions

Conceptualization and methodology, V.-F.D. and A.-L.D.; simulations, A.-L.D.; data analysis, V.-F.D. and A.-L.D.; data curation, A.-L.D.; theory and modelling, V.-F.D.; writing—original draft, V.-F.D. and A.-L.D.; writing—review and editing, V.-F.D.; funding, supervision, and project administration, V.-F.D. All authors have read and agreed to the published version of the manuscript.

Funding

This research was supported by the Romanian Ministry of Research, Innovation and Digitization, CNCS/CCCDI–UEFISCDI, project PN-III-P4-ID-PCE-2020-2600, within PNCDI III (http://3om-group-optomechatronics.ro/, accessed on 1 December 2022). A.-L.D. was also financially supported by the Project ork of excellence in applied research and innovation for doctoral and postdoctoral programs / InoHub project co-funded by the European Social Fund financing agreement no.POCU/993/6/13/153437.

Data Availability Statement

Data supporting the reported results can be obtained from the corresponding author.

Acknowledgments

This paper is based on a presentation prepared for the ‘2nd International Conference–Advances in 3OM: Opto-Mechatronics, Opto-Mechanics, and Optical Metrology’, 11–14 December 2023, Timisoara, Romania.

Conflicts of Interest

The authors declare no conflict of interest. The funders had no role in the design of the study; in the collection, analyses, or interpretation of data; in the writing of the manuscript; or in the decision to publish the results.

References

  1. Bass, M. Handbook of Optics, 3rd ed.; Mc. Graw-Hill Inc.: New York, NY, USA, 2009; pp. 30.1–30.68. [Google Scholar]
  2. Marshall, G.F.; Stutz, G.E. (Eds.) Handbook of Optical and Laser Scanning, 2nd ed.; CRC Press: London, UK, 2011. [Google Scholar]
  3. Kiyokura, T.; Ito, T.; Sawada, R. Small Fourier transform spectroscope using an integrated prism-scanning interferometer. Appl. Spectrosc. 2001, 55, 1628–1633. [Google Scholar] [CrossRef]
  4. Garcia-Torales, G.; Strojnik, M.; Paez, G. Risley prisms to control wave-front tilt and displacement in a vectorial shearing interferometer. Appl. Opt. 2002, 41, 1380–1384. [Google Scholar] [CrossRef]
  5. Oka, K.; Kaneko, T. Compact complete imaging polarimeter using birefringent wedge prisms. Opt. Express 2003, 11, 1510–1519. [Google Scholar] [CrossRef]
  6. Tao, X.; Cho, H.; Janabi-Sharifi, F. Optical design of a variable view imaging system with the combination of a telecentric scanner and double wedge prisms. Appl. Opt. 2010, 49, 239–246. [Google Scholar] [CrossRef] [PubMed]
  7. Wang, Z.; Cao, J.; Hao, Q.; Zhang, F.; Cheng, Y.; Kong, X. Superresolution imaging and field of view extension using a single camera with Risley prisms. Rev. Sci. Instrum. 2019, 90, 33701. [Google Scholar] [CrossRef] [PubMed]
  8. Li, A.; Liu, X.; Gong, W.; Sun, W.; Sun, J. Prelocation image stitching method based on flexible and precise boresight adjustment using Risley prisms. JOSA A 2019, 36, 305–311. [Google Scholar] [CrossRef]
  9. Li, A.; Yi, W.; Zuo, Q.; Sun, W. Performance characterization of scanning beam steered by tilting double prisms. Opt. Express 2016, 24, 23543–23556. [Google Scholar] [CrossRef]
  10. Li, A.; Jiang, X.; Sun, J.; Wang, L.; Li, Z.; Liu, L. Laser coarse-fine coupling scanning method by steering double prisms. Appl. Opt. 2012, 51, 356–364. [Google Scholar] [CrossRef]
  11. Florea, C.; Sanghera, J.; Aggarwal, I. Broadband beam steering using chalcogenide-based Risley prisms. Opt. Eng. 2011, 50, 033001. [Google Scholar]
  12. Zhou, Y.; Fan, D.; Fan, S.; Chen, Y.; Liu, G. Laser scanning by rotating polarization gratings. Appl. Opt. 2016, 55, 5149–5157. [Google Scholar] [CrossRef]
  13. Roy, G.; Cao, X.; Bernier, R.; Roy, S. Enhanced scanning agility using a double pair of Risley prisms. Appl. Opt. 2015, 54, 10213–10226. [Google Scholar] [CrossRef] [PubMed]
  14. Li, A.; Gong, W.; Zhang, Y.; Liu, X. Investigation of scan errors in the three-element Risley prism pair. Opt. Express 2018, 26, 25322–25335. [Google Scholar]
  15. Marshall, G.F. Risley Prism Scan Patterns. Proc. SPIE 1999, 3787, 74–86. [Google Scholar]
  16. Yang, Y. Analytic solution of free space optical beam steering using Risley prisms. J. Light. Technol. 2008, 26, 3576–3583. [Google Scholar] [CrossRef]
  17. Li, Y. Third-order theory of the Risley-prism-based beam steering system. Appl. Opt. 2011, 50, 679–686. [Google Scholar] [CrossRef]
  18. Li, Y. Closed form analytical inverse solutions for Risley-prism-based beam steering systems in different configurations. Appl. Opt. 2011, 50, 4302–4309. [Google Scholar] [CrossRef]
  19. Lai, S.-F.; Lee, C.-C. Analytic inverse solutions for Risley prisms in four different configurations for positing and tracking systems. Appl. Opt. 2018, 57, 10172–10182. [Google Scholar] [CrossRef]
  20. Montagu, J. Scanners-galvanometric and resonant. In Encyclopedia of Optical and Photonic Engineering; CRC Press: Boca Raton, FL, USA, 2003; pp. 2465–2487. [Google Scholar]
  21. Benner, W.R. Laser Scanners: Technologies and Applications; Pangolin Laser Systems Inc.: Lexington, KY, USA, 2016. [Google Scholar]
  22. Duma, V.-F.; Tankam, P.; Huang, J.; Won, J.J.; Rolland, J.P. Optimization of galvanometer scanning for Optical Coherence Tomography. Appl. Opt. 2015, 54, 5495–5507. [Google Scholar] [CrossRef]
  23. Duma, V.-F. Laser scanners with oscillatory elements: Design and optimization of 1D and 2D scanning functions. Appl. Math. Model. 2019, 67, 456–476. [Google Scholar] [CrossRef]
  24. Grulkowski, I.; Gorczynska, I.; Szkulmowski, M.; Szlag, D.; Szkulmowska, A.; Leitgeb, R.A.; Kowalczyk, A.; Wojtkowski, M. Scanning protocols dedicated to smart velocity ranging in Spectral OCT. Opt. Express 2009, 17, 23736–23754. [Google Scholar] [CrossRef]
  25. Ju, M.J.; Heisler, M.; Athwal, A.; Sarunic, M.V.; Jian, Y. Effective bidirectional scanning pattern for optical coherence tomography angiography. Biomed. Opt. Express 2018, 9, 2336. [Google Scholar] [CrossRef] [PubMed] [Green Version]
  26. Liu, J.; You, X.; Wang, Y.; Gu, K.; Liu, C.; Tan, J. The alpha-beta circular scanning with large range and low noise. J. Microsc. 2017, 266, 107–114. [Google Scholar] [CrossRef] [PubMed]
  27. Carrasco-Zevallos, O.M.; Viehland, C.; Keller, B.; McNabb, R.P.; Kuo, A.N.; Izatt, J.A. Constant linear velocity spiral scanning for near video rate 4D OCT ophthalmic and surgical imaging with isotropic transverse sampling. Biomed. Opt. Express 2018, 9, 5052. [Google Scholar] [CrossRef] [PubMed]
  28. Hwang, K.; Seo, Y.-H.; Ahn, J.; Kim, P.; Jeong, K.-H. Frequency selection rule for high definition and high frame rate Lissajous scanning. Sci. Rep. 2017, 7, 14075. [Google Scholar] [CrossRef] [Green Version]
  29. Tanguy, Q.A.A.; Gaiffe, O.; Passilly, N.; Cote, J.-M.; Cabodevila, G.; Bargiel, S.; Lutz, P.; Xie, H.; Gorecki, C. Real-time Lissajous imaging with a low-voltage 2-axis MEMS scanner based on electrothermal actuation. Opt. Express 2020, 28, 8512. [Google Scholar] [CrossRef] [PubMed]
  30. Draelos, M.; Viehland, C.; McNabb, R.P.; Kuo, A.N.; Izatt, J.A. Adaptive point-scan imaging beyond the frame rate–resolution limit with scene-reactive scan trajectories. Optica 2022, 9, 1276–1288. [Google Scholar] [CrossRef]
  31. Li, Y. Beam deflection and scanning by two-mirror and two-axis systems of different architectures: A unified approach. Appl. Opt. 2008, 47, 5976–5985. [Google Scholar] [CrossRef] [PubMed]
  32. Duma, V.-F. Polygonal mirror laser scanning heads: Characteristic functions. Proc. Rom. Acad. Ser. A 2017, 18, 25–33. [Google Scholar]
  33. Duma, V.-F.; Duma, M.-A. Optomechanical Analysis and Design of Polygon Mirror-Based Laser Scanners. Appl. Sci. 2022, 12, 5592. [Google Scholar] [CrossRef]
  34. Available online: https://www.scanlab.de/en/products/scan-systems (accessed on 17 December 2022).
  35. Gora, M.J.; Suter, M.J.; Tearney, G.J.; Li, X. Endoscopic optical coherence tomography: Technologies and clinical applications. Biomed. Opt. Express 2017, 8, 2405–2444. [Google Scholar] [CrossRef] [Green Version]
  36. Cogliati, A.; Canavesi, C.; Hayes, A.; Tankam, P.; Duma, V.-F.; Santhanam, A.; Thompson, K.P.; Rolland, J.P. MEMS-based handheld scanning probe with pre-shaped input signals for distortion-free images in Gabor-Domain Optical Coherence Microscopy. Opt. Express 2016, 24, 13365–13374. [Google Scholar] [CrossRef]
  37. Strathman, M.; Liu, Y.; Keeler, E.G.; Song, M.; Baran, U.; Xi, J.; Sun, M.-T.; Wang, R.; Li, X.; Lin, L.Y. MEMS scanning micromirror for optical coherence tomography. Biomed. Opt. Express 2015, 6, 211. [Google Scholar] [CrossRef] [PubMed] [Green Version]
  38. Piyawattanametha, W.; Ra, H.; Qiu, Z.; Friedland, S.; Liu, J.T.C.; Loewke, K.; Kino, G.S.; Solgaard, O.; Wang, T.D.; Mandella, M.J.; et al. In vivo near-infrared dual-axis confocal microendoscopy in the human lower gastrointestinal tract. J. Biomed. Opt. 2012, 17, 021102. [Google Scholar] [CrossRef] [PubMed]
  39. Liu, L.; Wang, L.; Sun, J.; Zhou, Y.; Zhong, X.; Luan, Z.; Liu, D.; Yan, A.; Xu, N. An Integrated Test-Bed for PAT Testing and Verification of Inter-Satellite Lasercom Terminals. Proc. SPIE 2007, 6709, 670904. [Google Scholar]
  40. Duma, V.-F.; Schitea, A. Laser scanners with rotational Risley prisms: Exact scan patterns. Proc. Rom. Acad. Ser. A 2018, 19, 53–60. [Google Scholar]
  41. Duma, V.-F.; Dimb, A.-L. Exact Scan Patterns of Rotational Risley Prisms Obtained with a Graphical Method: Multi-Parameter Analysis and Design. Appl. Sci. 2021, 11, 8451. [Google Scholar] [CrossRef]
  42. Erb, W. Rhodonea Curves as Sampling Trajectories for Spectral Interpolation on the Unit Disk. Constr. Approx. 2020, 53, 281–318. [Google Scholar] [CrossRef] [Green Version]
  43. Sun, J.; Liu, L.; Yun, M.; Wan, L.; Zhang, M. Distortion of beam shape by a rotating double prism wide-angle laser beam scanner. Opt. Eng. 2006, 45, 043004. [Google Scholar] [CrossRef]
  44. Lavigne, V.; Ricard, B. Fast Risley prisms camera steering system: Calibration and image distortions correction through the use of a three-dimensional refraction model. Opt. Eng. 2007, 46, 43201. [Google Scholar]
  45. Dimb, A.-L.; Duma, V.-F. Experimental validations of simulated exact scan patterns of rotational Risley prisms scanners. Proc. SPIE 2019, 11354, 113541U. [Google Scholar]
  46. Dimb, A.-L.; Duma, V.-F. Simulations and experiments of laser scanning with a pair of rotational Risley prisms. Proc. SPIE 2022, 12170, 1217009. [Google Scholar]
  47. Garcia-Torales, G. Risley prisms applications: An overview. Proc. SPIE 2022, 12170, 121700H. [Google Scholar]
  48. Available online: https://www.thorlabs.com/newgrouppage9.cfm?objectgroup_id=147 (accessed on 17 December 2022).
  49. Mnerie, C.; Preitl, S.; Duma, V.-F. Galvanometer-based scanners: Mathematical model and alternative control structures for improved dynamics and immunity to disturbances. Int. J. Struct. Stab. Dyn. 2017, 17, 1740006. [Google Scholar] [CrossRef]
  50. Chen, G.; Wang, Y. Control of a Digital Galvanometer Scanner Using a Discrete-Time Sliding-Mode Variable-Structure Controller Based on a Decoupled Disturbance Compensator. Appl. Sci. 2021, 11, 9788. [Google Scholar] [CrossRef]
  51. Hayakawa, T.; Watanabe, T.; Senoo, T.; Ishikawa, M. Gain-compensated sinusoidal scanning of a galvanometer mirror in proportional-integral-differential control using the pre-emphasis technique for motion-blur compensation. Appl. Opt. 2016, 55, 5640–5646. [Google Scholar] [CrossRef]
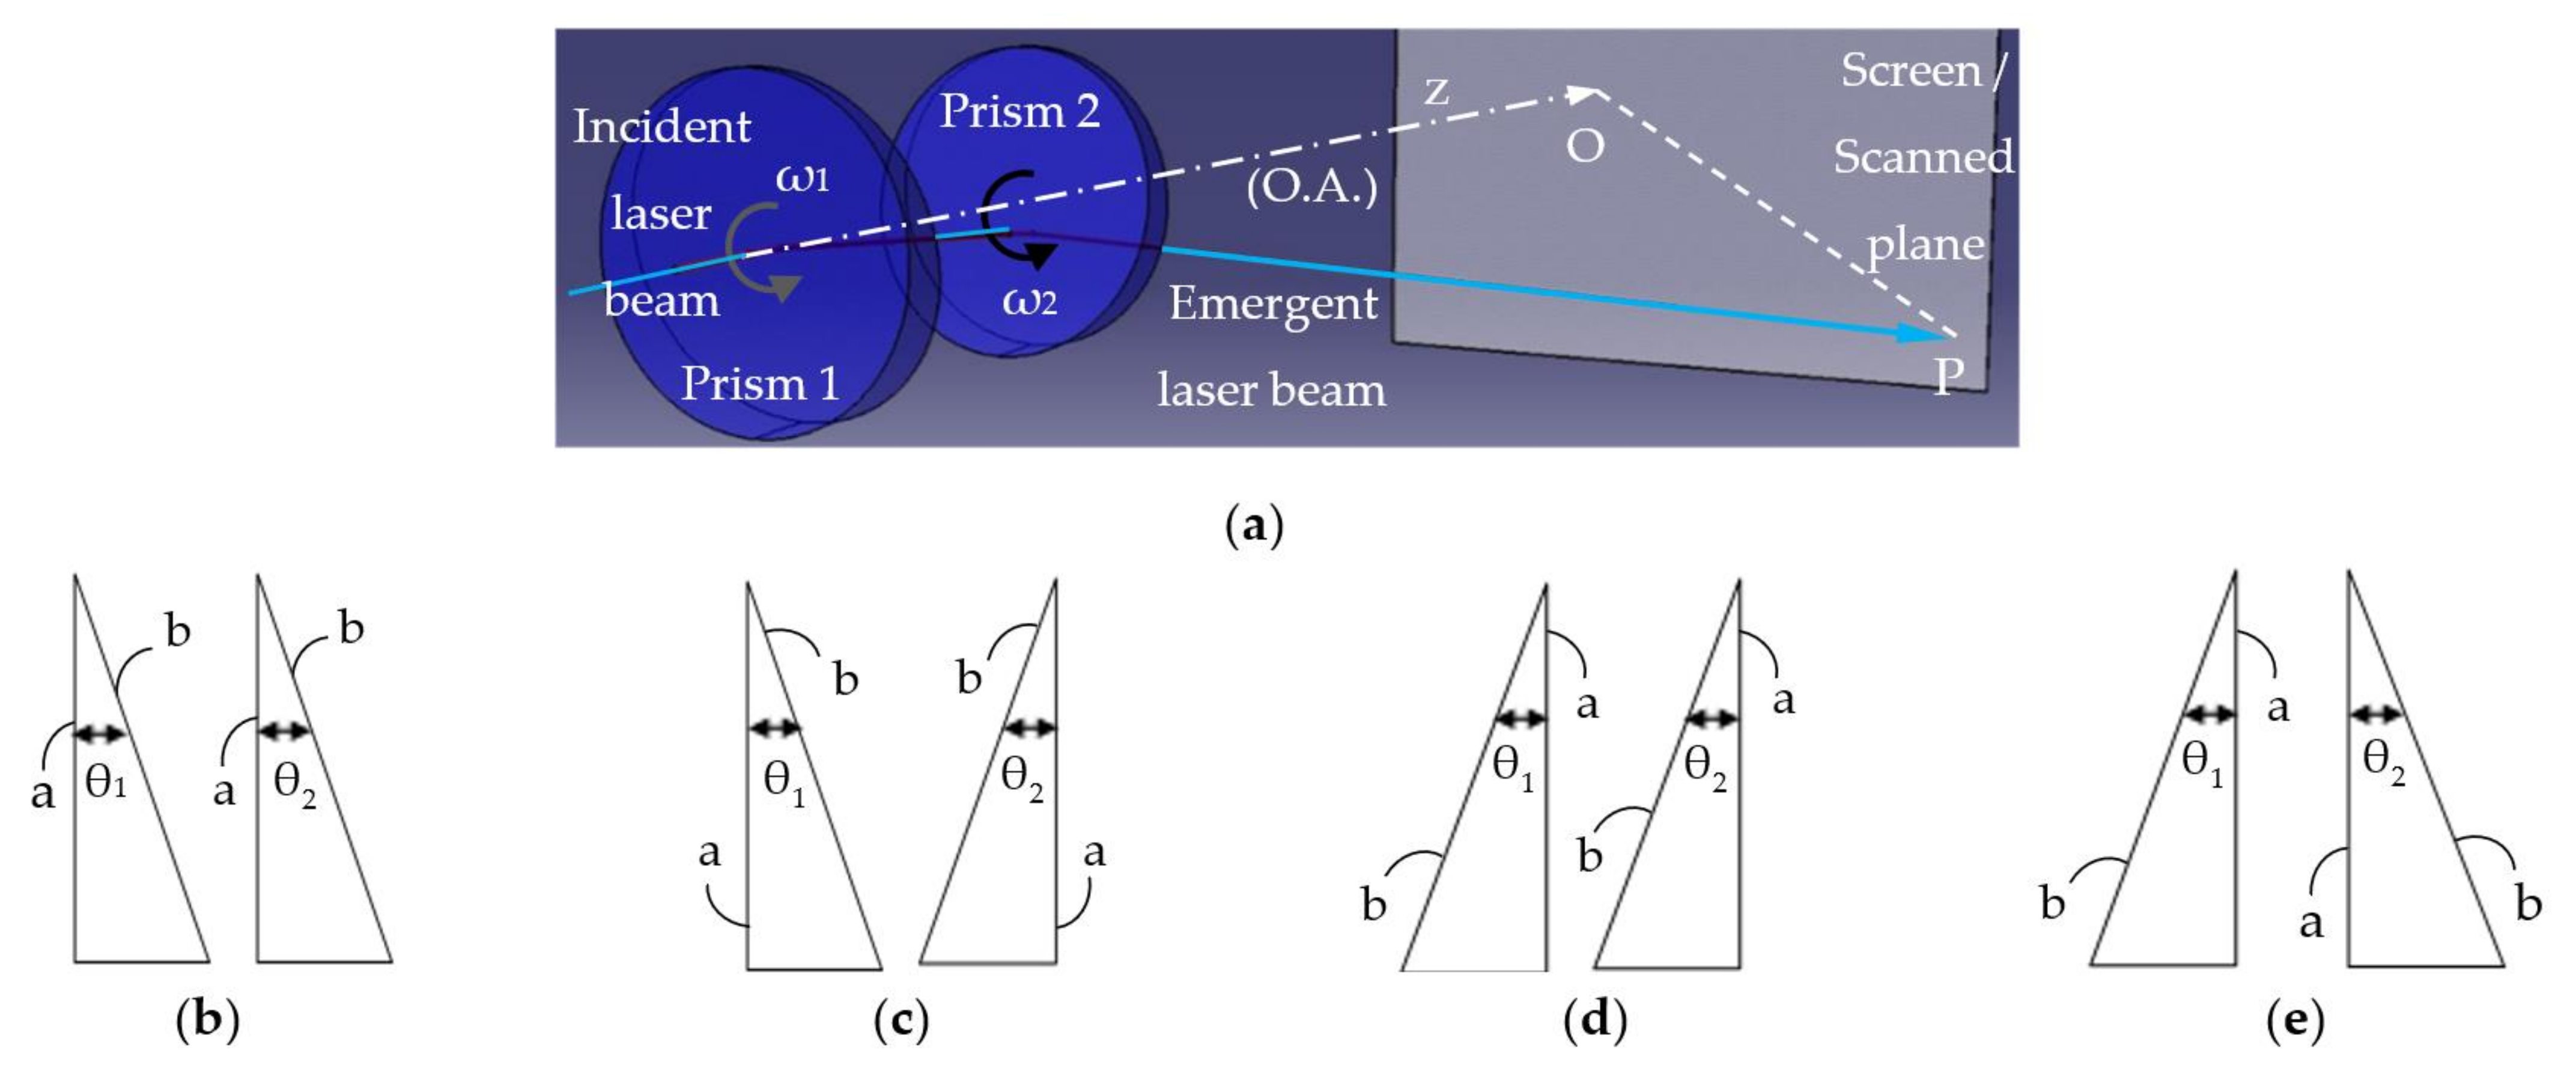
Figure 1. (a) Laser scanning with a pair of rotational Risley prisms—modelling with the graphical method developed in [40,41] using a commercially-available mechanical design program, CATIA V5R20. (be) The four possible configurations of this type of scanner, with the optical prisms oriented differently with the diopter “a” (perpendicular on the optical axis (O.A.)) and the diopter “b” (tilted with regard to the O.A.). In one of the common notations in the field, these four configurations are named: (b) ab-ab; (c) ab-ba; (d) ba-ba; (e) ba-ab.
Symmetry 15 00336 g001
Figure 2. Trajectory of the laser beam (reduced to its center axis) through the ba-ab configuration of a scanner with a pair of rotational Risley prisms for two (extreme) relative positions of the prisms, with a relative rotation angle of (a) 0 and of (b) π (rad) between them—for which one obtains the maximum and minimum deviations angles Dmax and Dmin, respectively.
Symmetry 15 00336 g002
Figure 3. Light bundles simulated with CATIA V5R20 for the laser scanner with Risley prisms in the ba-ab configuration, for: (a) M = 3 and (b) M = −3. A color convention is utilized throughout this study, as in [40,41]: blue corresponds to scan patterns obtained by prisms that rotate in the same direction (i.e., for M > 0), while red corresponds to scan patterns obtained by prisms that rotate in opposite directions (i.e., for M < 0).
Symmetry 15 00336 g003
Figure 4. Symmetry in the simulated scan pattern for M = 2.
Symmetry 15 00336 g004
Figure 5. Symmetries in the simulated scan patterns for M = −2, highlighting the structures of symmetry defined in Section 5, for relative rotational angles considered: (a) from 0 to 2π/3; (b) from −π/3 to π/3; (c) from 0 to π/3.
Symmetry 15 00336 g005
Figure 6. Symmetries in the simulated scan patterns for M = 3, highlighting the structures of symmetry defined in Section 5, for relative rotational angles considered: (a) from 0 to π; (b) from −π/2 to π/2; (c) from 0 to π/2.
Symmetry 15 00336 g006
Figure 7. Symmetries in the simulated scan patterns for M = −3, highlighting the structures of symmetry defined in Section 5, for relative rotational angles considered: (a) from 0 to π/2; (b) from −π/2 to π/2; (c) from 0 to π; (d) from −π/2 to π/2; (e) from 0 to π/4.
Symmetry 15 00336 g007
Figure 8. Symmetries in the simulated scan patterns for M = 4, highlighting the structures of symmetry defined in Section 5, for relative rotational angles considered: (a) from 0 to 2π/3; (b) from −π/3 to π/3; (c) from 0 to π; (d) from 0 to π/3.
Symmetry 15 00336 g008
Figure 9. Symmetries in the simulated scan patterns for M = −4, highlighting the structures of symmetry defined in Section 5, for relative rotational angles considered: (a) from 0 to 2π/5; (b) from −π/5 to π/5; (c) from 0 to π; (d) from 0 to π/5.
Symmetry 15 00336 g009
Figure 10. Symmetries in the simulated scan patterns for M = 5, highlighting the structures of symmetry defined in Section 5, for relative rotational angles considered: (a) from 0 to π/2; (b) from −π/4 to π/4; (c) from 0 to π; (d) from −π/2 to π/2; (e) from 0 to π/4.
Symmetry 15 00336 g010
Figure 11. Symmetries in the simulated scan patterns for M = −5, highlighting the structures of symmetry defined in Section 5, for relative rotational angles considered: (a) from 0 to π/3; (b) from −π/6 to π/6; (c) from 0 to π; (d) from −π/2 to π/2; (e) from −π/6 to 0.
Symmetry 15 00336 g011
Figure 12. Simulated scan patterns for (a) M = 1.6 and (b) M = 1.8, with (1) the entire scan pattern and (2) one of the spiral-like symmetry structures extracted from the pattern.
Symmetry 15 00336 g012
Figure 13. Symmetries in the simulated scan patterns for (a) M = ∞ (i.e., for ω1 = 0) and for (b) M = 0 (i.e., for ω2 = 0). The successively increasing scan patterns in each figure correspond to successively increasing values of the (equal) prism angular deviations D1 = D2 = 2° (purple patterns); 4° (orange patterns); 6° (green patterns); 10° (blue patterns).
Symmetry 15 00336 g013
Figure 14. Symmetries in the simulated scan patterns for (1) M = 6 and (2) M = −6, for two values of the parameter k = θ2/θ1 = D2/D1: (a) k = 5 (for D2 = 10° and D1 = 2°) and (b) k = 1/5 (for D2 = 2° and D1 = 10°).
Symmetry 15 00336 g014
Figure 15. Symmetries in the simulated scan patterns for (1) M > 0 and (2) M < 0, for two absolute values of this parameter: (a) |M| = 3 and (b) |M| = 6. The successively increasing scan patterns in each figure correspond to successively increasing values of the (equal) prism deviation angles D1 = D2 = 2° (blue pattern); 4° (orange pattern); 6° (gray pattern); 10° (yellow pattern).
Symmetry 15 00336 g015
Figure 16. Symmetries in the simulated scan patterns for (a) M = 6 and (b) M = −6, for three successively increasing values of the (equal) refractive index of the two prisms: n = 1.517, n′ = 1.7, and n″ = 1.9. The corresponding scan patterns are successively increasing: blue for n, orange for n′, and green for n″.
Symmetry 15 00336 g016
Figure 17. Extracting from (a) the simulated scan pattern for M = 5 (b) the polar coordinates r(φ) and the rectangular coordinates (c1) x(φ) and (c2) y(φ) of the current point P of the scan pattern (as shown in the example in Figure 4).
Symmetry 15 00336 g017
Figure 18. Extracting from (a) the simulated scan pattern for M = −5 (b) the polar coordinates r(φ) and the rectangular coordinates (c1) x(φ) and (c2) y(φ) of the current point P of the scan pattern.
Symmetry 15 00336 g018
Figure 19. Dimensional characteristics of the simulated scan patterns generated by a pair of rotational Risley prisms, obtained for (a) M = 5 and (b) M = −5, pointed out in Table 2.
Symmetry 15 00336 g019
Figure 20. Scan patterns of a pair of rotational Risley prisms—experimental study: (a) setup built with Thorlabs components—utilized in [40,41], as well. Superposed (but slightly rotated regarding each other), simulated (in blue for (1) M > 0 and in red for (2) M < 0)) versus experimental scan patterns (in black), determined for (b) |M| = 2 and (c) |M| = 6.
Symmetry 15 00336 g020
Table 1. Study of the symmetries of the scan patterns regarding the ratio M.
|M|Ratio MFigureNumber of Loops 
μ = M 1
Number of Axes of Symmetry * AStructures of SymmetryRemarks
Number S[φmin, φmax]
0013b11--The scan pattern is a circle eccentric to O
11-0-The scan pattern is a circle centered in O
−1-221[0, π]
[−π/2, π/2]
Elliptic scan pattern, with the main axes (of symmetry) on Ox and Oy
224111[0, π]Symmetry axis: Ox
−25332[0, 2π/3]
[−π/3, π/3]
Symmetry axis on the axis of each loop
336222[0, π]
[−π/2, π/2]
Symmetry axes: Ox and Oy
−37444[0, π/2]
[−π/4, π/4]
[0, π]
[−π/2, π/2]
Symmetry axes: Ox, Oy (which are in this case the symmetry axes of the loops), as well as the first and second bisector
448333[0, 2π/3]
[−π/3, π/3]
[0, π]
Symmetry axes: the symmetry axes of the loops, from which one is Ox
−49553[0, 2π/5]
[−π/5, π/5]
[0, π]
[−π/2, π/2]
From the angular intervals of the structures of symmetry defined in this Section 5.1, for each case corresponding to M 3 , 4 or |M| > 5 (therefore for several loops/axes of symmetry μ 4 ), there are four possible methods of constructing the full scan pattern without considering all its points:
- by rotating the structure of symmetry with angles of 2π/μ for μ times (for the first two structures, of angular intervals [0, 2π/μ] or [−π/μ, π/μ]).
- by using a symmetry with regard to Ox or with regard to Oy, for the third and fourth structure, respectively (defined by the angular intervals [0, π] and
[−π/2, π/2], respectively, because of the way the structures of symmetry were defined, with the first point on one of the axes Ox or Oy, just like the patterns).
5510444[0, π/2]
[−π/4, π/4]
[0, π]
[−π/2, π/2]
−511664[0, π/2]
[−π/4, π/4]
[0, π]
[−π/2, π/2]
6615(b1) 16(a)554[0, 2π/5]
[−π/5, π/5]
[0, π]
[−π/2, π/2]
−615(b2) 16(b)774[0, 2π/7]
[−π/7, π/7]
[0, π]
[−π/2, π/2]
13a11--The scan pattern is a circle eccentric to O
* Because the initial point P0 of each generated pattern is always placed on the Ox axis (as explained in Section 4.1), Ox is always one of the axes of symmetry—for |M| > 1.
Table 2. Parameters that define symmetries of the scan patterns—obtained with the graphical method from the example in Figure 19, for |M| = 5.
Parameters of the Patterns Obtained Graphically from Figure 19 Value of the Ratio M = ω21
Figure 19a: M = 5Figure 19b: M = −5
Linear/Radial (mm)Angular * (°)Linear/Radial (mm)Angular * (°)
Polar coordinates of the points that define the FOV/circle circumscribed to the scan pattern (R)71.2650/90/180/27071.2650/60/120/180/240/300
Polar coordinates of the points that define the first (i.e., outer) intersection of the lobes (r1)61.45545/135/225/31548.45930/90/150/210/270/330
Maximum width of the lobes (w)37.1213.591/86.409
93.591/176.409
183.591/266.409
273.591/356.409
49.16529.505/30.495
89.505/90.495
149.505/150.495
209.505/210.495
269.505/270.495
229.505/230.495
Polar coordinates of the points that define the second (i.e., middle) intersection (r2)34.4420/90/180/2702.20530/90/150/210/270/330
Polar coordinates of the points that define the third (i.e., inner) intersection (r3)1.5500/90/180/270--
Polar coordinates of the circle inscribed in the scan pattern (Δ)1.0690/90/180/2701.06930/90/150/210/270/330
* Angular coordinates of the point of intersection of the scan pattern with the defined circle.
Table 3. Simulated (R) versus experimental ( R e radius of the FOV of the scan patterns—as determined in the investigation presented in Figure 20.
Ratio of the Rotational Velocities, Equation (2)M = 2M = −2M = 6M = −6
Mean value of the FOV radius:
R e ¯ = 1 μ j = 1 μ R e
70.84672.69272.12572.544
Standard deviation of the FOV radius:
σ = 1 μ j = 1 μ R e ¯ R e 2
0.0010.3870.5360.858
Relative error: ε % = R e ¯ R e · 100 / R −0.5882.0031.2061.794
Disclaimer/Publisher’s Note: The statements, opinions and data contained in all publications are solely those of the individual author(s) and contributor(s) and not of MDPI and/or the editor(s). MDPI and/or the editor(s) disclaim responsibility for any injury to people or property resulting from any ideas, methods, instructions or products referred to in the content.