Article

Relating Fluctuating Asymmetries and Mean Values and Discordances of Asymmetries in a Set of Morphological Traits

by
Dmitry L. Lajus
Independent Scholar, Saint Petersburg 199034, Russia
Current address: 155 Claremont Ave., New York, NY 10027, USA.
Symmetry 2023, 15(2), 476; https://doi.org/10.3390/sym15020476
Submission received: 30 December 2022 / Revised: 22 January 2023 / Accepted: 6 February 2023 / Published: 10 February 2023
(This article belongs to the Special Issue Fluctuating Asymmetry in Evolutionary Biology)

Abstract

:
This study addresses the problem of concordance in fluctuating asymmetry (FA) across traits by analyzing the relationship between FAs and the mean values of character measurements in a set of morphological traits. Regression slopes vary in natural populations, thus, revealing discordance in FA across traits among these populations. Hence, commonly accepted techniques for measuring developmental instability with FA result in uncertainties. Here, I relate FA to mean as a two-dimensional complex to demonstrate the uniformly negative slopes of standardized FA vs. mean value regressions for sets of morphological traits from eighteen distinct natural marine and aquatic populations. Comprehensive analysis of the FA–mean complex cannot be recommended for wide use in assessing stress and fitness, but it offers promise to improve FA measuring methodologies and to better understand the nature of developmental instability.

Graphical Abstract

1. Introduction

Fluctuating asymmetry (FA) represents the random deviations from perfect symmetry caused by developmental instability (DI). In the late 1980s to early 1990s, FA was widely proposed as a simple, sensitive and reliable indicator of population stress induced by different agents [1,2,3,4]. Soon, a rapid growth in the number of publications on the topic signified avid interest in the approach. However, after the beginning of the new millennium, the growth of publication activity stopped [5] due to very high heterogeneity resulting from FA studies. Probably, our expectations of the approach were too high, and our understanding of what we call stress was insufficient (see [6,7] for a review).
In any case, further development of the field requires a better understanding of the observed heterogeneity in FA results and an improved analytical methodology. Accordingly, serious efforts have been undertaken to increase the statistical power of FA analyses, to develop approaches that go beyond bilateral symmetry, and to use meta-analyses to increase its effectiveness (see [8,9,10,11,12] 1 for reviews).
One problem that has attracted limited attention from researchers is the concordance across traits of the FAs of samples (populations). This is an important precondition for the usual assumption that considers developmental instability as a genome-wide effect [13,14,15], but see [16,17] for a contrary opinion). If developmental instability is expressed merely as the isolated property of individual traits, genome-wide developmental instability cannot be associated with other population parameters related to stress or fitness.
Soulé [18] found a positive relationship between the FAs of different traits in side-blotched lizards Utastans buriana from different populations. Thus, he concluded that FA measures something common to all traits, i.e., developmental instability, which reveals a ‘population asymmetry parameter’. Concordance of FAs across traits was reported also for other animals [2,19,20]. This allows one to assess the developmental instability of populations with as few as a single trait, or with a composite index of FA (CFA) where different traits are treated as replicates of one trait [1,13,21,22,23,24,25,26]. In some cases, such an approach is based on geometric morphometry [27,28,29]. Therefore, the dual problem of concordance of FAs across traits and associating FA with fitness components or stress are closely related.
Empirical results on FA concordance across traits are variable. Møller and Swaddle [30] reported that a significant population asymmetry parameter was found in 12 of 17 papers. Clarke [14] found it in 4 out of his 11 data sets. Quantitative estimates of concordance, as measured by Kendall’s coefficient of concordance, are usually not very high, although often statistically significant [5,31,32,33,34,35,36]. Some authors report that different characters may respond differently to stress [37,38].
There are several potential causes for the departure of FAs from perfect concordance: (i) structures developing at different times are exposed to different environmental conditions; (ii) structures belong to different developmental units; (iii) structures have different buffering mechanisms that control their development. Sampling error also contributes to departure from concordance [22,39,40]. Given that too little is known about the origins of developmental instability [41], other reasons are also likely.
This study analyzes the relationship between FAs and mean values in a set of morphological traits to address the problem of FA concordance across traits. I consider several published data sets on different fish and crustacean species that use different type of morphological traits in order to better identify common patterns and relationships between FA and mean trait value.

2. Relationships between FAs and Trait Means in a Set of Multiple Traits

It is commonly expected that growth normally generates multiplicative errors, which arise when a structure adds tissue to that which is already present [42]. In such cases, variances increase proportionally with the square of the means, and standardized variances, measured by coefficients of variation (CVs), should be unrelated to the means. Contrary to these expectations, empirical data show that CVs decrease in traits with larger means. This phenomenon was first reported by Pearson and Davin [43] and consequently analyzed by other authors [44,45,46,47,48].
Pearson and Davin [43] found that the coefficient of variation of the whole structure is lower than that of its constituent parts. They hypothesized that this is due to compensation of the random variation of neighboring parts in the whole structure. The larger and more complex a structure is, the more parts it includes. Thus, the effect of compensation increases with the number of parts, i.e., the standardized random variation decreases in larger structures. While stochastic variation contributes to total variance, total variance also decreases as structure size increases. This hypothesis implies a growth of the coefficient of variation proportional with the square root of the means. Lande [49] independently suggested this relationship. Later Soulé [50] generalized Lande’s findings to apply to all functionally and embryonically related morphological traits differing in size (i.e., not only related as a part and a whole), calling it the allomeric effect.
If the Pearson–Davin–Lande–Soulé hypothesis is correct, one may predict (i) a lack of association between standardized non-stochastic variances and trait means because of the absence of the compensation effect typical only for stochastic variation, and (ii) an inverse relationship between standardized total variances and the square root of means. Here, I test this hypothesis by analyzing FA in bilateral traits. This allows partitioning the total variance into within- and among-individual variances [23,51].
Calculation of the components of total phenotypic variance was performed following Lajus [52], Lajus and Alekseev [53], and Lajus and co-authors [54,55]. For calculating means, we used the predicted means of the character for standard body in different samples because the average size of individuals may differ among samples. As standard body size, it was used as the first Principal Component when morphometric traits were analyzed, or as body length when meristic traits were analyzed. Distribution of the standardized means was tested for skewness and kurtosis to determine normality.
Calculating the stochastic component of total phenotypic variance (i.e., FA) begins with tests for type of asymmetry using the skewness and kurtosis of the trait distribution. Three types of asymmetry occur [56]: (i) FA when traits have a R(ight)–L(eft) mean equal to zero and variation normally distributed about that mean; (ii) directional asymmetry when a structure on one side of the body is systematically larger than on the other; (iii) antisymmetry when the R–L distribution about the mean is zero, but the frequency distribution is platykurtic or bimodal [23]. Only traits manifesting FA were used in further analyses.
The stochastic component σ2s or variance of FA [23,51] was measured after size standardization to account for the heterogeneity of individuals in the samples and the correlation of trait values with size. For size standardization, we divided an individual’s left and right observed values by the predicted value obtained for the trait—body size regression:
σ2s = ⅀(R − L)2/2n,
σ2 = ⅀(Xi − M)2/2(n − 1),
where Xi is the left and the right values of character, M the mean value, R the right and L the left value of the character, and n the number of individuals in the sample.
Measurement error was assessed via repeated measurements of subsamples from different populations. It was estimated using the same formula as for the stochastic component (see above), but using X1 instead of L and X2 instead of R, where X1 and X2 are values from two consecutive replicate measurements. In all further calculations we used the magnitude of FA after subtracting the measurement error, i.e., true fluctuating asymmetry.
The stochastic, or random component of the total variance represents within-individual variance. Among-individual variance, the non-stochastic or factorial component, results from genetic and environmental heterogeneity [31,57]. Association between these components and trait means has been analyzed in four studies used multiple traits with a large range of mean values. In Acanthocyclops signifier Mazepova (Copepoda, Crustacea), we studied setae length and body proportions (19 traits) in three populations from different locations in Lake Baikal [53]. In herring Clupea pallasii Valenciennes (Clupeidae, Teleostei) occurring in the White Sea, I analyzed 21 traits involving the number of fat-filled lacunae in different cranial bones, and 21 traits involving cranial bone morphometry from two sympatric, genetically closed populations with different life cycles [54]. In eelpout, Zoarces viviparus L. (Zoarcidae, Teleostei), we studied the number of fat-filled lacunae in cranial bones (17 traits) from five geographically distinct populations in Northern Europe [54]. In Saduria entomon L. (Isopoda, Crustacea), we studied 15 traits describing the number of chaetae from four samples collected in the Baltic, White and Barents Seas [55]. In total, 18 sets of multiple traits were analyzed. In each study, FA analysis was based on the residual of the regression of each trait with body length. FAs are presented after accounting for measurement error, i.e., true FAs (Table 1).
Analysis of all datasets yielded similar results. The best linear fit between the trait means and variance components was achieved by taking logs of both means and variances, compared to non-transformed values and square root transformed means. Standardized FAs decreased with the means in all samples. A clear decrease of variance with means was also observed for the factorial component, although the correlation was generally weaker. Analysis of factorial component variation patterns, however, is out of scope of this study.
These results only partly agree with the results and theoretical predictions of Pearson and Davin [43], Lande [49] and Soulé [50]. Two patterns agree with their predictions. The negative correlation of FAs (stochastic variances) with means is in accordance with Soulé’s [50] hypothesis. Additionally, the contribution of stochastic variance to total variance was higher in small traits than in large ones. This is because stochastic variation reduces with size more than factorial variation (Table 1).
However, two patterns also disagree with the earlier authors. The factorial components should not be associated with the means, but, here, they demonstrate a negative correlation. Additionally, a log-transformation of both means and variances achieves better linearity between them than the predicted square-root transformation of the means (Table 1).
Therefore, the early hypotheses do not entirely explain my results from existing data. In my view, the negative relationship between the standardized stochastic variance and the means results from nonlinear feedback mechanisms that tend to equalize the variation of structures independently of their size (or number of elements in the case of meristic characters). Hence, they produce additive errors. Additive errors are typically exhibited by inert tissues [58,59] and originate from developmental noise, the “cumulative effects of small, random developmental perturbations or accidents’’ [60]. Such feedback mechanisms, however, do not operate perfectly and, thus, do not equalize the variances completely. Superimposition of two processes—the first linear, which generates multiplicative errors; and the second nonlinear, which generates additive errors—likely leads to the observed intermediate pattern. The superimposition of multiplicative and additive errors in determining FA was suggested by Graham and co-authors [42] when considering the FA patterns of a single trait. According to the authors, multiplicative error is caused by the linear responses of a developing structure to environmental perturbations, whereas additive error results from the non-linear feedback typical for deterministic processes [42].
However, the observed negative relationship between FAs and means may be caused, at least in part, by the presence of measurement error, which is known to generate additive errors [42]. Because the earlier authors did not account for measurement error, it is impossible to verify the Pearson–Davin–Lande–Soulé effect using their papers. However, measurement error was assessed in the papers used in this study and partitioned out from the observed FA. The fact that the Pearson–Davin–Lande–Soulé effect was still observed means that it is not an artefact caused by measurement error.
Many authors stress the important role of nonlinear feedback mechanisms in the origin of FA [42,61,62,63,64]. These mechanisms are rooted in microscopic processes on cellular and molecular levels, and details are generally poorly understood (see reviews [6,65]. Nevertheless, the decrease in standardized FA with an increase in means reveals the importance of controlling these processes during morphogenesis.

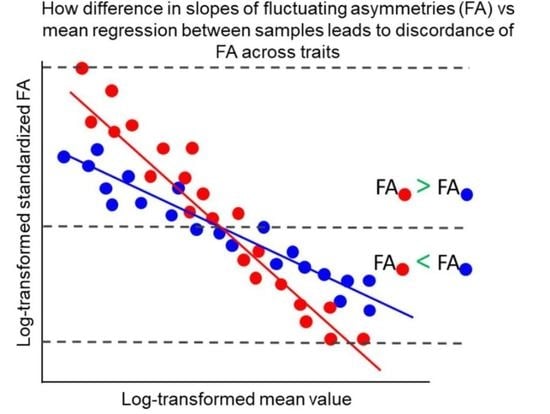
3. Differences in the Regression of Slope of FAs—Means in Natural Populations

The empirical relationship between FAs and means is optimally described by a linear regression of their log-transformed values. I assume that this regression line is determined by its slope (decreasing with an increase in the contribution of additive error in FA) and intercept (reflecting the overall level of FA, which is affected by both additive and multiplicative errors). Different intercepts and highly similar slopes signal a concordance of FAs across traits. Differences in slopes between samples A and B reflect a departure from FA concordance. When the FAs of some traits are higher in sample A, and FAs are higher in sample B in traits with different means, FA approaches discordance.
These theoretical possibilities are realized in natural populations. Populations of A. signifer from Bolshie Koty and Peschannaia Bay [53] are characterized by similar slopes and exhibit concordance across traits. Yet, different intercepts mean different magnitudes of FA (Figure 1). Statistical comparison [66] shows that the Ushkanii Island population has a higher slope compared with populations in Bolshie Koty (p < 0.01) and Peschannaia Bay (p < 0.05), which reveals discordance in FA across traits. The Uskhanii Islands population had higher FAs than the other two in traits with comparatively small means, but lower FAs in traits with larger means.
Two populations of White Sea herring C. pallasii also demonstrate significant differences (p < 0.05) in the slopes of standardized FA–mean regressions of meristic traits [52]. Here, there are more pronounced differences between populations in traits with larger means than in traits with small means [52]. The higher FA–mean regression slope may reflect the strength of buffering in FA, and thus may be associated with fitness. Data on the life history of these herring populations seems to confirm this hypothesis. The summer-spawning population, characterized by a greater FA–mean regression slope than the spring-spawning population, also manifested greater growth rates, higher tolerance of low salinity, and higher genetic variation—characteristics that are usually related to greater fitness [52,67].
In two other species, eelpout Z. viviparus and isopod S. entomon, we found no meaningful differences in their FA–mean regression slopes, but differences were evident in their FA magnitude [54,55].

4. Discordance of FAs across Traits and Measuring Developmental Instability

This study demonstrates a close connection between the FAs and means of traits. This connection does not affect the results of population comparisons if the slopes of FA–mean regression lines are the same. Empirical data demonstrate, however, that this is not always the case. In measuring the FA of multiple traits using various composite indices, one deals not with the one-dimensional variable (FA), but with the two-dimensional complex formed by FA and mean values [68]. In consequence, measuring FA can lead to some uncertainty in population comparisons that depend on choice of traits.
This uncertainty is difficult to avoid because the comprehensive analysis of FA–mean regressions is a difficult task. Ideally, it should involve many traits with a large range of means, and repeated FA measurements in order to separate measurement error from observed FA, and obtain an accurate value. These complications make comprehensive FA analysis very labor-intensive and, hence, impractical for wide application in measuring population stress and fitness.
However, in the methodically oriented research of developmental instability, it is important to account for this phenomenon, because it may be a substantial source of departure from concordance in FA across traits. The present study clearly demonstrates the possibility of discordance but, due to the few cases analyzed, does not elaborate on its occurrence in nature. Still, these findings may be useful for theoretical developments in the field of developmental instability. I hypothesized that additive and multiplicative errors, which Graham and co-authors [42] used to explain patterns of single trait variation, can be also used to interpret relationships between FAs and means for a set of traits. In this case, analyzing the regression slopes and intercepts of FAs on means can reveal insights on developmental instability patterns and nature.

5. Conclusions

Many authors have reported that some traits serve as better indicators of developmental instability than others, i.e., FA in some traits shows differences between populations in response to environmental and genetic factors, whereas FA in other traits does not. In addition to sampling error and measurement error, these authors suggest several biological reasons for such discordance (see Introduction).
After analysis of the regression patterns of standardized FAs on mean values, this study adds one more reason to this list. The fact that populations can differ in FA vs. mean slope leads to an understanding that FA should no longer be considered as a one-dimensional variable, but should be represented with mean values as a two-dimensional variable. Most practical applications of FA project this variable in one-dimensional space, which generates uncertainties by implicitly ignoring possible differences in the value of FA–mean regression slopes, i.e., this variable’s two-dimensional nature.
Mechanisms explaining differences in slopes are suggested based on the nonlinear dynamic theory of developmental instability—in particular, on the superimposition of additive and multiplicative errors in generating FA. Regardless of specific mechanisms, this effect characterizes developmental processes. Thus, as the magnitude of the slope varies among populations, it can contribute to the loss of concordance in FAs across traits. Studying the slopes of FA–mean regressions presents a promising tool for improving FA as a measure of stress and fitness and for achieving a better understanding of the nature of stochastic phenotypic variation and developmental instability.

Funding

This research received no external funding.

Data Availability Statement

Not applicable.

Acknowledgments

I thank John Graham for his kind and invaluable help and discussions during the preparation of the work. Alexander Kozhara and anonymous referees provided valuable comments on the earlier versions of the manuscript. Karen Alexander helped improve my English.

Conflicts of Interest

The authors declare no conflict of interest.

References

  1. Palmer, A.R.; Strobeck, C. Fluctuating asymmetry: Measurement, analysis, patterns. Ann. Rev. Ecol. Syst. 1986, 17, 391–421. [Google Scholar] [CrossRef]
  2. Zakharov, V.M. Future prospects for population phenogenetics. Sov. Sci. Rev. Sect. F Physiol. Gen. Bio. Rev. 1989, 4, 1–79. [Google Scholar]
  3. Parsons, P.A. Fluctuating asymmetry: An epigenetic measure of stress. Biol. Rev. 1990, 65, 131–145. [Google Scholar] [CrossRef] [PubMed]
  4. Graham, J.H.; Emlen, J.M.; Freeman, D.C. Developmental stability and its applications in ecotoxicology. Ecotoxicology 1993, 2, 175–184. [Google Scholar] [CrossRef] [PubMed]
  5. Lajus, D.L.; Golovin, P.V.; Yurtseva, A.O.; Ivanova, T.S.; Dorgham, A.S.; Ivanov, M.V. Fluctuating asymmetry as an indicator of stress and fitness in stickleback: Analysis of publications and testing cranial structures. Evol. Ecol. Res. 2019, 20, 83–106. Available online: http://evolutionary-ecology.com/abstracts/v20/3165.html (accessed on 12 December 2022).
  6. Polak, M. (Ed.) Developmental Instability: Causes and Consequences; Oxford University Press: New York, NY, USA; Oxford, UK, 2003. [Google Scholar]
  7. Lajus, D. God playing dice, revisited: Determinism and indeterminism in studies of stochastic phenotypic variation. Emerg. Top. Life Sci. 2022, 6, 303–310. [Google Scholar] [CrossRef]
  8. Van Dongen, S.V. Fluctuating asymmetry and developmental instability in evolutionary biology: Past, present and future. J. Evol. Biol. 2006, 19, 1727–1743. [Google Scholar] [CrossRef]
  9. Graham, J.H.; Raz, S.; Hel-Or, H.; Nevo, E. Fluctuating asymmetry: Methods, theory, and applications. Symmetry 2010, 2, 466–540. [Google Scholar] [CrossRef]
  10. Allenbach, D.M. Fluctuating asymmetry and exogenous stress in fishes: A review. Rev. Fish Biol. Fish. 2011, 21, 355–376. [Google Scholar] [CrossRef]
  11. Graham, J.H. Fluctuating asymmetry and developmental instability, a guide to best practice. Symmetry 2021, 13, 9. [Google Scholar] [CrossRef]
  12. Graham, J.H. Nature, nurture, and noise: Developmental instability, fluctuating asymmetry, and the causes of phenotypic variation. Symmetry 2021, 13, 1204. [Google Scholar] [CrossRef]
  13. Dufour, K.M.; Weatherhed, P.J. Estimation of organism-wide asymmetry in red-winged blackbirds and its relation to studies of mail selection. Proc. R. Soc. Lond. Ser. B Biol. Sci. 1996, 263, 769–775. [Google Scholar]
  14. Clarke, G.M. The genetic basis of developmental stability: IV. Individual and population asymmetry parameters. Heredity 1998, 80, 553–561. [Google Scholar] [CrossRef]
  15. Zakharov, V.M. Linking developmental stability and environmental stress: A whole organism approach. In Developmental Instability: Causes and Consequences; Polak, M., Ed.; Oxford University Press: New York, NY, USA; Oxford, UK, 2003; pp. 402–414. [Google Scholar]
  16. Leung, B.; Forbes, M.R. Fluctuating asymmetry in relation to stress and fitness: Effects of trait type as revealed by meta-analysis. Ecoscience 1996, 3, 400–413. [Google Scholar] [CrossRef]
  17. Bjorksten, T.A.; Fowler, K.; Pomiankowski, A. What does sexual trait FA tell us about stress? Tr. Ecol. Evol. 2000, 15, 163–166. [Google Scholar] [CrossRef]
  18. Soulé, M.E. Phenetics of natural populations. II: Asymmetry and evolution in a lizard. Amer. Nat. 1967, 101, 141–160. [Google Scholar] [CrossRef]
  19. Soulé, M.E.; Baker, B. Phenetics of natural populations. IV. The population asymmetry parameter in the butterfly. Coenonym phatullia. Heredity 1968, 23, 611–614. [Google Scholar] [CrossRef]
  20. Jagoe, C.H.; Haines, T.A. Fluctuating asymmetry in fishes inhabiting acidified and unacidified lakes. Can. J. Zool. 1985, 63, 130–138. [Google Scholar] [CrossRef]
  21. Zhivotovsky, L.A. A measure of fluctuating asymmetry for a set of characters. Acta Zool. Fenn. 1992, 191, 73–77. [Google Scholar]
  22. Whitlock, M. Lack of correlation between heterozigosity and fitness in forked fungus beetles. Heredity 1993, 70, 571–584. [Google Scholar] [CrossRef]
  23. Palmer, A.R. Fluctuating asymmetry analyses: A primer. In Developmental Stability: Its Origin and Evolutionary Implications; Markow, T.A., Ed.; Kluwer Academic Press: Dortrecht, The Netherlands, 1994; pp. 335–364. [Google Scholar]
  24. Bennett, D.M.; Hoffmann, A.A. Effects of size and fluctuating asymmetry on field fitness of the parasitoid Trichogramm carverae (Hymenoptera: Trichogrammatidae). J. Anim. Ecol. 1998, 64, 580–591. [Google Scholar] [CrossRef]
  25. Leung, B.; Forbes, M.R.; Houle, D. Fluctuating asymmetry as a bioindicator of stress: Comparing efficacy of analyses involving multiple traits. Amer. Nat. 2000, 155, 101–115. [Google Scholar] [CrossRef] [PubMed]
  26. Palmer, A.R.; Strobeck, C. Fluctuating asymmetry analyses revisited. In Developmental Instability: Causes and Consequences; Polak, M., Ed.; Oxford University Press: New York, NY, USA; Oxford, UK, 2003; pp. 279–319. [Google Scholar]
  27. Auffray, J.-C.; Alibert, P.; Renaud, S.; Orth, A.; Bonhomme, F. Fluctuating asymmetry in Mus musculus subspecific hybridization. In Traditional and Procrustes Comparative Approach. In Advances in Morphometrics; Marcus, L.F., Corti, M., Loy, A., Naylor, G.J.P., Slice, D.E., Eds.; Plenum Press: New York, NY, USA, 1996; pp. 275–283. [Google Scholar]
  28. Klingenberg, C.P. Analyzing fluctuating asymmetry with geometric morphometrics: Concepts, methods, and applications. Symmetry 2015, 7, 843–934. [Google Scholar] [CrossRef]
  29. Klingenberg, C.P. Shape asymmetry—what’s new? Emerg. Top. Life. Sci. 2022, 6, 285–294. [Google Scholar] [CrossRef]
  30. Møller, A.P.; Swaddle, J.P. Asymmetry, Developmental Stability and Evolution; Oxford University Press: Oxford, UK, 1997. [Google Scholar]
  31. Kozhara, A.V. Phenotypic variance of bilateral characters as an indicator of genetic and environmental conditions in bream Abramis brama (L.) (Pisces, Cyprinidae) population. J. Appl. Ichth. 1994, 10, 167–181. [Google Scholar] [CrossRef]
  32. Leamy, L. Morphometric studies in inbred and hybrid house mice. VII. Heterosis in fluctuating asymmetry at different ages. Acta Zool. Fenn. 1992, 191, 111–119. [Google Scholar]
  33. Leary, R.F.; Allendorf, F.W.; Knudsen, K.L. Genetic, environmental, and developmental causes of meristic variation in rainbow trout. Acta Zool. Fenn. 1992, 191, 79–95. [Google Scholar]
  34. Auffray, J.-C.; Debat, V.; Alibert, P. Shape asymmetry and developmental stability. In On Growth and Form: Spatio-Temporal Pattern Formation in Biology; Chaplain, M.A.J., Singh, G.D., McLachlan, J.C., Eds.; John Wiley and Sons Ltd.: Chichester, UK, 1999; pp. 309–324. [Google Scholar]
  35. Lajus, D.; Yurtseva, A.; Birch, G.; Booth, D. Fluctuating asymmetry as a pollution monitor: The Australian estuarine smooth toadfish Tetractenos glaber (Teleostei: Tetraodontidae). Mar. Poll. Bull. 2015, 101, 758–767. [Google Scholar] [CrossRef]
  36. Lajus, D.; Katolikova, M.; Strelkov, P.; Hummel, H. Fluctuating and directional asymmetry of the blue mussel (Mytilus edulis): Improving methods of morphological analysis to explore species performance at the northern border of its range. Symmetry 2015, 7, 488–514. [Google Scholar] [CrossRef]
  37. Hoffmann, A.A.; Woods, R.E. Associating stress with developmental stability: Problems and patterns. In Developmental Instability: Causes and Consequences; Polak, M., Ed.; Oxford University Press: New York, NY, USA; Oxford, UK, 2003; pp. 387–401. [Google Scholar]
  38. Freeman, D.C.; Brown, M.L.; Duda, J.J.; Graham, J.H.; Emlen, J.M.; Krzysik, A.J.; Balbach, H.; Kovacic, D.A.; Zak, J.C. Leaf fluctuating asymmetry, soil disturbance and plant stress: A multiple year comparison using two herbs, Ipomoea pandurate and Cnidoscolus stimulosus. Ecol. Indic. 2005, 5, 85–95. [Google Scholar] [CrossRef]
  39. Leung, B.; Forbes, M.R. Modelling fluctuating asymmetry in relation to stress and fitness. Oikos 1997, 78, 397–405. [Google Scholar] [CrossRef]
  40. Lens, L.; Van Dongen, S.; Kark, S.; Matthysen, E. Fluctuating asymmetry as an indicator of fitness: Can we bridge the gap between studies? Biol. Rev. 2002, 77, 27–38. [Google Scholar] [CrossRef] [PubMed]
  41. Klingenberg, C.P. A developmental perspective on developmental instability: Theory, models, and mechanisms. In Developmental Instability: Causes and Consequences; Polak, M., Ed.; Oxford University Press: New York, NY, USA; Oxford, UK, 2003; pp. 14–34. [Google Scholar]
  42. Graham, J.H.; Shimizu, K.; Emlen, J.M.; Freeman, D.C.; Merkel, J. Growth models and expected distribution of fluctuating asymmetry. Biol. J. Linn. Soc. 2003, 80, 57–65. [Google Scholar] [CrossRef]
  43. Pearson, K.; Davin, A.G. On the biometric constants of the human skull. Biometrica 1924, 16, 328–363. [Google Scholar] [CrossRef]
  44. Huestis, R.R. A description of microscopic hair characters and of their inheritance in Peromyscus. J. Exp. Zool. 1925, 41, 429–470. [Google Scholar] [CrossRef]
  45. Roginskii, Y.Y. On some results of the use of quantitative method for morphological variation studies. Arkhiv Anat. Gistol. I Embriol. 1959, 36, 83–89. (In Russian) [Google Scholar]
  46. Kurshakova, Y.S. On the classification of measurable qualitative characters. Zhurn. Obs. Biol. 1967, 28, 306–314. (In Russian) [Google Scholar]
  47. Yegorov, J.E. Range of variability and its connection with character’s absolute mean values and processes of formation. Zhurnal Obs. Biol. 1969, 30, 658–662. (In Russian) [Google Scholar]
  48. Yablokov, A.V. Variability of Mammals; Amerind Publishing Co: New Delhi, India, 1974. [Google Scholar]
  49. Lande, R. On comparing coefficients of variation. Syst. Zool. 1977, 26, 214–217. [Google Scholar] [CrossRef]
  50. Soulé, M.E. Allomeric variation. I. The theory and some consequences. Amer. Nat. 1982, 120, 751–764. [Google Scholar] [CrossRef]
  51. Leamy, L. Morphometric studies in inbred and hybrid house mice. V. Directional and fluctuating asymmetry. Amer. Nat. 1984, 123, 579–593. [Google Scholar] [CrossRef]
  52. Lajus, D.L. Variation patterns of bilateral characters: Variation among characters and among populations in the White Sea herring (Clupea pallasi marisalbi). Biol. J. Linn. Soc. 2001, 74, 237–253. [Google Scholar]
  53. Lajus, D.L.; Alekseev, V.R. Components of morphological variation in baikalian endemial cyclopid Acanthocyclops signifer complex from different localities. Hydrobiologia 2000, 417, 25–35. [Google Scholar] [CrossRef]
  54. Lajus, D.L.; Knust, R.; Brix, O. Fluctuating asymmetry and other parameters of morphological variation of eelpout Zoarces viviparus from different parts of distributional range. Sarsia 2003, 88, 247–260. [Google Scholar] [CrossRef]
  55. Lajus, D.L.; Ciostek, M.; Draszanowska, M.; Sywula, T. Geographic and ontogenetic patterns of chaetotaxy variation in glacial relict Saduria entomon (L.) (Crustacea, Isopoda): Inter-population, inter-individual and intra-individual variation (fluctuating asymmetry). Ann. Zool. Fenn. 2003, 40, 411–429. [Google Scholar]
  56. Van Valen, L. A study of fluctuating asymmetry. Evolution 1962, 16, 125–142. [Google Scholar] [CrossRef]
  57. Lajus, D.L.; Graham, J.H.; Kozhara, A.V. Developmental instability and the stochastic component of total phenotypic variance. In Developmental Instability: Causes and Consequences; Polak, M., Ed.; Oxford University Press: New York, NY, USA; Oxford, UK, 2003; pp. 343–363. [Google Scholar]
  58. Mosimann, J.E.; Campbell, G. Applications in biology: Simple growth models. In Lognormal distributions: Theory and applications; Crow, E.L., Shimizu, K., Eds.; Marcel Dekker: New York, NY, USA, 1988; pp. 287–302. [Google Scholar]
  59. Graham, J.H.; Emlen, J.M.; Freeman, D.C. Nonlinear dynamics and developmental instability. In Developmental Instability: Causes and Consequences; Polak, M., Ed.; Oxford University Press: New York, NY, USA; Oxford, UK, 2003; pp. 35–50. [Google Scholar]
  60. Palmer, A.R.; Strobeck, C. Fluctuating asymmetry as a measure of developmental stability: Implications of nonnormal distributions and power of statistical tests. Acta Zool. Fenn. 1992, 191, 57–72. [Google Scholar]
  61. Emlen, J.M.; Freeman, C.D.; Graham, J.H. Nonlinear growth dynamics and origin of fluctuating asymmetry. Genetica 1993, 89, 77–96. [Google Scholar] [CrossRef]
  62. Graham, J.H.; Freeman, D.C.; Emlen, J.M. Antisymmetry, directional symmetry, and dynamic morphogenesis. Genetica 1993, 89, 121–137. [Google Scholar] [CrossRef]
  63. Van Dongen, S.; Sprengers, E.; Löfstedt, C. Correlated development, organism wide asymmetry and patterns of asymmetry in two moth species. Genetica 1999, 105, 81–91. [Google Scholar] [CrossRef]
  64. Freeman, C.D.; Brown, M.L.; Dobson, M.; Jordan, Y.; Kizi, A.; Micallef, C.; Hancock, L.C.; Emlen, J.M.; Graham, J.H. 2003. Developmental instability: Measures of resistance and resilience using pampkin (Cucurbito pepo L.). Biol. J. Linn. Soc. 2003, 78, 27–41. [Google Scholar] [CrossRef]
  65. Vogt, G. Stochastic developmental variation, an epigenetic source of phenotypic diversity with far-reaching biological consequences. J. Biosci. 2015, 40, 159–204. [Google Scholar] [CrossRef] [PubMed]
  66. Sokal, R.R.; Rohlf, F.J. Biometry; W.H. Freeman and Company: New York, NY, USA, 1981. [Google Scholar]
  67. Lajus, D.L. What is the White Sea herring (Clupea pallasi marisalbi, Berg 1923)? A new concept of the population structure. In Proceedings of the VIII Congress Societatis Europaea Ichtiologorum, Oviedo, Spain, 26 September–2 October 1996; Volume 21, pp. 221–230. [Google Scholar]
  68. Lajus, D.L. Two-dimensional model of phenotypic variation. Proc. Zool. Inst. RAS 1998, 267, 107–114. (In Russian) [Google Scholar]
Figure 1. Regression lines of standardized FAs on trait means for three samples of A. signifer: Bolshie Koty (filled triangles and thin solid line), Peschannaia Bay (open circles and dotted line) and Ushkanii Islands area (filled squares and thick solid line). Data are log-transformed (based on data from Table 2 [53]).
Symmetry 15 00476 g001
Table 1. Pearson correlation coefficients between means (M) and standardized FAs (after accounting for measurement error) for different types of transformations, and slopes of FAs and factorial components (FCs) on log-transformed means and variances. Data sources are the following. (i) Copepod A. signifer: Table 2 from Lajus and Alekseev [53]: [three samples from different locations on Lake Baikal: Bolshie Koty (1), Peschannaia Bay (2), Ushkanii Islands (3); 19 morphometric characters representing size of setae and body proportions]. (ii) White Sea herring C. pallasii: Tables 1 and 3 from Lajus [52] [two sympatric populations, spring spawning (1) and summer spawning (2); 21 meristic characters representing the number of fat lacunae in cranial bones; 21 morphometric characters representing bone measurements]. (iii) Eelpout Z. vivparus: Table 4 from Lajus and co-authors [54] [five populations from different locations: Kandalaksha Bay/White Sea (1), Gulf of Finland/Baltic Sea (2), Gulf of Gdansk/Baltic Sea (3), Wadden Sea/North Sea (4), Hafrsfjord/North Sea (5); 17 characters representing the number of fat lacunae in cranial bones]. (iv) Isopod S. entomon: Table 6 from Lajus and co-authors [55] [four samples of adults from different locations: Gulf of Gdansk/Baltic Sea (1), Gulf of Finland (2), Severnaya Dvina River estuary (3), Pechora River estuary (4), and two samples of juveniles from Severnaya Dvina River estuary (5) and Pechora River estuary (6)]. Contribution of measurement error is presented in cited papers: in A. signifier, usually varying from 20 to 60%; in C. pallasii, 5–15% and 3–10% in meristic and morphometric traits, respectively; in Z. viviparus, 15–25%; and in S. entomon, 0 to 1% in adults and from 0 to 5% in juveniles.
Species, Populations and Trait TypePearson Correlation CoefficientSlope FA-M, Log-TransformedSlope FC-M, Log-Transformed
Untransformed FA and MSquare-Root Transformed MLog-Transformed M and FA
A. signifer (1), metric−0.367−0.522−0.499−0.511−0.141
A. signifer (2), metric−0.461−0.570−0.684−1.325−0.547
A. signifer (3), metric−0.395−0.562−0.908−1.192−0.217
C. pallasii (1), meristic−0.550−0.660−0.799−0.862−0.637
C. pallasii (2), meristic−0.587−0.702−0.954−1.276−0.493
C. pallasii (1), metric−0.598−0.688−0.802−1.883−1.451
C. pallasii (2), metric−0.646−0.735−0.853−2.048−1.546
Z. viviparus (1), meristic−0.672−0.724−0.831−0.742−0.569
Z. viviparus (2), meristic−0.471−0.558−0.826−0.916−0.563
Z. viviparus (3), meristic−0.551−0.652−0.847−0.886−0.477
Z. viviparus (4), meristic−0.646−0.769−0.813−0.872−0.113
Z. viviparus (5), meristic−0.546−0.634−0.847−0.740−0.042
S. entomon (1), meristic−0.482−0.506−0.454−0.934−1.736
S. entomon (2), meristic−0.736−0.767−0.763−1.125−0.481
S. entomon (3), meristic−0.459−0.477−0.491−1.142−0.466
S. entomon (4), meristic−0.268−0.250−0.229−0.3550.040
S. entomon (5), meristic−0.581−0.612−0.628−1.0831.491
S. entomon (6), meristic−0.773−0.782−0.829−1.222−0.383
Disclaimer/Publisher’s Note: The statements, opinions and data contained in all publications are solely those of the individual author(s) and contributor(s) and not of MDPI and/or the editor(s). MDPI and/or the editor(s) disclaim responsibility for any injury to people or property resulting from any ideas, methods, instructions or products referred to in the content.

