Abstract
Quality of Service (QoS) refers to techniques that function on a network to dependably execute high-priority applications and traffic reliably run high-priority applications and traffic even when the network’s capacity is limited. It is expected that data transmission over next-generation WSNs (Wireless Sensor Networks) 5G (5th generation) and beyond will increase significantly, especially for multimedia content such as video. Installing multiple IoT (Internet of Things refers to the network of devices that are all connected to each other) nodes on top of 5G networks makes the design more challenging. Maintaining a minimal level of service quality becomes more challenging as data volume and network density rise. QoS is critical in modern networks because it ensures critical performance metrics and improves end-user experience. Every client attempts to fulfill QoS access needs by selecting the optimal access device(s). Controllers will then identify optimum routes to meet clients’ core QoS needs in their core network. QoS-aware delivery is one of the most important aspects of wireless communications. Various models are proposed in the literature; however, an adaptive buffer size according to service type, priority, and incoming communication requests is required to ensure QoS-aware wireless communication. This article offers a hybrid end-to-end QoS delivery method involving customers and controllers and proposes a QoS-aware service delivery model for various types of communication with an adaptive buffer size according to the priority of the incoming service requests. For this purpose, this paper evaluates various QoS delivery models devised for service delivery in real time over IP networks. Multiple vulnerabilities are outlined that weaken QoS delivery in different models. Performance optimization is needed to ensure QoS delivery in next-generation WSN networks. This paper addresses the shortcomings of the existing service delivery models for real-time communication. An efficient queuing mechanism is adopted that assigns priorities based on input data type and queue length. This queuing mechanism ensures QoS efficiency in limited bandwidth networks and real-time traffic. The model reduces the over-provisioning of resources, delay, and packet loss ratio. The paper contributes a symmetrically-designed traffic engineering model for QoS-ensured service delivery for next-generation WSNs. A dynamic queuing mechanism that assigns priorities based on input data type and queue length is proposed to ensure QoS for wireless next-generation networks. The proposed queuing mechanism discusses topological symmetry to ensure QoS efficiency in limited bandwidth networks with real-time communication. The experimental results describe that the proposed model reduces the over-provisioning of resources, delay, and packet loss ratio.
1. Introduction
Some technologies that will be accessible through networks beyond 5G include graphical, microwave frequency transmission, huge smart regions, angular orbital dynamics, and visible light communications. Researchers have started to forecast the future of communication once 5G networks are implemented in the Americas, Europe, and Asia. B5G networks are expected to revolutionize how people communicate with one another with their estimated data capacity of 10 terabits per second, universal connectivity, decreased latency, better dependability, reduced energy usage, and improved security [1]. The IEEE 802.16 family of standards is designed to provide long-range broadband wireless access (BWA) that provides quality of service (QoS) for different service levels with low latency/jitter, low loss, and sufficient bandwidth. By 2025, the connected devices will reach about 37 billion linked devices, including 25 billion Internet of Things (IoT) [2]. It will include sensors, consumer gadgets, wearable machines, linked vehicles, and connected IoT nodes. Aside from the growing need for mobile data transport, online apps, re-stroke, and IoT applications are anticipated to rise continuously [3]. In addition to the increasing number of devices. Global traffic IP is expected to grow from 122 exabytes per month in 2017 to 396 exabytes per month by 2022, according to Cisco Systems [4].
This work establishes a link between the quality of service of 5G wireless technologies and the quantization parameter of the H.264 and H.265 codecs. This offers an excellent example of an adaptability framework. Additionally, the potential for packet loss and QP during video streaming has been looked into. We may evaluate how QP affects the quality of received video by simulating packet loss in a 5G wireless network and utilizing objective and subjective quality measurements such as PSNR, SSIM, and DMOS. As part of this study, the testbed transmits encoded video to the users from the server. A quality of experience analysis was carried out independently using the application model framework (quality of experience). In order to improve the end user’s QoE, the model takes network packet loss into account when determining the best QP value. The program has been tested with 1920 × 1080 HD video motions that are both swift and sluggish. According to objective and subjective quality measurements, QP = 35 and QP = 30 are the best values for meeting user QoE requirements for slow and quick motions, respectively [5].
Moreover, CISCO estimated that 82 percent of the IP traffic would be video traffic. The number of linked IoT devices and multiples of increased multimedia traffic will have to grow considerably in B5G networks. Quality of Service (QoS) is significant in next-generation wireless networks (NGNs). To guarantee a particular level of network quality and user experience, it combines a faster data rate, smooth mobility, ultra-low latency, high dependability, and energy efficiency [3]. IoT does not have a single accepted definition, but it often refers to connecting everyday objects to the Internet or a conventional network, such as a phone line. In future networks, the devices that can identify, detect, and process will be networked for communication with another device. This is because of device-to-device and machine-to-machine interactions are conceived as virtual future-generation networks. These networked gadgets would contribute to many collaborative activities, including data sensing, identifying a specific individual, acting as dummy humanoids, controlling a house remotely, etc. Two methods of providing QoS are suggested for contemporary cellular networks: client-focused and network-focused [6]. The customer is responsible for selecting radio access technology (RAT) in customer-centric methods. At the same time, the network devices are accountable for supplying the customer with a particular QoS level depending on its needs in network-focused ways. Both methods have advantages and disadvantages. Modern gadgets with great processing strength and numerous RAT receivers are installed. These smart devices can measure signal strength, data rates, delays, and other available RAT access characteristics. In addition to these devices, access to the network, battery availability, application choices on the client, and user behavior are better accessed by these devices [7]. However, the network architecture and its characteristics are poorly understood by customers, making it extremely difficult for a customer-centered strategy to address QoS issues effectively.
In contrast, the network devices have a complete picture of the topology in a network-centered approach and constantly have information on changing link conditions. However, the access layer of these gadgets is not as accurate as in client-focused methods. In addition, there are scalability problems with the number of IoT nodes growing over 5G networks, as anticipated. In addition, network devices may also manage the QoS needs of each flow resulting from many IoT devices in addition to their data routing and forwarding tasks. In traditional networks, QoS provisioning was performed on network core devices responsible for data routing and transmission. If network core devices also participate in QoS supply, this would considerably increase data transmission delays at the core by incorporating the processing complexity. Due to the growth of IoT networks, these devices would also be scalable. Several QoS designs were suggested by utilizing software-defined networking (SDN) rather than network core devices, thus removing the burden. Recently, there has been a strong interest in 5G research and beyond 5G customer RAT selection networks [7]. QoS-assured delivery is a challenge for real-time communications in wireless next-generation networks. Considering the challenges to ensuring QoS, this study proposed a QoS assurance model for next-generation wireless networks [8,9,10]. A dynamic queuing mechanism for real-time networks is proposed as a technique to optimize resources and minimize the delay and packet loss ratio.
This paper is organized as follows. Section 2 overviews the related work in this domain. The QoS in real traffic is presented in Section 3. Section 4 presents different models for the QoS delivery in IP networks. Section 5 outlines various issues in the QoS delivery in various models. Section 6 describes the proposed algorithm for performance optimization next-generation WSN networks. Mathematical expressions of presented model are given ion Section 7. The algorithm for implementing the proposed model is described in Section 8. Section 9 describes the simulation setup, while Section 10 discusses the results and Section 11 concludes the paper.
2. Related Works
Numerous studies have been conducted on service quality, particularly on network-centered methodologies. Planning procedures, monitoring, resource estimation, and QoS cooperation are a few of the QoS provisioning methods suggested for IoT networks. Performance was assessed using QoS (quality of service) criteria in a study of the IoT layer architecture [11]. An architecture is suggested in [12] to meet the user-requested QoS criteria for IoT services virtualization. In [13], QoS-conscious IoT applications for fog systems were proposed as a primary and general paradigm. Some scientists have suggested methods to enable IoT deployment with QoS-aware on fog resources [14]. In [15], LTE-A heterogeneous networks with partial spectrum use for IoT devices were suggested with a probabilistic analysis for QoS provisioning. The practical bandwidth concept ensures that probabilistic QoS assurances are given to consumers.
In [16], the IoT networks offer effective QoS network planning. The article provided a cheap approach by reducing the cost of deployed devices and network resources while meeting minimum QoS criteria. In [17], it is suggested to have a three-layered IoT architecture for QoS assurance. Data were collected from the environment on the lower perceptual level. Data transmission is carried out on the intermediate network layer, while the application layer displays data to consumers. The upper layer was defined as application layers ensuring service time, latency, preciseness, load, and priorities. The second layer was described as the networking layer, which assured bandwidth, delay, packet rate losses, and jitter. In contrast, the third layer was the sensor layers, considering each layer’s coverage, time synchronization, and mobility.
A massive number of linked IoT devices beyond 5G networks poses the challenge of providing seamless connectivity with QoS assurances. In traditional networks, existing multi-access methods cannot handle massive IoT network transmission. Therefore, it is the network’s responsibility to accommodate IoT nodes with QoS assurance. In contemporary networks, various orthogonal access methods are utilized. However, the increasing number of node interconnections will require enormous access support, where orthogonal multiple access methods cannot provide high spectral efficiency and low latency [18]. Researchers are looking at various non-orthogonal access techniques to improve spectrum and bandwidth efficiency while introducing some receiver noise.
Multi-access edge computing (MEC) brings computing and storage capabilities closer to wireless terminals at the network’s edge. The demand for MEC increased along with the rise of high-bandwidth and low-latency applications [19]. However, the problem lies with the MEC when an application with excessive use of data increases to a high degree and overwhelms the nodes’ processing and storage capabilities. To solve this issue, an enhanced device MEC was developed using current devices with increasingly central solid processing units and storage functions. This wireless group of devices, known as mobile clouds, pools its resources in conjunction with MEC to serve specific end devices [20]. Enhanced MEC device enhances MEC scalability and increases the QoS network further. A layback architecture [21] is suggested to share resources across various wireless operators and technologies on communications and computer resources. Layback architecture disconnects the front of the backhaul by putting the coordinating points behind the gates. Another architecture named Fluid RAN [22] partially reduces RAN’s operating expenses and the requirement for MEC by relocating some of the primary station operations to a central unit via a virtualized radio access network method.
A recent study in the client-based RAT selection domain was conducted for 5G and beyond 5G cellular networks. An approach for optimizing utility features for all clients of a given 5G access network with some limits on the part of each client was explored in [7]. A RAT selection method was provided for double-sim User Equipment (UE) [23]. Two separate base stations from two different networks link the user concurrently. The selection of RAT is based on call quality, call costs, energy usage in the user equipment, and the transfer rate of each RAT primary station. Work has been carried out to forecast cooperative networks by combining client and network domain knowledge [24]. The article offers evidence for 6G networks, which argues that higher data rates may be obtained via cooperation with EUs and network devices to decide how to maximize the machine-based learning network compared with network-focused methods. The customer and network context selection methods were explored using context-aware radio access technology. The results indicated that a context-conscious approach is superior to traditional RAT selection criteria such as signal strength, number of transmissions, delays, and transmitting. [25] presented a multi-homing scheme for heterogeneous 5G networks where customers may transfer different traffic classes via multiple RATs. A client-based distributed decision-making algorithm is presented, which arranges network resources to be allocated in various classes according to an order. The visual qualities, segment length, delay, switch strategy, stalls, and quality of service metrics were taken into consideration by this model. The automated model demonstrated the significance of correlation in terms of network behavior characteristics. According to [26], various wireless technologies need improvement in smart cities for Internet of Things applications. Therefore, QoS and QoE empowerment should be considered along with how effectively they satiate the requirements of each region. However, issues might arise from combining several technologies. The over usage of unlicensed spectrum is the root source of these issues. [27] examined the “fly and communicate” UAV protocol. To share a file with GNs in locations that do not stand out, the UAV scans a large rectangular region according to this protocol. The proposed protocol achieved optimum UAV speed, completion time, block length, and the possibility of a decoding mistake impacting energy consumption. The authors in [28] presented two different techniques to address the QoS delivery in UAV communications. The first technique was the decode-and-forward (DF) relay technique. In contrast, the second technique prevented URLLC broadcasts between transmitter and receiver devices from being overheard using a UAV as a jammer. Both strategies are effective because they increase the secrecy rate while decreasing sensitivity to factors such as the UAV’s height, block length, number of decoding errors, and distance between transmitter and receiver. The authors in [29] presented an energy-efficient, three-stage, low-complexity alternating optimization approach that considers the quality of service (QoS), the power allocation, and the cooperating constraints. Their proposed algorithm ensures that transmission energy, PAC, and relay power are all optimized at their peak levels using this algorithm.
3. QoS in Real-Time Traffic
The real-time transformation has a higher data loss rate and a longer delay than the non-real-time transformation. Examples include voice-over IP, online gaming, video conferencing, high data rate transmission in a faraway classroom, and more. Additionally, several motion and sound codecs, including ITU standards H261, H263, and H264 for motion and IEEE standards MPEG2, MPEG4, and G711, GSM, and G723, for good translation, have been utilized in real-time transformation. Sound transformation employs a fixed packet size and constant information ratio.
QoS is defined as the ability of network elements to support a certain level of assurance to a specific service, enhancing performance and reliable data delivery. Thus, the network must satisfy specific requirements concerning the service or data flow it is transporting. QoS suggests measurable execution certification for the system framework. Through some factors, it can be categorized: for example, normal packet misfortune, normal deferral, normal jitter (postpone variety), and average throughput. The QoS might be used in a variety of ways to improve service to various kinds of traffic in a system scenario, for example, need lining, specific application directing, data transfer capacity administration, and activity molding. Quality of service execution can be distributed within two classes:
- QoS application layer: At the application level, QoS is executed. Within such scenarios, jitter is notably managed.
- QoS network layer: quality of service performance managed within this technique on the network layer. Within such scenarios, bandwidth utilization and delay are handled and controlled.
We will investigate various QoS techniques in the sections that follow because of the importance of the QoS network layer. Low-latency and high-quality video are two of the items on this list. Instead of using qualitative statements, measurable measurements are usually used. The essential quality of service (QoS) metrics we used to be end-to-end latency and delay variation. The time needed to get from point A to point B is typically used to measure delays. Between the time a packet was sent and the time it reached its destination, milliseconds elapsed. The entire delay is the result of delays in switching decision-making, scheduling, and propagation. Jitter results from variations in the time it takes for each sequence packet to arrive. Other names for jitter are delay difference and delay variation. The time it takes for subsequent packets to arrive is sometimes used to compute. It is measured in milliseconds.
4. Models for QoS Implementation at IP Networks
The real-time transformation system should have a quality service technique that works on every router and switch. Within current systems, numerous techniques are found, such as IEEE 802.1p/q, DiffServ, and IntServ. For the providence of maximum advantage, quality of service should work at both ends. Routers and switches among real-time collectors and senders should have a quality service technique. Quality of service execution works on 2 and 3 layers in the protocol pile. Through routers, the quality of service layer 3 can be recognized. For the congestion and quality of the service layer, 2 is compulsory. With the limitation of current assets, the proposed model’s purpose is to reduce packet delay and loss for real-time collaborative data traffic. Data traffic can be measured in the variable bit ratio or constant bit rate. For the suggested model, video traffic is said to be a variable bit rate, while a good part of sound over internet protocol is considered a constant bit rate. Thus, the classification is based on the type of incoming traffic (i.e., service type) received at the network edge router. For the execution of the quality of service on layer 3, two procedures are introduced.
There are three types of QoS models:
- Best-effort service delivery model.
- Integrated service model (IntServ).
- Differentiated service model (DiffServ)
4.1. Best Effort Delivery Model
In the best-effort service model, there is no guarantee of reliability, throughput, and delay. It uses first-in-first out (FIFO) as queuing scheduling.
- Internet protocol (IP) networks frequently give their customers access to this.
- The first six bits are known as the DSCP (differentiated services code point) in classifications, whereas the final three are known as experimental ones.
- The DSCP value for assured forwarding class, best effort, and accelerated forwarding shows the experimental bits (3 bits) in the shim header.
4.2. Integrated Service (IntServ) Model
IntServ has adaptability issues and is not generally acknowledged in sending over the web. Within this venture, the differentiated service model has been considered for execution. Several QoS components can be regarded as an integrated or multi-service model. The network first sends a message asking for the data before sending it. This request is made to the network node using the resource reservation protocol (RSVP) [30]. The IntServ paradigm states that service quality is a concern for all hubs. For two groups of services, this model offers help [31]. IntServ competent-based system flagging and affirmation control are usable to negotiate the quality of service with IntServ. [24], The major (Internet Engineering Task Force) IETF protocol for integrated service design is (resource reservation protocol) RSVP, which has been stated within RFC 2250. For the usage of a specific application, the RSVP protocol sends a request for a particular quality of service. Moreover, it is usable when required to pass requests all over the system. Significant RSVP characteristics are given below:
- For multicast and unicast applications, RSVP reserves a spot.
- For the unidirectional stream of data, RSVP creates spots.
- Collector of information torrent maintains asset reservation.
- Saved assets include CPU cycles, buffer space, and bandwidth.
- RSVP demands a router for maintaining data for every mode of real-time torrents. However, for substantial systems this arrangement is inappropriate.
4.3. Differentiated Service (DiffServ) Model
This model was described in RFC-2475 and used as an alternative method with appropriate characteristics [32]. Instead of allocating assets to every torrent, DiffServ assigns assets to a whole traffic group. DiffServ identifies the arrangement of service groups with appropriate guidelines. Numerous forwarding groups and sets exit:
- Assured forwarding:Within four assured classes, the per-hop behavior (PHB) class offers a supply of internet protocol packets that is stated in RFC-2597. Internet protocol packets inside every assured forwarding class may be allocated at any level, such as low, high, and medium [33].
- Expedited forwarding:On the appropriate interval, EF offers building blocks for slight jitter, small loss, and short delay services for safeguarding traffic. These will be served on a specific and predefined ratio and it has been stated within RFC-3246 [34].
An AF class has been described within every hub. Each AF class is assigned a number that indicates the number of assets. Internet protocol packets set priorities or superiorities. If a blockage occurs, the drop priority of a packet decides the relative significance of the parcel inside the AF group. A blocked hub prevents packets from low-level superiority. Within the hub, the ratio of sending confirmation of the internet protocol parcel in this manner relies upon the following:
- How many sending assets have been allotted to the AF class with which the packet has a place?
- What is the present heap of the AF class if there should be an occurrence of blockage within the group?
- What will be the bead superiority of the packet?
For sound transformation, an expedited forwarding technique is suggested. It is implementable with the help of a priority line. Before another type of queue, a priority queue is always considered empty. Via high-priority-based assured forwarding technique, video conferencing is implementable and utilizes queue rate-based. [32] proposed an optimal scheduling algorithm SDWSN for wireless transfer of power. The proposed algorithms efficiently solve the power transfer issue to resolve energy scarcity in WSN [33 proposed that task scheduling can solve the issues of energy optimization. They reviewed various scheduling algorithms in ubiquitous clouds. They proposed using a meta-heuristic optimization-based task scheduling algorithm to solve the problem of the inefficiency of trivial scheduling algorithms. The authors developed an automated model for evaluating the user’s quality of experience (QoE) during adaptive video streaming over wireless networks [34]
It is suitable for the met system. A comparison of several service delivery models is presented in Table 1 [35].

Table 1.
A comparison of several service delivery models.
5. Challenges for QoS Delivery for Real-Time Communication
Regarding service quality, DiffServ is the best choice (QoS). Internet service providers may offer different service levels depending on their client’s needs. The Internet service provider and the customer must enter a service level agreement (SLA). Many service classes are not listed in the DS column. Different class types exchange resources in different ways. Each class has more state information if there are more flows than classes. The IP header’s 8-bit TOS (Type of Service) field is the foundation for the DiffServ concept. The area has been split into a 6-bit DiffServ Code Point (DSCP) value and a useless 2-bit component because few users adopted the old TOS definition. Following a contract between the parties, the edge nodes of DiffServ read the TOS byte from the IP packet header and label it with a DSCP. Only the DSCP value is essential to other routers in the same domain when receiving the packet. “Per-Hop-Behavior” is the name of this therapeutic approach (PHB). Service-oriented quality of service technique is an accessible methodology for real-time traffic. By using the following two phases, this technique can be implemented.
- Real-time packets such as sound and motion would point out through multiple DSCP values. And marking of packets will be conducted on the switch level.
- Packets will be divided between various services to get demanded quality of service, and various types of planning procedures will be executed upon those groups based on the DSCP values.
Elements of a modern router are presented in Figure 1.
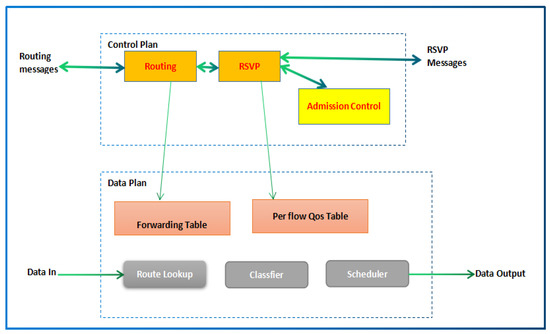
Figure 1.
Elements of modern router [26].
The procedure of switch action can be seen through numerous planes such as the data and control planes. Packet categorization and planning are the core responsibilities of the data plane, while admission control and asset reservation demands activities are completed inside the control plane. Packets are ordered relying on the DSCP estimation of the parcel header and allotted to the various lines (cradles) of sending classes, as appears in Figure 2.
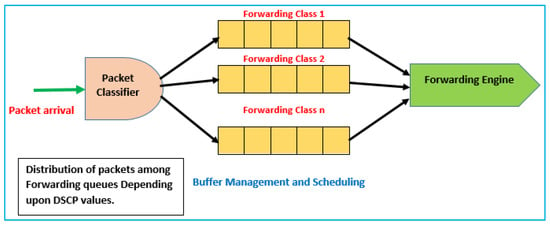
Figure 2.
Classification of packets [34].
The main cause of packet loss is due to congestion and deferral inside the packet information system queues. Queues are considered to be the significant reasons for packet lost. The lines exist on every outcome port, and they are compulsory for the packets to leave and enter the outcome line. If the lines are vacant or about exhaust, the parcel enters and is immediately sent onto the yield connect. On the off chance that rapid movement is overwhelming, the lines top off, and parcels are postponed sitting tight for every single packet in the line to be sent before it can be sent to the yield connect. When the lines are filled and the traffic rate is more significant due to high traffic, then the packet loss ratio will increases.
6. Proposed Model for QoS-Assured Delivery in WSN-NG
The suggested model aims to reduce packet delay and loss for real-time collaborative data traffic with current assets’ limitations. Data traffic can be measured in the variable bit ratio or constant bit rate. For the suggested model, video traffic is said to be a variable bit rate, while the good part of the internet protocol is considered a constant bit rate. Data traffic with real-time constraints is created on the transmitter end and sent to the destination via the QoS network tool through the network edge.
For different traffic groups, differentiated services-based QoS is being considered. The suggested mechanism is deployed on the router and switched, and it is at the edge of the IP network with a connection for bottleneck handling at the transmitter end. Most routers give four lines (queues) for supporting the diff-serve mechanism. The first line is the peak superiority line utilized for some signaling traffic. This line is said to be a network line. The suggested model performs QoS with other queues and supposes the presence of the first line apart from the other three lines. Figure 3 shows the QoS scheme’s block design for the outlet data traffic at the network’s edge. Differentiated services can be distributed into three phases.
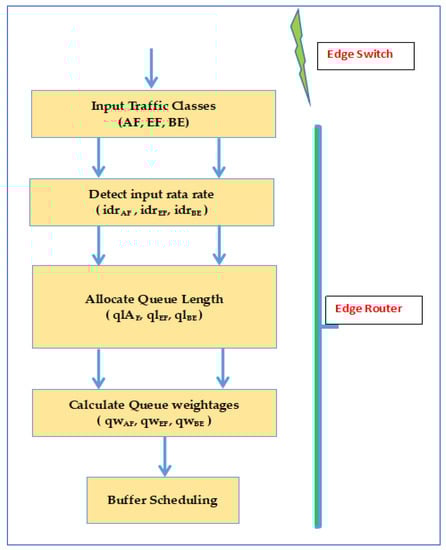
Figure 3.
The proposed architecture of the model.
6.1. Marking of Input Traffic Classes
The traffic pattern is divided into three distant types of traffic. Video traffic (variable bit rate traffic), voice traffic, and text traffic (traffic with constant bit rate). Incoming traffic is labeled through the DSCP priority value for several sorts of traffic. For instance, video data traffic is labeled via the AF DSCP priority value; EF labels voice traffic in the DSCP priority value, and text traffic is marked with the real-time constraints labeled as BE in the DSCP priority value. Labeling is conducted at the transmitter end on the network’s edge routers.
6.2. Classification of Input Traffic
According to the DSCP priority value, the labeled traffic is categorized into the following groups.
- Assured Forwarding: Video traffic belongs to this group. It is denoted as AF.
- Best Effort: Text traffic or constant bit rate communication is considered in this class. It is denoted as BE.
- Expedited Forwarding: Voice traffic belongs to this class. It is denoted as EF.
At the transmitter end, categorization was conducted at the central routers of the network. Video traffic is variable bit rate traffic. Moreover, it requires more bandwidth resulting in more congestion across the bottlenecks. Therefore, it is more prone to congestion and packet loss as well. Hence it is called assured forwarding, and video traffic belongs to this group. It is denoted as AF. At the same time, EF stands for expedited forwarding. Voice/Audio traffic belongs to this group. It differs from AF traffic as it has less bit rate than AF traffic and results in less congestion in network bottlenecks. Hence it is differently classified.
6.3. Scheduling of Traffic after Classification
Routers allocate the lines to the groups mentioned above, and the presented bandwidth is divided between the lines. Within a packet network, by using a scheduling scheme, the lines play an essential role in packet delay and loss. This paper presents QoS scheduling model implementation with the help of experimental queues. Within this model, the total delivered bandwidth and available buffers are divided among various groups of facilities. By nature, the model is dynamic because the available buffer assignment process is adaptive with the present line length, for example, the current load on that line. The bandwidth assignment process utilizes available buffers size, such as the weightage of the biased round-robin technique. Biasness is represented as weights. The facility ratio of the line is proportional to the assigned bandwidth. First of all, scheduling factors are described within this model. After that, assigned assets are derived for every line. Figure 4 defines the scheduling model and supportive aspects.
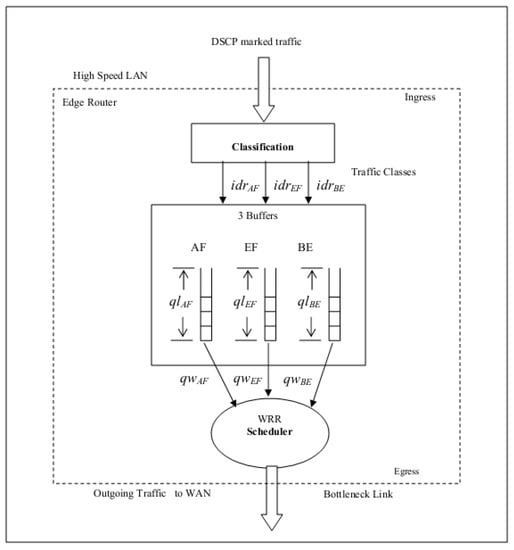
Figure 4.
Flow chart of proposed QoS scheduling algorithm.
7. Mathematical Representation of Proposed QoS-Assured Model
QoS is an umbrella term that combines various factors such as noise, delay, response time, packet loss, etc. However, in this work, we have divided traffic into three types: video, audio, and text; we evaluated the QoS after implementing the proposed model using packet loss and packet delay to ensure QoS for real-time communication in IP networks. Two factors govern the packet loss and delay on the outgoing data traffic lines.
- Queue length
The size of queue length is a variable that depends on various factors, including the type of incoming traffic, priority assigned to traffic type, number of requests (a communicative message), acceptable delay of packet, size of packet, the average rate of data input, etc.
- qlBE: for BE available buffers, average line length, or available buffers size.
- qlEF: for EF available buffers, average line length, or available buffers size.
- qlAF: for AF available buffers, average line length, or available buffers size.
- ii.
- For biased round-robin scheduler, line weight:
- qwBE: for BE traffic, facility ratio, or queue weight.
- qwAF: for AF traffic, facility ratio, or queue weight.
- qwEF: for EF traffic, facility ratio, or queue weight.
In the variable terms given below, the above factor classes are calculated:
- NEF = for EF traffic, no of sessions.
- dlvEF = for EF traffic, acceptable delay of packet.
- pktszEF = for EF traffic, the average size of the packet.
- idrEF = for EF traffic, the average rate of data input.
- NAF = for AF traffic, no of sessions.
- dlvAF = for AF traffic, acceptable delay of packet.
- pktszAF = for AF traffic, the maximum size of the packet.
- idrAF = for AF traffic, the average rate of data input.
- TB = at the network edge, total obtainable bandwidth.
- BUFF = at the router, total obtainable available buffers.
Data input rates will be gathered to examine the properties of traffic that is real time. From QoS traffic specifications, an acceptable delay of the packet will be set. No sessions were provided via the admission control technique, which was supposed to be available for the suggested model. TB is said to be the total obtainable bandwidth at the network edge; BUFF is referred to as the total obtainable available buffers at the router, (pktszAF and pktszEF) are said to be average packet size, and (idrEF and idrAF) are supposed to be the average rate of input data of the data traffic with the real-time constraints of the traffic. At the router, the total obtainable available buffers are found from the router requirement.
For every class of traffic, available buffer assignment.
For several lines, the assigned available buffers are calculated as follows:
qlEF = (idrEF × dlvEF × NEF)/pktszEF
qlAF = (idrAF × dlvAF × NAF)/pktszAF
qlEF =BUFF − (qlEF + qlAF)
For every class of traffic for weighted round robin, weightage or rate of services:
Scheduling strategy depends upon the WRR (Weighted round robin) network scheduler. WRR is a weighted round-robin assignment allocation of resources to services. The L lines are operated according to the line weight of the specific data traffic sets. The line ration for the corresponding line is similar, just like the service rate. Line load is adaptive with a present length of the line of a specific set of data traffic. If the line length of three sets is similar for a specific period, the scheduling algorithm drives with the superiority of the traffic class. EF’s (expedited forwarding) superiority will be more than the superiority of AF (Assured Forwarding). Weightage allocation is completed within the given mentioned way.
- Suppose qwFE = at time t, rate of service, or line weight for EF.
- QwAF = at time t, rate of service, or line weight for AF.
- QwBE = at time t, rate of service, or line weight for BE.
- QlBE = at time t, size of available buffers, or length of line for BE.
- QlFE = at time t, size of available buffers, or length of line for FE.
- QlAF = at time t, size of available buffers, or length of line for AF.
- PEF = Superiority of EF = 3
- PAF = Superiority of AF = 2
- PBE = Superiority of BE = 1
qwBE = (qlBE × PBE)/(qlAF + qlBE + qlEF)
qwAF = (qlAF × PAF)/(qlAF + qlBE + qlEF)
qwEF = (qlEF × PEF)/(qlAF + qlBE + qlEF)
The above three mentioned equations illustrate that the line facility rate is adaptive to the amount of specific facility line length to the total length of all lines facilities, and used collectively. If the line set length is larger than the other lines, then that line will run fast, whose length is little. If the lines are the same length, then according to the superiority priority value, the lines will be served. Every traffic class is examined just like the product of allocated superiority and length of the line. For e.g., in the EF class, sound data traffic will run fast when the line length is huge. AF will run fast when its length is greater. Conversely, BF will perform better when there is no AF and EF set of data traffic.
8. Step-by-Step Algorithm for Implementation of Proposed QoS Model
As mentioned before, the scheduling model utilizes the WRR algorithm for serving the lines. The three equations above provided the calculated rates of services or weightage.
The process of the performing traffic scheduler can be made accurate like the following phases.
Phase 1: For data traffic with real-time constraints, define the sessions. No sessions were provided via the admission govern technique, which was supposed to be present before the suggested model.
Phase 2: For several traffic classes, define the line length via Equations (1)–(3).
Phase 3: Compute the round-robin rate of service or line weight via Equations (4)–(6).
Phase 4: Servicing ratio of the line is proportional to its weight. By using the logic given below, the lines are operated.
If (line length is lengthier than another line).
Else (run that line).
Else if (lines are similar length).
Else (run peak superiority line).
The scheduling model discussed before is simulated using NS2 (standard network simulator). Below, the units define a model simulation in detail and describe simulation results.
8.1. Pseudo Code of the Algorithm
- Initialize idrAF idrBE, idrEF, QlAF, QlBE, QlEF, QwAF, QwEF, QwBE, dlvAF, dlvEF, pktszAF, pktszEF
- F[]=incoming frame
- Input frame-type
- If frame-type=video then class=AF
- Else if frame-type=audio then class=EF
- Else if frame-type=text then class=BE
- calculate idr from previous frame
- if class=AF
- input dlvAF= maximum delay to observe
- pktszAF= Packet size from previous frame
- NAF= No of active sessions
- qlAF = (idrAF × dlvAF × NAF)/pktszAF
- PAF =3
- qwAF= (qlAF × PAF)/(qlAF + qlBE + qlEF)
- if class EF
- input dlvEF= maximum delay to observe
- pktszEF= Packet size from previous frame
- NEF= No of active sessions
- qlEF = (idrEF × dlvEF × NEF)/pktszEF
- PEF =2
- qwEF= (qlEF × PEF)/(qlAF + qlBE + qlEF)
- if class=BE
- qlEF =BUFF − (qlEF + qlAF)
- PBE =1
- qwBE= (qlBE × PBE)/(qlAF + qlBE + qlEF)
8.2. Complexity Analysis of Proposed Algorithm
The proposed algorithm runs in linear time as it depends on the number of input lines and is directly proportional to the lines’ weights. Thus, the worst-case complexity of the algorithm is O(n), where n denotes the number of lines.
9. Simulation Setup
In the presence of the suggested model, the portrayed model will be simulated with simulator NS2 to define how the QoS of the actual period is enhanced. At the receiver end, the execution of the model is examined by the measurement of the packet loss and delay of the actual-time data traffic [27].
Network Topology for Simulation
For the implementation of the suggested model, the network topology will be simulated. R1, r2, and r3 are sourced by transmitting videos, data, and voice sources at the transmitter end. Via 100 Mbps linkage, the above three sources are linked to switch edge r4. Via 1 Gbps linkage, R4 is connected to router edge r5. R5 is connected to the network via the bottleneck linkage bandwidth known as MAX. At the collector end, a link is the same as the transmitter end. Router edge r6 linked to switch edge r7. R7 is associated with data (r10), video (r8), and voice source (r9). At the transmitter end, packet building is completed at switch edge r4. At the transmitter end, packet scheduling is fulfilled at router edge r5. The scenario is described in Figure 5.
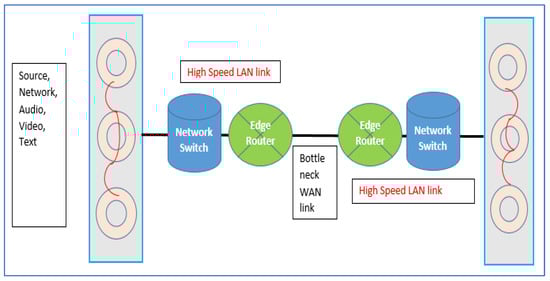
Figure 5.
Network formation for simulation.
The r1 (video) is the succession of information parcels containing rehashed IBBBPBBB outlines produced at a predefined settled interim. However, frames I, B, and P must be of variable length. It is supposed that the creation of the frame order is suitable with a fixed interval of time of consecutive frames I. Amid the creation time, motion meetings 3 are supposed to be executed with a rate of data 384 Kbps. With the fixed packet size, r2 is referred to as the CBR data traffic foundation. Voice meetings 3 are supposed to be executed via the simulation time with a 64 Kbps data rate. For r3, Poisson-divided data traffic is being considered. Delivered traffic that drives toward the bottleneck linkage of the network is equivalent to the addition of amassed data traffic at the lines (amassed EF data traffic load + amassed BF data traffic load + amassed AF data traffic load). Delivered load at linkage is enhanced via enhancing Poisson data traffic at the BE line. The traffic load of AF and EF stays static.
10. Experimental Results
The results are the enhancing the load in the links, and the QoS analysis parameters. The QoS analysis parameters are packet delay and loss for every data traffic, and several bottleneck links on the collector side. Results are performed with the given conditions:
- Using the suggested QoS method.
- Without a proposed QoS model.
On the collector side, the suggested model of the performance measurements is checked for possible enhancements in the performance measurement of the data traffic. The results consist of the performance analysis of the packet delay and the packet for all three sorts of traffic, i.e., AF, EF, and BE. The results consist of the performance analysis of the packet delay and the packet for all three sorts of traffic, i.e., AF, EF, and BE.
- Impact of Proposed QoS Model on Packet loss for different traffic sources
- a.
- Packet loss for AF traffics
Figure 6 and Table 2 demonstrate that when the QoS model is not employed within a bottleneck/congested connection, as the total obtainable load increases, then at the AF queue, the loss rate for the sent packets also grows. If we look at the comparison of the different traffic types, it is obvious that without the QoS model, the packet lost ratio reaches 23% after a certain limit crosses. On the other side, at bottleneck/congested connection observing the QoS ensurance model, the percentage of lost packets at the AF line stays at 2.1 near to the bottom line as the load grows outside the accessible bandwidth. Among the different QoS models, the lost packet ratio is maximum for IntServ and minimum for DiffServ.
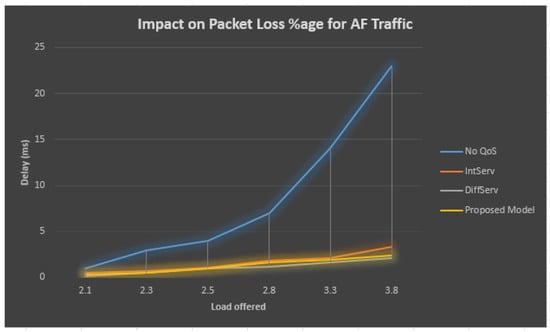
Figure 6.
Performance analysis of AF traffic.
Table 2.
AF traffic statistics.
The proposed dynamic QoS assurance model results in less congestion for lower loads. As the load reaches its maximum, a surge in lost packets is seen, apart from the fact that the proposed model also utilizes the queuing scheme. The queuing length calculation in the proposed model minimizes the packet lost ratio less than Diffserv.
- b.
- Packet Loss for EF traffic
The packet loss results for the EF traffic are described in Figure 7 and Table 3, which demonstrates that when the QoS model is not employed and the total obtainable load increases, then at the EF stream, the packet loss rate for the sent packets also grows. On the other side, at the congested connection observing the QoS, the percentage of lost packets at the EF line remains low compared with the total obtainable load growing outside the accessible bandwidth.
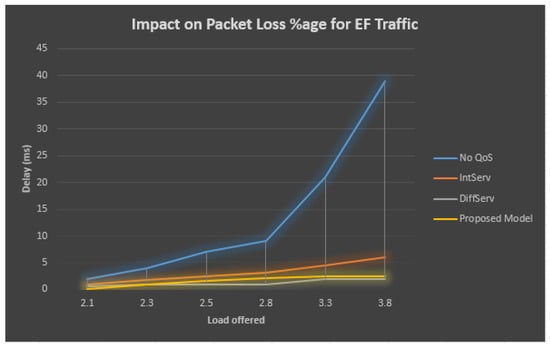
Figure 7.
Comparison of packet lost and load for accumulated EF traffic.
Table 3.
EF traffic statistics.
The situation of the no QoS model is very grim, where the loss ratio reaches 39% when the load crosses the bandwidth limit. Among the other models, the IntServ and proposed model also lower the packet lost ratio. However, the DiffServ model obtains the least packet lost ratio, which is 2%, while the proposed model also reaches a minimum of 2.5% packet lost ratio.
- c.
- Packet lost for BE traffic:
Performance analysis of BE traffic is described in Figure 8 and Table 4 which demonstrates that when the quality of service is not employed, the total obtainable load increases. The BE line rate of loss for the sent packets also grows. When the total presented load crosses the accessible bandwidth, the percentage of lost packets at the BE line grows quickly. However, the loss ratio is minimum for IntServ (13%), and the DiffServ model retains at 16%. This is probably because IntServ ensures real-time packet delivery; hence, the packet is kept waiting for a long time. On the other hand, the DiffServ model reaches a higher level of packet loss ratio. The use of higher priorities for the AF and EF streams is another reason. As the BE traffic stream is considered a minimum priority stream, it is serviced at the end, and therefore a much more lost ratio is seen. So far, it is concluded that a minimum difference in priorities will also ensure a lesser ratio for the BE traffic.
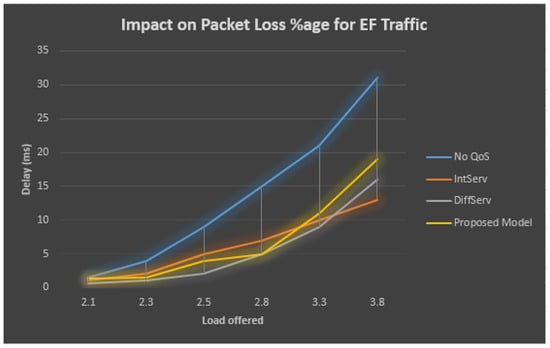
Figure 8.
Ratio of lost packets with load for BE traffic.
Table 4.
Statistics of BE Traffic.
From above Figure 6, Figure 7 and Figure 8 above, it is inferred that the WRR schedules guarantees the QoS to the threshold packet loss for every facility till the total presented load does not cross the bandwidth threshold; accordingly, the upper limited presented load EF and AF stream achieves a lower percentage of lost packets, and on the other side the BE stream crosses over. When the total presented load surpasses the bottleneck/congested bandwidth, superiorities for the EF and AF categories repeatedly guarantee greater QoS for the categories. In contrast, the BE stream category faces a greater packet loss rate.
Accordingly, the proposed QoS model grants that the real-time stream has appropriate quality; however, the total presented load at the bottleneck/congested connection is higher than the obtainable bandwidth. Though it is necessary never to distract the BE stream, impartiality is thus guaranteed to the BE stream. For achieving the CCM (congestion control mechanism), the proposed model is suggested to be applied on the TCP stream for the results without any impact on the QoS of the BE line.
- ii.
- Impact on Packet Delay for different kinds of streams
Packet Delay is considered a critical factor in QoS delivery. Packet delay of different streams is evaluated after the implementation of the proposed QoS assurance model for its effects after execution.
The performance analysis of the AF traffic is described in Table 5 and Figure 9, which demonstrates that when the QoS is not employed at the bottleneck connection, the total obtainable load increases at the AF queue and the delay increases along with the rate of the lost packets. On the other side, the bottleneck connection observing the QoS and the delay in the sent packets stays at minimum value for the DiffServ model. The delay is measured in mili seconds; for transmission without the QoS model, the delay reaches a high value of 173 mili seconds at the maximum traffic load for the EF traffic and reaches 153 mili seconds for the high-priority AF traffic. Moreover, in the case of the AF traffic, the delay is observed as 118, 135, and 186 ms, respectively, for DiffServ, the proposed model, and IntServ models.
Table 5.
AF delay Statistics.
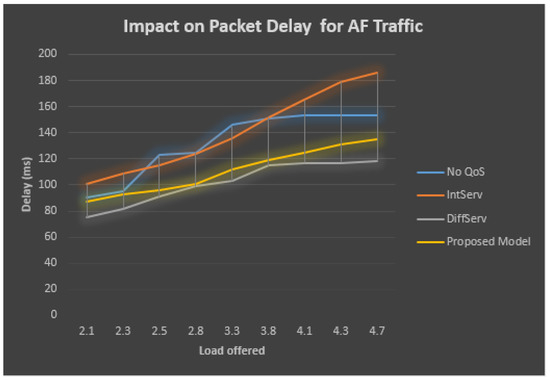
Figure 9.
Packet delay for AF delay traffic.
While in the case of the DiffServ traffic, the delay is observed to retain a minimum of 132 mili seconds for the EF traffic. On the other hand, the proposed model and IntServ model results in a delay value of 155 and 161 mili seconds for the EF traffic.
Table 6 and Figure 10 describe the performance statistics of the EF traffic, which demonstrates that when QoS has never been employed within the bottleneck/congested connection, at the bottleneck/congested connection, the total obtainable load increases, then at the EF queue, the rate of loss for the sent packets also grows. On the other side, at the bottleneck/congested connection observing QoS, the percentage of lost packets at the EF line still stays similar by the total obtainable load at the bottleneck/congested connection and grows outside the accessible bandwidth at the bottleneck/congested connection.
Table 6.
Performance statistic of EF Traffic.
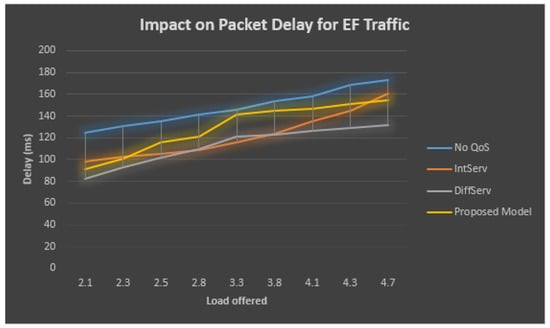
Figure 10.
Effect on packet delay for EF traffic.
The performance analysis of the BE traffic is described in Table 7 and Figure 11, which demonstrates that, when the QoS model is not employed, as the total obtainable load increases, then at the BE line, the delay value also grows. When the total presented load crosses the threshold limit of 2.1 Mbps, the delay increases. However, the delay is seen as the maximum for the IntServ model, 198 ms. At the same time, the proposed model is observed as 193 ms, but the delay is the minimum for the DiffServ model, whose average is 163 ms.
Table 7.
Performance statistics of BE Traffic.
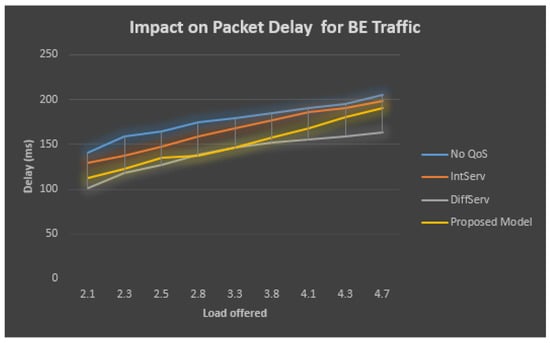
Figure 11.
Packet delay for BE traffic.
From Figure 8, Figure 9, Figure 10 and Figure 11 above, it is inferred that the proposed model, implemented with the WRR schedules, grants QoS to the threshold packet delay for every service until the total presented load crosses the threshold of 2.1 Mbps. Accordingly, at the upper bound limit, the presented load EF and AF packets ensure a lower percentage of packet delays. On the other side, the BE stream is affected when the total presented load surpasses the bottleneck bandwidth; superiorities for the EF and AF categories repeatedly guarantee greater QoS for these streams, whereas the BE stream faces greater packet delay.
11. Discussion
The analysis results proposed that the QoS scheme guarantees that the real-time stream has appropriate quality; however, the total presented load at the bottleneck/congested connection is higher than the obtainable bandwidth. Though it is necessary never to distract the BE stream, impartiality is thus guaranteed to the BE stream. A few CCMs (congestion control mechanisms) need to be applied to the TCP stream to guarantee the impartiality of the BE line. Figure 9 demonstrates that when QoS has never been employed within a bottleneck/congested connection, the total obtainable load increases at the bottleneck connection. Then, the AF queue rate of loss for the sent packets also grows. On the other side, at the bottleneck/congested connection observing the QoS, the percentage of lost packets at the AF line still stays similar by the total obtainable load at the bottleneck/congested connection and grows outside the accessible bandwidth at bottleneck/congested connection. Figure 10 demonstrates that when the QoS has never been employed within a bottleneck/congested connection, at the bottleneck/congested connection total obtainable load increases, and then at the EF queue the rate of loss for the sent packets also grows. On the other side, at the bottleneck/congested connection observing the QoS, the percentage of the lost packets at the EF line still stays similar by the total obtainable load at the bottleneck/congested connection and grows outside the accessible bandwidth at the bottleneck/congested connection. Figure 11 demonstrates that when the QoS has never been employed within a bottleneck/congested connection, at the bottleneck/congested connection, the total obtainable load increases, and then at the BE line the rate of loss for the sent packets also grows. When the total presented load grows the accessible bandwidth at the bottleneck/congested connection yonder, the percentage of the lost packets at the BE line grows quickly through observing the QoS at the bottleneck/congested connection.
12. Conclusions
To enhance the network performance with the constrained capacity, this research offered a method for guaranteeing the QoS for real-time traffic. The model operates at the network’s edge and is built on DiffServ. The idea does not call for over-provisioning of constrained bandwidth to ensure bandwidth. The idea was validated using a simulation-based network model that tested the scheduling method. Due to restrictions in the implementation, the tested testing was not possible. A simulator was used to build the scenario to evaluate the QoS settings that enforce QoS. The suggested approach is dynamic and flexible to changes in the data input ratio of the different classes and the input data type. Two domains are used to analyze the results: one as a single domain and the other as a component of numerous networks. Both simulations provide the same outcomes when the load is raised. Packet loss and delay were the parameters to test the functionality of the QoS control settings. If the traffic is AF and EF, an increase in the load will result in more packet loss and delay. However, as the idea reduces packet loss and audio and video communication delays, real-time traffic improves quality.
This traffic engineering model helps improve the QoS for limited bandwidth real-time traffic to fine-tune the QoS. The test performance is based on voice and video traffic using network simulator 2 using a constant and variable bit rate using different codes. The results expressed that delay and packet loss were found within the boundary of the quality requirement, and the same effect is found in the case of multiple input sources for a single constrained bandwidth. Different parameters are tested for the tuning of variable bit video traffic. This parameter ensures better traffic performance by controlling the number of sessions using a resource allocation index. This work to prioritize traffic also applies to video interactive sessions. It is observed that as much as we limit the number of sessions, the more free session will help in better passing of best-effort traffic. When half of the resources are left free, the traffic results in the best performance over the same bandwidth. This plan will help service provider networks avoid over-provision resources for audio/video traffic.
Author Contributions
Conceptualization, T.M. and Y.L.; data curation, I.H.; formal analysis, S.A.H.M.; funding acquisition, S.G., F.K.K. and S.M.M.; investigation, S.G.,Y.L. and S.M.M.; methodology, T.M. and S.M.M.; project administration, S.G. and F.K.K.; resources, S.A.H.M. and I.H.; software, M.A.M.; supervision, S.M.M.; validation, M.A.M. and S.A.H.M.; writing—original draft, S.M.M.; writing—review and editing, S.G. and F.K.K. All authors have read and agreed to the published version of the manuscript.
Funding
Princess Nourah bint Abdulrahman University Researchers Supporting Project number (PNURSP2023R300), Princess Nourah bint Abdulrahman University, Riyadh, Saudi Arabia.
Institutional Review Board Statement
Not applicable.
Informed Consent Statement
Not applicable.
Data Availability Statement
Not applicable.
Acknowledgments
Princess Nourah bint Abdulrahman University Researchers Supporting Project number (PNURSP2023R300), Princess Nourah bint Abdulrahman University, Riyadh, Saudi Arabia.
Conflicts of Interest
The authors declare no conflict of interest.
References
- Yuan, Y.; Zhao, Y.; Zong, B.; Parolari, S. Potential key technologies for 6G mobile communications. Sci. China Inf. Sci. 2020, 63, 183301. [Google Scholar] [CrossRef]
- Mourad, A.; Yang, R.; Lehne, P.H.; De La Oliva, A. A baseline roadmap for advanced wireless research beyond 5G. Electronics 2020, 9, 351. [Google Scholar] [CrossRef]
- Wong, V.W.; Schober, R.; Ng, D.W.K.; Wang, L.-C. Key Technologies for 5G Wireless Systems; Cambridge University Press: Cambridge, UK, 2017. [Google Scholar]
- Cisco. Global Mobile Data Traffic Forecast Update, 2018–2023 White Paper; Cisco: San Jose, CA, USA, 2020. [Google Scholar]
- Taha, M.; Ali, A. Smart algorithm in wireless networks for video streaming based on adaptive quantization. Concurr. Comput. Pract. Exp. 2013, e7633. [Google Scholar] [CrossRef]
- Lei, L.; Tan, Y.; Zheng, K.; Liu, S.; Zhang, K.; Shen, X. Deep reinforcement learning for autonomous internet of things: Model, applications and challenges. IEEE Commun. Surv. Tutor. 2020, 22, 1722–1760. [Google Scholar] [CrossRef]
- Awoyemi, B.S.; Alfa, A.S.; Maharaj, B.T. Resource optimisation in 5G and internet-of-things networking. Wirel. Pers. Commun. 2020, 111, 2671–2702. [Google Scholar] [CrossRef]
- Asif, M.; Khan, W.U.; Afzal, H.M.R.; Nebhen, J.; Ullah, I.; Rehman, A.U.; Kaabar, M.K.A. Reduced-complexity LDPC decoding for next-generation IoT networks. Wirel. Commun. Mob. Comput. 2021, 2021, 2029560. [Google Scholar] [CrossRef]
- Khan, W.U.; Imtiaz, N.; Ullah, I. Joint optimization of NOMA-enabled backscatter communications for beyond 5G IoT networks. Internet Technol. Lett. 2021, 4, e265. [Google Scholar] [CrossRef]
- Ullah, I.; Qian, S.; Deng, Z.; Lee, J.-H. Extended Kalman filter-based localization algorithm by edge computing in wireless sensor networks. Digit. Commun. Netw. 2021, 7, 187–195. [Google Scholar] [CrossRef]
- Wang, M.; Chen, J.; Aryafar, E.; Chiang, M. A survey of client-controlled HetNets for 5G. IEEE Access 2016, 5, 2842–2854. [Google Scholar] [CrossRef]
- Tomovic, S.; Cerroni, W.; Callegati, F.; Verdone, R.; Radusinovic, I.; Pejanovic, M.; Buratti, C. An architecture for QoS-aware service deployment in software-defined IoT networks. In Proceedings of the 2017 20th International Symposium on Wireless Personal Multimedia Communications (WPMC), Bali, Indonesia, 17–20 December 2017; pp. 561–567. [Google Scholar]
- Brogi, A.; Forti, S. QoS-aware deployment of IoT applications through the fog. IEEE Internet Things J. 2017, 4, 1185–1192. [Google Scholar] [CrossRef]
- Skarlat, O.; Nardelli, M.; Schulte, S.; Dustdar, S. Towards qos-aware fog service placement. In Proceedings of the 2017 IEEE 1st International Conference on Fog and Edge Computing (ICFEC), Madrid, Spain, 14–15 May 2017; pp. 89–96. [Google Scholar]
- Beshley, M.; Kryvinska, N.; Seliuchenko, M.; Beshley, H.; Shakshuki, E.M.; Yasar, A.-U.-H. End-to-End QoS “smart queue” management algorithms and traffic prioritization mechanisms for narrow-band internet of things services in 4G/5G networks. Sensors 2020, 20, 2324. [Google Scholar] [CrossRef] [PubMed]
- Zhang, R.; Wang, M.; Shen, X.; Xie, L.-L. Probabilistic analysis on QoS provisioning for Internet of Things in LTE-A heterogeneous networks with partial spectrum usage. IEEE Internet Things J. 2015, 3, 354–365. [Google Scholar] [CrossRef]
- Aldababsa, M.; Toka, M.; Gökçeli, S.; Kurt, G.K.; Kucur, O. A tutorial on nonorthogonal multiple access for 5G and beyond. Wirel. Commun. Mob. Comput. 2018, 2018, 9713450. [Google Scholar] [CrossRef]
- Liu, Y.; Qin, Z.; Elkashlan, M.; Ding, Z.; Nallanathan, A.; Hanzo, L. Non-orthogonal multiple access for 5G and beyond. Proc. IEEE 2017, 105, 2347–2381. [Google Scholar] [CrossRef]
- Pham, Q.-V.; Fang, F.; Ha, V.N.; Piran, M.J.; Le, M.; Le, L.B.; Hwang, W.-J.; Ding, Z. A survey of multi-access edge computing in 5G and beyond: Fundamentals, technology integration, and state-of-the-art. IEEE Access 2020, 8, 116974–117017. [Google Scholar] [CrossRef]
- Mehrabi, M.; You, D.; Latzko, V.; Salah, H.; Reisslein, M.; Fitzek, F.H. Device-enhanced MEC: Multi-access edge computing (MEC) aided by end device computation and caching: A survey. IEEE Access 2019, 7, 166079–166108. [Google Scholar] [CrossRef]
- Shantharama, P.; Thyagaturu, A.S.; Karakoc, N.; Ferrari, L.; Reisslein, M.; Scaglione, A. LayBack: SDN management of multi-access edge computing (MEC) for network access services and radio resource sharing. IEEE Access 2018, 6, 57545–57561. [Google Scholar] [CrossRef]
- Garcia-Saavedra, A.; Costa-Perez, X.; Leith, D.J.; Iosifidis, G. Fluidran: Optimized vran/mec orchestration. In Proceedings of the IEEE INFOCOM 2018-IEEE Conference on Computer Communications, Honolulu, HI, USA, 15–19 April 2018; pp. 2366–2374. [Google Scholar]
- Sliwa, B.; Falkenberg, R.; Wietfeld, C. Towards cooperative data rate prediction for future mobile and vehicular 6G networks. In Proceedings of the 2020 2nd 6G Wireless Summit (6G SUMMIT), Levi, Finland, 17–20 March 2020; pp. 1–5. [Google Scholar]
- Habbal, A.; Goudar, S.I.; Hassan, S. A Context-aware Radio Access Technology selection mechanism in 5G mobile network for smart city applications. J. Netw. Comput. Appl. 2019, 135, 97–107. [Google Scholar] [CrossRef]
- Passas, V.; Miliotis, V.; Makris, N.; Korakis, T. Dynamic RAT selection and pricing for efficient traffic allocation in 5G HetNets. In Proceedings of the ICC 2019-2019 IEEE International Conference on Communications (ICC), Shanghai, China, 20–24 May 2019; pp. 1–6. [Google Scholar]
- Latif, J.; Azam, S.; Chaudhry, H.N.; Muhammad, T. Performance evaluation of modern network-on-chip router architectures. Int. J. Comput. Digit. Syst. 2016, 5, 125–133. [Google Scholar] [CrossRef] [PubMed]
- Aro, T.O.; Adekeye, S.A.; Akande, H.B.; Funso, B.O. Application of Transmission Control Protocol (TCP) and User Datagram Protocol (UDP) in Teleconference System. J. Comput. Sci. Control Syst. 2019, 12, 15–19. [Google Scholar]
- Narsani, H.K.; Ranjha, A.; Dev, K.; Memon, F.H.; Qureshi, N.M.F. Leveraging UAV-assisted communications to improve secrecy for URLLC in 6G systems. Digit. Commun. Netw. 2022; in press. [Google Scholar]
- Asif, M.; Ihsan, A.; Khan, W.U.; Ranjha, A.; Zhang, S.; Wu, S.X. Energy-Efficient Backscatter-Assisted Coded Cooperative-NOMA for B5G Wireless Communications. IEEE Trans. Green Commun. Netw. 2022; in press. [Google Scholar]
- Aggarwal, J.; Dhall, A. Performance Analysis of MPLS over VOIP. Int. J. Sci. Eng. Technol. Res. 2015, 4, 1896–1901. [Google Scholar]
- Liu, S.; Huang, G.; Gui, J.; Wang, T.; Li, X. Energy-aware MAC protocol for data differentiated services in sensor-cloud computing. J. Cloud Comput. 2020, 9, 48. [Google Scholar] [CrossRef]
- Benaboud, H.; Bakkali, S. QoS-CM: An Enhanced Version of QoS-CMS and Its Integration in BGP for an End to End Quality of Service. In Proceedings of the International Conference on Advanced Intelligent Systems for Sustainable Development, Marrakech, Morocco, 8–11 July 2019; pp. 383–389. [Google Scholar]
- Aboul, S.; Elbadawy, H.; Gaafar, A.H. Performance Analysis of Voice and Video Conference over DiffServ and MPLS. In Proceedings of the International Conference on Aerospace Sciences and Aviation Technology, Cairo, Egypt, 11–13 April 2017; pp. 1–12. [Google Scholar]
- Aureli, D.; Cianfrani, A.; Diamanti, A.; Vilchez, J.M.S.; Secci, S. Going beyond diffserv in ip traffic classification. In Proceedings of the NOMS 2020-2020 IEEE/IFIP Network Operations and Management Symposium, Budapest, Hungary, 20–24 April 2020; pp. 1–6. [Google Scholar]
- The Cisco Learning Network. QoS Architecture Models: IntServ vs. DiffServ. 2020. Available online: https://learningnetwork.cisco.com/s/question/0D53i00000KsqtXCAR/qos-architecture-models-intserv-vs-diffserv (accessed on 25 December 2022).


Disclaimer/Publisher’s Note: The statements, opinions and data contained in all publications are solely those of the individual author(s) and contributor(s) and not of MDPI and/or the editor(s). MDPI and/or the editor(s) disclaim responsibility for any injury to people or property resulting from any ideas, methods, instructions or products referred to in the content. |
© 2023 by the authors. Licensee MDPI, Basel, Switzerland. This article is an open access article distributed under the terms and conditions of the Creative Commons Attribution (CC BY) license (https://creativecommons.org/licenses/by/4.0/).