Article

Acoustic Metamaterial Design by Phase Delay Derivation Using Transfer Matrix

1
Department of Automotive Engineering, Dong-eui University, 176, Eomgwang-ro, Busanjin-gu, Busan 47340, Republic of Korea
2
Department of Mechanical Engineering, Dong-eui University, 176, Eomgwang-ro, Busanjin-gu, Busan 47340, Republic of Korea
*
Author to whom correspondence should be addressed.
Symmetry 2023, 15(3), 689; https://doi.org/10.3390/sym15030689
Submission received: 7 February 2023 / Revised: 22 February 2023 / Accepted: 6 March 2023 / Published: 9 March 2023

Abstract

:
When acoustic elements such as quarter-wave, Helmholtz, labyrinthine-type or hook-type resonators are arranged sequentially, sound waves can be refracted in a specific frequency range. Thus, a metasurface may be designed to reduce noise by locating two sequentially arranged acoustic elements symmetrically. Phase delay, which can be calculated with a transfer function of the acoustic element, needs to be obtained to decide on acoustic element design parameters. However, in the case of a complex structure with labyrinthine-type or hook-type resonators, it can be difficult to calculate the phase delay accurately because each designer may have a different estimation method for the propagation direction of the sound wave. Therefore, this study presents a method for accurately deriving the phase delay required when designing a metasurface with a complex structure. The phase delay was calculated using the pressure and velocity derived from FEM and the transfer matrix of the main duct. Using the proposed method, a metasurface with symmetrically arranged acoustic elements was designed, and the noise reduction effect was confirmed through a speaker test. This study could be very helpful, since through it, any kinds of complex acoustic elements are able to be designed with accurate phase delay calculations.

1. Introduction

Reactive types, such as quarter-wave resonators and Helmholtz resonators, are commonly used to reduce noise by fitting ducts. Various studies have been conducted on methods for reducing noise using reactive-type ducts. Wang et al. [1] developed ventilation windows using quarter-wave resonators and membranes, and Field et al. [2] confirmed the noise reduction effect by installing quarter-wave resonators in ventilation openings. Selamet and his colleagues developed a variety of Helmholtz resonator models that were dual [3], leakage-proof [4], and aligned in parallel [5]. They confirmed the effect of specific cavity dimensions of the Helmholtz resonator [6] and confirmed the effect of the extended neck of the Helmholtz resonator [7]. In addition, they analyzed the acoustic performance of a Helmholtz resonator through mathematical [8], FEM, and experimental methods [5,9]. Cai et al. [10] developed a Helmholtz resonator to fully utilize the available space, and Griffin et al. [11] developed a system of coupled Helmholtz resonators. Kim and his colleagues developed a variety of a Helmholtz resonator models: dual [12], continuous [13], and leakage-proof and aligned in parallel [14]. Another method is using ducts to reduce noise involves using absorbing materials. Sound absorbing materials are mainly used to reduce high frequencies; occasionally, sound absorbing materials and resonators are used together [15,16].
Recently, many methods for reducing noise using metamaterials have been developed. Noise reduction methods using metamaterials can be classified into two types: those using negative effective properties and phase delay, respectively. A method of reducing noise by creating negative effective physical properties can be designed to have one or more physical properties, such as a negative bulk modulus or a negative effective density. Liu et al. [17] designed metamaterials with negative effective mass densities. Fang et al. [18] fabricated metamaterials with negative elastic moduli. Lee et al. [19] used metamaterials with negative effective mass densities and negative bulk moduli. As a noise reduction method using a phase delay, there is a metasurface, which is a method of reducing noise by refracting the traveling direction of sound waves by continuously arranging unit cells having a specific structure. The structure of the metasurface can be designed to be a quarter-wave [20,21], a Helmholtz [22,23], a labyrinthine-type [24,25], or a hook-type [26,27] resonator.
A phase delay must be determined to design metasurfaces that refract the direction of the travel of sound waves to reduce noise. For quarter-wave resonators, a metasurface model defines the phase delay according to length. Studies designing metasurfaces as quarter-wave resonators have derived phase delays using mathematical models [28], but in some cases, the details of the phase delays have not been specified [20]. In addition, for complex structures such as labyrinthine and hook-type resonators, detailed information on the phase delay is not provided [29], or the phase delay is calculated by estimating the propagation direction of the sound wave, which can be ambiguous. Ghaffarivardavagh et al. [30] estimated the transmission path of sound in the diagonal direction by equating the labyrinthine structure to that of a quarter-wave or horn-type resonator. The method for estimating the propagation direction of the sound wave may struggle to accurately calculate the phase delay because each designer may have a different definition of the sound paths.
It is necessary to determine the sound pressure transfer matrix to obtain the phase delay of each acoustic element. In most cases, the acoustic characteristics of the acoustic element can be identified only when the anechoic characteristics are expressed on the downstream side [31,32,33]. To overcome this shortcoming, various methods, such as impulse input methods [34] and two-load and two-source methods [35,36,37], can be used to determine the acoustic properties. However, the acoustic properties derived by these methods also include the acoustic properties of the entire duct associated with acoustic elements. Therefore, to obtain an acoustic transfer matrix at a specific location, the acoustic properties of the duct must be eliminated. The duct transfer matrix is derived based on the 1D wave Equation to determine the acoustic pressure and velocity of a typical duct [8,38].
Therefore, this study presents a method for accurately deriving the phase delay required when designing a metasurface with a complex structure. The phase delay was calculated using the pressure and velocity derived from FEM and the transfer matrix of the main duct. This method can accurately derive the phase delay compared to the method of estimating the propagation direction of the sound wave. The accuracy of the method proposed in this paper was confirmed through the phase delay graph according to the length of the quarter-wave resonator derived by the mathematical method. In addition, the labyrinthine-type resonator metasurface, which is a complex structure, was designed by the method proposed in this study. Through the speaker test, the noise reduction effect of the silencer with a metasurface was confirmed.

2. Theory

2.1. Acoustic Metasurface Design

A metasurface was designed by adjusting the interval between the acoustic elements and the length of the acoustic element to refract the sound wave propagation direction of the target frequency. In other words, the factors for designing metasurfaces are acoustic element spacing and length. The acoustic element interval can be obtained using the generalized Snell’s law, and the acoustic elements lengths can be obtained using the phase delay.

2.1.1. Generalized Snell’s Law

First, the acoustic element spacing was obtained using the generalized Snell’s law. The generalized Snell’s law is
s i n θ r = s i n θ i + λ 2 π × d d x .
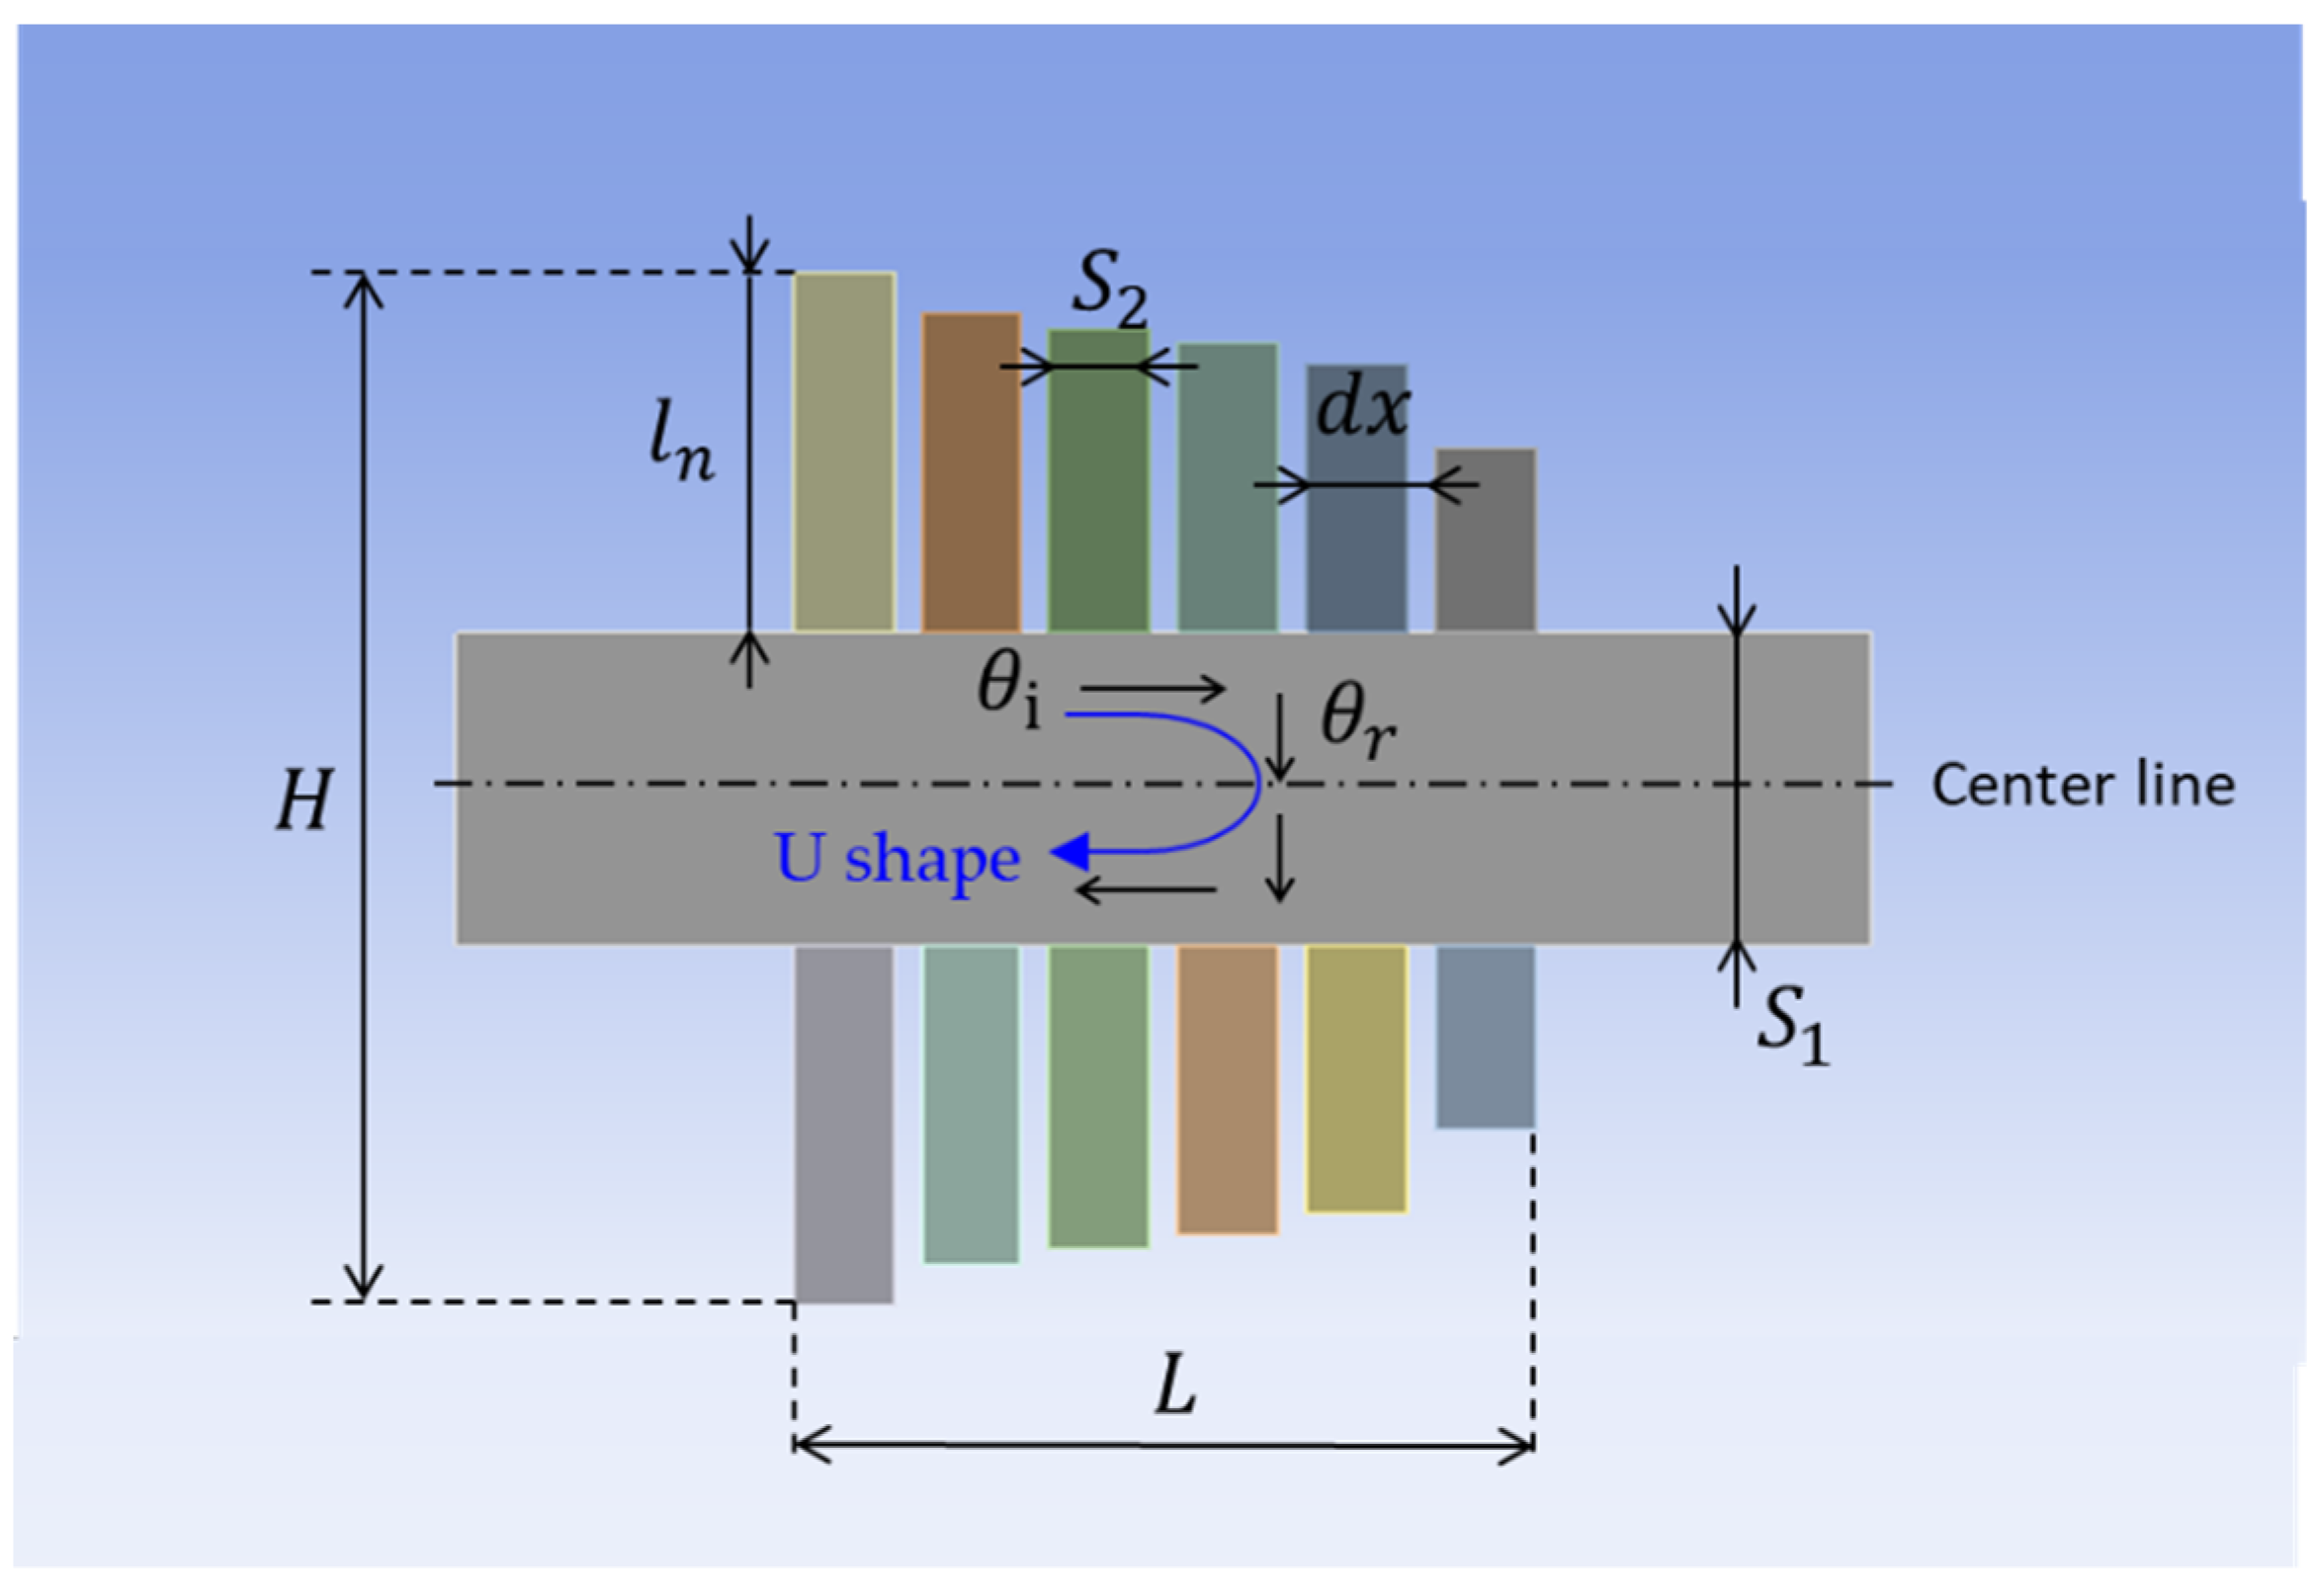
where θ i is the incidence angle, θ r is the angle of reflection, λ is the wavelength of the target frequency, d x is the acoustic element interval, and d the phase delay interval. The acoustic element spacing can be derived by setting the incidence angle, angle of reflection, wavelength length, and phase delay spacing using the generalized Snell’s law. The incident and reflection angles were set to ensure that the sound wave propagation direction of the target frequency was refracted. The wavelength of the target frequency can be obtained using λ = c / f . Here, c is the sound velocity, which is 343   m / s because the sound propagation medium is air. The phase delay interval is determined by the number of acoustic elements. A detailed explanation is provided in Section 2.1.2. Figure 1 is a schematic diagram of a metasurface to describe the parameters of the generalized Snell’s law. When the incident angle, reflection angle, and target frequency are selected as −120°, −30°, and 1500 Hz, respectively, the spacing of the acoustic elements can be derived as 52.06 mm using the generalized Snell’s law, as shown in Equation (1).

2.1.2. Phase Delay Derivation Using a Transfer Matrix

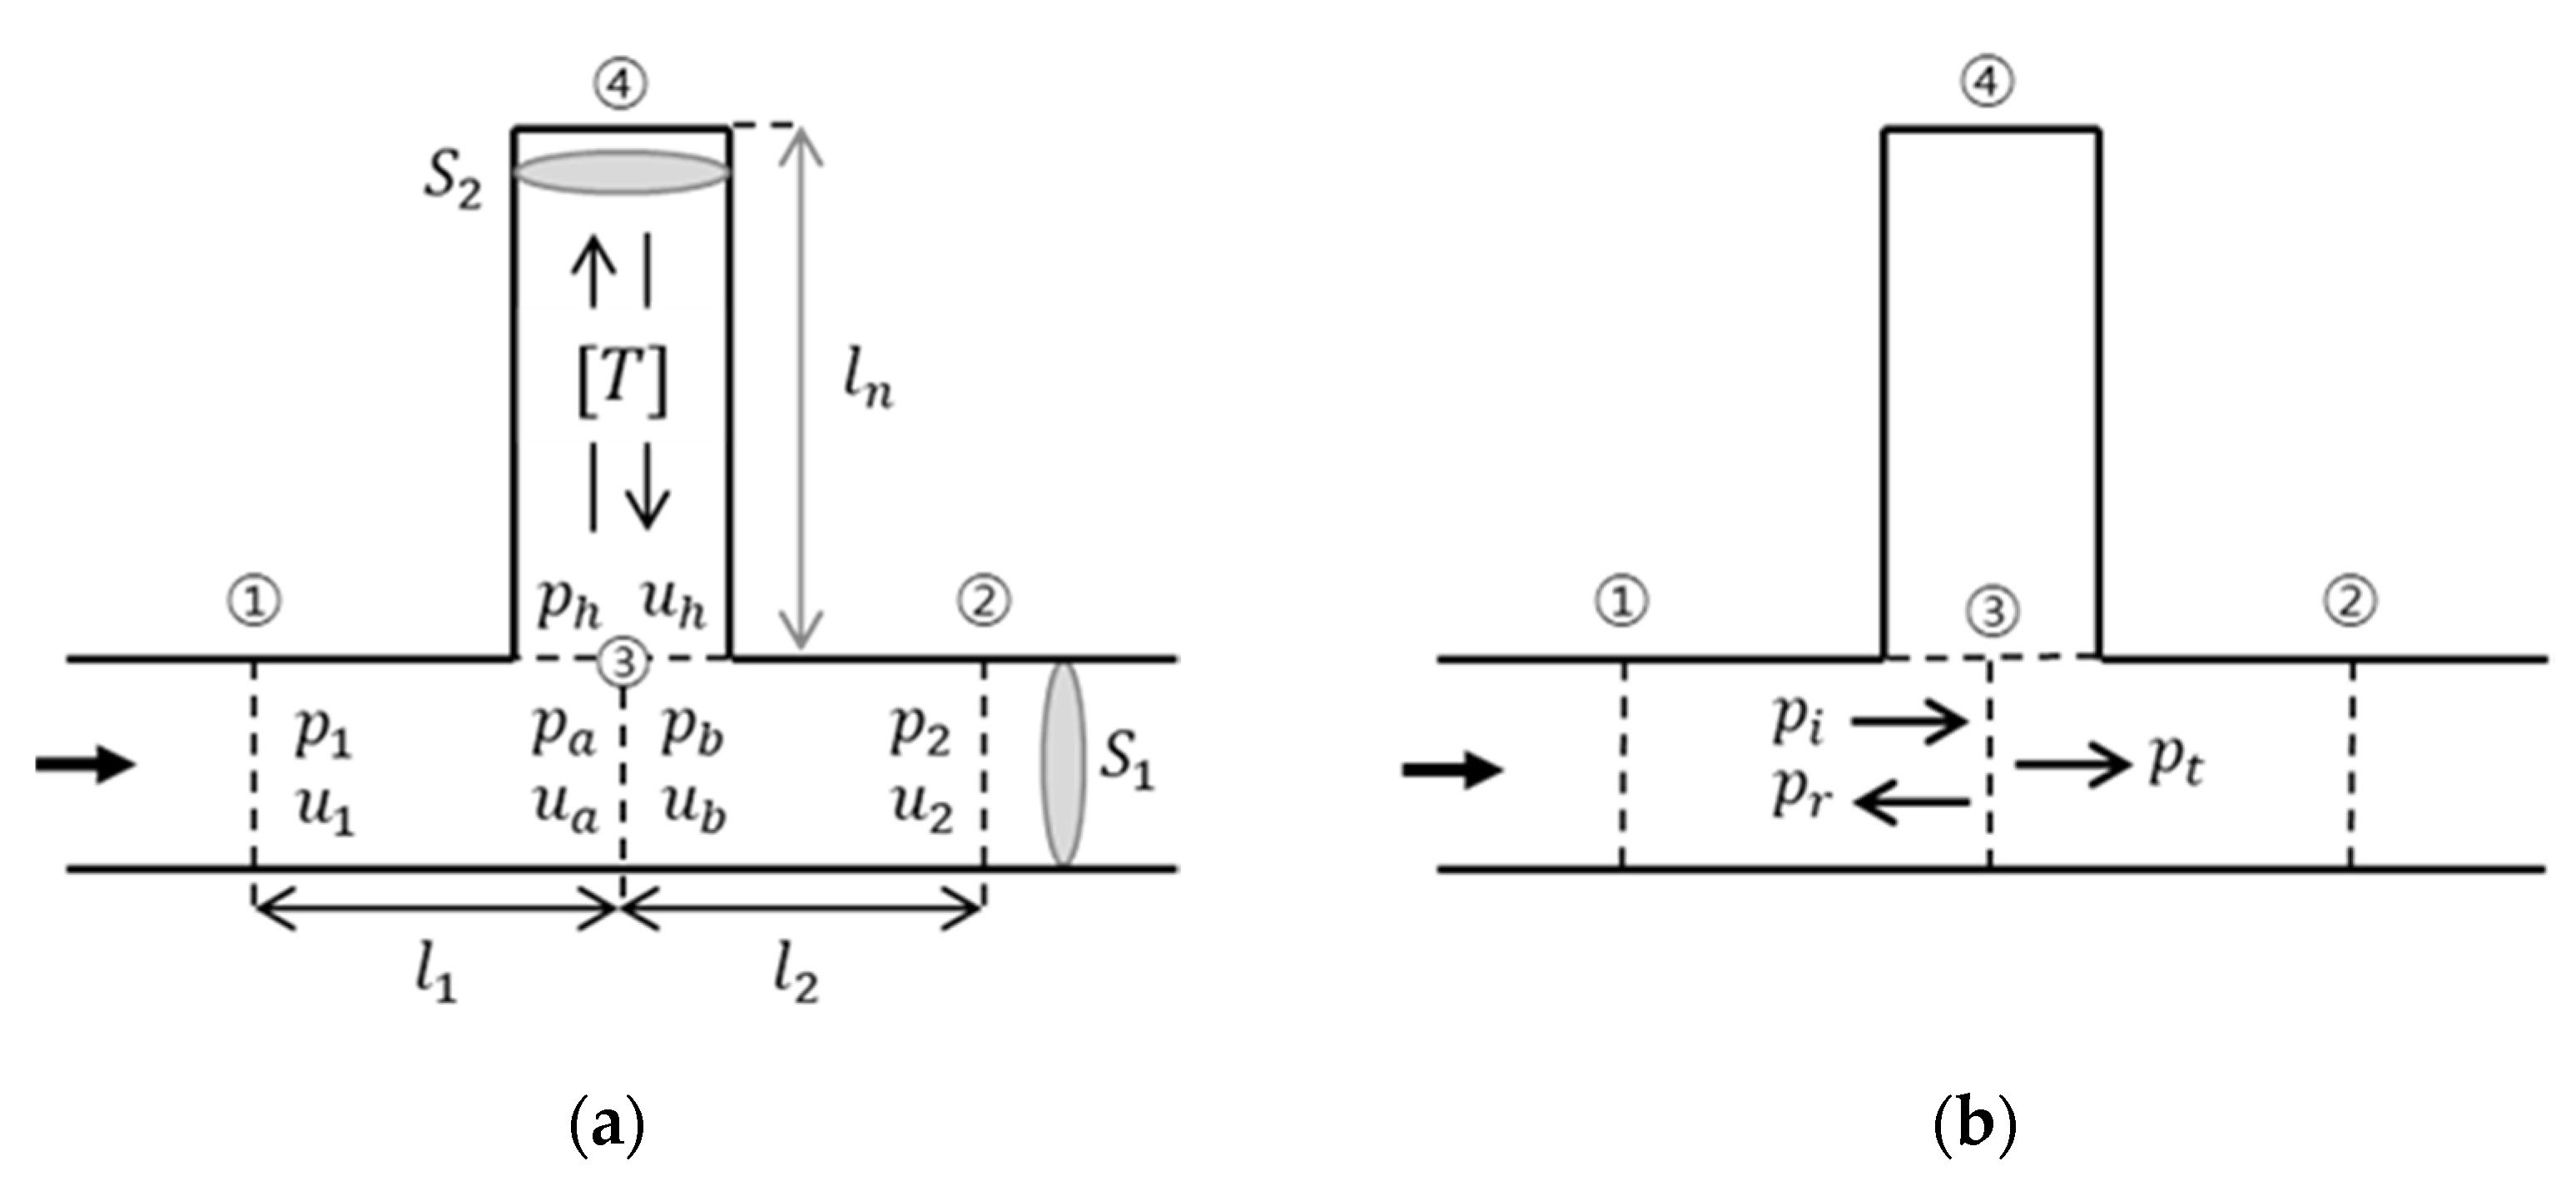
The transfer matrix of the acoustic element is used to derive the phase delay required to obtain the length of the acoustic element. Figure 2 shows a schematic of the acoustic element, and Figure 2a shows the acoustic pressure and particle velocity by location. p 1 and u 1 are the acoustic pressure and particle velocity at location ①, respectively; p 2 and u 2 are the acoustic pressure and particle velocity at location ②, respectively. Junction ③ indicates the control volume that equalizes the sound pressure on the upstream, downstream, and acoustic element sides. p a and u a are the acoustic pressure and particle velocity on the upstream side at junction ③, respectively; and p b and u b are the acoustic pressure and particle velocity on the downstream side at junction ③, respectively. p h and u h are the acoustic pressure and particle velocity of the entrance at junction ③ of the acoustic element, respectively. l 1 is the length from locations ① to ③, and l 2 is the length from locations ② to ③. S 1 is the cross-sectional area of the main duct, S 2 is the cross-sectional area of the acoustic element, [ T ] is the transfer matrix of the acoustic element, and l n is the length of the acoustic element. In Figure 2b, p i , p r , and p t are the incident, refresh, and transmitted pressures, respectively, at the entrance of the acoustic element.
To calculate the phase delay, it is first necessary to determine the transfer matrix of the acoustic element. The transfer matrix of the acoustic element can be expressed as
[ T ] = [ T 11 T 12 T 21 T 22 ]
where T i j are the matrix components at the i t h row and j t h column. To derive the transfer matrix of the acoustic element, it is necessary to know the relationship between the main duct and the acoustic element. The relationship among p a , u a , p b , and u b on the upstream and downstream sides at junction ③ and p i , p r , and p t   of the entrance part of the acoustic element can be expressed as
p a = p i + p r
u a = p i p r ρ c
p b = p t
u b = p t ρ c .
M a is a transfer matrix representation from location ① to the upstream side at junction ③ and M b is a transfer matrix representation from location ③ to the upstream side at junction ②. These transfer matrices can be obtained using the pressure and sound velocity of two points derived from Euler’s equations, and details of the derivation can be found in Munjal’s book [38], which is widely utilized in duct acoustics. M a and M b can be expressed as follows:
[ M a ] = [ c o s ( k l 1 ) i ρ 0 c 0 s i n ( k l 1 ) i 1 ρ 0 c 0 s i n ( k l 1 ) c o s ( k l 1 ) ]
[ M b ] = [ c o s ( k l 2 ) i ρ 0 c 0 s i n ( k l 2 ) i 1 ρ 0 c 0 s i n ( k l 2 ) c o s ( k l 2 ) ]
where k is the wavenumber, ρ 0 is the density of the sound propagation medium, and c 0 is the velocity of the sound propagation medium. Using these equations, the distances from location ① to the upstream side at junction ③ and from the upstream side at junction ③ to location ② are derived as follows:
{ p 1 u 1 } = [ c o s ( k l 1 ) i ρ 0 c 0 s i n ( k l 1 ) i 1 ρ 0 c 0 s i n ( k l 1 ) c o s ( k l 1 ) ] { p a u a }
{ p b u b } = [ c o s ( k l 2 ) i ρ 0 c 0 s i n ( k l 2 ) i 1 ρ 0 c 0 s i n ( k l 2 ) c o s ( k l 2 ) ] { p 2 u 2 } .
The relational expressions of p a and u a and p b and u b of the upstream and downstream sides of junction ③ are derived as follows:
{ p a u a } = [ T 11 T 12 T 21 T 22 ] { p b u b } .
Using Equations (9)–(11), the area from location ① to location ② is expressed as a transfer matrix, as shown in
{ p 1 u 1 } = [ cos ( k l 1 ) i ρ 0 c 0 sin ( k l 1 ) i 1 ρ 0 c 0 sin ( k l 1 ) cos ( k l 1 ) ] [ T 11 T 12 T 21 T 22 ] [ cos ( k l 2 ) i ρ 0 c 0 sin ( k l 2 ) i 1 ρ 0 c 0 sin ( k l 2 ) cos ( k l 2 ) ] { p 2 u 2 } .
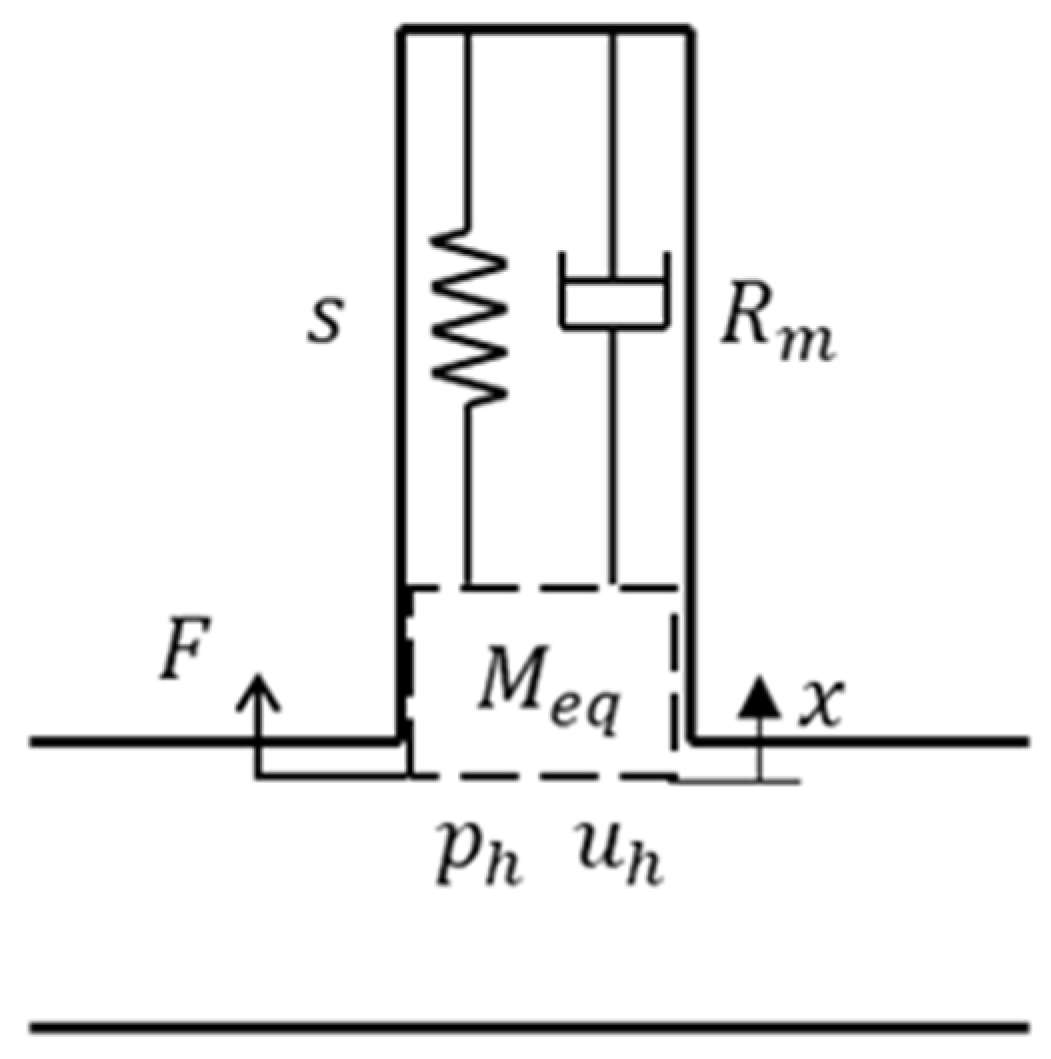
Solving for [T] requires knowing the acoustic impedance, and solving for acoustic impedance requires knowing the inlet equation of motion and the mechanical impedance of the acoustic element. Figure 3 shows a lumped model of the acoustic element, where M e q is the effective mass, s is the stiffness, R m is the mechanical resistance, F is the external force acting on the acoustic element entrance, and x is the displacement of the mass. Newton’s second law applied to the acoustic element in Figure 3, for a lumped parameter model including the damping effect, results in
F = M e q d 2 x d t 2 + R m d x d t + s x
where t is time. The mechanical impedance ( Z m ) and the acoustic impedance ( Z h ) can be derived from the equation of motion described in Equation (3). The mechanical impedance can be derived by dividing force by velocity, and the acoustic impedance by dividing pressure by volume velocity [8]. The mechanical and acoustic impedances can be expressed as:
Z m = F u h = S 2 p h u h = R m + i ω M e q + s i ω
Z h = Z m S 2 2 = p h S 2 u h = R a c + i ω L a c + 1 i ω C a c
where ω is the angular frequency. As mentioned earlier, junction ③ indicates a control volume in which the acoustic pressures on the upstream, downstream, and acoustic element sides are equal. Therefore, the acoustic pressures and the particle velocity at the inlet of the acoustic element can be expressed as
p a = p b = p h
S 1 u a = S 2 u h + S 1 u b .
Rearranging Equation (11) using Equations (15)–(17) gives:
{ p a u a } = [ T 11 T 12 T 21 T 22 ] { p b u b } = [ 1 0 1 S 1 Z h 1 ] { p b u b } .
The detailed procedure to obtain Equation (18) is shown in Appendix A for the convenience of readers. From this Equation, T 11 = 1 , T 12 = 0 , T 21 = 1 / S 1 Z h , and T 22 = 1 . Substituting Equation (18) into Equation (12) yields
{ p 1 u 1 } = [ cos ( k l 1 ) i ρ 0 c 0 sin ( k l 1 ) i 1 ρ 0 c 0 sin ( k l 1 ) cos ( k l 1 ) ] [ 1 0 1 S 1 Z h 1 ] [ cos ( k l 2 ) i ρ 0 c 0 sin ( k l 2 ) i 1 ρ 0 c 0 sin ( k l 2 ) cos ( k l 2 ) ] { p 2 u 2 } .
Expressing the acoustic pressure and particle velocity on the upstream side at junction ③ ( p a , p b ) using Equations (5), (6) and (11) is derived as follows (refer to Appendix B for details):
p a = T 11 p t + T 12 ( p t ρ c )
u a = T 21 p t + T 22 ( p t ρ c ) .
When represented by the transmission coefficient of acoustic pressure ( t p ) using Equations (3), (4), (20) and (21), it is as follows (refer to Appendix B for details):
t p = p t p i = 2 T 11 + 1 ρ c T 12 + ρ c T 21 + T 22 = α + β i .
Here, α is the real value of the acoustic pressure transmittance, and β is the imaginary value of the acoustic pressure transmittance. The phase delay is expressed as follows:
p h a s e   d e l a y = t a n 1   β α .
From each metasurface, the phase delay as a function of acoustic element length is determined and derived into a phase delay graph as a function of acoustic element length. The length of the acoustic element entrance must be selected for each phase delay interval ( d ) to cover the entire phase delay graph from π/2 to π/2.

2.2. Phase Delay Derivation Method

2.2.1. Method for Deriving Phase Delay in Case of a Quarter-Wave Resonator

Using the acoustic impedance of the quarter-wave resonator, the transfer matrix of the quarter-wave resonator can be derived [39]. The transfer matrix of a quarter-wave resonator can be expressed as:
[ T ] = [ T 11 T 12 T 21 T 22 ] = [ 1 0 i m ρ c t a n k l n 1 ]
where l n is the effective length of the quarter-wave resonator and m can be derived as m = S 2 / S 1 . By taking the components of the matrix of Equation (24), which is the transmission matrix of the quarter-wave resonator, in Equation (22), which is the acoustic pressure transmission coefficient, the transfer function is:
t p = p t p i = 2 S 1 i   c o t ( k l n ) 2 S 1   i   c o t ( k l n ) + S 2 = α + β i .
Substitute the real and imaginary values of the acoustic pressure transmission coefficient according to the length of the quarter-wave resonator into Equation (23). When deriving the phase delay graph as a function of the quarter-wave resonator length, an acoustic element length must be chosen for each phase delay interval ( d ) to cover the entire range from π/2 to π/2.

2.2.2. Method for Deriving Phase Delay Using a Transfer Matrix

A method for deriving the phase delay is needed to design a metasurface with a structure that is difficult to predict mathematically. The method of deriving the phase delay presented in this study uses the pressure and velocity derived from the finite element method (FEM) and the transfer matrix of the main duct. In Equation (12), the acoustic pressure and particle velocity ( p 1 , u 1 ) at location ① and acoustic pressure and particle velocity ( p 2 , u 2 ) at location ② are derived using FEM. Then, the variable in Equation (12) is the transfer matrix ( [ T ] ) of the acoustic element; if the acoustic impedance ( Z h ) is obtained in Equation (18), the transfer matrix of the acoustic element can be derived. Here, the transfer matrix ( [ T ] ) of the acoustic element is substituted into Equation (22), which is the transmission rate of the acoustic pressure. The real and imaging values of the acoustic pressure transmission coefficient are obtained by substituting the acoustic pressure transmission coefficient into the phase delay equation: Equation (23). A phase delay graph according to the lengths of the acoustic element is derived, and the length of the acoustic element for each phase delay interval ( d ) is selected to cover the entire range from π/2 to π/2.

2.3. Description of the Speaker Test Setup

Figure 4a shows a schematic of the speaker test setup. Noise measurements were performed using a noise measurement device, Squadriga. The speaker and amplifier were tested using MARSHALL SOUND’s K-8010WS and AEPEL’s MSA-200U, respectively. A PCB 378B02 microphone model was positioned 500 mm away from the center of the outlet along a line inclined at 45°. The duct connecting the speaker and the silencer was made of acrylonitrile butadiene styrene (ABS) using 3D printing. In addition, a duct was made to ensure that the silencer and straight pipe could be exchanged to confirm the effect of the metamaterial. Noise measurements were performed in an anechoic room, as shown in Figure 4b, and speaker tests were conducted with and without metamaterials to confirm the noise reduction effect. All speaker tests were verified for repeatability by repeating the evaluation three times. The speaker output source used white noise, which has a nearly constant frequency spectrum over a wide frequency range. The measurement sample rate was 51.2 kHz, and the measurement time was 5 s.

3. Results and Discussion

3.1. Comparison of Theoretical and FEM Methods for the Quarter-Wave Resonator

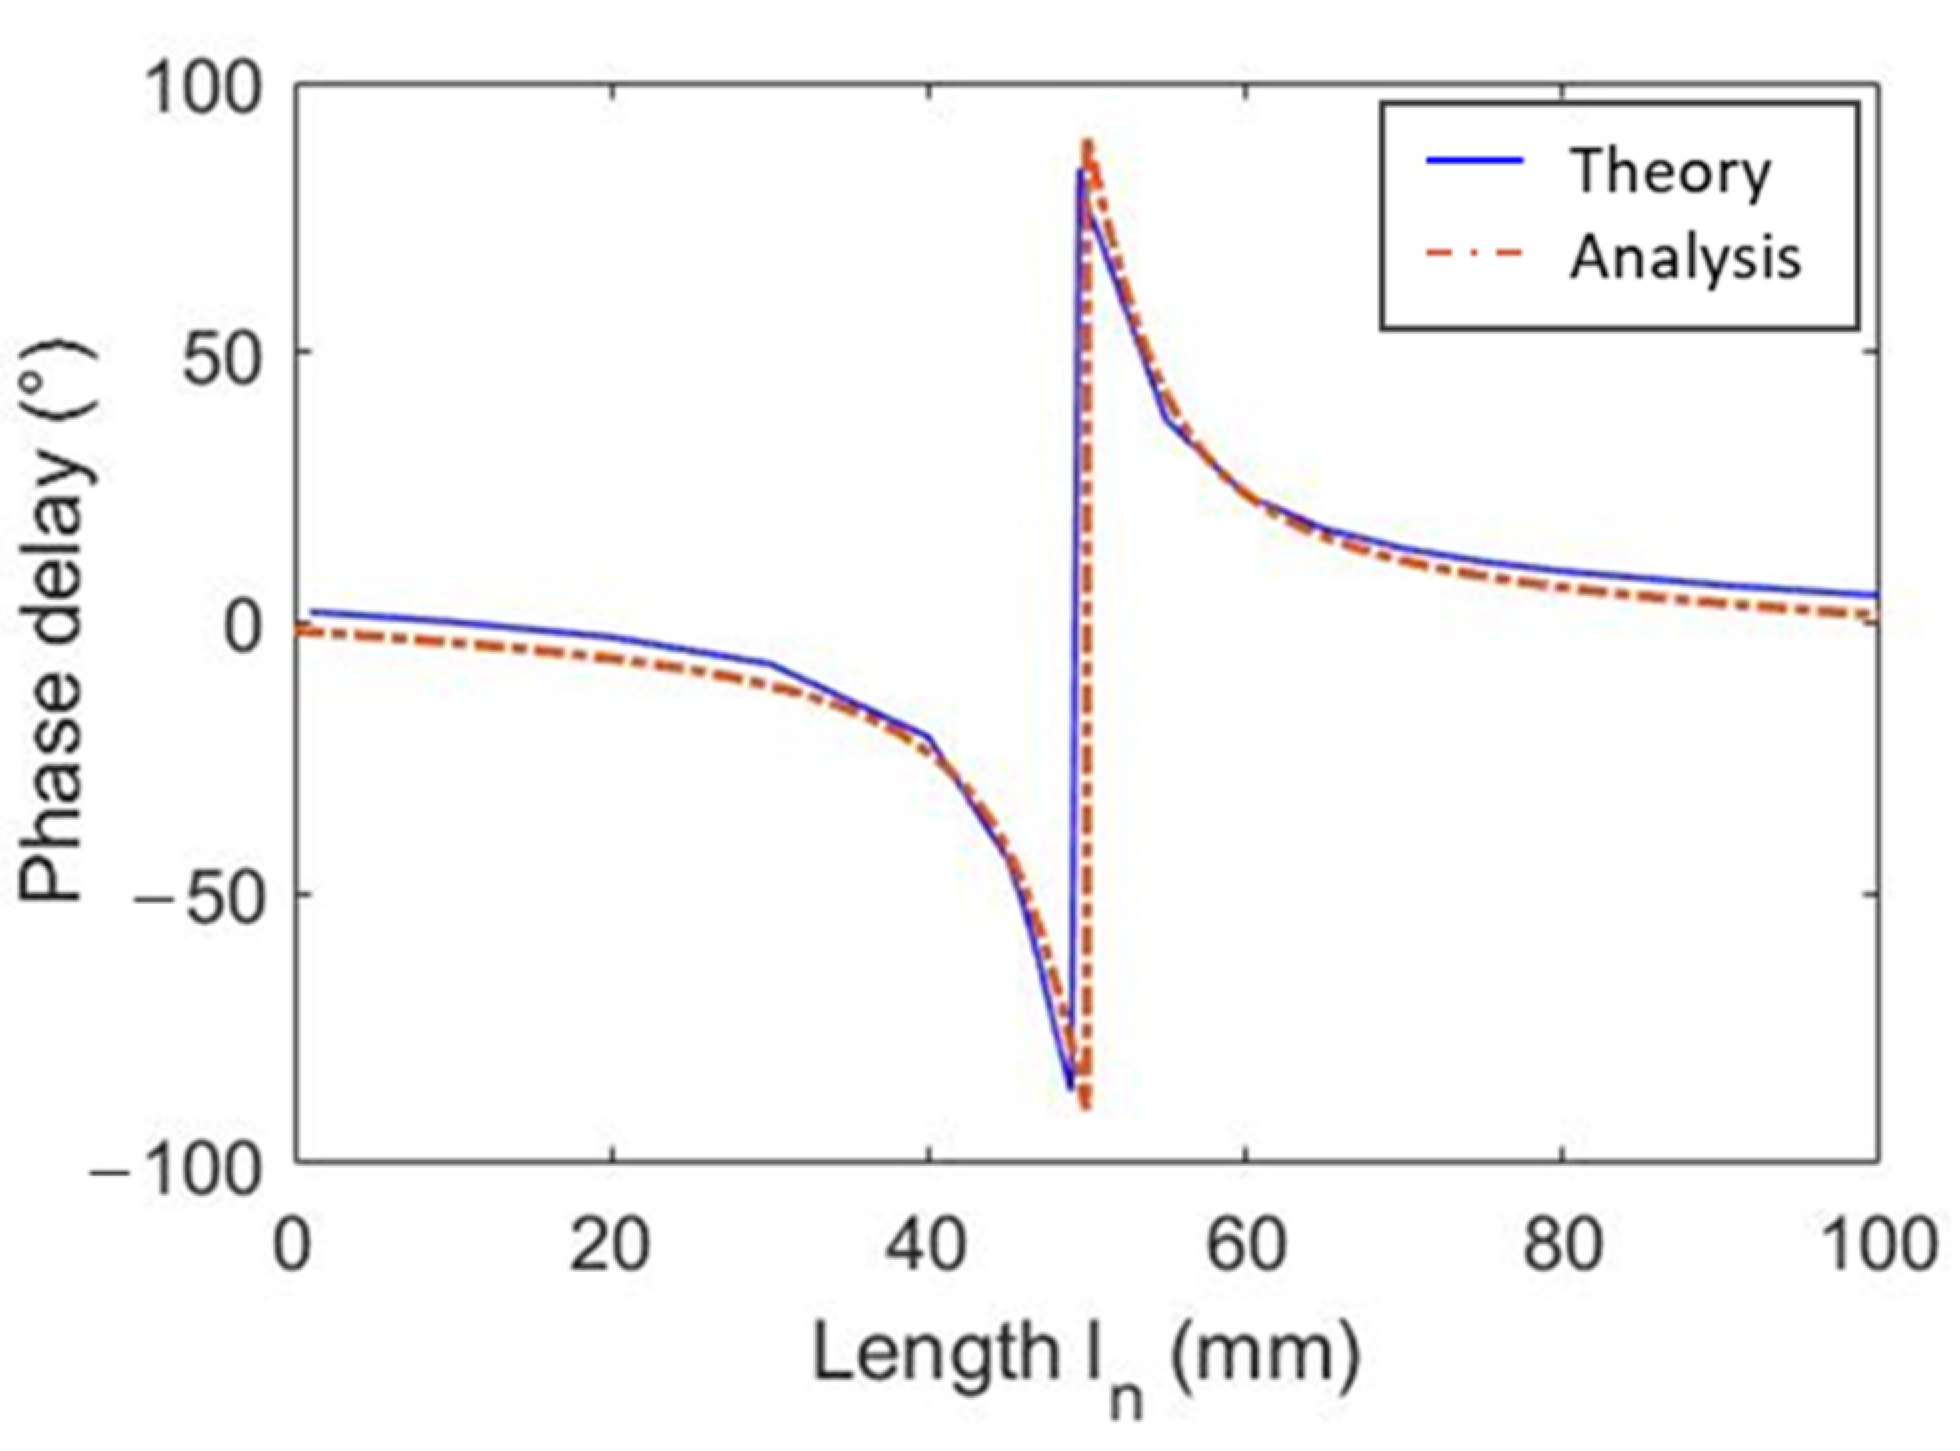
As explained in Section 2.2, there are theoretical and FEM methods for deriving the phase delay graph of a quarter-wave resonator. To design the geodesic tube metasurface, the target frequency ( f ) was set to 1500 Hz, the main duct cross-sectional area ( S 1 ) was 60 mm × 90 mm, and the quarter-wave resonator’s cross-sectional area ( S 2 ) was set to 15 mm × 90 mm. By substituting these parameters into Equation (22), the acoustic pressure transmission coefficient was derived, and the real and imaginary values of the acoustic pressure transmission coefficient that depend on the length of the quarter-wave resonator were substituted into Equation (14). The substituted results were used to derive the phase delay graph as a function of the length of the quarter-wave resonator. When deriving the phase delay graph using FEM, the target frequency, the main duct’s cross-sectional area, and quarter-wave resonator’s cross-sectional area are used in the same manner as the values used in the theoretical formula. FEM is used to determine the acoustic pressure and particle velocity derived from locations ① and ②. The lengths from locations ① to ③ and from locations ② to ③ were set to 100 mm. By substituting the design variable into Equation (23), the sound pressure transfer rate was derived to derive a phase delay graph according to the length of the quarter-wave resonator. The derivation of each phase delay graph was the same as that shown in Figure 5. In Figure 5, it is confirmed that the theoretical phase delay graph and the phase delay graph derived using the FEM are similar, thereby confirming that the method of deriving the phase delay graph using FEM can be used when designing acoustic metamaterials with morphologies that are difficult to predict with precision other than quarter-wave resonators.

3.2. Silencer Design with Quarter-Wave Resonator Metasurface

Figure 6 is a silencer with a quarter-wave resonator metasurface. The silencer using the metasurface was designed so that the direction of the sound wave at a specific frequency would be refracted in a U shape by arranging the metasurface at the top and bottom of the main duct. First, to derive the acoustic element spacing using the generalized Snell’s law, the incidence angle, angle of reflection, wavelength length, and phase delay spacing must be set. As shown in Figure 6, the angle of incidence and angle of reflection were set so that the sound wave propagation direction of the target frequency would be refracted in a U shape. The upper metasurface was designed to have an incidence angle of −90° and a refraction angle of 0° so that sound waves passing through the upper metasurface would be refracted to the lower metasurface. The lower metasurface was designed to return sound waves to the entrance of the duct, and the incident angle of this metasurface was 0°, and the reflection angle was 90°. This lower metasurface can be designed as a top-down symmetrical structure based on the center line of the upper metasurface. When the incident and the reflection angle of the upper and lower parts are substituted into the generalized Snell’s law described in Section 2.1, the acoustic element intervals are the same. Due to the angles of incidence and reflection of the upper and lower metasurfaces being set in this way, a U shaped refraction phenomenon may occur in the propagation direction of the sound wave at the target frequency at the part where the metasurface is mounted. As the wavelength of the target frequency is λ = c / f , it can be determined by selecting the target frequency. The target frequency was set to 1500 Hz. The phase delay interval was set to 30°, and the details are detailed in the next paragraph. To achieve U shaped refraction at the target frequency, the spacing of the acoustic elements was set to 19.05 mm using the angle of incidence, angle of reflection, wavelength length, and phase delay interval. Table 1 lists the design dimensions derived using generalized Snell’s law.
In the phase delay graph derived in Section 3.1, the length of the acoustic element must be selected for each phase delay interval. The number of acoustic elements was set to six, which were placed at 30° intervals to ensure that the phase delay covered the entire range from π/2 to π/2. Table 2 shows the length of the quarter-wave resonator for each phase delay interval in the phase delay graph. Therefore, the quarter-wave resonator metasurface silencer in Figure 6 was designed using the acoustic element spacing derived from the generalized Snell’s law and the acoustic element length derived from the phase delay graph. The volume ( L × H × W ) of the quarter-wave resonator metasurface silencer shown in Figure 6 is 198 mm × 110 mm × 90 mm. Here, L is the maximum distance from the first to the sixth acoustic element, H is the maximum distance of the upper and lower metasurfaces, and W is the width of the silencer.

3.3. Acoustic Analysis of a Silencer with a Quarter-Wave Resonator Metasurface

Figure 7 shows the transmission loss graph obtained using ANSYS Acoustics, acoustic analysis software, to confirm the reduction effect of the designed quarter-wave resonator metamaterial. In the transmission loss graph, the frequency domain was defined as the noise reduction domain when the transmission loss was 5 dB or more. Through the transmission loss graph, it was confirmed that the silencer reduces the frequency range by about 1180 to 2570 Hz. In addition, it can be confirmed that the noise is most reduced around the target frequency, reducing by approximately 70 dB at 1680 Hz. The transmission loss result confirms that a wide area is reduced around the target frequency because the resonant frequency range of the six acoustic elements constitutes the quarter-wave resonator metamaterial.
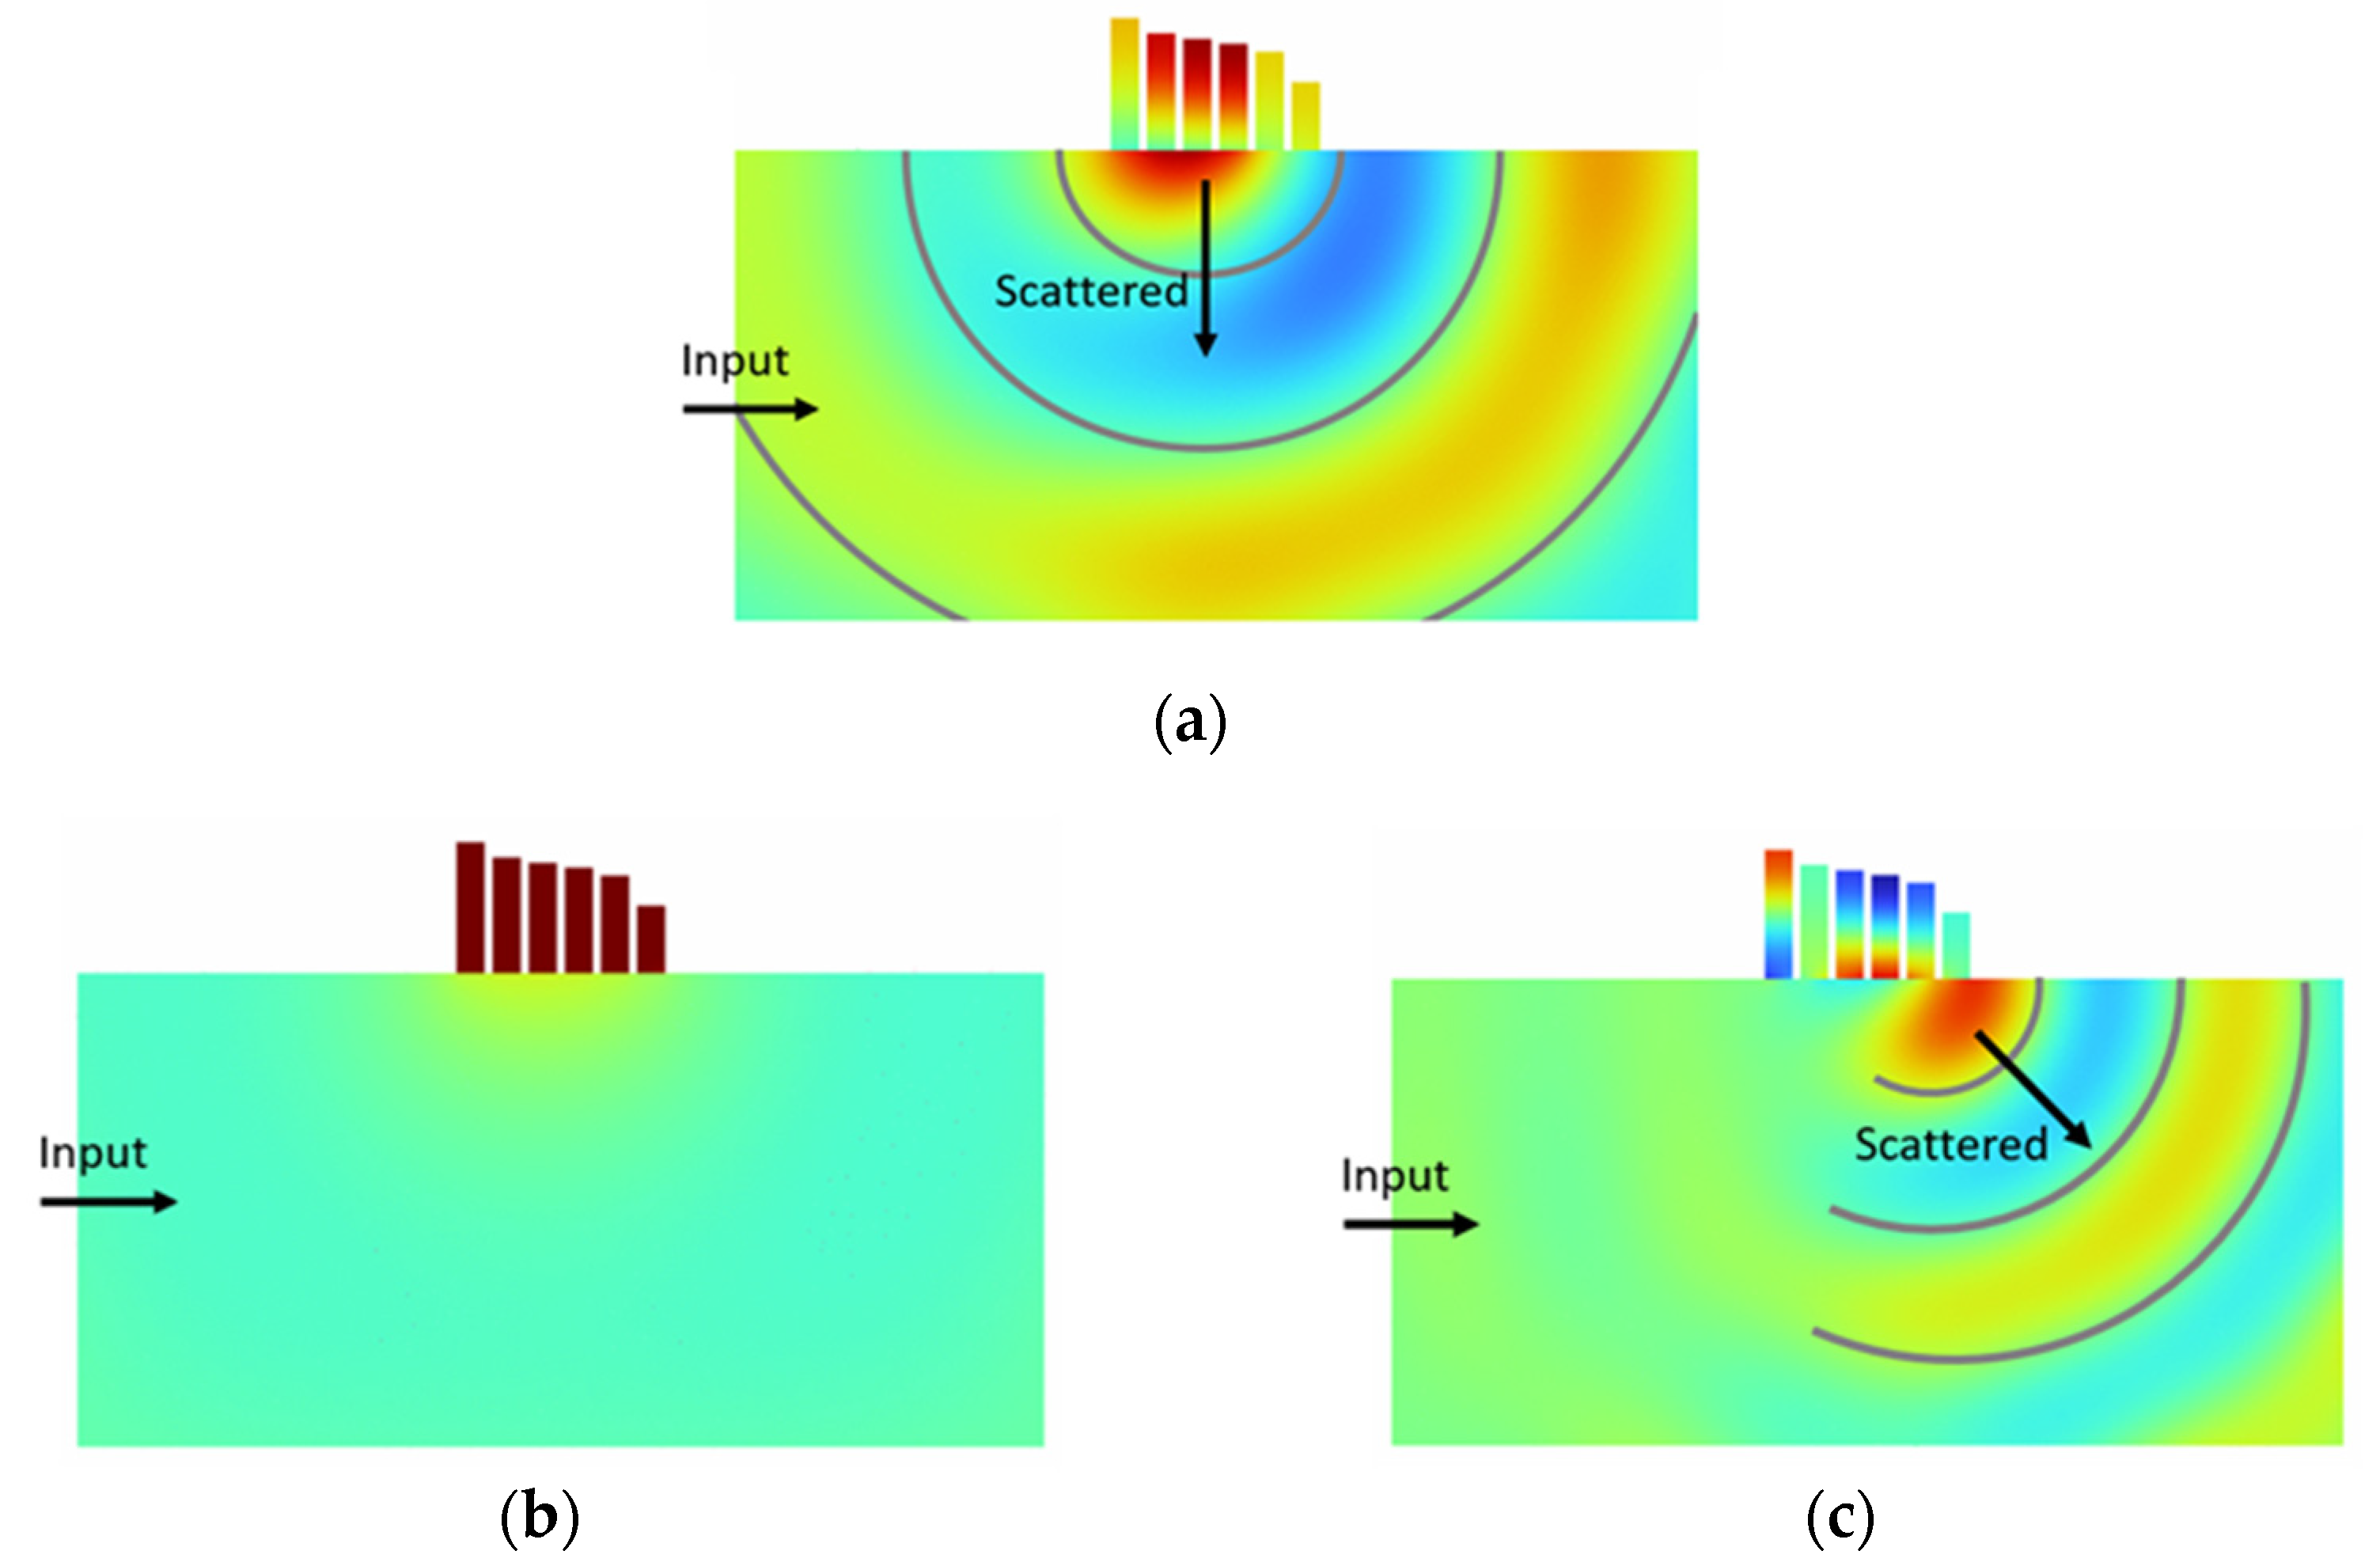
To confirm the refractive effect of the quarter-wave resonator metasurface, the scattered acoustic pressure was derived using the acoustic analysis software COMSOL. The silencer equipped with the quarter-wave resonator metasurface had a symmetrical structure with the upper and lower metasurfaces. Therefore, the scattered acoustic pressure of only the upper metasurface was analyzed. Figure 8a shows the scattered acoustic pressure at the target frequency of 1500 Hz, as expected, and it can be confirmed that the sound wave entering −90° was refracted to 0° due to the upper metasurface at the target frequency. Figure 8b shows the scattering acoustic pressure at 500 Hz, confirming that no scattering field was observed. In the case of 500 Hz, if the incident angle, wavelength length, phase delay distance, and acoustic element spacing are substituted into the generalized Snell’s law, the sine value of the reflection angle exceeds one, so no solution of the reflection angle can exist. As shown in Figure 8c, in the case of 2500 Hz, if the incident angle, wavelength length, phase delay interval, and acoustic element interval are substituted into the generalized Snell’s law, it can be calculated that the reflection angle is −23.6°.

3.4. Speaker Test of a Silencer with a Quarter-Wave Resonator Metasurface

The silencer, which confirmed the metasurface effect through acoustic analysis, was produced by 3D printing and made of ABS. Referring to Section 2.3, a speaker test of a silencer with a quarter-wave resonator metasurface was performed. Figure 9 is the speaker test results to confirm the reduction effect of the silencer with quarter-wave resonator metasurface. Figure 9a shows the case of installing a straight pipe, and Figure 9b shows the case of installing a silencer. Here, the straight pipe means the case where the silencer is not installed. Figure 9c is a SPL (sound pressure level) graph, and to check the noise reduction effect, compare the noise level before and after the silencer was installed. Through Figure 9, it was confirmed that the noise reduction region of the silencer with a quarter-wave resonator metasurface was between 1130 and 2320 Hz, and the maximum reduction was about 30 dB.

3.5. Silencer Design with the Labyrinthine-Type Resonator Metasurface

Figure 10a shows a model of the structure of the acoustic element of the metasurface. This structure is that of a labyrinthine-type resonator and can be designed to have overall height lower than that of a quarter-wave resonator at the same target frequency, which is advantageous for installation space limitations. The metasurface can be designed using the phase delay derivation method presented in this study. In Figure 10a, S 2 is the cross-sectional area of the labyrinthine-type resonator, h is the wall thickness, and l n is the length of the acoustic element. The labyrinthine-type resonator’s cross-section ( S 2 ) was set to 3 mm × 90 mm, and the wall thickness was set to 1 mm. It was originally designed to cover a heating and ventilation system’s main duct. The design variables for the labyrinthine-type resonator metasurface were the acoustic element interval ( d x ) and the acoustic element length ( l n ). The method for deriving the acoustic element spacing using the generalized Snell’s law is the same as that for the quarter-wave resonator metasurface. The intervals of the incidence angle, angle of reflection, target frequency, and phase delay were the same as those of the quarter-wave resonator metasurface, and the acoustic element interval was 19.05 mm.
The phase delay was derived by the method described in Section 2.2. The design parameters except for the cross-sectional area of the labyrinthine-type resonator were the same as those of the metasurface of the quarter-wave resonator. At locations ① and ② shown in Figure 2, the acoustic pressure and particle velocity can be derived using FEM. Using the acoustic pressure and particle velocity of Equations (18) and (19), locations ① and ②, the acoustic pressure transfer coefficient of Equation (22) can be derived. By substituting the real and imaginary values of Equation (22) according to the length of the acoustic element into Equation (23), the phase delay graph shown in Figure 10b can be obtained. By deriving the acoustic pressure of the transmittance shown in Equation (23), the phase delay graph as a function of the labyrinthine length (ln) can be obtained, as shown in Figure 10b. In order to cover the phase delay from −π/2 to π/2, the number of acoustic elements is determined according to the phase delay interval. For example, the number of acoustic elements is six if the phase delay interval is set to 30°. Table 3 shows the lengths of the six acoustic elements obtained from the phase delay graph.
Figure 10c shows a silencer with a labyrinthine-type resonator metasurface designed using the acoustic element spacing derived from the generalized Snell’s law and the acoustic element length derived from the phase delay graph. Through this, it can be confirmed that the upper and lower metasurfaces were designed to have a symmetrical structure. The volume ( L × H × W ) of the labyrinthine-type resonator silencer shown in Figure 10c is 108 mm × 98 mm × 90 mm. Here, L is the maximum distance from the first acoustic element to the sixth acoustic element,   H is the distance between the upper and lower metasurfaces, and W is the width of the silencer. The height of the labyrinthine-type resonator metasurface was 19 mm, and the maximum height of the quarter-wave resonator metasurface was 62.5 mm, confirming that the height difference between the two cases was about three-fold.

3.6. Acoustic Analysis and Speaker Test of the Silencer with the Labyrinthine-Type Resonator Metasurface

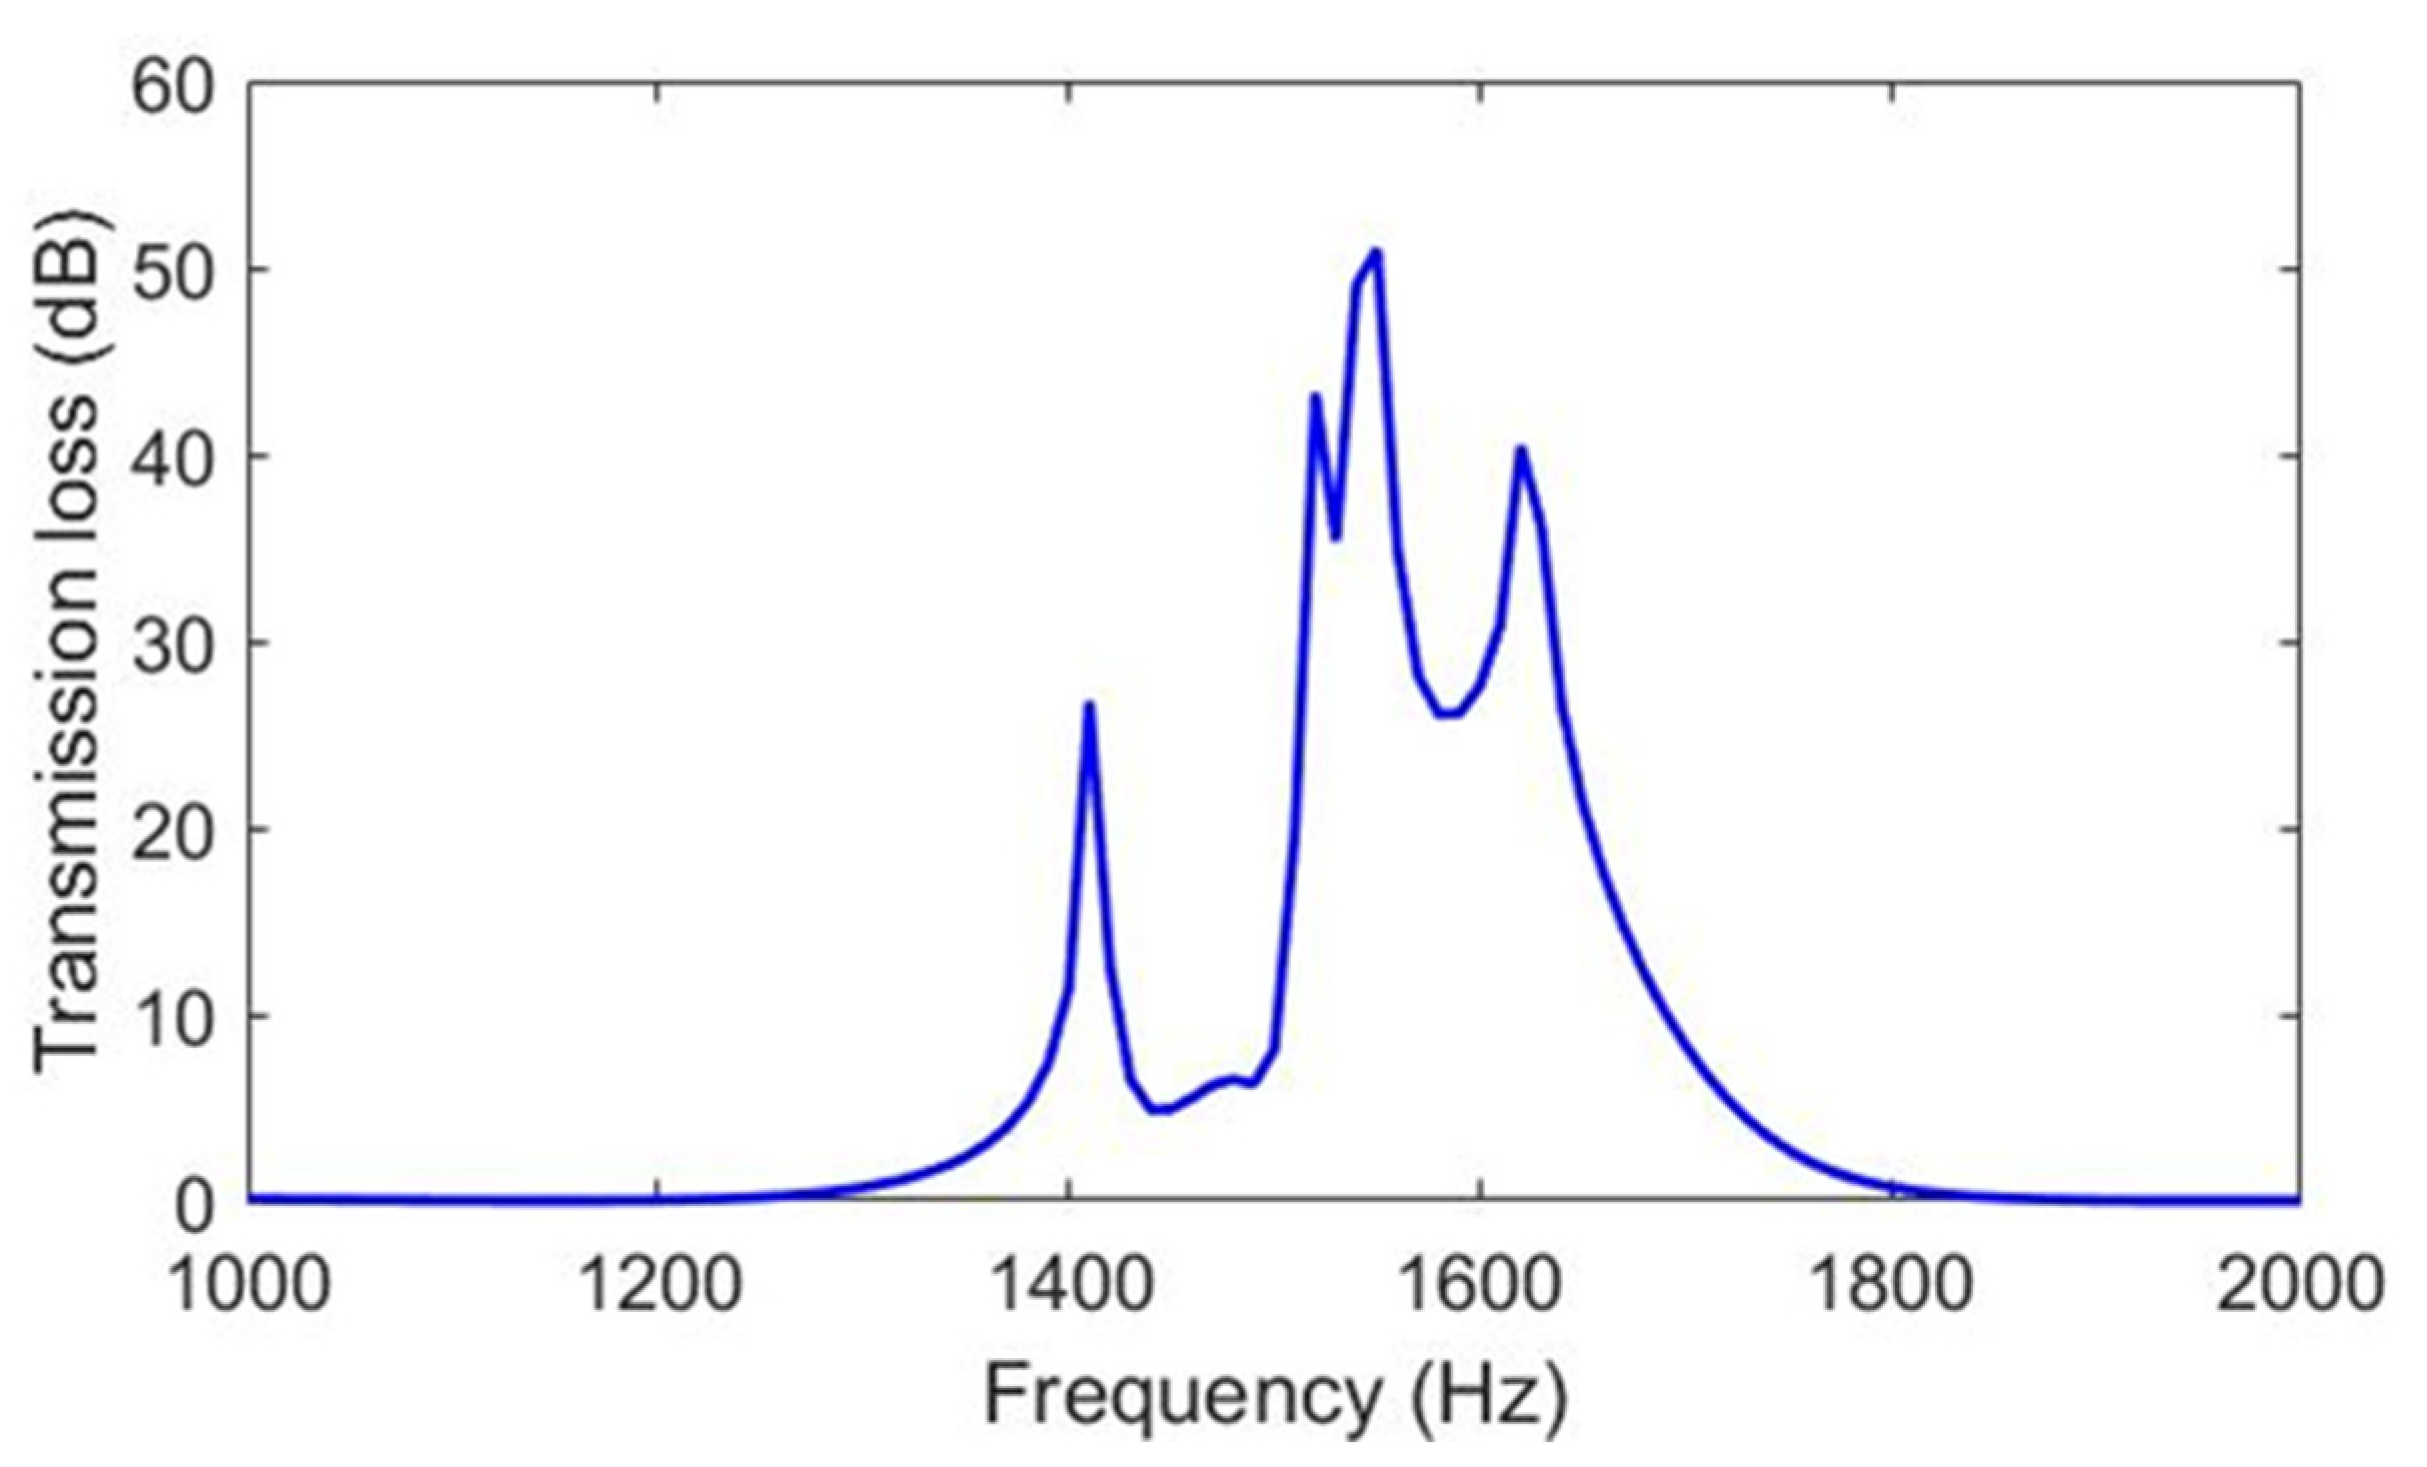
Figure 11 is a transmission loss graph to verify the noise reduction effect of the silencer with the labyrinthine-type resonator metasurface designed using ANSYS Acoustic, acoustic analysis software. In the transmission loss graph, the frequency domain was defined as the noise reduction domain when the transmission loss was 5 dB or more. Through Figure 11, it was confirmed that the reduction frequency range of the silencer was approximately 1380 to 1720 Hz, and it was confirmed that approximately 50 dB was reduced at 1550 Hz.
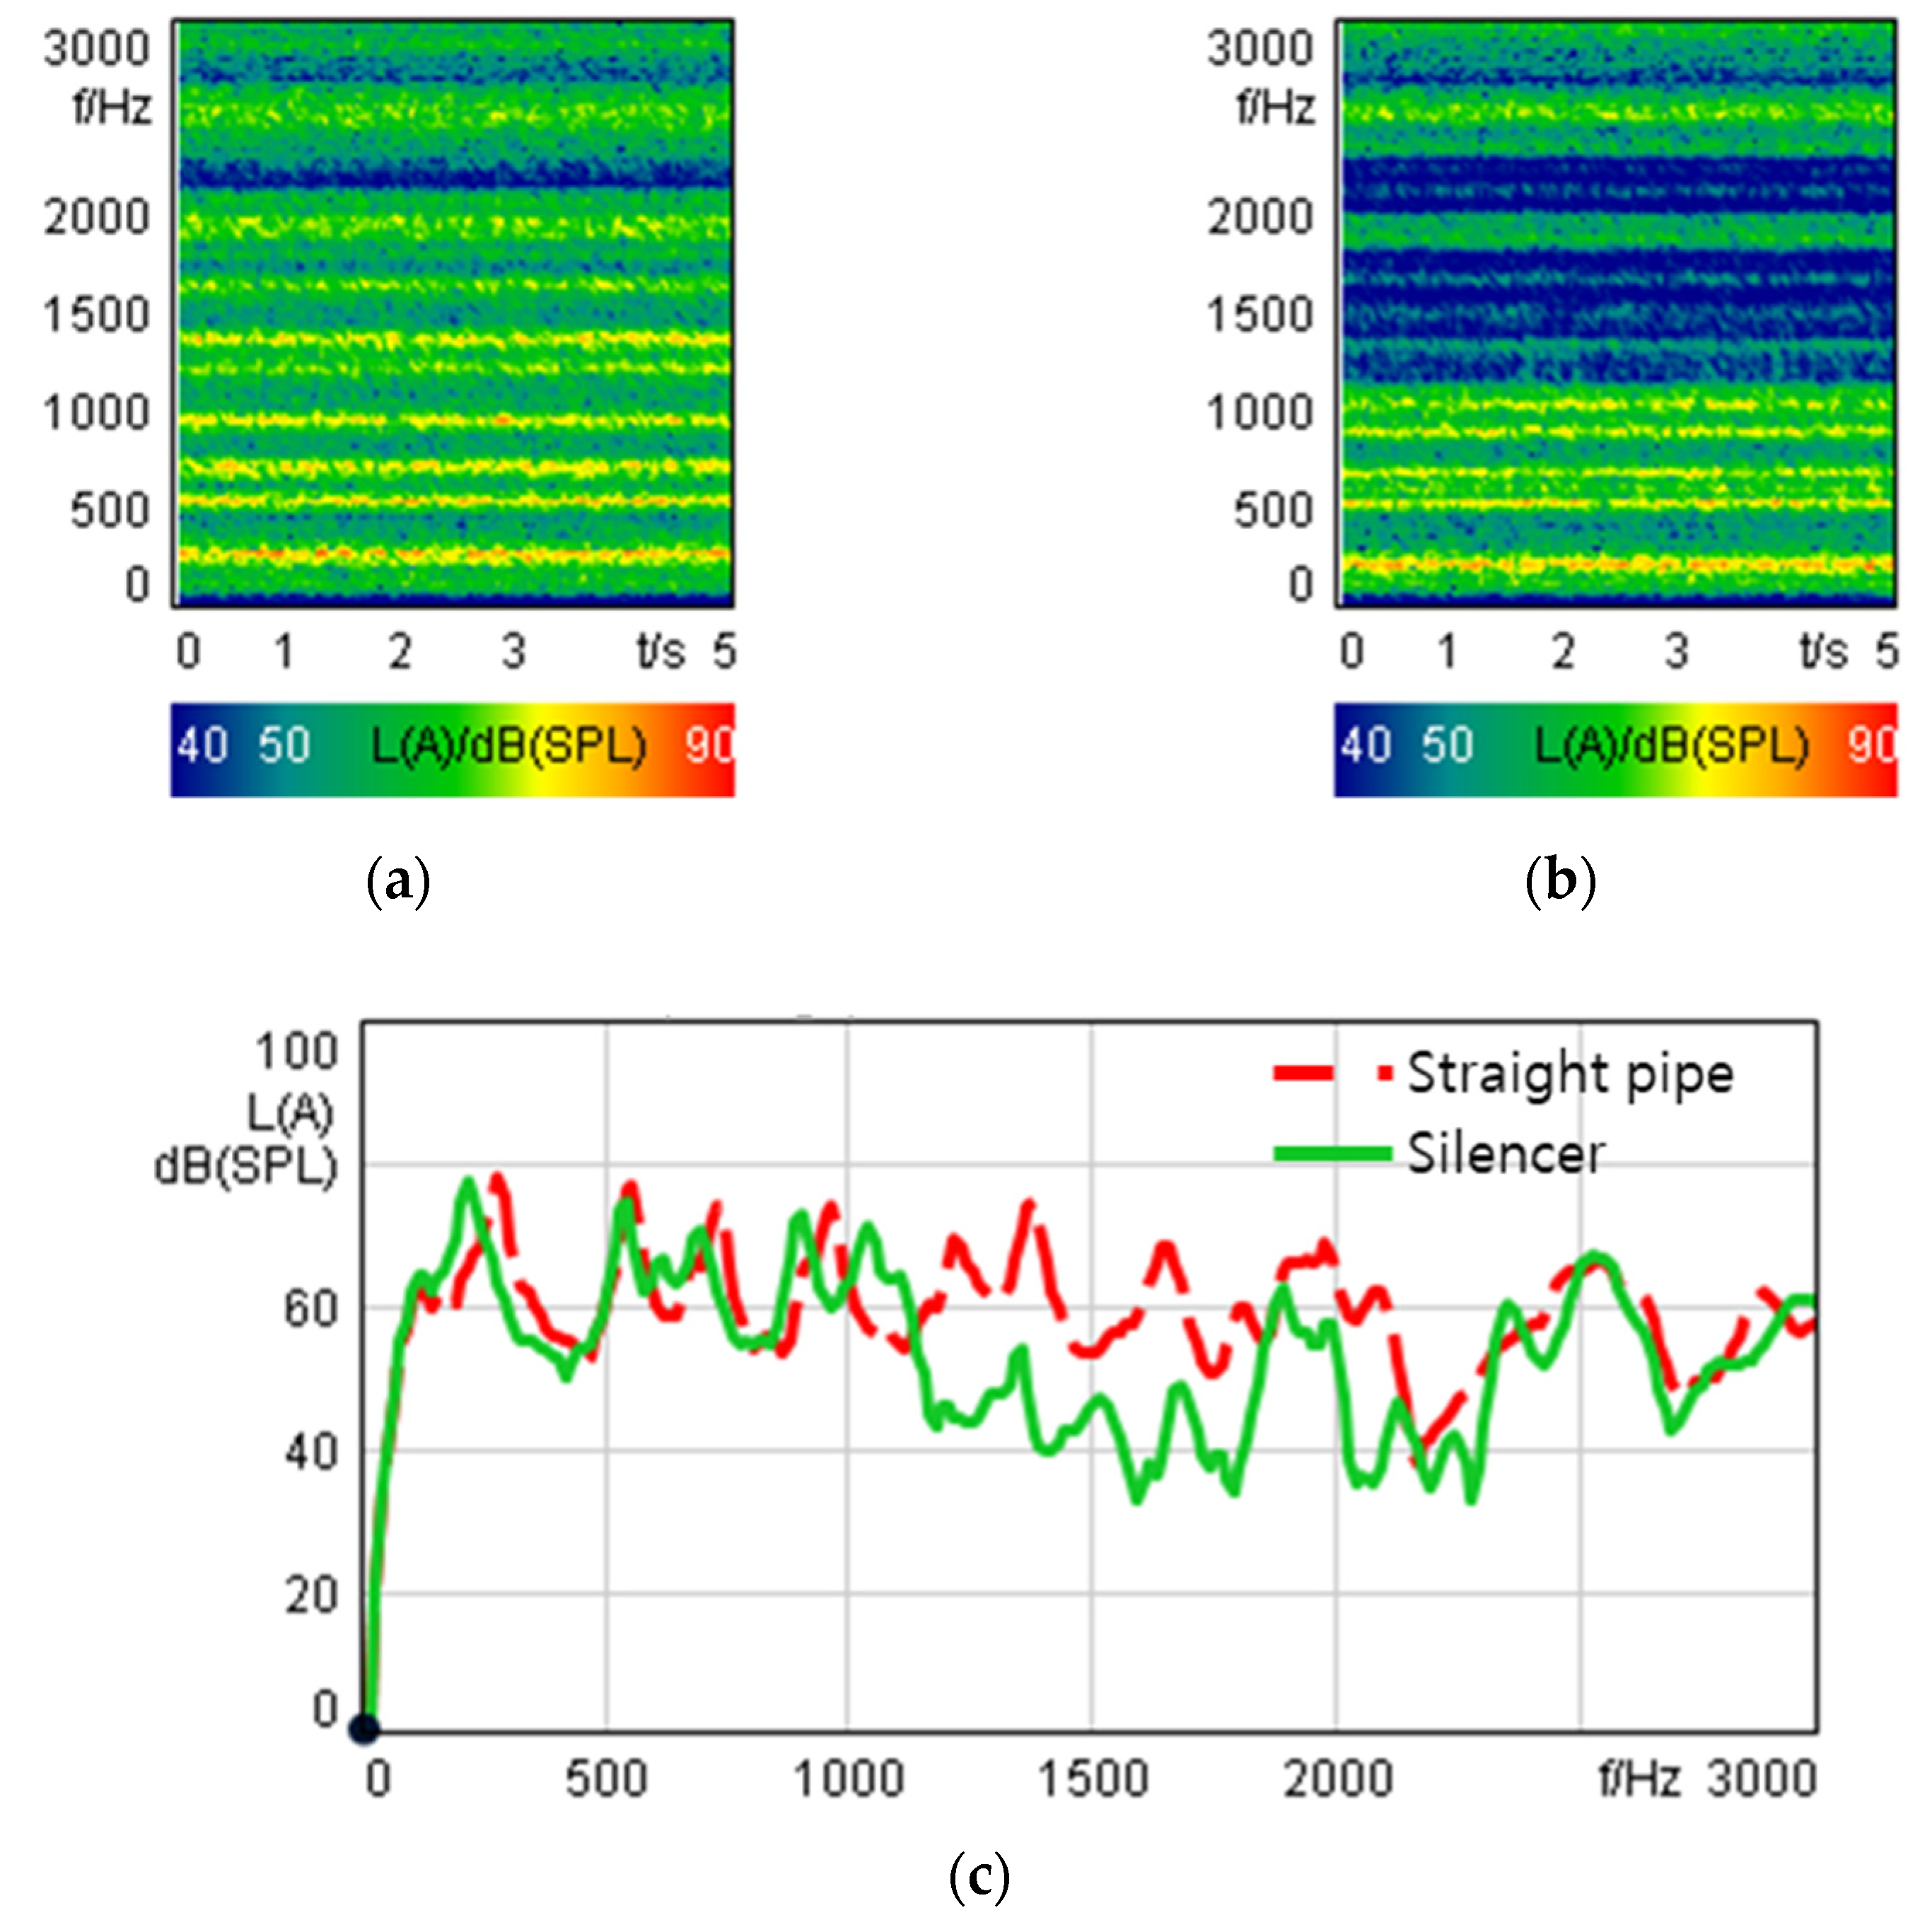
The silencer was produced by 3D printing and made of ABS, and the speaker test was performed by referring to Section 2.3. Figure 12 is the result of the silencer speaker test, Figure 12a shows the case of installing a straight pipe, and Figure 12b shows the case of installing a silencer. Here, the straight pipe means the case where the silencer was not installed. Figure 12a,b are the color maps, where red indicates a higher noise level and blue a lower one. Figure 12c is an SPL graph, and compares the noise level before and after installing the silencer to check the noise reduction effect. The noise reduction region of the silencer with the labyrinthine-type resonator metasurface is from 1430 to 1800 Hz, and it is confirmed that 30 dB was reduced at 1670 Hz.

4. Conclusions

A metasurface adjusts the direction of sound waves by arranging acoustic elements in succession. It is possible to design a silencer that reduces noise by symmetrically arranging two sequentially arranged metasurfaces. In order to design such a metasurface, it is necessary to obtain a phase delay that can be calculated as a transfer function of an acoustic element. However, in the case of a complex structure, it may be difficult to accurately calculate the phase delay because each designer may have a different method for estimating the propagation direction of sound waves. Therefore, this study presents a method to obtain accurate phase delay regardless of the structure of the acoustic element.
  • In order to design a metasurface with a complex structure, a method for accurately deriving the phase delay is presented. This method uses the pressure and velocity derived from the FEM and the transfer matrix of the main duct. Using the proposed method, a metasurface with acoustic elements arranged symmetrically was designed.
  • The phase delay of the quarter-wave resonator metasurface, which can be derived mathematically, was derived by the method presented in this study. Through comparison of the phase delay graph derived by the proposed method and the mathematical method, it was confirmed that they matched. Through this, it was found that the method presented in this study is accurate.
  • To design a metasurface with a labyrinthine-type resonator, the method proposed in this study was used. The effect of the silencer composed of this metasurface was confirmed through acoustic analysis. In addition, the noise reduction effect was confirmed through a speaker test.

Author Contributions

Investigation, Y.K. and S.L.; project administration, H.K.; software, Y.K.; writing—review and editing, H.K. All authors have read and agreed to the published version of the manuscript.

Funding

1. This research was supported by Hyundai Motor’s industry academic research project. 2. This research was supported by the MSIT (Ministry of Science and ICT), Korea, under the Grand Information Technology Research Center support program (IITP-2023-2020-0-01791) supervised by the IITP (Institute for Information & communications Technology Planning & Evaluation).

Institutional Review Board Statement

Not applicable.

Informed Consent Statement

Not applicable.

Data Availability Statement

Not applicable.

Conflicts of Interest

The authors declare no conflict of interest.

Appendix A. The Acoustic-Element Transfer Matrix

In the case of Figure 2, the relational expressions of p a , u a and p b , u b of the upstream and downstream sides of junction ③ are derived as follows:
{ p a u a } = [ T 11 T 12 T 21 T 22 ] { p b u b }
Solving Equation (A1) leads to
p a = T 11 p b + T 12 u b
u a = T 21 p b + T 22 u b .
The acoustic impedance ( Z h ) can be expressed as follows:
Z h = p h S 2 u h .
If Equation (A4) is rearranged into an equation for u h , it is as follows:
u h = p h S 2 Z h .
The acoustic pressure and particle velocity at the inlet of the acoustic element can be expressed as:
p a = p b = p h
S 1 u a = S 2 u h + S 1 u b .
By rearranging Equation (A7) into an equation for u a , the following is found:
u a = S 2 u h + S 1 u b S 1 = S 2 S 1 u h + u b .
Since p a = p b in Equation (A6), it can be seen that T 11 = 1 and T 12 = 0 in Equation (A2). Substituting Equations (A5) and (A6) into Equation (A8) gives:
u a = 1 S 1 Z h p h + u b = 1 S 1 Z b p h + u b .
When Equations (A3) and (A9) are combined, it can be seen that T 21 = 1 / S 1 Z h , and T 22 = 1 in Equation (A3). Therefore, Equation (A1) can be expressed as:
{ p a u a } = [ 1 0 1 S 1 Z h 1 ] { p b u b } .

Appendix B. The Acoustic Pressure Transmission Ratio

In the case of Figure 2, the relationship among p a , u a , p b , and u b on the upstream and downstream sides at junction ③ and p i , p r , and p t   of the entrance part of the acoustic element can be expressed as:
p a = p i + p r
u a = p i p r ρ c  
p b = p t
u b = p t ρ c .
The relational expressions of p a and u a and p b and u b of the upstream and downstream sides of junction ③ are derived as follows:
{ p a u a } = [ T 11 T 12 T 21 T 22 ] { p b u b }
Solving Equation (A15) leads to
p a = T 11 p b + T 12 u b
u a = T 21 p b + T 22 u b .
Substituting Equations (A13) and (A14) into Equations (A16) and (A17) gives:
p a = T 11 p t + T 12 ( p t ρ c )
u a = T 21 p t + T 22 ( p t ρ c ) .
By substituting Equations (A11) and (A12) into Equations (A16) and (A17), the following can be derived:
p i + p r = T 11 p t + T 12 ( p t ρ c )
p i p r ρ c = T 21 p t + T 22 ( p t ρ c ) .
Expressing Equation (A21) in p i p r form leads to the following:
p i p r = ρ c T 21 p t + T 22 p t .
Combining Equations (A20) and (A22) gives:
2 p i = ( T 11 + 1 ρ c T 12 + ρ c T 21 + T 22 ) p t .
Equation (A23) is expressed as a pressure transfer coefficient of negative pressure as follows:
t p = p t p i = 2 T 11 + 1 ρ c T 12 + ρ c T 21 + T 22 .

References

  1. Wang, Z.H.; Hui, C.K.; Ng, C.F. The Acoustic Performance of Ventilated Window with Quarter-Wave Resonators and Membrane Absorber. Appl. Acoust. 2014, 78, 1–6. [Google Scholar] [CrossRef]
  2. Field, C.D.; Fricke, F.R. Theory and Applications of Quarter-Wave Resonators: A Prelude to Their Use for Attenuating Noise Entering Buildings through Ventilation Openings. Appl. Acoust. 1998, 53, 117–132. [Google Scholar] [CrossRef]
  3. Xu, M.B.; Selamet, A.; Kim, H. Dual Helmholtz Resonator. Appl. Acoust. 2010, 71, 822–829. [Google Scholar] [CrossRef]
  4. Selamet, A.; Kim, H.; Huff, N.T. Leakage Effect in Helmholtz Resonators. J. Acoust. Soc. Am. 2009, 126, 1142–1150. [Google Scholar] [CrossRef] [PubMed] [Green Version]
  5. Selamet, E.; Selamet, A.; Iqbal, A.; Kim, H. Acoustics of a Helmholtz Resonator Aligned Parallel with Flow: A Computational Study VS. Experiments. Int. J. Mater. Mech. Manuf. 2013, 1, 210–213. [Google Scholar] [CrossRef] [Green Version]
  6. Selamet, A.; Radavich, P.M.; Dickey, N.S.; Novak, J.M. Circular Concentric Helmholtz Resonators. J. Acoust. Soc. Am. 1997, 101, 41–51. [Google Scholar] [CrossRef]
  7. Selamet, A.; Lee, I. Helmholtz Resonator with Extended Neck. J. Acoust. Soc. Am. 2003, 113, 1975–1985. [Google Scholar] [CrossRef]
  8. Kim, H.; Selamet, A. Acoustic Performance of a Helmholtz Resonator with Flow. Int. J. Veh. Noise Vib. 2011, 7, 285. [Google Scholar] [CrossRef]
  9. Selamet, E.; Selamet, A.; Iqbal, A.; Kim, H. Effect of Flow on Helmholtz Resonator Acoustics: A Three-Dimensional Computational Study vs. Experiments. SAE Tech. Pap. 2011. [Google Scholar] [CrossRef]
  10. Cai, C.; Mak, C.M.; Wang, X. Noise Attenuation Performance Improvement by Adding Helmholtz Resonators on the Periodic Ducted Helmholtz Resonator System. Appl. Acoust. 2017, 122, 8–15. [Google Scholar] [CrossRef]
  11. Griffin, S.; Lane, S.A.; Huybrechts, S. Coupled Helmholtz Resonators for Acoustic Attenuation. J. Vib. Acoust. Trans. ASME 2001, 123, 11–17. [Google Scholar] [CrossRef]
  12. Kim, H.; Selamet, A. Effect of Flow on a Dual Helmholtz Resonator. J. Mech. Sci. Technol. 2020, 34, 581–588. [Google Scholar] [CrossRef]
  13. Kwon, Y.; Kim, H. High-Speed Fan Noise Reduction Device Using a Continuous Helmholtz Resonator. Trans. Korean Soc. Mech. Eng. A 2022, 46, 363–369. [Google Scholar] [CrossRef]
  14. Kim, H.; Lee, I. Effect of Flow on Various Helmholtz Resonators. Int. J. Acoust. Vib. 2020, 25, 73–78. [Google Scholar] [CrossRef]
  15. Kim, H.; Kang, S.-K.; Lim, Y.-S. Muffler Design Using Transmission Loss Prediction Considering Heat and Flow. Trans. Korean Soc. Noise Vib. Eng. 2014, 24, 600–605. [Google Scholar] [CrossRef] [Green Version]
  16. Selamet, A.; Xu, M.B.; Lee, I.-J.; Huff, N.T. Helmholtz Resonator Lined with Absorbing Material. J. Acoust. Soc. Am. 2005, 117, 725–733. [Google Scholar] [CrossRef] [Green Version]
  17. Liu, Z.; Zhang, X.; Mao, Y.; Zhu, Y.Y.; Yang, Z.; Chan, C.T.; Sheng, P. Locally Resonant Sonic Materials. Science 2000, 289, 1734–1736. [Google Scholar] [CrossRef]
  18. Fang, N.; Xi, D.; Xu, J.; Ambati, M.; Srituravanich, W.; Sun, C.; Zhang, X. Ultrasonic Metamaterials with Negative Modulus. Nat. Mater. 2006, 5, 452–456. [Google Scholar] [CrossRef]
  19. Lee, S.H.; Park, C.M.; Seo, Y.M.; Wang, Z.G.; Kim, C.K. Composite Acoustic Medium with Simultaneously Negative Density and Modulus. Phys. Rev. Lett. 2010, 104, 054301. [Google Scholar] [CrossRef]
  20. Zhu, Y.F.; Zou, X.Y.; Liang, B.; Cheng, J.C. Acoustic One-Way Open Tunnel by Using Metasurface. Appl. Phys. Lett. 2015, 107, 113501. [Google Scholar] [CrossRef]
  21. Liu, G.S.; Zhou, Y.; Liu, M.H.; Yuan, Y.; Zou, X.Y.; Cheng, J.C. Acoustic Waveguide with Virtual Soft Boundary Based on Metamaterials. Sci. Rep. 2020, 10, 981. [Google Scholar] [CrossRef] [PubMed] [Green Version]
  22. Yamamoto, T. Acoustic Metamaterial Plate Embedded with Helmholtz Resonators for Extraordinary Sound Transmission Loss. J. Appl. Phys. 2018, 123, 215110. [Google Scholar] [CrossRef]
  23. Qi, S.; Assouar, B. Ultrathin Acoustic Metasurfaces for Reflective Wave Focusing. J. Appl. Phys. 2018, 123, 234501. [Google Scholar] [CrossRef]
  24. Wang, W.; Xie, Y.; Konneker, A.; Popa, B.I.; Cummer, S.A. Design and Demonstration of Broadband Thin Planar Diffractive Acoustic Lenses. Appl. Phys. Lett. 2014, 105, 2012–2015. [Google Scholar] [CrossRef] [Green Version]
  25. Liang, Z.; Feng, T.; Lok, S.; Liu, F.; Ng, K.B.; Chan, C.H.; Wang, J.; Han, S.; Lee, S.; Li, J. Space-Coiling Metamaterials with Double Negativity and Conical Dispersion. Sci. Rep. 2013, 3, 1614. [Google Scholar] [CrossRef] [Green Version]
  26. Ge, Y.; Sun, H.X.; Yuan, S.Q.; Lai, Y. Broadband Unidirectional and Omnidirectional Bidirectional Acoustic Insulation through an Open Window Structure with a Metasurface of Ultrathin Hooklike Meta-Atoms. Appl. Phys. Lett. 2018, 112, 243502. [Google Scholar] [CrossRef]
  27. Ge, Y.; Sun, H.X.; Yuan, S.Q.; Lai, Y. Switchable Omnidirectional Acoustic Insulation through Open Window Structures with Ultrathin Metasurfaces. Phys. Rev. Mater. 2019, 3, 065203. [Google Scholar] [CrossRef]
  28. Han, D.Y.; Peng, Y.Y.; Liu, G.S.; Zou, X.Y.; Cheng, J.C. Tunable Pipe-Type Acoustic Metamaterials Based on Piezoelectric Composite Side-Branches. J. Appl. Phys. 2021, 129, 084505. [Google Scholar] [CrossRef]
  29. Zhang, H.L.; Zhu, Y.F.; Liang, B.; Yang, J.; Yang, J.; Cheng, J.C. Sound Insulation in a Hollow Pipe with Subwavelength Thickness. Sci. Rep. 2017, 7, 44106. [Google Scholar] [CrossRef] [Green Version]
  30. Ghaffarivardavagh, R.; Nikolajczyk, J.; Glynn Holt, R.; Anderson, S.; Zhang, X. Horn-like Space-Coiling Metamaterials toward Simultaneous Phase and Amplitude Modulation. Nat. Commun. 2018, 9, 1349. [Google Scholar] [CrossRef] [Green Version]
  31. Seybert, A.F.; Ross, D.F. Experimental Determination of Acoustic Properties Using a Two-Microphone Random-Excitation Technique. J. Acoust. Soc. Am. 1977, 61, 1362–1370. [Google Scholar] [CrossRef] [Green Version]
  32. Chung, J.Y.; Blaser, D.A. Transfer Function Method of Measuring In-Duct Acoustic Properties. I. Theory. J. Acoust. Soc. Am. 1980, 68, 907–913. [Google Scholar] [CrossRef]
  33. Chung, J.Y.; Blaser, A. Transfer Function Method of Measuring In-Duct Acoustic Properties. II. Experiment. J. Acoust. Soc. Am. 1980, 68, 914–921. [Google Scholar] [CrossRef]
  34. Singh, R.; Katra, T. Development of an Impulse Technique for Measurement of Muffler Characteristics. J. Sound Vib. 1978, 56, 279–298. [Google Scholar] [CrossRef]
  35. To, C.W.S.; Doige, A.G. A Transient Testing Technique for the Determination of Matrix Parameters of Acoustic Systems, I: Theory and Principles. J. Sound Vib. 1979, 62, 207–222. [Google Scholar] [CrossRef]
  36. To, C.W.S.; Doige, A.G. A Transient Testing Technique for the Determination of Matrix Parameters of Acoustic Systems, II: Experimental Procedures and Results. J. Sound Vib. 1979, 62, 223–233. [Google Scholar] [CrossRef]
  37. Lung, T.Y.; Doige, A.G. A Time-averaging Transient Testing Method for Acoustic Properties of Piping Systems and Mufflers with Flow. J. Acoust. Soc. Am. 1983, 73, 867–876. [Google Scholar] [CrossRef]
  38. Munjal, M.L. Acoustics of Ducts and Mufflers; Wiley: Hoboken, NJ, USA, 2014. [Google Scholar]
  39. He, S. A Transfer Matrix Approach to Determine the Low Frequency Insertion Loss of Enclosures Including Applications. Master’s Thesis, University of Kentucky, Lexington, KY, USA, 2017. [Google Scholar]
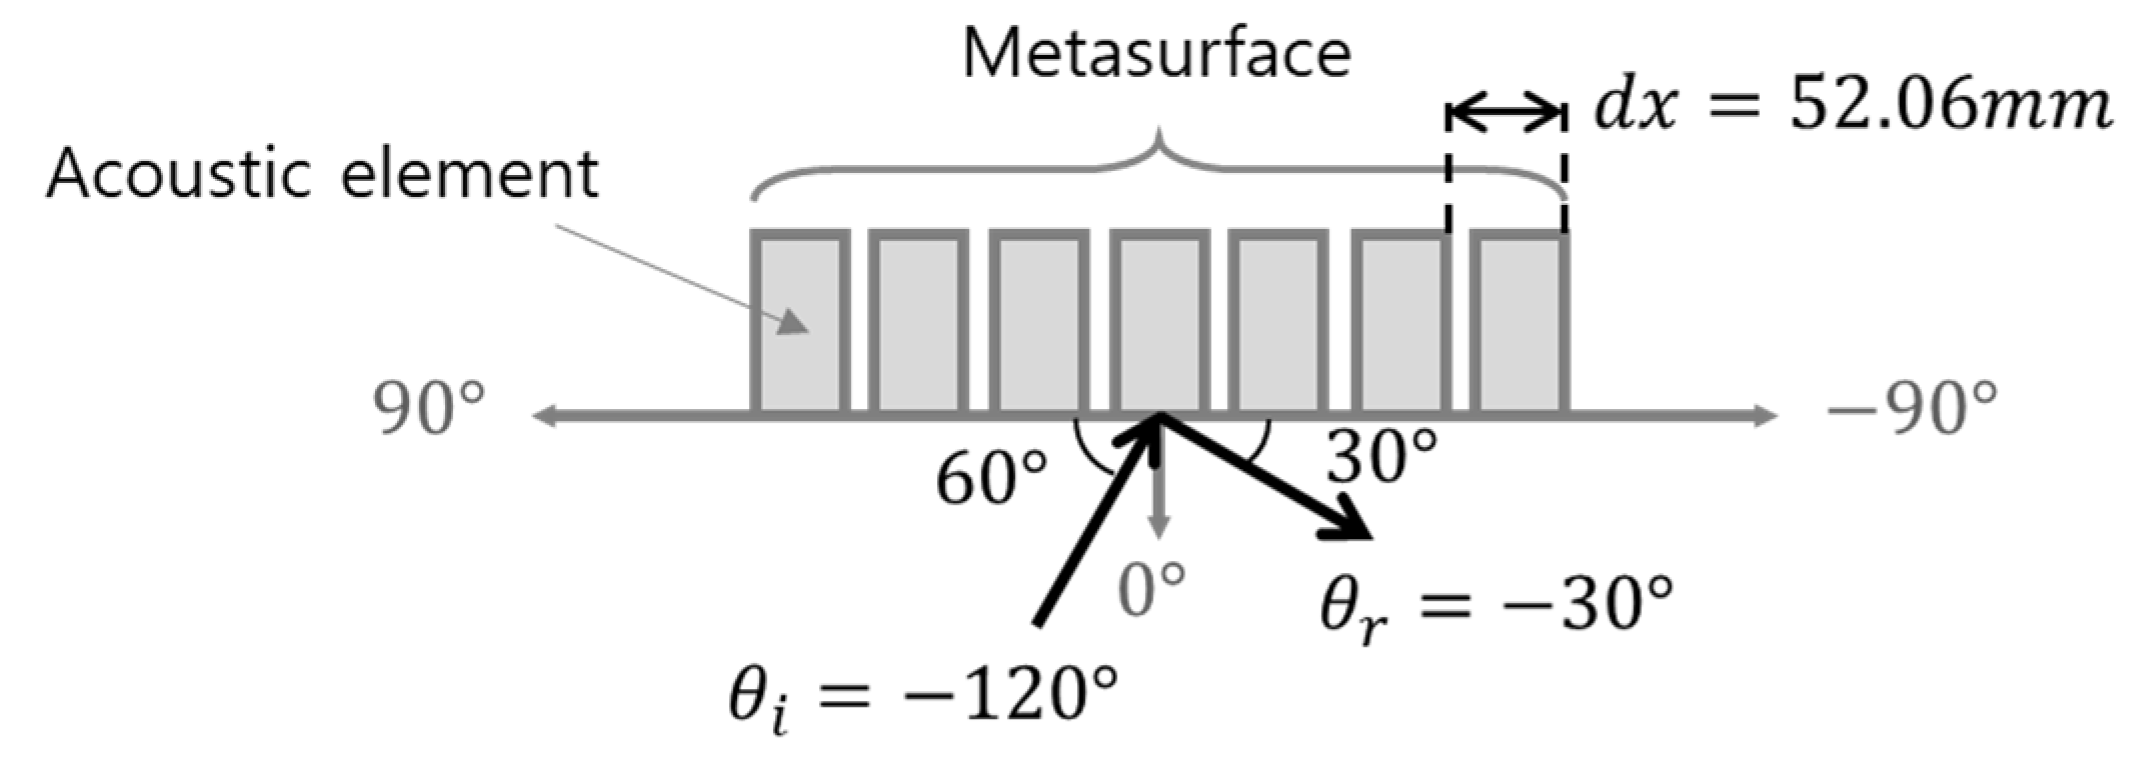
Figure 1. Schematic of a metasurface.
Symmetry 15 00689 g001
Figure 2. Schematic of the acoustic element: (a) acoustic pressure and particle velocity by location; (b) incident, refresh, and transmitted pressures at the entrance of the acoustic element.
Symmetry 15 00689 g002
Figure 3. Lumped model of the acoustic element.
Symmetry 15 00689 g003
Figure 4. Speaker test: (a) schematic of the test setup; (b) test in anechoic room. Results and discussion.
Symmetry 15 00689 g004
Figure 5. Comparison of weft retardation graphs of theoretical and FEM methods.
Symmetry 15 00689 g005
Figure 6. Silencer model with a quarter-wave resonator metasurface.
Symmetry 15 00689 g006
Figure 7. Transmission loss graph of a silencer with a quarter-wave resonator metasurface.
Symmetry 15 00689 g007
Figure 8. Scattered acoustic pressure of a silencer with a quarter-wave resonator metasurface: (a) 1500 Hz; (b) 500 Hz; (c) 2500 Hz.
Symmetry 15 00689 g008
Figure 9. Speaker test results of a silencer with a quarter-wave resonator metasurface: (a) straight pipe; (b) silencer; (c) SPL graph.
Symmetry 15 00689 g009
Figure 10. Design of the silencer with the labyrinthine-type resonator metasurface: (a) acoustic element model; (b) phase delay graph; (c) silencer model.
Symmetry 15 00689 g010
Figure 11. Transmission loss graph of a silencer with a labyrinthine-type resonator metamaterial.
Symmetry 15 00689 g011
Figure 12. Speaker test results of a silencer with a labyrinthine-type resonator metasurface: (a) straight pipe; (b) silencer; (c) SPL graph.
Symmetry 15 00689 g012aSymmetry 15 00689 g012b
Table 1. Design dimensions of the quarter-wave resonator metasurface derived using the generalized Snell’s law.
f θ i θ r d d x
upper part1500 Hz 90°30°19.05 mm
lower part1500 Hz90°30°19.05 mm
Table 2. Design dimensions of the quarter-wave resonator metasurface using phase delay.
f l 1 l 2 l 3 l 4 l 5 l 6
1500 Hz62.5 mm52.9 mm49.9 mm47.06 mm44.05 mm33.03 mm
Table 3. Design dimensions of the labyrinthine-type resonator metasurface using phase delay.
f l 1 l 2 l 3 l 4 l 5 l 6
1500 Hz14.99 mm13.98 mm13.79 mm13.66 mm13.51 mm12.95 mm
Disclaimer/Publisher’s Note: The statements, opinions and data contained in all publications are solely those of the individual author(s) and contributor(s) and not of MDPI and/or the editor(s). MDPI and/or the editor(s) disclaim responsibility for any injury to people or property resulting from any ideas, methods, instructions or products referred to in the content.