Article

A Comparative Study on Line Bisection and Landmark Task Performance Using a Hybrid Online Setting

by
Francesca Strappini
1,2,
Amihai Ben-Nun
3 and
Anna Pecchinenda
1,*
1
Department of Psychology, Sapienza University of Rome, 00185 Rome, Italy
2
Department of Philosophy and Communication Studies, University of Bologna, 40126 Bologna, Italy
3
Technion, Israel Institute of Technology, Haifa 3200003, Israel
*
Author to whom correspondence should be addressed.
Symmetry 2023, 15(3), 729; https://doi.org/10.3390/sym15030729
Submission received: 13 December 2022 / Revised: 27 February 2023 / Accepted: 3 March 2023 / Published: 15 March 2023
(This article belongs to the Section Life Sciences)

Abstract

:
Bisection tasks are commonly used to assess biases and asymmetries in visuospatial attention in both patients and neurologically intact individuals. In these tasks, participants are usually asked to identify the midpoint and manually bisect a horizontal line. Typically, healthy individuals tend to show an attention processing advantage for the left visual field, known as “pseudoneglect.” Here, performance at two computerized versions of the task was compared to assess pseudoneglect in neurologically intact individuals. Specifically, we used a hybrid online setting in which subjects (n = 35) performed the online tasks under the video guidance of the experimenter. We measured attentional biases in the line bisection and landmark tasks. We found pseudoneglect in both tasks, although the bias was larger in the line bisection task. Overall, these findings show that hybrid online tasks may provide a valid setting to assess attentional biases and suggest their feasibility in the clinical setting.

1. Introduction

Perceptual asymmetry is one of the fundamental properties of the visual system. This phenomenon involves the preferential brain’s response and task performance for certain stimuli or retinal locations. Namely, spatial information seems to be processed more accurately in the left than in the right visual field (e.g., [1,2,3,4]). This superiority effect has been attributed to the right hemisphere’s dominance over the left hemisphere, and it has been shown both in healthy individuals [5,6] and patients with unilateral brain lesions and spatial neglect syndrome [7], although more pronounced in the latter ones. This spatial processing advantage in the left hemifield in healthy individuals has been named “pseudoneglect,” and it entails a small but systematic leftward bias across various experimental tasks and sensory modalities [8,9]. Pseudoneglect appears to be influenced by various biological and cultural factors, including performing hand, age, gender, and the direction in which participants initiate motor scanning, either by eye or hand [10]. There is also some evidence that pseudoneglect is modulated by emotional stimuli or by individuals’ self-report emotional state or trait, although the direction of the shift is not consistent across studies [11].
A typical task employed to assess asymmetries in visuospatial attention is the visual line bisection, where subjects are required to inspect a centrally presented line whose extremities fall into the hemifields that are processed by the contralateral hemispheres. Then, they are asked to manually place a vertical line in the center of the horizontal line drawn on the paper. Most healthy individuals tend to systematically bisect the horizontal line to the left of the veridical center. This effect has been traditionally attributed to the more efficient visuospatial processing of the left visual field due to the lateralization of activity in the ventral attention network (e.g., [12,13,14], which, through the engagement of the spatially specific dorsal attention network, increases the perceived size of the left side of the horizontal line, resulting in a leftward shift of the perceived center [15].
Although using paper and pencil seems to be an effective and simple assessment modality, it has some drawbacks. For instance, manual assessment performed by the researcher is a time-consuming procedure and may entail a certain amount of intra- and inter-subject variability in the evaluation process. Moreover, some additional information, such as the so-called “dynamic” information, cannot be easily extracted from the paper-and-pencil assessment [16]. To overcome these limitations, several computer-based approaches have been proposed, in which subjects are required to select the middle point of a horizontal line presented on a computer monitor. These video-computerized approaches seem to increase the resolution and the accuracy of the measurements [16] and provide valid and reliable results [17]. However, it is still unknown whether conducting online testing with computerized line bisection tasks is feasible and effective.
Despite online testing being widely used for conducting survey research [18]), collective behavior studies [19], and decision-making experiments [20], it is unclear to what extent it can be employed in behavioral and cognitive experiments that require participants’ sustained attention and complex multi-trial designs, such as the line bisection task. However, some recent studies seem to suggest that the quality of data collected online is reasonably high compared to laboratory studies (e.g., [21,22,23,24]). In particular, recent studies on laterality have shown the validity and reliability of online methods, compared to experimentally controlled settings, in conducting large-scale field experiments (e.g., [25,26,27,28]).
In this present study, we compared the feasibility of assessing asymmetries in visuospatial attention with online testing. We used the line bisection task, which is the most widely used tool for the diagnosis and study of visual neglect, and the landmark task, which is a common non-motor adaptation of the line bisection task, originally devised by Milner et al. [29]. In this task, lines are pre-bisected (i.e., a mark indicates the bisection point), and participants indicate whether the mark is closer to the right or left side or whether the right or left side of the pre-bisected line is longer or shorter [10,29]. As a consequence of this variability, in some studies, the bias is calculated as the proportion of longer or shorter responses for lines that are bisected equally (e.g., [30]), while in others, the bias is calculated as the number of leftward or rightward responses in judging the mark in relation to the left or right side (e.g., [31]). Finally, others fit participants’ responses to a cumulative logistic or normal-distributed psychometric function and calculate the bias as the perceived midpoint (e.g., [32]). Regardless of the type of task and measurements, compared to the line bisection task, the landmark task presumably recruits fewer motor units and eye movements, allowing a partial dissociation between motor and perceptual components of the bisection errors [33], and it has the advantage of being a reliable across-session within-subjects task [34].
Both tasks are used to study the processing of attention allocation and characterize attentional biases while controlling for other cognitive factors [10], as well as to understand attentional biases in ecologically visual environments [35]. Although there are more sensitive tests to detect hemispatial neglect (e.g., visual cancellation tasks), they are not typically used to assess pseudoneglect because of ceiling effects [36]; therefore, they are not described here.
To implement a direct comparison between the two tasks, we administered the landmark and line bisection paradigms in the same experiment with comparable perceptual parameters. We employed a hybrid paradigm in which the online testing was performed under video guidance by the experimenter. This paradigm overcomes some technical challenges in collecting online data, such as maintaining standardized conditions across participants (e.g., measuring the viewing distance from the monitor is an important parameter in these types of tasks), facilitating communication between participants and the experimenter, and increasing task engagement due to the close interaction with the experimenter [37]. The video presence of the experimenter also allows for monitoring participants’ performance during the task, which can be necessary when testing clinical populations. Moreover, it has been shown that the presence of the experimenter through web-conferencing software leads to less noisy data and better statistical power compared to online experiments that do not have the webcam on and interaction with the experimenter [37].
Here, we focused on a replication of a standard and well-established experimental manipulation to detect and quantify spatial attentional biases in a hybrid online setting.

2. Materials and Methods

2.1. Sample Size Calculation

The sample size was based on the overall effect of pseudoneglect found across sessions and tasks reported in a previous study [34]. According to the effect size (Cohen’s d = −0.68), 31 participants are sufficient to find a significant leftward bisection error (perceived midpoint minus the physical line midpoint), considering a power of 95% and a level of significance of 5% (two-sided, within-subjects t-test) (G*Power 3.1; [38]. Thus, we slightly over-sampled, and the resulting sample size of n = 35 is adequate for the main objective of this study.

2.2. Participants

Forty-three students received course credits for participating in an online study. They had normal or corrected-to-normal visual acuity and no self-reported history of attentional, psychiatric, or neurological disease. We employed only right-handed subjects based on evidence that right-handers exhibit a consistent leftward bias on the line bisection task regardless of hand preference, compared to left-handers that do not deviate significantly from the veridical center [39,40]. Additionally, we included only young adults (18–30-year-old students) since it has been shown that individuals younger than 40 years of age show a consistent leftward bias on the line bisection task [10], whereas older adults (greater than 50 years of age) show inconsistent or no perceptual biases [41,42].
The data of eight participants were excluded: seven participants did not complete the task, and one did not follow the instructions. This resulted in the data of 35 participants being included in the final analysis (Mage = 20.86; SD = 1.09; 32 females and 3 males).
The experiments reported here were performed using a web-based interface through Testable (https://www.testable.org/ accessed on 15 March 2021).

3. Apparatus and Materials
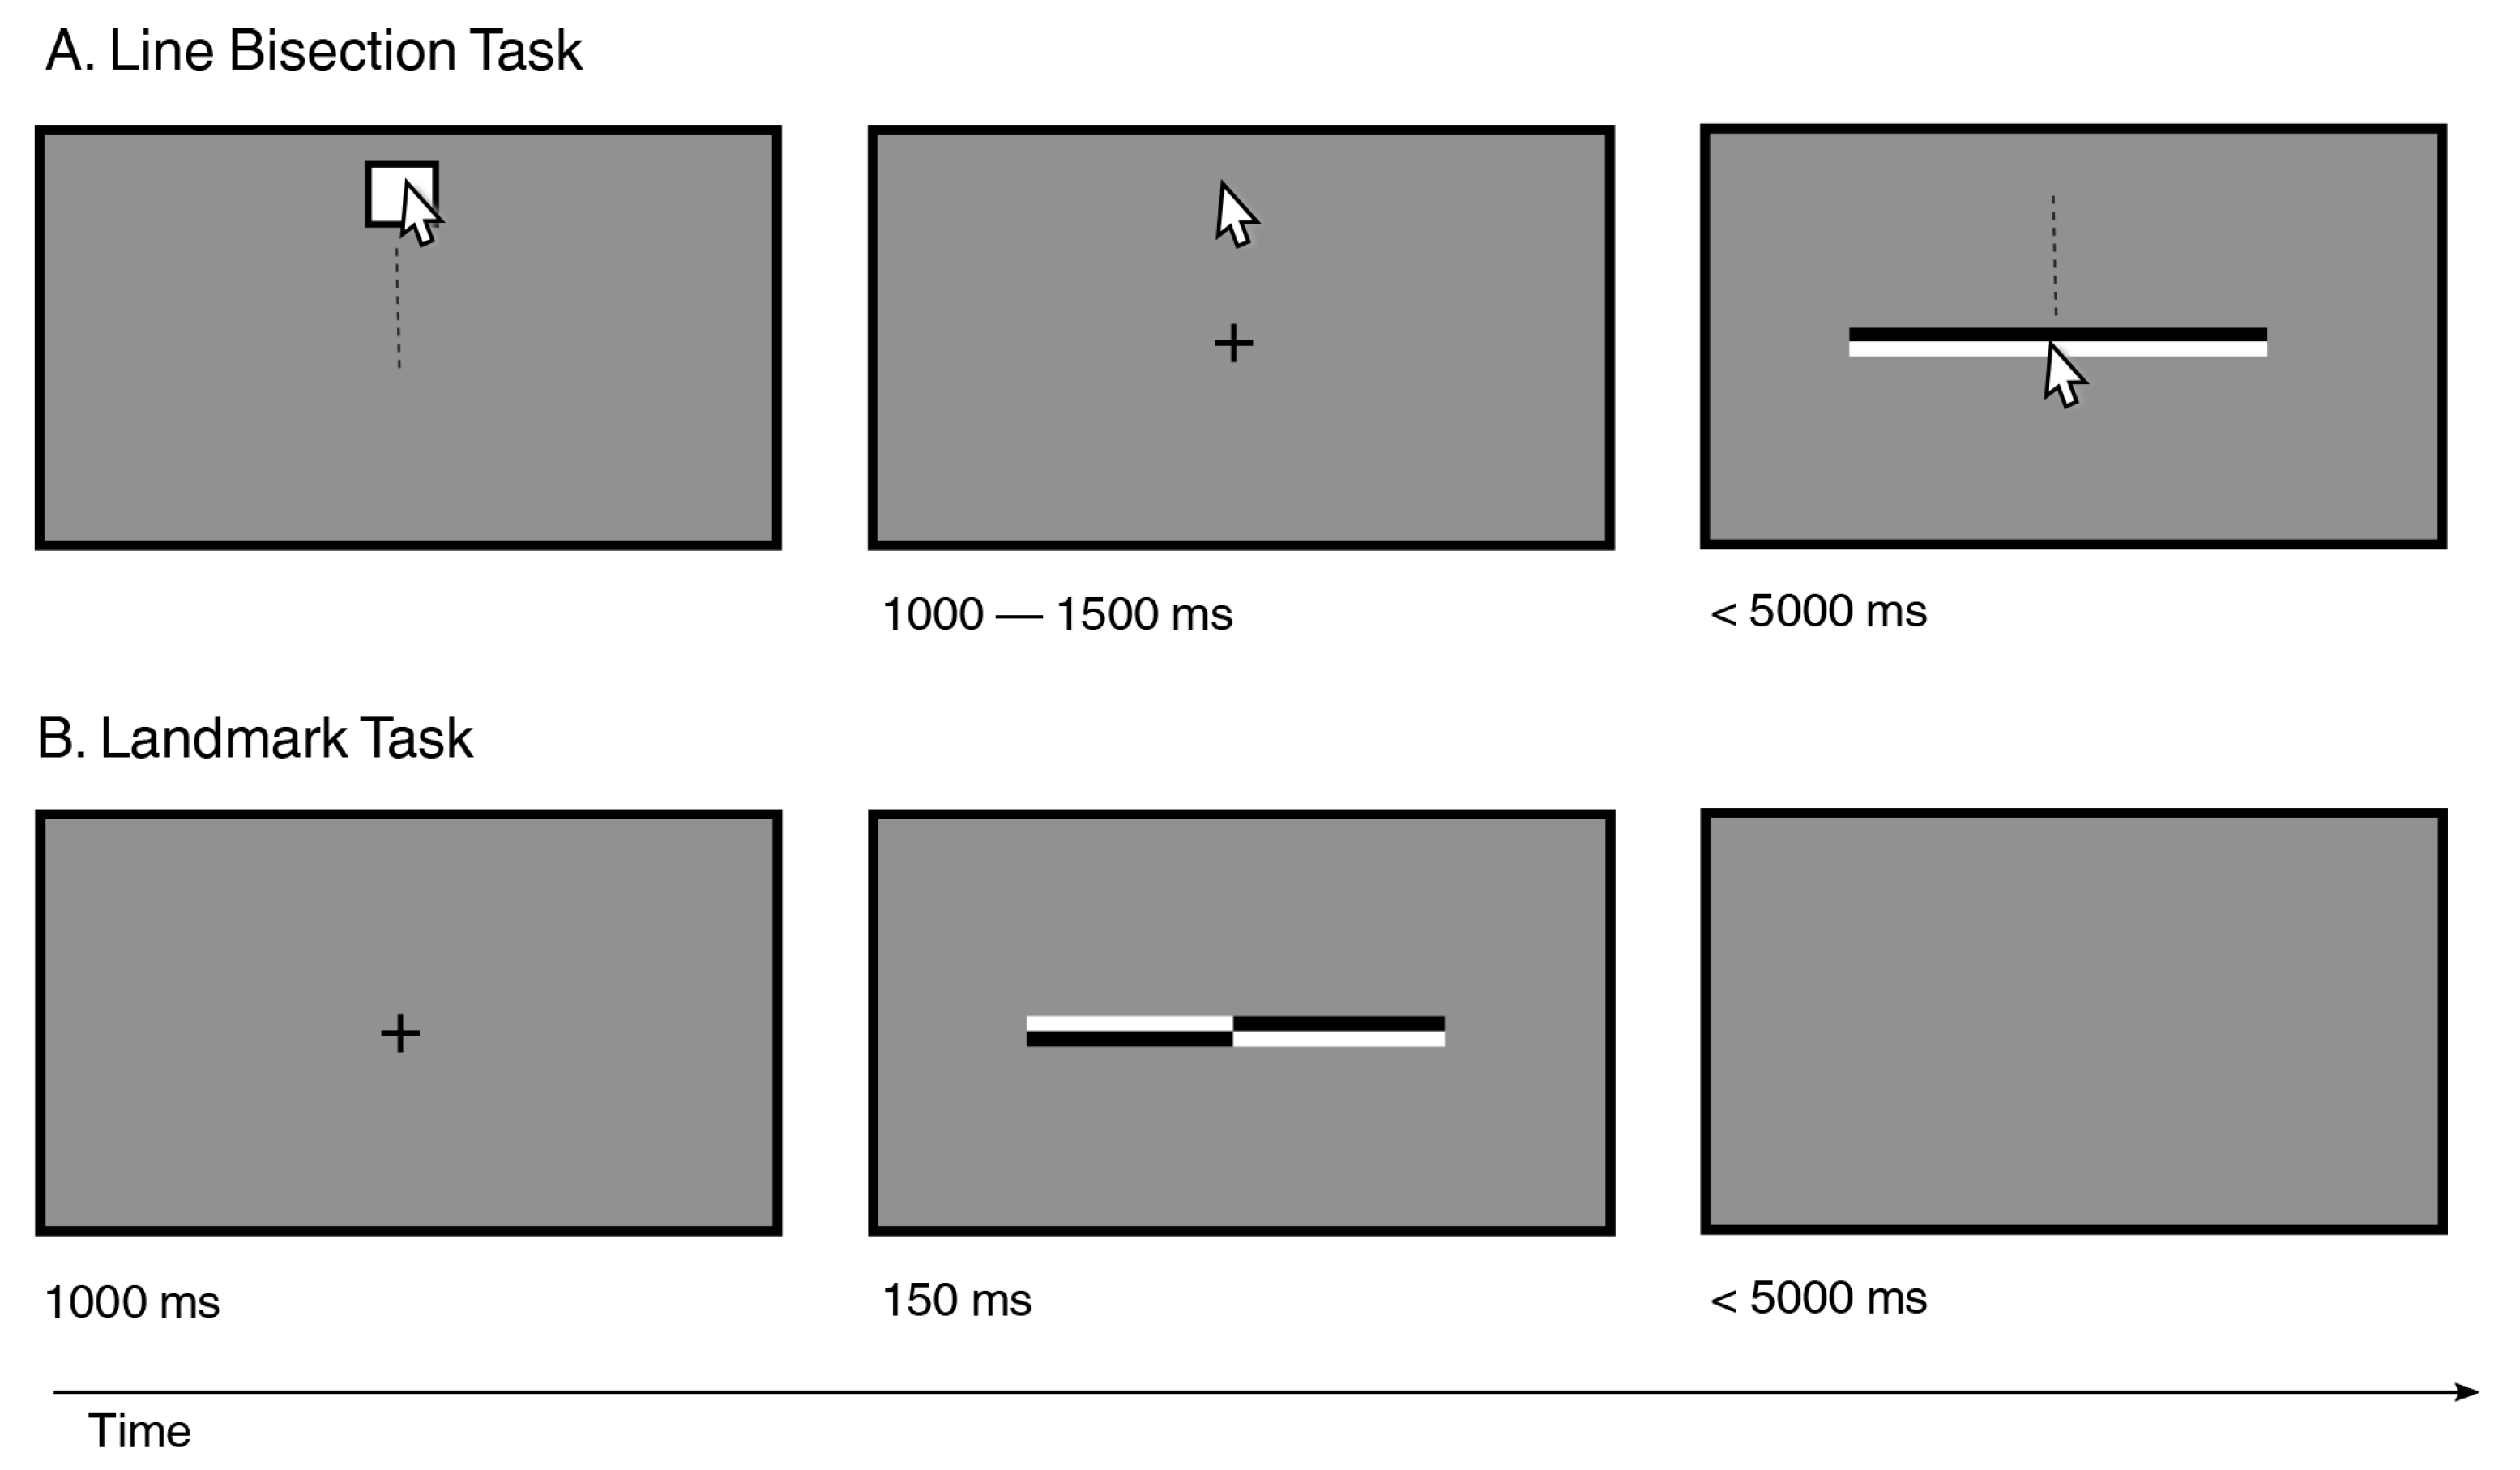
3.1. Visual Stimuli

Line Bisection Task. For this task, stimuli consisted of horizontal black (RGB: 0, 0, 0) and white (RGB: 255, 255, 255) lines measuring 20, 21, 22, and 23 cm (Figure 1). These lengths were chosen to optimize the leftward pseudoneglect response since it has been shown that shorter lines are associated with generally more accurate responses [13,43,44]. Lines were 8 mm thick (4 mm black and 4 mm white); in half of the trials, the upper part was black, and in the other half of the trials, the lower part was black. On a trial-by-trial basis, the line position on the screen could be displayed at 9 distinct locations (0 = center, 0.05, 0.07, 0.1, 0.14, 0.2, 0.28, 0.39, and 0.55 cm), which were repeated 12 times along the horizontal axis to the right and to the left of the veridical center. Participants could not always assume that the center of the line was either the center of the screen or that it was aligned to their body’s midline due to changes in line position.
At the beginning of each trial, a black square outline (1.3 × 1.3 cm) appeared randomly in 2 positions along the vertical axis (±8 cm). Based on evidence from studies using the computerized line-bisection task [45,46], only two positions were used. Participants were asked to bring the mouse pointer to the center of the square and to keep it there until the line appeared on the screen. Subsequently, a gray background (RGB: 179, 179, 179) with a black central fixation cross (0.39 × 0.39 deg) was displayed for a duration that randomly fluctuated between 1000 and 1500 ms. The line then appeared, and participants were told to cut the line in half by dragging the mouse and clicking on the line’s perceived midpoint. Once the participant clicked on the perceived middle of the line, the coordinate location of the click was recorded, and the next trial began. The experiment automatically switched to the next trial if the subject did not reply within 5000 milliseconds, and the prior trial was not included in the analysis (see Figure 1).
Participants completed 288 trials in 2 blocks of 144 trials each. All trial types were balanced and randomly interleaved. The 4 line lengths, 2 contrast polarities, and 17 positions yielded 136 trial types. However, trials corresponding to different line lengths and contrast polarities collapsed together during analysis, yielding 17 analysis conditions. Therefore, participants performed 16 trials per condition except for the centered lines that were presented 24 times. For the computation of the attentional bias, we averaged the bisection errors across the 17 positions. The task typically required approximately 12 min to complete.
The experimental design is a 2 (configuration: black–white vs. white–black) by 4 (line length: 20, 21, 22, and 23 cm) by 17 (line position: 0, 0.05, 0.07, 0.1, 0.14, 0.2, 0.28, 0.39, and 0.55 cm) within subject.
Landmark task. A computerized version of the landmark task adapted from past studies was used [13,43,47,48].
Stimuli consisted of horizontal black (RGB: 0, 0, 0) and white (RGB: 255, 255, 255) lines (Figure 1). Line length range (20, 21, 22, or 23 cm) was chosen to optimize the leftward bias based on evidence showing that long lines seem to produce a stronger left-biased pseudoneglect than short lines [10,43,49]. Thirty-four lines of varying asymmetry were created (inverting black and white segments). Each line was vertically transected at the vertical midline of the screen, while the length of the left and right sections varied across trials. Lines were transected at 1 of 17 points ranging symmetrically from ±2.39–2.75% of absolute line length to the veridical center. The intersection points were calculated based on a logarithmic scale with the smaller segments near the center (0 = centered, 0.05, 0.07, 0.1, 0.14, 0.28, 0.39, and 0.55 cm). The transector location was aligned to the fixation cross, which preceded the presentation of the line. These parameters were chosen to match those of the line bisection stimuli.
For the duration of the experiment, participants were instructed to maintain the fixation in the center of the screen and to perform a single-interval forced-choice decision regarding which side of the bisected line was longer using the mouse buttons (“left button”—left side longer, “right button”—right side longer).
A typical trial started with the fixation point (a black cross presented on gray [RGB: 179, 179, 179] background: size 0.39 × 0.39 deg) presented in the middle of the screen for 1000 ms, replaced by a line presented for 150 ms. This duration was chosen to prevent eye movements [10].
Participants responded with their dominant right hand (right index and middle fingers, respectively). Participants had a maximum of 5000 ms to answer after the line disappeared; however, they were encouraged to respond as rapidly as they could. Trials in which individuals responded outside of the allowed response window were excluded from analysis. Inter-trial intervals were variable in duration.
Participants performed 288 trials divided into 2 blocks of 144 trials each. All trial types (i.e., contrast polarity: 2 black–white; line lengths: 4; intersection point: 17) were balanced and randomly interleaved. The 4 line lengths, 2 polarity contrasts, and 17 offsets yielded 136 trial types. However, trials corresponding to different line lengths and contrast polarity collapsed together during analysis, yielding 17 analysis conditions. Thus, participants performed 16 trials per condition except for trials with 0 mm stimulus asymmetry that were presented 24 times, as this condition is the most sensitive at detecting spatial attentional biases [34]. As for the line bisection task, we averaged the bisection errors across the 17 offsets for the computation of the attentional bias. The task typically required approximately 10 min to complete.
The experimental design is a 2 (configuration: black–white vs. white–black) by 4 (line length: 20, 21, 22, and 23 cm) by 17 (intersection point: 0, 0.05, 0.07, 0.1, 0.14, 0.2, 0.28, 0.39, and 0.55 cm) within subject.

3.2. Procedure

Each participant received an email with all information prior to the session, including instructions for using their unique participation code, the privacy statement, the requirements, and the dates for the assessments. They also received a web link that led to the fully automatized online experiment and a Google Meet link. Participants were told to perform the tasks in a calm and non-distracting environment. Before starting the experiment, participants were instructed to open a Google Meet session with the experimenter, activate their webcams, and share their screens. Their age, sex, and participation code were collected. At the start of the experiment, participants were instructed to match the length of a line projected on the screen to the length of a bank card. This procedure allowed the stimuli to be scaled up with the screen resolution of the participants’ screens. After, participants were instructed to measure the distance from the monitor (57 cm) with a ruler under the supervision of the experimenter.
During all the experimental sessions, the experimenter monitored participants’ performance on the shared screen.
The order of the two tasks was counterbalanced (half participants started with two blocks of the line bisection task, and the other half started with two blocks of the landmark task). Each task started with 20 practice trials. Between blocks and tasks, participants had the possibility to take a short break. The whole procedure took approximately 50 min.

3.3. Psychometrics

At the end of the experiment, participants included in this study completed a computerized version of the Edinburgh Handedness Inventory [50] to assess manual dominance. Strong right-handedness receives a score of 100, while strong left-handedness receives a score of −100. Only participants with a Laterality Quotient of at least 60 were included in the study.

3.4. Data Analysis

We computed the attentional bias independently for both tasks by averaging the mean proportion of errors across all the instances.
For the line bisection task, bisection errors were calculated by subtracting the physical line midpoint from the perceived line midpoint. Thus, negative values represent a leftward error, and positive values represent a rightward error. In addition, the average bisection error was computed by averaging error across line contrast, line length, and position.
For the pre-transected lines, the same analysis methods used by Mitchell et al. (2020) were used. For each shift to the left or right side of the line, we defined the error as the proportion of “right side longer” responses (0, 0.05, 0.07, 0.1, 0.14, 0.2, 0.28, 0.39, and 0.55 mm). For each participant, we fitted a psychometric curve using cumulative normal psychometric function with Matlab (MathWorks, 2021b, Natick, MA, USA: The MathWorks Inc. https://www.mathworks.com (accessed on 15 March 2021)) and the Palamedes Toolbox [51]. The slope and threshold were estimated using non-parametric bootstrapping. The lapse rate was calculated using the jAPLE fitting scheme [52], and the guess rate was set to be the same as the lapse rate. The two parameters were kept as free parameters. Psychometric functions were fitted to proportion right-side responses and plotted as a function of stimulus asymmetry (Figure 2).
Then, we calculated the bisection error using the point of subjective equality (PSE), i.e., the point considered by each subject as the center of the line. This point corresponds to 0.5 on the y-axis (Figure 2).
The mean errors from both tasks were analyzed by carrying out 2 one-sample t-tests against 0 (p-values were Bonferroni corrected at α = 0.05). The two tasks were compared with a paired sample t-test, and the Person correlation coefficient was computed between them. JASP 0.14.1.0 was used to conduct the statistical analyses. For both tasks, the reaction times were computed.

4. Results

All participants were right-handed and had a laterality quotient higher than 60 (M = 93.511, SD = 9.74).
The average reaction time for performing each trial in the landmark task was 670 ms (SEM = 52) and 1580 ms (SEM = 74) for the line bisection task. Trials’ RTs did not exceed ± 3 SD of the mean, so no trial was excluded from the analysis.
All participants in both tasks responded within the response window. Thus, no trial was excluded from the analysis.
As described in Figure 1, the experiment included two tasks (line bisection and landmark) and a response error. The average error was −0.83 mm (SD = 2.03) for the line bisection and −0.10 mm (SD = 0.19) for the landmark. Participants’ biases for each task are shown in Figure 3.
Comparisons of the average error scores in both tasks against zero (the physical line midpoint) showed that, overall, participants tended to bisect slightly to the left of the veridical center in both tasks (line bisection, t34 = 2.42, p = 0.04, Bonferroni corrected, 95% CI Upper −3.31, 95% CI lower −5.77; landmark, t34 = 1.37, p = 0.004, Bonferroni corrected, 95% CI Upper −0.147, 95% CI lower −0.635). Comparison of the error bias in the line bisection with the error bias in the landmark indicated that the bias was significantly different (t34 = −2.12, p = 0.04, Bonferroni corrected, 95% CI Upper −0.118, 95% CI lower −5.36).
The Pearson correlation coefficient showed no significant correlation across tasks (r = 0.089, p = 0.610, 95% CI Upper 0.410, 95% CI lower −0.251; Figure 4).

5. Discussion

Several formal tests have been employed to assess pseudoneglect in the standard population and neglect in patients. One of the most popular tests is the line bisection, in which participants are required to mark the veridical center of a line. Line bisection performance is often compared with the landmark task, which requires participants to perform a forced-choice task on pre-transected lines.
Given the extensive use of these tasks, we used both line bisection and landmark to assess individual attentional biases using a hybrid online paradigm. We found a leftward bias in both tasks, consistently with many previous reports and meta-analyses of laboratory studies (e.g., [10,13,42,43,53]). However, these results are partially in contrast with two recent studies that did report a leftward bias with the line bisection task but no bias with the landmark task [28,34]. As pointed out by Mitchell and collaborators, this null effect is likely due to inconsistent compliance with the task’s instructions. Specifically, participants produced reversed fit responses more often when the instruction was to report which side was shorter compared to reporting which side was longer [34]. We can speculate that using a hybrid paradigm, which entails ongoing monitoring and the presence of practice trials before the experiment, minimized the chance of reversing the instructions.
Importantly, we found that when similar parameters are used in both the line bisection and the landmark task, and similar parameters are computed to assess and quantify performance, the line bisection seems to provide a larger leftward bias in an online setting. This finding may suggest that the line bisection task is better suited to measure pseudoneglect when using an online environment than the landmark task. However, it should be noted that the two tasks partially rely on different modalities, as the line bisection task requires motor processing and involves premotor factors [54], whereas the landmark does not. Thus, it is also possible that the two tasks generate different spatial biases within the same individuals because of their intrinsic nature, regardless of the type of environment used to administer the tasks. Indeed, such an account is in line with previous findings on pseudoneglect (e.g., [53,55]) and spatial neglect [56], showing that perceptual and motor biases have different magnitudes when assessed in standard laboratory environments. Indeed, it has been shown that the two tasks rely on partially different neural correlates. For instance, Çiçek et al. [57] found that the line bisection task elicited a neural response in the frontal eye fields compared to the landmark task. This cortical area is activated during top-down attention and visuomotor behavior. Thus, our results should be interpreted in the context of these neuropsychological differences between the tasks.
Finally, we also found that participants’ performance in the two tasks was not correlated. While it is possible that this difference relies on the partially non-dependent mechanisms that are recruited, it is also possible that this lack of correlation is due to the low reliability of one or both tasks [28]. Recently, Mitchell et al. [34] have argued that the line bisection task provides a less reliable measure compared to the landmark task. Thus, these differences across tasks point to the importance of studying individual differences in response biases.
This study was limited by a gender-biased sample, of which about 91% identified as female. Although few studies have investigated the interaction between gender and pseudoneglect, and only a few reported a significant effect of sex, our findings should be interpreted with caution. For instance, Hausmann et al. [58] found a significant interaction between hand use and gender, with females showing the leftward bias to a similar extent with both hands while males mainly with the left one. Chen et al. [59] reported that the age-related decrease in leftward bias is specific to males. In females, the leftward bias does not significantly change with age. In older adults, in a meta-analytic study, it was found that gender is not a significant moderator of line bisection and landmark task performance [42]. Thus, there is some indication that gender might be a covariate factor in the line bisection tasks to be taken into account.
In conclusion, this present study successfully replicated the previous laboratory-based findings using an online hybrid paradigm in that a significant bias occurred in the line bisection and landmark tasks. Online data collection has a number of advantages compared to standard experiments conducted in laboratories, for example, the larger and more representative pool of subjects that is possible to sample. When translated to clinical settings, the potential to sample a large population of patients to measure visual neglect represents an even greater benefit considering the difficulty in assessing patients with multiple testing across time points during the chronic phase. Notably, the paradigm employed here overcomes some technical challenges in collecting online data, such as maintaining standardized conditions across participants (e.g., measuring the viewing distance from the monitor, which is an important parameter in these types of tasks) and increasing participants’ compliance. The video presence of the experimenter also allows for monitoring of participants’ performance during the task, which can be necessary when testing clinical populations.

Author Contributions

A.P. had the idea to compare computerized line bisection and landmark tasks. F.S. performed the experiments and wrote the first version of the draft. A.B.-N. supervised the analyses. All authors have read and agreed to the published version of the manuscript.

Funding

A.P. is funded by the Ministry of University and Research: RM120172B77EE5F8. F.S. is funded by Ministry of University and Research PROT #AR22117A62EE8C69.

Institutional Review Board Statement

The work was conducted in compliance with the Code of Ethics of the World Medical Association (Declaration of Helsinki, 1964), and it was authorized by Sapienza University’s Ethics Committee (Prot. N. 1272, 7 May 2019).

Informed Consent Statement

All participants gave written informed consent and were naïve to the purpose of the experiments.

Data Availability Statement

Data are available from the first author upon request.

Conflicts of Interest

The authors declare no conflict of interest.

References

  1. Holländer, A.; Corballis, M.C.; Hamm, J.P. Visual-field asymmetry in dual-stream RSVP. Neuropsychologia 2005, 43, 35–40. [Google Scholar] [CrossRef] [PubMed]
  2. Verleger, R.; Sprenger, A.; Gebauer, S.; Fritzmannova, M.; Friedrich, M.; Kraft, S.; Jaśkowski, P. On why left events are the right ones: Neural mechanisms underlying the left-hemifield advantage in rapid serial visual presentation. J. Cogn. Neurosci. 2009, 21, 474–488. [Google Scholar] [CrossRef] [PubMed] [Green Version]
  3. Verleger, R.; Śmigasiewicz, K.; Möller, F. Mechanisms underlying the left visual-field advantage in the dual stream RSVP task: Evidence from N2pc, P3, and distractor-evoked VEPs. Psychophysiology 2011, 48, 1096–1106. [Google Scholar] [CrossRef]
  4. Asanowicz, D.; Śmigasiewicz, K.; Verleger, R. Differences between visual hemifields in identifying rapidly presented target stimuli: Letters and digits, faces, and shapes. Front. Psychol. 2013, 4, 452. [Google Scholar] [CrossRef] [Green Version]
  5. Heilman, K.M.; Van Den Abell, T. Right hemispheric dominance for mediating cerebral activation. Neuropsychologia 1979, 17, 315–321. [Google Scholar] [CrossRef] [PubMed]
  6. Sturm, W.; Reul, J.; Willmes, K. Is there a generalized right hemisphere dominance for mediating cerebral activation? Evidence from a choice reaction experiment with lateralized simple warning stimuli. Neuropsychologia 1989, 27, 747–751. [Google Scholar] [CrossRef]
  7. Mattingley, J.B.; Bradshaw, J.L.; Nettleton, N.C.; Bradshaw, J.A. Can task specific perceptual bias be distinguished from unilateral neglect? Neuropsychologia 1994, 32, 805–817. [Google Scholar] [CrossRef] [PubMed]
  8. Bowers, D.; Heilman, K.M. Material-specific hemispheric activation. Neuropsychologia 1980, 18, 309–319. [Google Scholar] [CrossRef] [PubMed]
  9. Toba, M.N.; Cavanagh, P.; Bartolomeo, P. Attention biases the perceived midpoint of horizontal lines. Neuropsychologia 2011, 49, 238–246. [Google Scholar] [CrossRef]
  10. Jewell, G.; McCourt, M.E. Pseudoneglect: A review and meta-analysis of performance factors in line bisection tasks. Neuropsychologia 2000, 38, 93–110. [Google Scholar] [CrossRef] [PubMed]
  11. Strappini, F.; Galati, G.; Pecchinenda, A. A systematic review on the interaction between emotion and pseudoneglect. Symmetry 2021, 13, 1531. [Google Scholar] [CrossRef]
  12. Thiebaut de Schotten, M.; Dell’Acqua, F.; Forkel, S.; Simmons, A.; Vergani, F.; Murphy, D.G.; Catani, M. A lateralized brain network for visuo-spatial attention. Nat. Preced. 2011, 14, 1245–1246. [Google Scholar] [CrossRef]
  13. Benwell, C.S.Y.; Harvey, M.; Thut, G. On the neural origin of pseudoneglect: EEG-correlates of shifts in line bisection performance with manipulation of line length. NeuroImage 2014, 86, 370–380. [Google Scholar] [CrossRef] [Green Version]
  14. Zago, L.; Petit, L.; Jobard, G.; Hay, J.; Mazoyer, B.; Tzourio-Mazoyer, N.; Karnath, H.-O.; Mellet, E. Pseudoneglect in line bisection judgement is associated with a modulation of right hemispheric spatial attention dominance in right-handers. Neuropsychologia 2017, 94, 75–83. [Google Scholar] [CrossRef]
  15. Heilman, K.M.; Van Den Abell, T. Right hemisphere dominance for attention: The mechanism underlying hemispheric asymmetries of inattention neglect. Neurology 1980, 30, 327. [Google Scholar] [CrossRef]
  16. Liang, Y.; Fairhurst, M.C.; Guest, R.M.; Potter, J.M. A learning model for the automated assessment of hand-drawn images for visuo-spatial neglect rehabilitation. IEEE Trans. Neural Syst. Rehabil. Eng. 2010, 18, 560–570. [Google Scholar] [CrossRef]
  17. Jee, H.; Kim, J.; Kim, C.; Kim, T.; Park, J. Feasibility of a Semi-computerized Line Bisection Test for Unilateral Visual Neglect Assessment. Appl. Clin. Inform. 2015, 6, 400. [Google Scholar] [CrossRef] [Green Version]
  18. Gosling, S.D.; Vazire, S.; Srivastava, S.; John, O.P. Should We Trust Web-Based Studies? A Comparative Analysis of Six Preconceptions About Internet Questionnaires. Am. Psychol. 2004, 59, 93–104. [Google Scholar] [CrossRef] [Green Version]
  19. Suri, S.; Watts, D.J. Cooperation and contagion in web-based, networked public goods experiments. PLoS ONE 2011, 6, e16836. [Google Scholar] [CrossRef] [PubMed] [Green Version]
  20. Amir, O.; Rand, D.G.; Gal, Y.K. Economic Games on the Internet: The Effect of $1 Stakes. PLoS ONE 2012, 7, e31461. [Google Scholar] [CrossRef] [PubMed] [Green Version]
  21. Dandurand, F.; Shultz, T.R.; Onishi, K.H. Comparing online and lab methods in a problem-solving experiment. Behav. Res. Methods 2008, 40, 428–434. [Google Scholar] [CrossRef] [PubMed] [Green Version]
  22. Crump, M.J.C.; McDonnell, J.V.; Gureckis, T.M. Evaluating Amazon’s Mechanical Turk as a Tool for Experimental Behavioral Research. PLoS ONE 2013, 8, e57410. [Google Scholar] [CrossRef] [PubMed] [Green Version]
  23. Miller, R.; Schmidt, K.; Kirschbaum, C.; Enge, S. Comparability, stability, and reliability of internet-based mental chronometry in domestic and laboratory settings. Behav. Res. Methods 2018, 50, 1345–1358. [Google Scholar] [CrossRef]
  24. Anwyl-Irvine, A.L.; Massonnié, J.; Flitton, A.; Kirkham, N.; Evershed, J.K. Gorilla in our midst: An online behavioral experiment builder. Behav. Res. Methods 2020, 52, 388–407. [Google Scholar] [CrossRef] [Green Version]
  25. Parker, A.J.; Egan, C.; Grant, J.H.; Harte, S.; Hudson, B.T.; Woodhead, Z.V. The role of orthographic neighbourhood effects in lateralized lexical decision: A replication study and meta-analysis. PeerJ 2021, 9, e11266. [Google Scholar] [CrossRef] [PubMed]
  26. Parker, A.J.; Woodhead, Z.V.; Thompson, P.A.; Bishop, D.V. Assessing the reliability of an online behavioural laterality battery: A pre-registered study. Laterality 2021, 26, 359–397. [Google Scholar] [CrossRef]
  27. Parker, S.K.; Grote, G. Automation, algorithms, and beyond: Why work design matters more than ever in a digital world. Appl. Psychol. 2022, 71, 1171–1204. [Google Scholar] [CrossRef]
  28. Mitchell, A.G.; Kandt, P.O.; McIntosh, R.D. On line bisection: Validity and reliability of online measures of pseudoneglect. Laterality 2022, 27, 443–466. [Google Scholar] [CrossRef]
  29. Milner, A.D.; Brechmann, M.; Pagliarini, L. To halve and to halve not: An analysis of line bisection judgements in normal subjects. Neuropsychologia 1992, 30, 515–526. [Google Scholar] [CrossRef]
  30. Schmitz, R.; Dehon, H.; Peigneux, P. Lateralized processing of false memories and pseudoneglect in aging. Cortex 2013, 49, 1314–1324. [Google Scholar] [CrossRef]
  31. Harvey, M.; Pool, T.D.; Roberson, M.J.; Olk, B. Effects of visible and invisible cueing procedures on perceptual judgments in young and elderly subjects. Neuropsychologia 2000, 38, 22–31. [Google Scholar] [CrossRef] [PubMed]
  32. Learmonth, G.; Benwell, C.S.Y.; Thut, G.; Harvey, M. Age-related reduction of hemispheric lateralisation for spatial attention: An EEG study. NeuroImage 2017, 153, 139–151. [Google Scholar] [CrossRef] [PubMed]
  33. Harvey, M. Perceptual and Premotor Neglect: Is there an Ideal Task to Categorise Patients? Cortex 2004, 40, 323–328. [Google Scholar] [CrossRef] [PubMed]
  34. Mitchell, A.G.; Harris, J.M.; Benstock, S.E.; Ales, J.M. The reliability of pseudoneglect is task dependent. Neuropsychologia 2020, 148, 107618. [Google Scholar] [CrossRef] [PubMed]
  35. Gray, O.; Fry, L.; Montaldi, D. Information content best characterises the hemispheric selectivity of the inferior parietal lobe: A meta-analysis. Sci. Rep. 2020, 10, 15112. [Google Scholar] [CrossRef] [PubMed]
  36. Schindler, I.; Clavagnier, S.; Karnath, H.O.; Derex, L.; Perenin, M.T. A common basis for visual and tactile exploration deficits in spatial neglect? Neuropsychologia 2006, 44, 1444–1451. [Google Scholar] [CrossRef]
  37. Li, J.; Leider, S.; Beil, D.; Duenyas, I. Running online experiments using web-conferencing software. J. Econ. Sci. Assoc. 2021, 7, 167–183. [Google Scholar] [CrossRef]
  38. Faul, F.; Erdfelder, E.; Lang, A.G.; Buchner, A. G* Power 3: A flexible statistical power analysis program for the social, behavioral, and biomedical sciences. Behav. Res. Methods 2007, 39, 175–191. [Google Scholar] [CrossRef]
  39. Bradshaw, J.L.; Gates, A.; Patterson, K. Hemispheric differences in processing visual patterns. Q. J. Exp. Psychol. 1976, 28, 667–681. [Google Scholar] [CrossRef]
  40. Scarisbrick, D.J.; Tweedy, J.R.; Kuslansky, G. Hand preference and performance effects on line bisection. Neuropsychologia 1987, 25, 695–699. [Google Scholar] [CrossRef]
  41. Friedrich, T.E.; Hunter, P.V.; Elias, L.J. The trajectory of pseudoneglect in adults: A systematic review. Neuropsychol. Rev. 2018, 28, 436–452. [Google Scholar] [CrossRef] [PubMed] [Green Version]
  42. Learmonth, G.; Papadatou-Pastou, M. A meta-analysis of line bisection and landmark task performance in older adults. Neuropsychol. Rev. 2022, 32, 438–457. [Google Scholar] [CrossRef]
  43. Benwell, C.S.Y.; Thut, G.; Learmonth, G.; Harvey, M. Spatial attention: Differential shifts in pseudoneglect direction with time-on-task and initial bias support the idea of observer subtypes. Neuropsychologia 2013, 51, 2747–2756. [Google Scholar] [CrossRef] [PubMed] [Green Version]
  44. McCourt, M.E.; Jewell, G. Visuospatial attention in line bisection: Stimulusmodulation of pseudoneglect. Neuropsychologia 1999, 37, 843–855. [Google Scholar] [CrossRef]
  45. Lee, A.C.; Harris, J.P.; Atkinson, E.A.; Fowler, M.S. Evidence from a line bisection task for visuospatial neglect in Left Hemiparkinson’s disease. Vis. Res. 2001, 41, 2677–2686. [Google Scholar] [CrossRef] [Green Version]
  46. Marshall, J.C.; Halligan, P.W. When Right Goes Left: An Investigation of Line Bisection in a Case of Visual Neglect. Cortex 1989, 25, 503–515. [Google Scholar] [CrossRef] [PubMed]
  47. Milner, A.D.; Harvey, M.; Roberts, R.C.; Forster, S.V. Line bisection errors in visual neglect: Misguided action or size distortion? Neuropsychologia 1993, 31, 39–49. [Google Scholar] [CrossRef]
  48. McCourt, M.E. Performance consistency of normal observers in forced-choice tachistoscopic visual line bisection. Neuropsychologia 2001, 39, 1065–1076. [Google Scholar] [CrossRef]
  49. Heber, I.A.; Siebertz, S.; Wolter, M.; Kuhlen, T.; Fimm, B. Horizontal and vertical pseudoneglect in peri-and extrapersonal space. Brain Cogn. 2010, 73, 160–166. [Google Scholar] [CrossRef]
  50. Oldfield, R.C. Edinburgh handedness inventory. J. Abnorm. Psychol. 1971. [Google Scholar] [CrossRef]
  51. Prins, N.; Kingdom, F.A.A. Applying the model-comparison approach to test specific research hypotheses in psychophysical research using the Palamedes toolbox. Front. Psychol. 2018, 9, 1250. [Google Scholar] [CrossRef] [Green Version]
  52. Prins, N. The psychometric function: The lapse rate revisited. J. Vis. 2012, 12, 25. [Google Scholar] [CrossRef]
  53. Learmonth, G.; Gallagher, A.; Gibson, J.; Thut, G.; Harvey, M. Intra- and Inter-Task Reliability of Spatial Attention Measures in Pseudoneglect. PLoS ONE 2015, 10, e0138379. [Google Scholar] [CrossRef] [Green Version]
  54. Bisiach, E.; Rusconi, M.L.; Peretti, V.A.; Vallar, G. Challenging current accounts of unilateral neglect. Neuropsychologia 1994, 32, 1431–1434. [Google Scholar] [CrossRef]
  55. Brooks, J.L.; Darling, S.; Malvaso, C.; Della Sala, S. Adult developmental trajectories of pseudoneglect in the tactile, visual and auditory modalities and the influence of starting position and stimulus length. Brain Cogn. 2016, 103, 12–22. [Google Scholar] [CrossRef] [Green Version]
  56. Harvey, M.; Krämer-McCaffery, T.; Dow, L.; Murphy, P.J.; Gilchrist, I.D. Categorisation of ‘perceptual’and ‘premotor’neglect patients across different tasks: Is there strong evidence for a dichotomy? Neuropsychologia 2002, 40, 1387–1395. [Google Scholar] [CrossRef] [PubMed] [Green Version]
  57. Çiçek, M.; Deouell, L.Y.; Knight, R.T. Brain activity during landmark and line bisection tasks. Front. Hum. Neurosci. 2009, 3, 7. [Google Scholar] [CrossRef] [PubMed] [Green Version]
  58. Hausmann, M.; Ergun, G.; Yazgan, Y.; Güntürkün, O. Sex differences in line bisection as a function of hand. Neuropsychologia 2002, 40, 235–240. [Google Scholar] [CrossRef] [PubMed]
  59. Chen, P.; Goedert, K.M.; Murray, E.; Kelly, K.; Ahmeti, S.; Barrett, A.M. Spatial bias and right hemisphere function: Sex-specific changes with aging. J. Int. Neuropsychol. Soc. 2011, 17, 455–462. [Google Scholar] [CrossRef] [Green Version]
Figure 1. (A) Line bisection task. A black square outline appeared randomly in 2 positions along the vertical axis, and participants were asked to bring the mouse pointer to the center of the square. Then, for a time that randomly varied between 1000 and 1500 ms, a central fixation cross appeared. Participants were then told to bisect the line by dragging the mouse cursor and clicking the line’s perceived midpoint with the mouse. (B) Landmark task. A fixation cross appeared for 1000 ms; then, a pre-bisected line was presented for 150 ms. Participants performed a single-interval forced-choice decision regarding which side of the bisected line was longer using buttons on a mouse. In both tasks, participants had 5000 ms to respond.
Symmetry 15 00729 g001
Figure 2. Psychometric fits from the landmark task. (A), psychometric fits from the landmark task from one of the participants. (B), the psychometric fit for data averaged across all subjects.
Symmetry 15 00729 g002
Figure 3. Box plot representing the mean bias for the landmark and line bisection tasks. Participants showed a leftward bias in both tasks.
Symmetry 15 00729 g003
Figure 4. Scatter plot and density plots showing the distribution of the biases (mm) for the line and landmark tasks.
Symmetry 15 00729 g004
Disclaimer/Publisher’s Note: The statements, opinions and data contained in all publications are solely those of the individual author(s) and contributor(s) and not of MDPI and/or the editor(s). MDPI and/or the editor(s) disclaim responsibility for any injury to people or property resulting from any ideas, methods, instructions or products referred to in the content.

