Article

Gravitational Acceleration Test Results According to Functional Movement Screen and Morphological Symmetry Results of Air Force Cadets

1
Department of Aero Fitness, Republic of Korea Air Force Academy, 635, Danjea-ro, Nail-myeon, Sangdang-gu, Cheongju-si 28311, Republic of Korea
2
Department of Sport Science, Kangwon National University, Chuncheon-si 24341, Republic of Korea
3
Korea Coach Association for Strength & Conditioning, 19, Yangjae-daero 96-gil, Gangdong-gu, Seoul 05372, Republic of Korea
4
Division in Anatomy and Developmental Biology, Department of Oral Biology, Human Identification Research Institute, BK21 FOUR Project, Yonsei University College of Dentistry, Seoul 03722, Republic of Korea
*
Author to whom correspondence should be addressed.
Symmetry 2023, 15(4), 804; https://doi.org/10.3390/sym15040804
Submission received: 26 February 2023 / Revised: 17 March 2023 / Accepted: 24 March 2023 / Published: 26 March 2023
(This article belongs to the Special Issue Symmetry/Asymmetry in Musculoskeletal Science)

Abstract

:
Objectives: Strong physical abilities and morphological symmetry are important factors for pilots to withstand aerial G-tolerance. Therefore, this study aimed to determine the symmetry difference between cadets by measuring functional movement screen (FMS) and functional leg length of Korea Air Force cadets for the first time and to understand the pass–fail relationship of the G-test by variable. Methods: Altogether, 72 fourth-year cadets (male, 72; mean age, 23.8 ± 0.6) were included in the study, and their body composition, FMS, functional leg length, and G-test results were measured. Results: The G-test results according to the FMS score revealed that the G-test passed (GP) group scored significantly higher than the G-test failed (GF) group in terms of the following: hurdle step (p =0.000), inline lunge (p = 0.006), active straight leg raise (p = 0.001), and T = trunk stability push-ups (p = 0.001). Conclusions The G-test results according to leg length demonstrated a significant difference between both groups. Morphological symmetry of leg length is an important factor in the functional aspect of exercise and exercise persistence. Moreover, a high G-test success rate can be expected if a follow-up study is conducted to improve the symmetry and balance of the body of air force cadets.

1. Introduction

To become a pilot of F-15K and F-35 jets, the best fighter jets currently operated by the Air Force, one must pass 7G for 20 s (F-15K) and 9G for 15 s (F-35) (1G = 1 × body weight). The G-test is a high-intensity physical activity that is greatly influenced by individual body composition and physical strength, and the physical performance levels of F-15K and F-35 fighter pilots are almost the same as those of world-class athletes [1]. Continuous exposure to high G above 7G can lead to musculoskeletal injuries, such as those of the cervical and lumbar vertebrae [2,3,4]. In fact, 36% of South Korean pilots complain of back pain. However, research specifically determining the causes of such injuries remains lacking.
To prevent spinal injuries from high G during pilot missions, morphological symmetry is critical. Leg length differences are commonly referred to as leg length inequality (LLI) or leg length discrepancy and are generally classified into structural length inequality and functional LLI [5]. Previous studies have reported that the larger the difference in functional leg length, the higher the chronic tension of the spinal cord [6], thus resulting in pain and scoliosis; a difference of >5 mm can cause injury and affect muscle strength and range of motion [7].
Hence, measuring the functional movement screen (FMS) and functional leg length to predict physical performance improvement, injury risk, and morphological symmetry of an air force cadet, a preliminary pilot, would be a critical process. FMS is commonly used to examine underlying exercise patterns [8]. The FMS is used as a measurement tool to assess not only individual limitations and asymmetry along the exercise chain but also the quality of basic exercise patterns. The reliability between and within the measurement classes of the FMS has already been demonstrated in previous studies [9,10]. The FMS comprises seven basic mobility tests that require mobility, stability, and balance. Each test is scored on a scale of 0 to 3 based on the execution of a particular movement pattern, with a maximum score of 21 points. Competitors with ≤14 points are classified as having a high risk of injury [11].
Functional movement can be defined as the ability to effectively identify dysfunction, reduce the likelihood of potential injury, improve exercise function, and ultimately improve quality of life [12]. Therefore, the current study analyzes the symmetry difference between cadets by measuring FMS and functional leg length, which has not been previously attempted for air force cadets, and aims to understand the pass–fail relationship of the G-test by variable. Based on the results of this study, the physical imbalance of cadets was evaluated to predict and educate on injuries.

2. Materials and Methods

2.1. Participants

Altogether, 72 senior cadets (male, 72; mean age, 23.8 ± 0.6; mean ± standard deviation) who conducted the G-test in 2022 were recruited from the Republic of Korea Air Force Academy. The participants were classified into the no gravity induced loss of consciousness (G-LOC) (G-test passed group; GP) and G-LOC (G-test failed group; GF) groups according to their G-test results (Figure 1). Before this study was conducted, all the participants were provided with a detailed description of the purpose, methods, and risks of the study and were informed that if they desired, they could withdraw from the experiment at any time. Subsequently, they signed an informed consent form. The injured, those who did not conduct G-test, and those who did not wish to participate in the study were excluded. This study was approved by the Institutional Bioethics Committee of the Air Force Aerospace Medical Center (ASMC-22-IRB-002).
The physical characteristics of the participants are summarized in Table 1.

2.2. Body Composition Measurement

Body composition was measured 2 weeks before the G-test, and the test was conducted at 07:00 am to ensure the participants had an empty stomach. Body composition measurements, including weight (kg), skeletal muscle mass (%), body fat mass (kg), and body mass index (kg/m2), were measured using Inbody 720 (Biospace Cop, Seoul, Republic of Korea).

2.3. G-Test

The G-test was performed using high-speed centrifugal gondolas (ETC Cop, New York, NY, USA) located at the Air Force Academy of Aerospace Medical Center. The participants sat in cockpit seats and performed a G-test for 30 s at 5 G acceleration of gravity. Immediately after the start, the gondola started rotating at a speed of 0.8 G, and acceleration of gravity to 5 G began as soon as the participants pulled the lever. The measurement ended 30 s after the start or when the participant pushed the lever or lost consciousness due to gravity-induced loss of consciousness (G-LOC). G-LOC was declared when the participant met all of the following criteria: bent forward upper body, non-arbitrary eye closing, and mouth opening due to the acceleration of gravity. Before the start of the G-test, instructors with >20 years of experience conducted training on postures, L-1 breathing methods (anti-G training maneuvers), and the precautions required for the G-test.

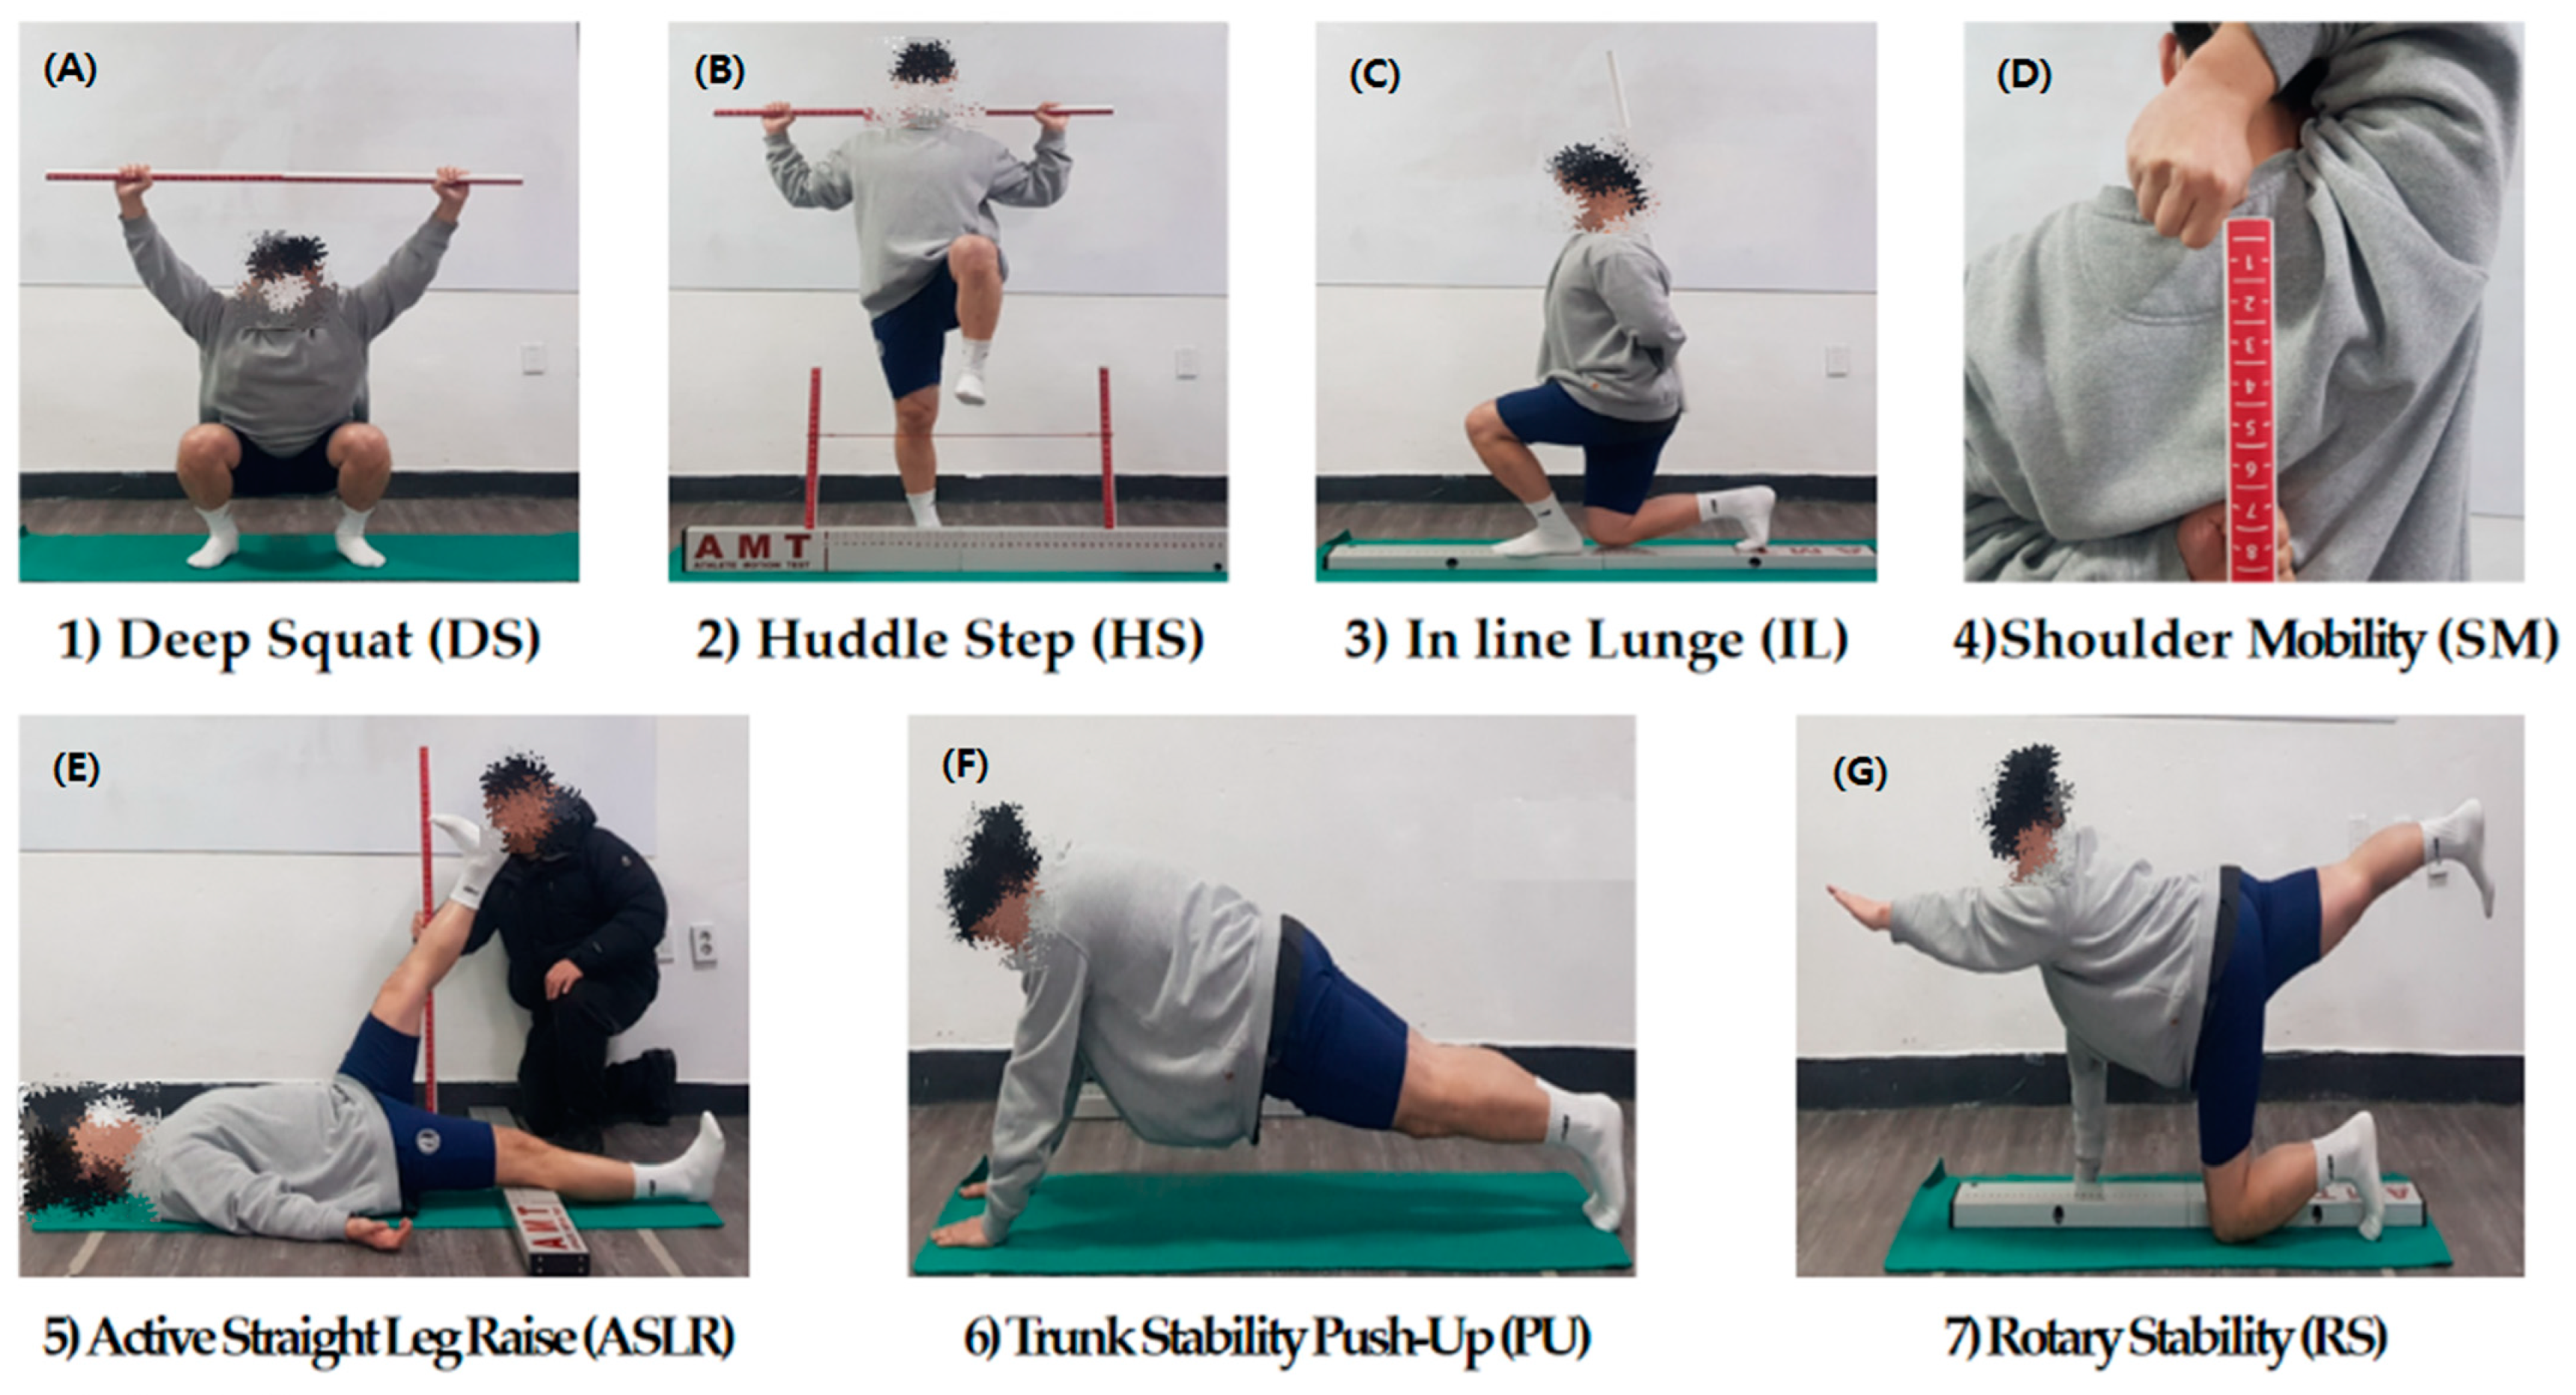
2.4. FMS Measurements

The participants were screened using an FMS (AMT Cop, Seoul, Republic of Korea) protocol that comprised the following seven movement patterns: deep overhead squat, inline lunge, hurdle step, active straight leg raise, trunk stability push-up, shoulder mobility, and rotary stability(Figure 2).
The participants were provided three trials for each movement pattern, and each trial was scored on a 3-point scale according to the FMS rater manual and previous research [11]. The scores indicated the following: 0, if pain occurred during a test; 1, if the participant could not perform the movement; 2, if the participant could complete the movement but compensated in some way; and 3, if the participant performed the movement correctly [13].
In this study, five movements (hurdle step, inline lunge, shoulder mobility, active straight leg raise, and rotary stability) were additionally analyzed on each side to identify physical imbalance.

2.5. Leg Length Measurements

All measurements were made using the tape measure method, and the average value was calculated three times for both sides with the participants in supine and standing positions while wearing light clothes. All the measurements were conducted according to the following: ASIS-MM, distance from the anterior superior iliac spine (ASIS) to the medial malleolus; ASIS-HF, distance from the ASIS to the fibular head of the fibula; and ASIS-G, distance from ASIS to the ground.

2.6. Statistical Analysis

For data processing, the mean and standard deviation of all data were calculated using the SPSS version 22 (IBM Corp, Armonk, NY, USA) statistical program. An independent sample t-test was used to analyze the difference in FMS and leg length based on G-test results. In addition, correlation analysis was conducted to confirm the relationships between all variables. The normality distribution of all factors was confirmed, and the significance level of hypothesis verification was p < 0.05.

3. Results

3.1. G-Test Results by FMS Score

Compared to the GF group, the GP group had significantly higher results in the hurdle step of the right (p = 0.000), inline lunge of the left (p = 0.006), active straight leg raise (p = 0.022), active straight leg raise of the left (p = 0.001), and trunk stability push-up (p = 0.000). In the case of shoulder mobility (p = 0.008), the GF group had significantly higher results than the GP group (Table 2).

3.2. G-Test Results According to LLI

Compared the GP group, the GF group had significantly higher results in terms of length of the ASIS-MM of the right (p = 0.034), ASIS-MM of the left (p = 0.014), ASIS-G of the right (p = 0.010), and ASIS-G of the left (p = 0.006) (Table 3).

3.3. Comparison of LLI According to G-Test Passed and Failed Groups

In the GP group, no significant differences in any of the factors were observed (Table 4). In the GF group, a significant difference was observed between ASIS-MM (p = 0.001) and ASIS-HF (p = 0.002). The left side of the ASIS-G was longer than the right side (p = 0.069). However, no significant difference in the ASIS-G leg length was observed in the two groups (Table 5).

3.4. Coefficients for Pearson’s Correlation between FMS Score and Leg Length

Considering the relationships between FMS score and leg length, active straight leg raise was significantly correlated with ASIS-MM of the right leg (p = 0.041), and rotary stability was significantly correlated with ASIS-HF of the left leg (p = 0.039).
The total score was significantly correlated with the ASIS-MM of the right hemisphere (p = 0.025) (Table 6).

4. Discussion

This study was conducted to analyze the effect of success or failure of the G-test on Korea Air Force Academy cadets based on differences in FMS scores and leg length in morphological symmetry factors and to predict injuries.
Functional movement refers to “the ability to perform functional maintenance and stabilisation actions while maintaining control in the motor chain” [12]. The FMS is useful for evaluating deficiencies in certain movements [14], and Cook et al. [11] have reported that periodic FMS evaluations have a positive effect on damage prevention and motor function improvement. An FMS total score of <14 points indicates a relative injury risk of 1.87 [15].
According to the results of this study, the overall score was ≤14 points in the GP and GF groups. These results support those of a previous study that showing air force cadets perform activities at the elite athlete level, requiring similar physical factors and being vulnerable to injury [1] because the G-test is a high-intensity physical activity that is greatly influenced by individual body composition and physical strength. Chorba et al. [16] have indicated neuromuscular control, reduced core muscle stability, and skeletal muscle imbalance as important intrinsic risk factors for injury. The low FMS score indicates asymmetry according to the imbalance, and in this study, a statistically significant correlation was confirmed when the correlation between morphological factors of leg length and FMS score was identified. These results are consistent with those of studies demonstrating FMS as a useful tool for assessing specific movement deficits [14].
In the measurement items (deep squats, hurdle stubs, inline lunges, and active straight leg raises), which are deeply related to the morphological structure of the lower extremities, the GP group scored significantly higher than the GF group. The GP group demonstrated higher mobility, stability, and control of the hip, knee, and both sides of the ankles, as well as equal load distribution and core control at asymmetric locations, than the GF group [17]. This strong power zone strengthens the spine and core muscles, and the stability of the core muscles creates balanced movements, such as those of the spine and pelvis [18], and acts as a driving force for continuously pushing the footrest under control during the G-test. Furthermore, the strengthening of the spine and core lower body muscles increases muscle strength and endurance, maintains high peripheral pressure in high-acceleration situations, and plays a positive role in preventing G-LOC due to acceleration [19].
A program that fits all approaches is not the most effective [20]. An appropriate musculoskeletal damage screening process must first be identified to improve the effectiveness of injury prevention programs. Thus, using an injury prevention program and a post-injury exercise prescription program using various measurement tools is important. The FMS is a measurement tool that ultimately establishes symmetry and reaches a balance between mobility and stability [15], and its effectiveness increases when used with exercise programs [21]. Therefore, developing a program that can be applied to cadets along with FMS measurement will have a positive effect on injury prevention and motor function improvement. Therefore, using FMS as a preventive and selective measure to prevent injuries and improve the training performance of cadets is expected to bring time and economic benefits.
The limitation of this study was that it was conducted only on cadets, who were preliminary pilots, and only on male cadets, and the subject’s past–current injury history was not identified. The pathological histories of cadets, who are preliminary pilots and quasi-soldiers, were difficult to disclose, so they could not be used in this study. In addition, habitual physical activity was not assessed.

5. Conclusion

As this study was conducted only on senior cadets attending the Korea Air Force Academy, investigating the functional movement test and leg length imbalance of all cadets was not possible. Nevertheless, this is the first study to investigate the functional movement and lower extremity imbalance of cadets using the FMS, and a significant relationship was revealed with the G-test results. Based on the results of this study, preventing injuries in cadets by investigating physical activities and the risk of damage will be helpful. However, identifying each cadet’s medical history, past or current injuries, and pain areas has limitations. Thus, a close examination of the medical history or pain due to damage before conducting analysis and measurement will provide more meaningful results.

Author Contributions

Conceptualization: D.-R.L., J.-Y.S. and D.-H.J.; data curation: D.-R.L., J.-Y.S. and D.-H.J.; formal analysis: K.-L.L.; methodology: J.-Y.S. and K.-L.L.; project administration: K.-L.L.; visualization: D.-R.L., J.-Y.S. and D.-H.J.; writing—original draft: K.-L.L. and D.-H.J.; writing—review and editing: J.-Y.S. All authors have read and agreed to the published version of the manuscript.

Funding

This study was conducted with the support of the aerospace medical research project in 2022. Publication fee: This research was supported by the Basic Science Research Program through the National Research Foundation of Korea (NRF) funded by the Ministry of Education (NRF-2022R1I1A1A01063123).

Data Availability Statement

Not applicable.

Acknowledgments

We would like to thank the officials of the Air Force Aerospace Medical Center for their help in the research. We would like to thank Editage (www.editage.co.kr) for English language editing.

Conflicts of Interest

The authors declare no conflict of interest.

References

  1. Shin, S.H. A correlation pilot-study of F-15/16 pilots’ ACTN-3, G-tolerance, and body compositions. Exerc. Sci. 2018, 27, 80–88. [Google Scholar] [CrossRef]
  2. Gore, R.K.; Webb, T.S.; Hermes, E.D. Fatigue and stimulant use in military fighter aircrew during combat operations. Aviat. Space Environ. Med. 2010, 81, 719–727. [Google Scholar] [CrossRef]
  3. Shiri, R.; Frilander, H.; Sainio, M.; Karvala, K.; Sovelius, R.; Vehmas, T.; Viikari-Juntura, E. Cervical and lumbar pain and radiological degeneration among fighter pilots: A systematic review and meta-analysis. Occup. Environ. Med. 2015, 72, 145–150. [Google Scholar] [CrossRef]
  4. Chumbley, E.M.; Stolfi, A.; McEachen, J.C. Risk factors for cervical pain in F-15C pilots. Aerosp. Med. Hum. Perform. 2017, 88, 1000–1007. [Google Scholar] [CrossRef]
  5. Walsh, M.; Connolly, P.; Jenkinson, A.; O’Brien, T. Leg length discrepancy—An experimental study of compensatory changes in three dimensions using gait analysis. Gait. Posture. 2000, 12, 156–161. [Google Scholar] [CrossRef]
  6. Dae-Yeon Yoon, O.M.D.; Jin-Seo Choi, O.M.D.; Su-Hyun Jeong, O.M.D.; Soon-Joong Kim, O.M.D. The analysis of erector spinae muscle on difference of functional leg length inequality—Through meridian electromyography. J. Oriental. Rehabil. Med. 2011, 21, 13–20. [Google Scholar]
  7. Tippett, S.R. Lower extremity strength and active range of motion in college baseball pitchers: A comparison between stance leg and kick leg. J. Orthop. Sports Phys. Ther. 1986, 8, 10–14. [Google Scholar] [CrossRef] [Green Version]
  8. Minthorn, L.M.; Fayson, S.D.; Stobierski, L.M.; Welch, C.E.; Anderson, B.E. The Functional Movement Screen’s ability to detect changes in movement patterns after a training intervention. J. Sport Rehabil. 2015, 24, 322–326. [Google Scholar] [CrossRef]
  9. Gulgin, H.; Hoogenboom, B. The functional movement screening (FMS)™: An inter-rater reliability study between raters of varied experience. Int. J. Sports Phys. Ther. 2014, 9, 14–20. [Google Scholar]
  10. Fallahasady, E.; Rahmanloo, N.; Seidi, F.; Rajabi, R.; Bayattork, M. The relationship between core muscle endurance and functional movement screen scores in females with lumbar hyperlordosis: A cross-sectional study. BMC Sports Sci. Med. Rehabil. 2020, 14, 182. [Google Scholar] [CrossRef]
  11. Cook, G.; Burton, L.; Hoogenboom, B. Pre-participation screening: The use of fundamental movements as an assessment of function–Part 1. N. Am. J. Sports Phys. Ther. 2006, 1, 62–72. [Google Scholar]
  12. Cook, G.; Burton, L.; Hoogenboom, B. Pre-participation screening: The use of fundamental movements as an assessment of function–Part 2. N. Am. J. Sports Phys. Ther. 2006, 1, 132–139. [Google Scholar]
  13. Lockie, R.G.; Schultz, A.B.; Callaghan, S.J.; Jordan, C.A.; Luczo, T.M.; Jeffriess, M.D. A preliminary investigation into the relationship between functional movement screen scores and athletic physical performance in female team sport athletes. Biol. Sport 2015, 32, 41–51. [Google Scholar] [CrossRef]
  14. Bardenett, S.M.; Micca, J.J.; DeNoyelles, J.T.; Miller, S.D.; Jenk, D.T.; Brooks, G.S. Functional movement screen normative values and validity in high school athletes: Can the FMS™ be used as a predictor of injury? Int. J. Sports Phys. Ther. 2015, 10, 303–308. [Google Scholar]
  15. Kiesel, K.; Plisky, P.; Butler, R. Functional movement test scores improve following a standardized off-season intervention program in professional football players. Scand. J. Med. Sci. Sports 2016, 21, 287–292. [Google Scholar] [CrossRef]
  16. Chorba, R.S.; Chorba, D.J.; Bouillon, L.E.; Overmyer, C.A.; Landis, J.A. Use of a functional movement screening tool to determine injury risk in female collegiate athletes. N. Am. J. Sports Phys Ther. 2010, 5, 47–54. [Google Scholar]
  17. Lee, M.R.; Kim, J.H.; Lee, M.R.; Kim, J.H. The effects of self-myofascial release before weight training on functional movement and delayed-onset muscle soreness. Exerc Sci. 2022, 31, 88–97. [Google Scholar] [CrossRef]
  18. Akuthota, V.; Ferreiro, A.; Moore, T.; Fredericson, M. Core stability exercise principles. Curr. Sports Med. Rep. 2008, 7, 39–44. [Google Scholar] [CrossRef]
  19. Kim, I.K.; Jeong, D.H.; Sung, J.Y.; Kim, K.S. Analysis of G-test results according to fatigue, physical fitness and body composition of Air Force cadets using smart watches. Exerc. Sci. 2022, 31, 98–104. [Google Scholar] [CrossRef]
  20. Hewett, T.E.; Ford, K.R.; Myer, G.D. Anterior cruciate ligament injuries in female athletes: Part 2, a meta-analysis of neuromuscular interventions aimed at injury prevention. Am. J. Sports Med. 2006, 34, 490–498. [Google Scholar] [CrossRef]
  21. Cuchna, J.W.; Hoch, M.C.; Hoch, J.M. The interrater and intrarater reliability of the functional movement screen: A systematic review with meta-analysis. Phys. Ther. Sport 2016, 19, 57–65. [Google Scholar] [CrossRef] [PubMed]
Figure 1. Experimental design.
Symmetry 15 00804 g001
Figure 2. FMS measurements.
Symmetry 15 00804 g002
Table 1. Description of the participant’s physical characteristics.
FactorsGP (n = 40)GF (n = 32)
Height (cm)173.47 ± 5.02172.54 ± 8.57
Body weight (kg)72.91 ± 7.7169.05 ± 8.94
Skeletal muscle mass (kg)34.37 ± 5.4831.93 ± 5.46
Fat mass (kg)12.47 ± 2.8112.43 ± 2.32
Body fat (%)17.39 ± 5.0018.27 ± 4.15
Body mass index (kg/m2)24.17 ± 1.5423.11 ± 1.53
Values are expressed as mean ± standard deviation. GP, G-test passed; GF, G-test failed.
Table 2. G-test results according to functional movement screen scores.
FactorGP (n = 40)GF (n = 32)tp
Deep squatTotal2.05 ± 0.601.94 ± 0.0620.7820.782
Hurdle stepTotal1.60 ± 0.591.50 ± 0.620.6970.686
Right1.73 ± 0.721.22 ± 0.42 ***0.3540.000
Left1.75 ± 0.711.31 ± 0.592.8000.126
Inline lungeTotal1.65 ± 0.581.50 ± 0.511.1520.642
Right1.68 ± 0.571.69 ± 0.47−0.0990.153
Left1.73 ± 0.451.50 ± 0.51 **1.9860.006
Shoulder mobilityTotal1.98 ± 0.58 **2.41 ± 0.67−2.9450.008
Right1.88 ± 0.562.41 ± 0.67−3.6690.019
Left2.03 ± 0.622.41 ± 0.67−2.5110.036
Active straight leg raiseTotal1.84± 0.591.63 ± 0.51 *−1.6610.022
Right1.65 ± 0.551.63 ± 0.49−1.4020.186
Left1.88 ± 0.421.63 ± 0.59 ***−1.2700.001
Trunk stability push-upTotal2.08 ± 0.571.97 ± 0.18 ***1.0110.000
Rotary stabilityTotal2.30 ± 0.462.31 ± 0.47−0.1130.823
Right2.30 ± 0.462.31 ± 0.47−0.1130.823
Left2.23 ± 0.662.31 ± 0.47−0.6320.114
Total score 13.29 ± 2.1213.47 ± 2.11−0.2370.962
Values are expressed as mean ± standard deviation. * p < 0.05, ** p < 0.01, and *** p < 0.001 vs. GP by t-test. GP, G-test passed; GF, G-test failed.
Table 3. G-test results according to leg length difference.
Factor GP (n 40)GF (n 32)tp
ASIS-MMRight89.36 ± 3.5389.70 ± 5.16 *−0.3390.034
Left89.48 ± 3.1090.29 ± 4.93 *−0.8540.014
ASIS-HFRight55.35 ± 6.5853.78 ± 3.461.2200.743
Left55.49 ± 6.4154.29 ± 3.030.9670.497
ASIS-GRight96.36 ± 3.5896.47 ± 5.46 **−0.0990.010
Left96.58 ± 3.6396.85 ± 5.80 **−0.2360.006
Values are expressed as mean ± standard deviation. * p < 0.05, ** p < 0.01, and vs. GP by t-test. GP, G-test passed; GF, G-test failed.
Table 4. Leg length inequality in the G-test passed group.
FactorRightLefttp
ASIS-MM89.36 ± 3.5389.48 ± 3.100.5860.561
ASIS-HF55.35 ± 6.5855.49 ± 6.411.0770.288
ASIS-G96.36 ± 3.5896.58 ± 3.631.0100.319
Table 5. Leg length inequality in the G-test failed group.
FactorRightLefttp
ASIS-MM89.70 ± 5.1690.29 ± 4.93 ***3.8480.001
ASIS-HF53.78 ± 3.4654.29 ± 3.03 **3.2910.002
ASIS-G96.47 ± 5.4696.85 ± 5.801.8830.069
Values are expressed as mean ± standard deviation. Values are expressed as mean ± standard deviation. ** p < 0.01, *** p < 0.001 vs. GF by t-test.
Table 6. Coefficients for Pearson’s correlation between FMS score and leg length.
FactorDSHSILSMASLRTSPURSTSFLLRFLLLAHLLRAHLLLAGLLRAGLLL
DS
HS0.052 **
IL0.296 *0.665 **
SM0.179−0.204−0.157
ASLR0.497 **0.587 **0.440 **0.283 *
TSPU0.420 **0.258 *0.279 *−0.1140.314 **
RS−0.201−0.314 **−0.1010.249 *−0.156−0.453 **
TS0.753 **0.700 **0.635 **0.363 **0.7880.442 **−0.027
FLLR−0.165−0.1110.023−0.332 **−0.241 *0.042−0.173−0.265 *
FLLL−0.183−0.0420.380−0.348 **−0.1870.036−0.149−0.2180.962 **
AHLLR−0.1080.136−0.116−0.234 *−0.024−0.018−0.224−0.1550.2170.311 **
AHLLL−0.0600.134−0.144−0.1910.7230.013−0.243 *−0.1180.1730.255 *0.988 **
AGLLR−0.238 **0.0800.136−0.344 **−0.1240.026−0.203−0.1840.896 **0.898 **0.367 **0.428 **
AGLLL−0.2010.0600.137−0.366 **−0.1210.074−0.312 **−0.1930.915 **0.902 **0.361 **0.409 **0.936 **
DS, deep squat; HS, hurdle step; IL, inline lunge; SM, shoulder mobility; ASLR, active straight leg raise; TSPU, trunk stability push-up; RS, rotary stability; TS, total score; FLLR, ASIS-MM of the right; FLLL, ASIS-MM of the left; AHLLR, ASIS-HF of the right; AHLLR, ASIS-HF of the right; AGLLR, ASIS-G of the right; AGLLL, ASIS-G of the left. ** p < 0.01. * p < 0.05.
Disclaimer/Publisher’s Note: The statements, opinions and data contained in all publications are solely those of the individual author(s) and contributor(s) and not of MDPI and/or the editor(s). MDPI and/or the editor(s) disclaim responsibility for any injury to people or property resulting from any ideas, methods, instructions or products referred to in the content.

