Abstract
Meaningful representation of large-scale non-Euclidean structured data, especially in complex domains like network security and IoT system, is one of the critical problems of contemporary machine learning and deep learning. Many successful cases of graph-based models and algorithms deal with non-Euclidean structured data. However, It is often undesirable to derive node representations by walking through the complete topology of a system or network (graph) when it has a very big or complicated structure. An important issue is using neighborhood knowledge to deduce the symmetric network’s topology or graph. The traditional approach to solving the graph representation learning issue is surveyed from machine learning and deep learning perspectives. Second, include local neighborhood data encoded to the attention mechanism to define node solidarity and enhance node capture and interactions. The performance of the proposed model is then assessed for transduction and induction tasks that include downstream node categorization. The attention model taking clustering into account has successfully equaled or reached the state-of-the-art performance of several well-established node classification benchmarks and does not depend on previous knowledge of the complete network structure, according to experiments. Following a summary of the research, we discuss problems and difficulties that must be addressed for developing future graph signal processing algorithms and graph deep learning models, such as graph embeddings’ interpretability and adversarial resilience. At the same time, it has a very positive impact on network security and artificial intelligence security.
1. Introduction
Over the last several years, the discipline of graph deep learning has advanced remarkably quickly. It has developed into one of the areas of artificial intelligence study that is expanding the quickest from a minority subject and a small group of researchers. In addition to the fact that graphs come with a complete set of mathematical underpinnings, graph theory [1] also offers a beautiful theoretical framework. Based on this basis, we can examine, comprehend, and learn from complex systems in the actual world. More crucially, thanks to the prevalence of graph-structured data, the availability of billions of IoT network devices, the security knowledge graph containing attack and threat semantics, the development of sizable social networking platforms, extensive scientific interoperability, even COVID-19 modeling of protein molecular structures, the amount and quality of graph-structured data accessible to researchers have significantly increased in recent years. In numerous domains, including network security [2,3], IoT networks [4,5], Cyber-Physical System [6,7], social media [8,9,10], citation networks [11], structural biology [12,13], 3D modeling [14,15], and telecommunication networks [16,17,18,19], graph data are frequently utilized as an efficient data format to describe and extract complicated data patterns. Cyber-Physical Systems, Social Networks, Satellite Internet, Security Knowledge Graphs, molecular structure, and 3D lattices are all abstracted into graph-structured data in Figure 1.
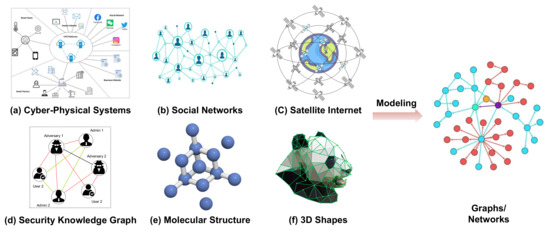
Figure 1.
Cyber-Physical Systems, Social Networks, Satellite Internet, Security Knowledge Graph, molecular structure, and 3D lattices are all abstracted into graph-structured data.
Deep neural network models such as Convolutional Neural Networks (CNN), Recurrent Neural Networks (RNN), Deep Belief Networks (DBN), deep auto-encoders, and Generative Adversarial Networks (GAN), often used currently have stolen the show in industrial fields such as computer vision [20,21], natural language processing [21,22,23,24], and recommender systems [25,26]. It is because any activity categorizing images or machine translation needs a low-dimensional data representation with a grid-like layout. Figure 2 depicts the extraction of text features using bag-of-words models and the extraction of picture characteristics using convolutional neural networks, respectively. However, many intriguing problems require data, not in a grid-like form but spread over irregular domains. A common term for structured data that resembles a grid is Euclidean data, whereas non-gridlike structured data found in atypical domains are referred to as non-Euclidean data. Non-Euclidean data do not have translation invariance, leading to traditional convolutional methods being very limited in processing non-Euclidean graph data. Traditional convolutional methods such as CNN and RNN, which have made a splash on tasks such as CV and NLP, cannot fix the convolutional kernel size to sample feature information. Consequently, graph convolutional networks (GCN) were first presented by Kipf et al. [27] in 2018. It can successfully handle end-to-end learning tasks such as node classification, link prediction, connection extraction, and anomaly detection as an extension of convolutional neural networks to the graph domain.
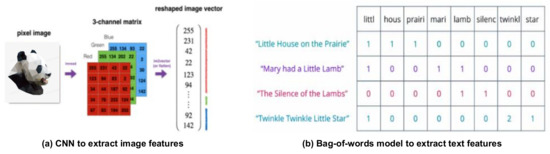
Figure 2.
Different techniques to extract features. (a) Using Convolutional Neural Network to select image features. (b) Using the Bag-of-words model to select text features.
Edges connect pairs of nodes in a non-Euclidean space. The nondirected graph is symmetric links only. The directed graph contains non-symmetric links. To model this structural information, it is crucial that for each node, we assign a learnable embedding based on their spatial relationships. In many time-series-based tasks, attention mechanisms have become standard facts for representing learning (embedding). In reality, it is more beneficial for people to make correct judgments after observing the whole picture of a thing. The human brain, however, can focus on the most recognizable part (or feature) of the thing quickly to make the corresponding judgment, rather than after observing the whole picture of the thing from beginning to end to have the judgment result. Based on this idea, the attention mechanism was created in the field of neural networks. The attention mechanism focuses on the most relevant part of the input to make a decision.
In learning graph representations, there is growing interest in incorporating graph structural knowledge into attention methods. Graph Attention Network (GAT) [28] was first proposed to weight the summation of neighboring node features using an attention mechanism, where the neighboring node weights depend entirely on the node features. Instead of explicitly recording structural linkages, particularly neighborhood ties, this family of approaches solely encodes feature interactions between nodes. There is evidence [29,30] show that most real-world networks in which nodes tend to create relatively tightly connected groups are more likely than the average probability of establishing a relationship between two nodes at random. We want to include clustering coefficients in the attention mechanism since they can more accurately assess the level of aggregation between node pairs. We may further illustrate the proposed model’s excellent expressive capability by altering the attention score by including clustering coefficients in the attention mechanism.
This research addresses the crucial problem of incorporating local knowledge encode to the attention process. The critical innovation we make is the addition of local clustering coefficients, which directly indicate the level of solidarity between nodes and afterward capture and interaction between nodes. That is distinct from the majority of the current graph attention techniques. This paper’s article structure is described as follows. Section 2 presents earlier research and related work first. The full description of our suggested strategy follows in Section 3. Our experimentation process and findings are presented in Section 4. Finally, in Section 5, we summarize the fundamental research and discuss problems and difficulties, such as the explainability and robustness of graph embeddings.
2. Preliminary
This section will outline the basics of graphs and attention mechanisms. For a given graph , where denotes nodes, E is a set of observable edges, and is the number of nodes. The features of node are denoted by . In a graph of N nodes, the features of all nodes are stored in .
2.1. Graph Attention
The Graph Convolutional Network performs well in node classification tasks and demonstrates how to combine local graph structure with node attributes. The trained model cannot generalize to different graph architectures because the GCN integrates surrounding node characteristics in a manner that is intimately tied to the graph’s structure. The Graph Attention Network puts forward a technique for weighting the sum of the attributes of surrounding nodes. GAT thinks that the graph structure does not affect the weights of the nearby node characteristics, which are solely determined by the node features. A collection of node features are provided as the input of GAT, , , and F is the dimensionality of each node feature. The layer node characteristics that were generated after updating the layer node features are technically described by the following equations.
where is the shareable weight matrix parameter, is the shareable weight vector parameter, and is the dimensionality of the hidden layer features.
2.2. Local Clustering Coefficient
According to traditional graph theory, the degree of node aggregation may be gauged using clustering coefficients. The clustering coefficients are divided into global and local clustering coefficients. Since the attention mechanism focuses more on local features, this paper attempts to introduce local clustering coefficients into the graph attention mechanism. The local clustering coefficients of nodes in a graph quantify the extent to which their neighboring nodes aggregate to form a complete graph. The first-order neighbor nodes of a node together form its neighborhood , and is the number of neighborhood nodes. The local clustering coefficient of a node is proportional to the ratio of the adjacent edges between nodes in the neighborhood and all possible contiguous edges in the neighborhood. For an orientation graph, the complete graph formed by the neighboring nodes of node has a total of edges. Therefore, the local clustering coefficient of an orientation graph is expressed as follows.
The total number of edges in the full undirected graph generated by node ’s neighbors is . As a result, Equation (5) may be used to represent the undirected graph’s local clustering coefficient.
The following formula may also be used to represent the local clustering coefficients.
where the value of is the number of triangles that may be built on the undirected graph G using the node v as the vertex, .
3. Cluster-Aware Attention Network for Graph
The Cluster-Aware Graph Attention Network (CA-GAT) for network representation learning and graph embedding tasks are covered in depth in this section. First, we go into great depth about CA-GAT’s significant attention score. The creation of a hiding layer for random CA-GAT is then described in this section. By stacking this hidden layer, any CA-GAT may be created, and multi-headed CA-GAT can further improve the capabilities of representation and embedding. The CA-GAT with many heads is then explicitly described. Finally, we demonstrate how our suggested technique may learn more node representations and execute graph convolution more effectively.
3.1. Attention Scores & Attention Weights
Typically, the attention score calculates the importance of neighbor node to the central node . GAT only calculates the propagation coefficient between the central node and its neighbor nodes. However, there is evidence that in various types of network structures reflecting the real world, especially in social network structures, individual nodes tend to form relatively high-density net clusters among themselves. That is, real-world networks have higher clustering coefficients than networks obtained by random connections between two nodes. Specifically, for any graph G, we consider an attention score function , which measures the spatial relationship between node and node in the graph, and the bias term chooses the local clustering coefficient mentioned in Section 2.2. The purpose of doing so is to make the attention score gain the ability to measure the clustering between nodes into clusters.
where the attention mechanism Attn is a single-layer feedforward neural network, which is parameterized by a shared weight parameter matrix W and a shared weight parameter vector . is the actual number of edges existing between neighbor nodes of node i. ‖ denotes the matrix splicing operation.
Next, use the SoftMax function to retrieve the attention weights, map the attention scores to the range , and make the normalized attention scores total 1.
where denotes matrix transpose.
3.2. Attention Hidden Layer
Although the attention mechanism we use is closely connected to the research conducted by Petar et al. [28], the framework is not reliant on the specific attention method selected. One may create a graph attention network model for each person by arbitrarily stacking these hidden attention layers. This article uses three hidden attention layers.
As shown in Figure 3, the single-layer attention network gathers helpful information about attention based on the distribution of attention scores. The input of the CA-GAT hidden layer is a set of node features, , , and this layer aggregates the input node features and outputs a new set of node features, , . The attention weights suggested in Section 3.1 are linearly integrated with the associated features to increase model resilience and speed up training. The final is then produced as the output of the hidden layer after the LeakyReLU activation layer.
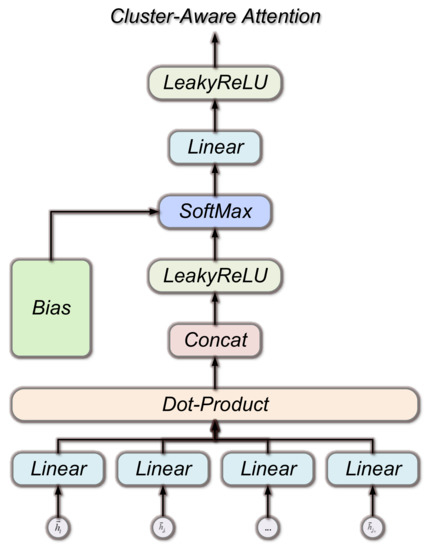
Figure 3.
Single-layer attention network structure. The single-layer attention network gathers helpful information about attention based on the distribution of attention scores.
3.3. Multi-Head Attention
Each node in an actual graph dataset will have unique attributes, features, and hidden connections to other nodes. All the aforementioned disparate pieces of information will be added together if there is just one attention structure. As a result, we add several attention structures to the model to improve its discriminative ability. Multi-headed attention mechanisms are the name given to these similar attentional structures. Different attention heads may reflect various degrees of connections between nodes even if the structure of many attention heads is the same, but their individual properties are varied. This way may significantly improve the attention mechanism’s capacity to absorb information. Figure 4 depicts the attention model’s calculation after applying multiple heads.
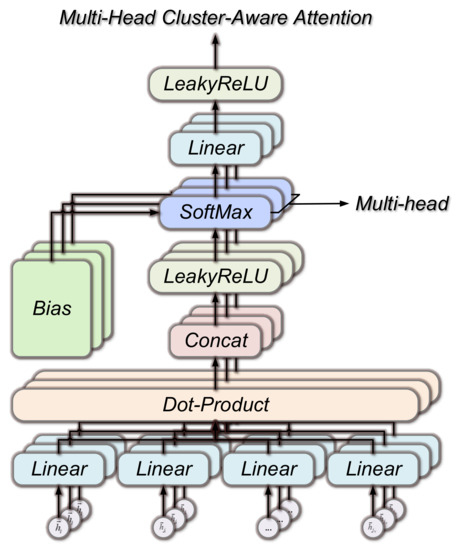
Figure 4.
Multi-headed attention model. With only one attention structure, different information is summed together. In this paper, we enhance the discriminative ability of the model by adding multiple attention structures.
To be more precise, M separate attention processes alter the equation above, and their features are then concatenated to produce the output feature representation shown below.
3.4. Computationally Analysis
Our proposed method avoids feature decomposition or similar computationally intensive matrix operations. The operations in the self-attentional layer can be parallelized on all edges and nodes to compute the output features in parallel. The time complexity of a single attention head can be expressed as , where F is the number of input features, and and are the number of nodes and edges in the graph, respectively. In the worse situation, the time complexity of the local clustering coefficients is . Therefore, the time complexity of a single-head CA-GAT can be simplified to . Applying multi-head CA-GAT increases storage and the number of parameters by times, and the time complexity becomes . However, the calculation of each head is entirely independent and can be parallelized. Thus, the actual time complexity of the multi-headed attention mechanism is the same as that of the single-headed attention, i.e., . This time complexity is comparable to the baseline approach, such as Graph Attention Network [28].
4. Experiments
We report results for four classical tasks (Cora, CiteSeer, BlogCatalog, and PPI) from the literature [31], literature [32], and literature [33]. We compare the proposed model with several solid baselines and earlier methods for the three well-known node-based classification benchmark tasks listed above. In each case, it outperforms the state-of-the-art performance. This section also gives a short qualitative analysis of the feature representations retrieved by the suggested model and summarizes the experimental parameter settings and findings.
4.1. Datasets
Cora, which is made up of machine learning publications, is one of the datasets that graph deep learning has made extensive use of in recent years. The collection comprises 2708 academic publications categorized into eight groups: case-based, genetic algorithms, neural networks, probabilistic techniques, reinforcement learning, rule-based learning, and theory. If each article were a node in a graph, all papers would form a linked graph with no isolated points since each one refers to at least one other paper or is referenced by other publications. Only 1433 distinct words were left in the corpus after the root processing and stop words were eliminated. In all papers, words used less than ten times are eliminated. As a result, each document is represented as a word vector with 1433 dimensions, or 1433 characteristics per node. The word vector’s elements represent a word, and each element may only have one of two possible values: 0 or 1. 0 indicates that a word does not occur in the document, while one indicates that it does.
CiteSeer contains 3312 scientific publications classified into six categories: Agents, AI, DB, IR, ML, and HCI. The citation network has 4732 linkages in total. A word vector encoding 0/1, which denotes the existence or absence of the associated term in the dictionary, is used to characterize each publication in the dataset. There are 3703 specific terms in the dictionary.
BlogCatalog is a social network made up of a graph of social relationships (such as friends) and tags representing the blogger’s interests. The BlogCatalog dataset has 39 tag dimensions and 10,312 nodes with 333,983 edges. In BlogCatalog, a blogger specifies the bloggers in his social network. A blogger’s interest can be determined by the categories of blogs he posted, which total 60 in BlogCatalog. Each blogger’s blog includes 1.6 categories on average. A blogger’s profile vector is created by aggregating his blogs into categories. This profile vector represents the set of attribute values for the blogger. Additionally, as seen by the average degree of the nodes and the link density, the adjacency vector employed to describe this dataset is very sparse.
PPI is often thought of as a Protein–Protein Interaction (PPI) between two proteins when they cooperate in a task or are engaged in a biological process. A PPI network may be used to explain the intricate connections between several proteins. A total of 56,944 nodes and 818,716 edges, each with a feature-length of 50, are present in the PPI dataset, which consists of 24 graphs, each corresponding to different human tissue. Each graph has an average of 2371 nodes, each having positional gene sets, motif sets, and immunological features. Up to 121 labels may be attached to a node (such as a protein’s characteristics or location, for example), and the labels are not one-hot encoded.
Table 1 provides an overview of the significant properties of the datasets that can be found throughout.

Table 1.
The datasets utilized in our study experiments are summarized.
4.2. Benchmark Methods
MLP In addition to the input and output layers, a multilayer perceptron, also known as an Artificial Neural Network (ANN), may have several hidden layers. The output of the hidden layer is , where is the weight, also known as the connection coefficient, is the bias, and the function f can be a frequently used function or function. The hidden layer is first fully connected to the input layer, and assuming that a vector X represents the input layer, the output of the hidden layer is . The following formulation describes the most typical three-layer MLP structural model.
Therefore, all the parameters of the MLP are the connection weights between each layer and the bias, for the Equation (11) including , , , .
GCN A Graph Convolutional Network (GCN) is a neural network architecture that operates on graph data and is so powerful that even a randomly initialized two-layer GCN can generate a helpful feature representation of the nodes in the graph. Two inputs go into the GCN. A feature matrix X of dimension is one input, where is the number of input features per node and N is the number of nodes in the graph. The second input is a graph structure with adjacency matrix A and size . Thus, Equations (12) and (13) may be used to represent the hidden layer of the GCN.
where is the adjacency matrix with added self-loop, , is the unit matrix, and is a diagonal matrix with the main diagonal element being the degree of each node, .
GAT The graph attention layer, described in Section 2.2, is the main component of the graph attention network, and each node in the whole graph serves as its object. For instance, the output of the graph attention layer for a graph with N nodes and each node having feature dimension F is , where is the feature dimension of the output layer. The input data are represented by the , where is a vector of size F. The output is represented as , and the size of the vector is F. This section will not go over the formal representation again as it was covered in depth in Section 2.2.
4.3. Experimental Setup
A single-head and a multi-head CA-GAT are the two types of cluster-aware attention networks we employ in this article. Most studies of multi-headed attention use 6 to 16 heads, and Petar et al., in their work [28], specify that the standard multi-headed attention model generally chooses 8 heads. We continued their work and also chose attention heads for attention. Each of which has a different set of parameters and a similar structural makeup. The model mainly uses regularization to address the slight training set size issue. We used L2 regularization with during training. In addition, after several cross-validations, the implicit node dropout rate equals 0.6 when it works best. The dropout was further adjusted to 0.6 and applied to the normalized attention coefficients and the inputs of the three-layer CA-GAT. This configuration indicates that each node will be exposed to a randomly selected neighborhood with a chance during each training cycle. To avoid the vanishing gradient, we choose LeakyReLU as the activation function. LeakyReLU is a modified ReLU function, a nonlinear activation function with parameters that can be expressed as
Generally, the takes values in the 0.01–0.2. Therefore, the is chosen to be 0.2 in this work. Both models are trained using a three-layer CA-GAT with the Adam optimizer to reduce cross-entropy on the training nodes.
where the initial learning rate for all data sets is , to avoid the denominator of Equation (15) to be 0 and .
4.4. Results and Explainability
The outcomes of our comparison studies are shown in Table 2 and Table 3 after 1000 training rounds. In this study, we employ the micro-averaged F1-score and average classification accuracy (including standard deviation) as assessment metrics for the induction task. We precisely execute the suggested single-head technique 100 times on the Core, CiteSeer, and BlogCatalog datasets. After deleting the greatest and lowest accuracies, we obtain the average accuracy of the categorization findings. In calculating the average accuracy, removing one of the highest and one of the lowest scores is to omit possible outliers in the scoring. The average accuracy of the classification findings was then calculated using 100 further runs of the multi-head approach on these datasets. After ten runs, the micro-average of the F1-score on the test graph nodes for the PPI dataset was averaged.
Table 2.
Summary of results in terms of node classification accuracies, for Cora, Cieseer.
Table 3.
Summary of testing results on BlogCatalog and PPI in the transductive setting. In accordance with former benchmarks, we report micro-averaged F1-score, for BlogCatalog and PPI.
The baseline approaches previously described by the Graph-MLP [34], GCN [27], and GAT [28] are utilized as comparisons to demonstrate the advantages of our suggested methodology. Graph-MLP is a neural network containing three hidden layers. The first hidden layer is used to capture the input node features, the second is used to combine the neighborhood information and calculate NContrast Loss, and the last is used for node classification. Each hidden layer has a feature dimension of 256, a dropout of 0.6, and a learning rate of 0.01. GCN is the first proposal to apply convolutional operations to graphs to model the learning of local structure and node features of graphs through approximate analysis of the graph frequency domain. GCN contains two hidden layers, and its hyperparameters are chosen as follows: learning rate of 0.01, 0.5 (dropout rate, first and last layer), (L2 regularization, first layer), 16 (number of units for each hidden layer) and 0.01 (learning rate). The GAT proposed by Petar et al. uses the attention mechanism. For the datasets, Cora and Cieseer, the structure of GAT are two hidden layers. The first hidden layer consists of attention heads, and each attention head computes features. The second hidden layer is used for classification. dropout is applied to the inputs of both layers and L2 regularization with is applied during training. For the datasets, BlogCatalog and PPI, the structure of GAT are three hidden layers. Both of the first two layers consist of attention heads, computing features, and the last layer for (multi-label) classification: attention heads, computing 121 features per attention head. The learning rate for both models is 0.005. Following our assumptions, our findings effectively show that on all four datasets, state-of-the-art performance is attained or matched. Take the Core data set as an example; more precisely, our technique beats theirs by , , and , respectively. Notably, the excellent results on BlogCatalog imply that the study’s central premise is true. Individual nodes tend to organize into reasonably dense web clusters in network architectures that mimic the actual world when interacting with one another. Particularly in social networks, the representation of nodes in network topologies depends more on the aggregation coefficient between nodes than in networks created by chance connections between two nodes.
Additionally, we test activating LeakyReLU and ELU in each of the three scenarios to more appropriately evaluate the advantages of taking attention processes for clustering into account. Sigmoid and ReLU are included in ELU, with a low saturation applied to the left side and none to the right side. While the soft saturation on the left makes ELU more resistant to input variations or noise, the linear portion on the right helps ELU to counteract gradient disappearance.
5. Conclusions
The study of graphs has become crucial in areas of artificial intelligence, including knowledge graphs and social network analysis. In this article, we provide a brand-new graph attention model that takes the degree of core node aggregation in the network structure into account using aggregation coefficients. With the inclusion of local clustering coefficient capture and node interaction, we answer the crucial problem of including neighborhood information in this study’s attention mechanism. It is distinct from the majority of the current graph attention techniques. The model put forward in this research is also computationally efficient. Unlike earlier graph neural networks, it may operate all edges and nodes in parallel and does not need feature decomposition or computing of dense matrices. Our suggested model was tested on four datasets and effectively met or exceeded the most current performance standards for well-known node classification benchmarks, such as transduction and induction settings. As an assessment measure for the transduction task, we utilize the average classification accuracy, and for the induction task, we use the micro-averaged F1 score.
To apply graph processing algorithms in a broader and more industrially relevant range of scenarios, future work may be interested in improving and extending attention models that include more edge features of aggregation. For instance, by applying improved attention networks considering aggregation to hypergraphs and dynamic graphs. Mathematical analytic methods may be used to conduct a more in-depth study of the interpretability and antagonistic resilience of attention processes to models, which is another fascinating avenue of inquiry. Future graph signal processing methods and graph deep learning models must include interpretability and adversarial resilience. Additionally, this study offers a fresh viewpoint on how graph data science may advance in the future as a link between graph signal processing and graph deep learning.
Author Contributions
Conceptualization, M.Z. and Y.L.; methodology, M.Z.; software, M.Z.; validation, Y.L. and L.L.; formal analysis, L.L.; investigation, Y.L.; resources, S.Z.; data curation, Y.L.; writing—original draft preparation, M.Z.; writing—review and editing, M.Z.; visualization, Y.L.; supervision, S.Z.; project administration, L.L.; funding acquisition, S.Z. All authors have read and agreed to the published version of the manuscript.
Funding
This research was funded by 1. National Natural Science Foundation of China, grant number 62272089. 2. General Program of Science Funding Projects of Sichuan Province, grant number 2022YFG0207. 3. Open project of Intelligent Terminal Key Laboratory of Sichuan Province, grant number SCITLAB-20006. 4. Science and Technology Department of Sichuan Province, grant number 2023YFG0155. 5. Ministry of Industry and Information Technology of the People’s Republic of China, grant number TC2108048.
Data Availability Statement
Not applicable.
Acknowledgments
This work was supported by the National Natural Science Foundation of China [grant number 62272089]; the General Program of Science Funding Projects of Sichuan Province [grant number 2022YFG0207]; the Open project of Intelligent Terminal Key Laboratory of Sichuan Province [grant number SCITLAB-20006]; the Science and Technology Department of Sichuan Province [grant number 2023YFG0155]; and Ministry of Industry and Information Technology of the People’s Republic of China [grant number TC2108048]. The authors are grateful to the editor and anonymous reviewers for their suggestions for improving the quality of the paper.
Conflicts of Interest
The authors declare no conflict of interest.
References
- West, D.B. Introduction to Graph Theory; Prentice Hall: Upper Saddle River, NJ, USA, 2001; Volume 2. [Google Scholar]
- Li, Z.-X.; Li, Y.-J.; Liu, Y.-W.; Liu, C.; Zhou, N.-X. K-CTIAA: Automatic Analysis of Cyber Threat Intelligence Based on a Knowledge Graph. Symmetry 2023, 15, 337. [Google Scholar] [CrossRef]
- Zhang, Y.; Xu, C.; Shen, X.S. Secure Keyword Search. In Data Security in Cloud Storage; Springer: Singapore, 2020; pp. 87–117. [Google Scholar]
- Liu, M.; Quan, W.; Liu, Z.; Zhang, Y.; Gao, D.; Zhang, H. Combating Eavesdropping with Resilient Multipath Transmission for Space/aerial-assisted IoT. In Proceedings of the ICC 2022—IEEE International Conference on Communications, Seoul, Republic of Korea, 16–20 May 2022; pp. 2230–2235. [Google Scholar]
- Kanellopoulos, D.; Sharma, V.K. Dynamic Load Balancing Techniques in the IoT: A Review. Symmetry 2022, 14, 2554. [Google Scholar] [CrossRef]
- Zhang, Y.; Xu, C.; Yu, S.; Li, H.; Zhang, X. SCLPV: Secure certificateless public verification for cloud-based cyber-physical-social systems against malicious auditors. IEEE Trans. Comput. Soc. Syst. 2015, 2, 159–170. [Google Scholar] [CrossRef]
- Chen, L.; Zhao, K. An Approach for Chart Description Generation in Cyber-Physical-Social System. Symmetry 2021, 13, 1552. [Google Scholar] [CrossRef]
- Tu, S.; Neumann, S. A Viral Marketing-Based Model For Opinion Dynamics in Online Social Networks. In Proceedings of the ACM Web Conference 2022, Lyon, France, 25–29 April 2022; pp. 1570–1578. [Google Scholar]
- Park, N.; Rossi, R.; Koh, E.; Burhanuddin, I.A.; Kim, S.; Du, F.; Ahmed, N.; Faloutsos, C. CGC: Contrastive Graph Clustering forCommunity Detection and Tracking. In Proceedings of the ACM Web Conference 2022, Lyon, France, 25–29 April 2022; pp. 1115–1126. [Google Scholar]
- Fu, T.; Liu, P.; Ding, Y.; Zhang, Y. Secure and Efficient Large Content Broadcasting in Mobile Social Networks. IEEE Access 2018, 6, 42108–42118. [Google Scholar] [CrossRef]
- Liu, J.; Xia, F.; Feng, X.; Ren, J.; Liu, H. Deep Graph Learning for Anomalous Citation Detection. IEEE Trans. Neural Netw. Learn. Syst. 2022, 33, 2543–2557. [Google Scholar] [CrossRef]
- Gligorijević, V.; Renfrew, P.D.; Kosciolek, T.; Leman, J.K.; Berenberg, D.; Vatanen, T.; Chandler, C.; Taylor, B.C.; Fisk, I.M.; Vlamakis, H.; et al. Structure-based protein function prediction using graph convolutional networks. Nat. Commun. 2021, 12, 3168. [Google Scholar] [CrossRef]
- Li, S.; Zhou, J.; Xu, T.; Huang, L.; Wang, F.; Xiong, H.; Huang, W.; Dou, D.; Xiong, H. Structure-aware interactive graph neural networks for the prediction of protein-ligand binding affinity. In Proceedings of the 27th ACM SIGKDD Conference on Knowledge Discovery & Data Mining, Virtual, 14–18 August 2021; pp. 975–985. [Google Scholar]
- Te, G.; Hu, W.; Zheng, A.; Guo, Z. Rgcnn: Regularized graph cnn for point cloud segmentation. In Proceedings of the 26th ACM International Conference on Multimedia, Seoul, Republic of Korea, 22–26 October 2018; pp. 746–754. [Google Scholar]
- Wang, Y.; Sun, Y.; Liu, Z.; Sarma, S.E.; Bronstein, M.M.; Solomon, J.M. Dynamic graph cnn for learning on point clouds. ACM Trans. Graph. (TOG) 2019, 38, 1–12. [Google Scholar] [CrossRef]
- Rusek, K.; Suárez-Varela, J.; Almasan, P.; Barlet-Ros, P.; Cabellos-Aparicio, A. RouteNet: Leveraging Graph Neural Networks for network modeling and optimization in SDN. IEEE J. Sel. Areas Commun. 2020, 38, 2260–2270. [Google Scholar] [CrossRef]
- Liu, Y.; Lu, Y.; Li, X.; Yao, Z.; Zhao, D. On dynamic service function chain reconfiguration in IoT networks. IEEE Internet Things J. 2020, 7, 10969–10984. [Google Scholar] [CrossRef]
- Zhuo, M.; Liu, L.; Zhou, S.; Tian, Z. Survey on security issues of routing and anomaly detection for space information networks. Sci. Rep. 2021, 11, 22261. [Google Scholar] [CrossRef]
- Cao, S.; Dang, S.; Zhang, Y.; Wang, W.; Cheng, N. A blockchain-based access control and intrusion detection framework for satellite communication systems. Comput. Commun. 2021, 172, 216–225. [Google Scholar] [CrossRef]
- Lawrence, S.; Giles, C.L.; Tsoi, A.C.; Back, A.D. Face recognition: A convolutional neural-network approach. IEEE Trans. Neural Netw. 1997, 8, 98–113. [Google Scholar] [CrossRef]
- Shi, B.; Xiang, B.; Cong, Y. An End-to-End Trainable Neural Network for Image-Based Sequence Recognition and Its Application to Scene Text Recognition. IEEE Trans. Pattern Anal. Mach. Intell. 2016, 39, 2298–2304. [Google Scholar] [CrossRef]
- Sutskever, I.; Vinyals, O.; Le, Q.V. Sequence to sequence learning with neural networks. Adv. Neural Inf. Process. Syst. 2014, 27. [Google Scholar]
- Mikolov, T.; Chen, K.; Corrado, G.; Dean, J. Efficient estimation of word representations in vector space. arXiv 2013, arXiv:1301.3781. [Google Scholar]
- Chen, Y. Convolutional Neural Network for Sentence Classification. Master’s Thesis, University of Waterloo, Waterloo, ON, Canada, 2015. [Google Scholar]
- Rendle, S.; Schmidt-Thieme, L. Pairwise interaction tensor factorization for personalized tag recommendation. In Proceedings of the Third ACM International Conference on Web Search and Data Mining, New York, NY, USA, 4–6 February 2010; pp. 81–90. [Google Scholar]
- Linden, G.; Smith, B.; York, J. Amazon.com recommendations: Item-to-item collaborative filtering. IEEE Internet Comput. 2003, 7, 76–80. [Google Scholar] [CrossRef]
- Kipf, T.N.; Welling, M. Semi-supervised classification with graph convolutional networks. arXiv 2016, arXiv:1609.02907. [Google Scholar]
- Veličković, P.; Cucurull, G.; Casanova, A.; Romero, A.; Lio, P.; Bengio, Y. Graph attention networks. arXiv 2017, arXiv:1710.10903. [Google Scholar]
- Holl, P.W.; Leinhardt, S. Holland and Leinhardt reply: Some evidence on the transitivity of positive interpersonal sentiment. Am. J. Sociol. 1972, 77, 1205–1209. [Google Scholar]
- Watts, D.J.; Strogatz, S.H. Collective dynamics of ‘small-world’networks. Nature 1998, 393, 440–442. [Google Scholar] [CrossRef] [PubMed]
- Yang, Z.; Cohen, W.; Salakhudinov, R. Revisiting semi-supervised learning with graph embeddings. In Proceedings of the International Conference on Machine Learning, New York, NY, USA, 19–24 June 2016; pp. 40–48. [Google Scholar]
- Agarwal, N.; Liu, H.; Murthy, S.; Sen, A.; Wang, X. A Social Identity Approach to Identify Familiar Strangers in a Social Network. In Proceedings of the International Conference on Weblogs and Social Media, San Jose, CA, USA, 17–20 May 2009. [Google Scholar]
- Marinka, Z.; Jure, L. Predicting multicellular function through multi-layer tissue networks. Bioinformatics 2017, 33, i190–i198. [Google Scholar] [CrossRef]
- Hu, Y.; You, H.; Wang, Z.; Wang, Z.; Zhou, E.; Gao, Y. Graph-MLP: Node Classification without Message Passing in Graph. arXiv 2021, arXiv:2106.04051. [Google Scholar]


Disclaimer/Publisher’s Note: The statements, opinions and data contained in all publications are solely those of the individual author(s) and contributor(s) and not of MDPI and/or the editor(s). MDPI and/or the editor(s) disclaim responsibility for any injury to people or property resulting from any ideas, methods, instructions or products referred to in the content. |
© 2023 by the authors. Licensee MDPI, Basel, Switzerland. This article is an open access article distributed under the terms and conditions of the Creative Commons Attribution (CC BY) license (https://creativecommons.org/licenses/by/4.0/).