Abstract
Based on a symmetrical cable-stayed bridge, the wind resistance performance of a proposed π-type composite beam is analyzed, and the influence of changing the bridge deck cross slope ratio on the static and dynamic wind characteristics is emphatically studied. The purpose is to provide a design reference for the preliminary wind resistance study of the cable-stayed bridge. The CFD (Computational Fluid Dynamics) numerical calculation method is used to solve the vibration problem of wind-bridge coupling with the help of the software Fluent. It is found that variation of four deck cross slope rates 0%, 1.5%, 2%, and 2.5% has large effects on the static wind coefficient and flutter critical wind speed of a π-type combination beam. In the range of a −3–3° wind attack angle, the static wind drag coefficient will be decreased as the beam deck cross slope rate increases, and in which the drag coefficient at 0% slope rate is the largest. Within the discounted wind speed 13, changing the bridge deck cross slope has little effect on the aerodynamic derivatives of a π-type composite beam. However, the beam deck slope increases the critical wind speed of the bridge, and the critical wind speed at 2.5% is the largest of the four deck slope rates. In addition, it is found that the beam leeward surface keeps generating up and down vortices when the incoming flow wind speed is in the range of 2.5–4.0 m/s, which led the beam to be under vertical vortex vibration, and further research is needed on vibration suppression measures.
1. Introduction
With the continuous improvement of theoretical knowledge regarding bridges and the demand for bridge spans when crossing rivers, canyons, and oceans, bridge designs are more and more inclined to adopt light and long-span structural forms on the basis of satisfying safety. These large-span bridges have a decreasing stiffness due to the increasing span, and the flexibility of the structure makes it very sensitive to the external wind environment. Bridge structures may undergo many different forms of vibration phenomena under the wind. Among them, there are mainly bridge flutters dominated by bening-torsional coupled vibration [1,2,3], galloping vibration dominated by bending vibration [4,5], bridge vortex-induced vibration excited by shedding vortices [6,7,8], and random buffeting under the action of a turbulent flow field [9,10]. Therefore, a preliminary wind-resistant design of the bridge is necessary.
Studies related to the wind resistance of large-span bridges are now more common, not least considering the influence of factors such as the shape of the beam, the dimensional parameters of the beam, the climatic conditions at the construction site, and the structure of the bridge deck appurtenances on the wind resistance performance of the bridge. Ma, Teng et al. [11] found that reasonable construction time selection was more useful than physical flutter wind resistance measures in mixed wind climate zones by establishing a framework for analyzing the flutter instability risk of suspension bridges during the construction phase. Haque M N et al. [12] investigated box configuration parameters such as bottom slope, width ratio, and side ratio of streamlined single box beam sections using non-constant RANS simulations. It was found that the aerodynamic performance of the single box beam exhibited high sensitivity to these box detail construction parameters. Furthermore, Haque M N [13] changed the shape of the fairing by setting different slopes of the top and bottom plates to form an effective deck with edge fairings to minimize the aerodynamic response. Zhang Guoqiang [14] took the Aojiang Extra-large Bridge as the engineering background, relying on the wind tunnel test to study the influence of the balustrade ventilation rate on the vortex-induced vibration of the π-shaped bridge section. Further combined with numerical simulation, parameters such as optimized railing section, parameterized height factor λ, reasonable inclination angle θ, and ventilation rate ϕ were considered to provide references for the vortex-induced vibration suppression design of the section. Lee, H et al. [15] studied the static force coefficients of 2-edge box beam bridges when the edge box slope was varied between 0 and 17 by numerical simulation. It was found that the drag coefficient of 2-edge box beam bridges for the edge box decreases with the increasing slope angle of the edge box except for a few specific slopes. Bruno, L et al. [16] analyzed the effect of various deck details on the aerodynamic response of the Normandy cable-stayed bridge and the Great Belt suspension bridge by numerical simulation and found that the role of deck details on bridge aerodynamics cannot be ignored. Wang, Q et al. [17] experimentally investigated the effects of the deck aerodynamic configuration and ancillary components on box beam flutter and vortex vibration performance and found that a box beam web configuration with a 15° inclination angle could significantly improve the aerodynamic stability of the bridge.
In summary, although it is common to consider the influence of various factors on the wind resistance performance of bridges, the influence of the π-combined beam cross-slope slope factor on the static wind three-part force coefficient and the flutter stability performance has rarely been considered. The original purpose of setting the cross slope of the bridge deck is to solve the drainage needs of the bridge deck. The range of its slope rate is generally from 1.5–3%, and the arrangement is usually a two-way cross slope. Although the slope rate of the cross slope of the bridge deck is very small, for bridges with small section widths, the existence of the slope rate of the cross slope has a weak effect on the wind resistance performance of the bridge and can be disregarded. However, for large-span cable-stayed bridges, according to statistics [18], the width of the combined beam section is mostly around 30 m, among which the spacing between the beam of the Ting Kau Bridge in Hong Kong reaches 42.8 m, so that the impact on the wind resistance of the bridge caused by the additional girder height effect brought by the slope rate cannot be ignored. Therefore, this paper focuses on the effect of π-combination beams with different deck slope rates in both directions of 28.3 m width on the wind resistance of the bridge, without considering other bridge deck appurtenances in the bridge section. This study is valuable for the wind resistance analysis of Han River cable-stayed bridges and the wind resistance of such large-width bridge sections considering the cross slope. The overall approach of the article is to establish the dynamic model of the Han River Bridge and to validate the CFD numerical method firstly. Secondly, the results of the static and dynamic wind characteristics of the bridge are calculated and analyzed. Finally, the effect of the cross slope of the bridge deck on the combined girders is further discussed.
2. Materials and Methods
A proposed symmetrical Hanjiang Bridge in a mountainous area is a double-tower double-cable-stayed bridge with a span combination of (50 + 120) m + 370 m + (112 + 50) m. The beam adopts a combination of bilateral I-beam + prestressed concrete deck plates, with a beam width of 28.3 m and a height of 3.33 m. The bridge deck is set with a two-way cross slope and the slope rate is 2.0%. The specific span layout and the standard cross-section of the π-shaped beam are shown in Figure 1 and Figure 2.
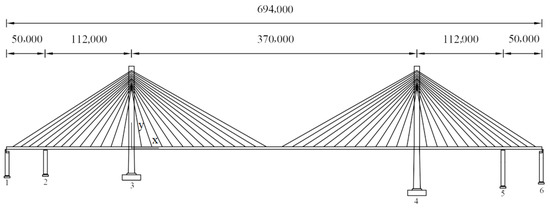
Figure 1.
Bridge span arrangement (unit: 10−3 m).
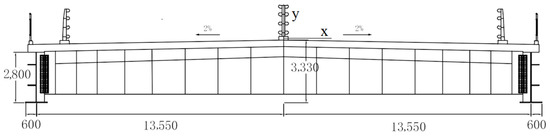
Figure 2.
Standard cross section of a π–type composite beam (unit: 10−3 m).
2.1. Model Building
The establishment of the cable-stayed bridge finite element dynamic model is done with the help of the software ANSYS. The main material characteristics and cross-section characteristics parameters of the model are shown in Table 1 and Table 2.

Table 1.
Material characteristics.
Table 2.
Cross−sectional characteristics.
Based on the finite element mechanics model of the double-layered composite member with shear connectors established in the literature [19,20], the finite element model of the full bridge established in this paper is shown in Figure 3. The first-order self-oscillation frequencies of vertical bending and torsion and the corresponding equivalent masses are given as shown in Table 3, and the mode shape to Table 3 is shown in Figure 4.
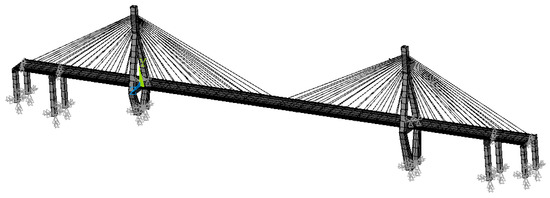
Figure 3.
Finite element dynamic model of the Han River bridge.
Table 3.
Calculation results of structural dynamic characteristics.
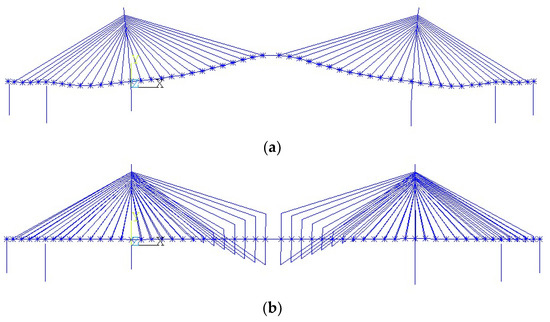
Figure 4.
Mode shape diagram of the Han River bridge. (a) first-order vertical bending mode. (b) first-order torsional mode.
2.2. CFD Numerical Simulation
2.2.1. Computational Domain and Meshing
Considering that the full-scale simulation requires huge computational resources and is not computationally efficient, the scaled-down model based on the similarity principle has the same computational results as the full-scale model. In the paper, therefore, the 1/45 scaled-down model of the main beam section is modeled and analyzed, and the −5–5° wind attack angle is selected for numerical simulation. Regarding the selection of the computational domain, it has been shown that when the computational domain is larger than 10–20 times the model characteristic length, it allows the turbulent flow to develop fully and reduces the accuracy of the results due to the separation vortex hitting the outer boundary and refracting back due to the close distance [21]. Therefore, the computational domain is taken as a rectangle of 18 B × 12 B, and B is the characteristic length of the model. The specific computational domain settings are shown in Figure 5, and the boundary condition settings are shown in Table 4.
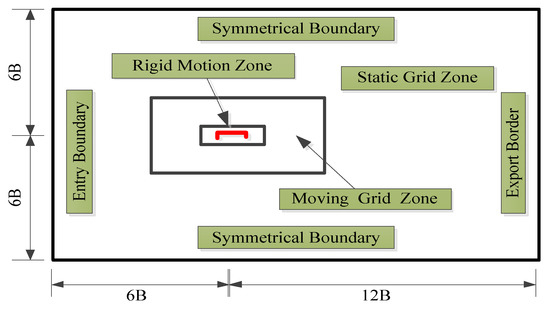
Figure 5.
Computational domain settings.
Table 4.
Cross−sectional characteristics.
In the wind-induced vibration simulation, the facilities such as the bridge deck guardrail in the completed bridge state are not considered, and transverse members such as beam webs, beams, and stiffeners of steel beams are ignored. Considering the distortion and negative volume of the mesh during the motion of the beam section, the mesh is divided into rigid motion, dynamic mesh, and stationary mesh by blocking. The rigid motion region is the closest to the beam section with a dense grid, which follows the motion of the beam section. The boundary layer grid is set for the main beam section in order to capture the “separation” and “reattachment” phenomena that occur when the airflow flows through the main beam section. Claudio Mannini et al. [22] pointed out that for the SST k-ω turbulence model commonly used in engineering, the value of the dimensionless length parameter y+ should be guaranteed to be around 1 in order to achieve the effect of capturing the flow characteristics of the fluid near the wall. The moving mesh area is set as a larger triangular mesh to solve the mesh quality problem caused by the rigid domain motion. The stationary mesh area is farthest away from the beam section with a larger asymptotic mesh to improve computational efficiency. The grid division after conducting the grid irrelevance test is shown in Figure 6, and the total grid is 182,042.
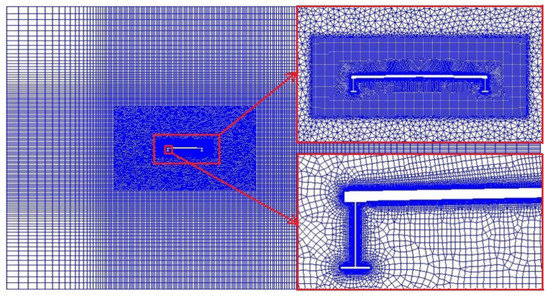
Figure 6.
Meshing details of a π–type composite beam.
As shown in Figure 7, the distribution of the y+ values of the bridge sections, it can be seen that the dimensionless distance y+ from the center of mass of the grid to the wall is overwhelmingly less than 1. Therefore, the turbulence model adopts the SST k-ω model.
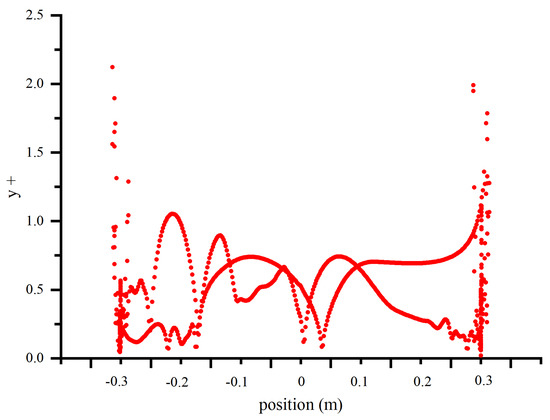
Figure 7.
Bridge section y + distribution.
2.2.2. Numerical Simulation Verification
In order to ensure the reliability of the adopted numerical simulation method, numerical simulations are conducted to verify the static wind analysis, vortex-induced vibration analysis, and flutter performance analysis of the π-shaped beam section cable-stayed bridge before they are performed in the paper. Here, due to the length of the paper, each numerical validation process is not developed in detail, as shown in Figure 8, which is a comparison of the experimental results of vortex-induced vibration of rectangular sections with a 1:4 aspect ratio in the paper [23].
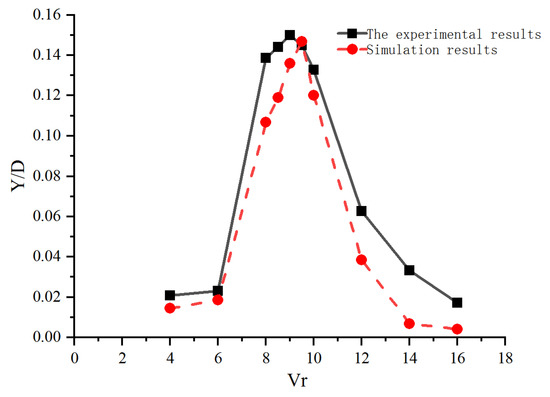
Figure 8.
Variation of amplitude with discounted wind speed.
3. Results
3.1. Static Wind Characteristics Results
When the bridge is subjected to static wind, the wind speed near the bridge section changes due to the existence of the bridge structure, so a pressure difference is generated between each surface. On the wind axis, the pressure difference between the windward side and the leeward side is integrated to obtain the lateral resistance FD. Similarly, the vertical lift FL and the lift moment MT can be obtained, as shown in Figure 9. The calculation of the three-component force coefficient is shown in Formula (1),
where ρ is the air density, D the section height, B the section width, and V the incoming uniform wind speed.
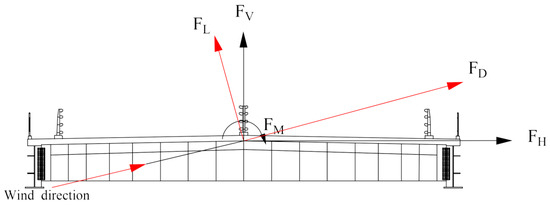
Figure 9.
Schematic diagram of the static wind three–component force.
In the static wind calculation, the facilities such as the bridge deck guardrail in the bridge state are simplified by the equal ventilation rate, and other components are also ignored. As shown in Figure 10, the static wind three-component force coefficients of the beam under the static wind in the range of −5–5° attack angles of the wind axis are calculated.
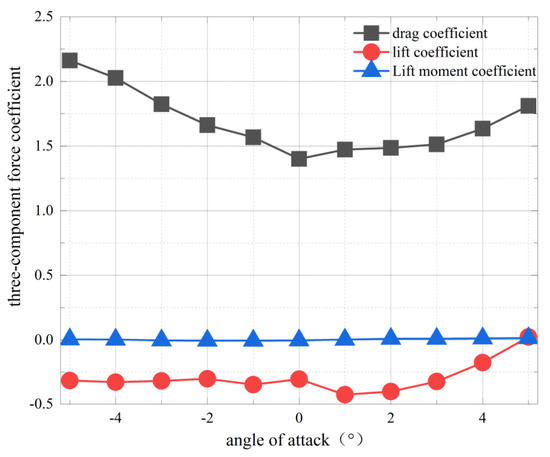
Figure 10.
Static wind three−component force coefficient of a π−type composite beam.
3.2. Vortex Vibration Performance Results
The loose-coupling method is widely used in different disciplines, and for the aeroelastic problem, Shaobo Wang et al. [24] gave the general idea of solving the problem based on the loose-coupling method through the combination of CFD + CSD (Computational Structural Dynamics). For the vortex-induced vibration problem in the chapter, the vertical vibrating structure is first regarded as a single-degree-of-freedom spring oscillator system composed of mass-stiffness-damping. Then, the Newmark-β method for solving the vertical dynamic equations of the structure and the unique macro commands in Fluent are written into the self-coded UDF (User Defined Function) for interfacing with Fluent by using the secondary development function in Fluent. Finally, the hydrodynamic equations and the structural equations of motion are solved sequentially at each time step. The vertical motion equation of the structure is shown as (2),
where m is the mass per unit length of the structure, the vertical acceleration, the vertical velocity, the displacement of the structure at any given moment, ωb the vertical natural circular frequency of the structure, ζb the vertical damping ratio of the structure, and Fy(t) the vertical load acting on the structure. At the beginning of the calculation, the fluid governing equations of the system in each time step are first solved, and the lift force on the structure is extracted by the macro Compute_Force_And_Moment. Then the vertical motion equations of the structure under the lift forces are solved by the Newmark-β numerical method in the UDF described above to obtain the , and of the structure. Finally, the physical quantities obtained in the previous step are assigned to the structure and the surrounding dynamic mesh by the macro DEFINE_CG_MOTIONG to update the motion state of the structure, and then the computation converges in that time step to the next time step. Thus, the iterative cycle continues until the monitored physical quantities stabilize. The vortex-induced vibration system of the bridge after the improvement of the FSI (Fluid Structure Interaction) system structure in the literature [24] is shown in Figure 11.
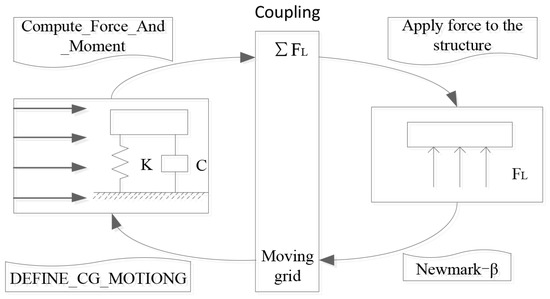
Figure 11.
Schematic diagram of the vortex–induced vibration solution.
Firstly, the static flow simulation is carried out. Based on the previous experience, it is found that the results of the simulations with the time step of 0.001 s are more efficient, and the error of the three-part force coefficient was smaller compared with other groups. The Strouhal (St) number was calculated by calculating the incoming wind speed in the range of 2–5 m/s wind speed. The parameters related to the numerical simulation are set as shown in Table 5.
Table 5.
Calculation results of structural dynamic characteristics.
For vortex-induced vibration, there is an article [25] that shows that when the fundamental frequency ratio of torsion is greater than 1.4, it is difficult to generate bending-torsional coupled vibration, and the two forms of vortex vibration are independent of each other. According to Table 3, it can be seen that the fundamental frequency ratio of torsion and bending is 1.52, and the fundamental frequency of the two is quite different. According to the characteristics of vortex-induced vibration, the vertical bending vortex vibration will occur before torsional vortex vibration. Therefore, the vertical degree of freedom vortex vibration is simulated in the paper. The average value of St is estimated to be about 0.06 according to the results of Figure 12, and the wind speed during vortex-induced vibration is estimated to be 3.6 m/s. Therefore, the vortex-induced response calculation is performed for nine wind speed conditions near the wind speed. To ensure that the vortex-induced vibration solution captures the vortex, the time step for the eddy vibration calculation is taken to be the same as that for stationary winding. As shown in Figure 13, the time-history curve of the wind-induced vortex vibration amplitude corresponding to the onset wind speed, the maximum wind speed, and the end of the vortex vibration is given.
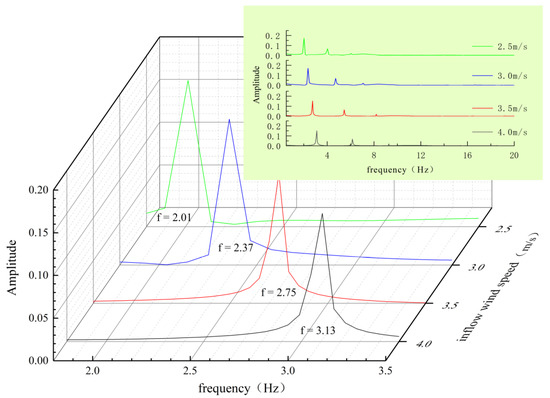
Figure 12.
Schematic diagram of vortex-induced vibration solution.
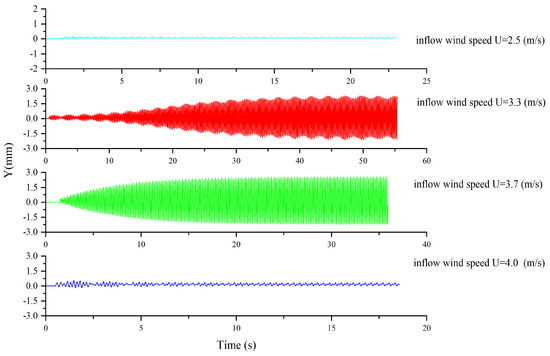
Figure 13.
Amplitude time−history curves under different incoming wind speeds.
From Figure 14, it can be seen that the π-type beam has a large amplitude in the wind speed range from 2.5–4 m/s and the vibration amplitude reaches the maximum when the wind speed is 3.7 m/s. As can be seen from Figure 15, within the wind speed range of 3.0–4.0 m/s, the vortex shedding frequency changes little and is close to the vertical intrinsic frequency of the main beam, i.e., the “locking phenomenon” occurs.
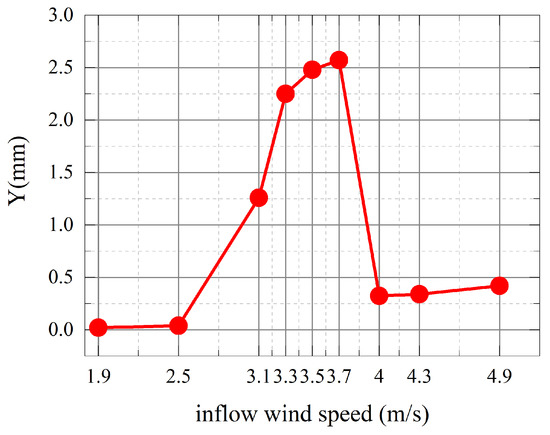
Figure 14.
Variation of amplitude with wind speed.
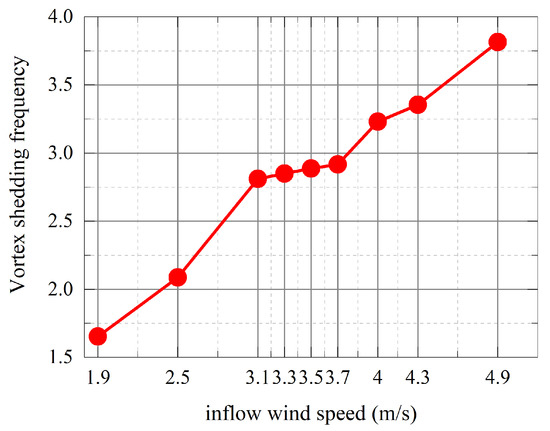
Figure 15.
Variation of vortex shedding frequency with incoming wind speed.
Figure 16 shows the instantaneous vortex variation of the π-beam section at a certain period when the incoming wind speed is 3.7 m/s. It can be seen from the figure that different scale vortices appear at different locations of the beam, which are mainly generated from the upper and lower sides of the leading edge, and the lower side of the trailing edge. For the vortex on the underside of the leading edge, it can be seen that the vortex just generated is ready to move downstream at the initial time nT. At nT + 1/3T, the vortex moves to the 1/2 position of the main beam. At nT + 2/3T, the vortex moves to the trailing edge of the beam, and the vortex on the lower side of the leading edge has formed a sufficient scale and is ready to move again, thus completing a shedding cycle. Vortices on the upper side of the leading edge and on the lower side of the trailing edge form the Karman vortex that alternately appears in the wake region of the beam. It was found that after the air flow is separated on the windward side of the beam, vortices are formed at certain fixed positions on the upper and lower sides of the beam respectively. These vortices then continuously move back to the back of the beam. At the time, the vortices on the upper and lower sides of the beam back merged to form vortices falling off alternately up and down on the leeward side, resulting in the vertical vortex-induced vibration of the beam.
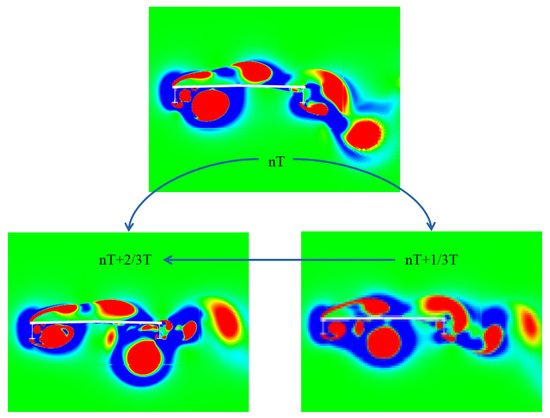
Figure 16.
Instantaneous vortex shedding evolution diagram of the π−type beam.
3.3. Flutter Performance Results
When identifying based on the time domain method, the rigid structure is first given an initial displacement and forced to perform vertical bending or torsional vibration with a single degree of freedom, respectively. The aerodynamic lift and lift moment time-history curves of the π-type beam are then calculated until they are in a steady state, and they are extracted in a steady period of time [26]. Next, the obtained aerodynamic force is brought into the basic equation of flutter aerodynamic force in Equation (3), and a MATLAB calculation program is written based on the principle of least squares to identify the flutter derivative. Finally, according to the two-dimensional flutter critical wind speed calculation method proposed by Scanlan, the critical flutter wind speed of the bridge is calculated by writing a MATLAB solver.
where K is the converted frequency, the vertical displacement, the velocity, the torsional displacement and the torsional velocity. In order to extract the aerodynamic lift and lift moment of the π-type beam, the same dynamic mesh method as in Section 3.2 is used to realize the vertical and torsional forced vibration of the beam with sinusoidal law variation respectively.
In the simulation, the beam is made to undergo small amplitude forced vibration, in which the frequency is set to 2 Hz, the amplitude is 0.02 m, and the phase is 0° when performing the single degree of freedom vertical bending forced vibration. To perform the single degree of freedom torsional forced vibration, set its frequency f to 2 Hz, amplitude 4°, phase 0°. These vibration parameters are written as UDF files to interface with Fluent to achieve sinusoidal variations in vibration. Based on the wind field characteristics at the bridge site, the incoming wind speeds U were calculated to be 1.256 m/s, 5.026 m/s, 7.896 m/s, 12.566 m/s, and 16.336 m/s, corresponding to converted wind speeds Vr of 1, 4, 7, 10, and 13, for a total of five calculated wind conditions. All calculations were performed at 0° wind angle of attack with the same time step of 0.001 s. The time curves of the lift and lift moment coefficients of the π-type beam extracted under the five calculated wind speed conditions are shown in Figure 17 and Figure 18.
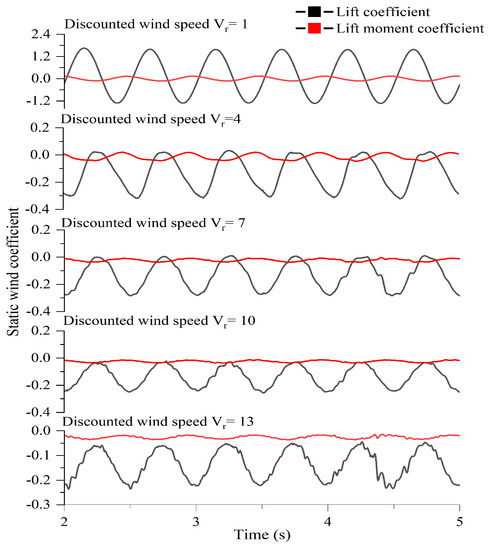
Figure 17.
Aerodynamic time history of forced vibration in vertical bending of the π−type beam.
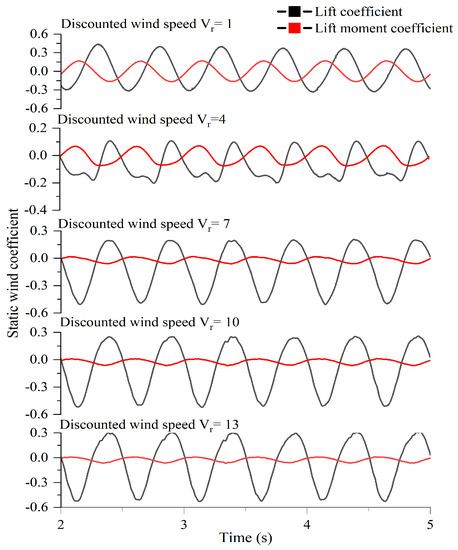
Figure 18.
Aerodynamic time history of torsional forced vibration of the π−type beam.
The critical wind speed is calculated by the Scanlan two-dimensional flutter calculation method, and the relevant parameters of the calculation are shown in Table 6. Based on the calculated flutter derivatives, the effective solutions of the real part equation and the imaginary part equation for the bridge at five converted wind speeds were obtained by preparing a calculation program through MATLAB, and then the curves of the solutions were plotted. Curves’s intersection point is the critical state of the flutter, and the graphical results are shown in Figure 19.
Table 6.
Simulation–related parameter settings.
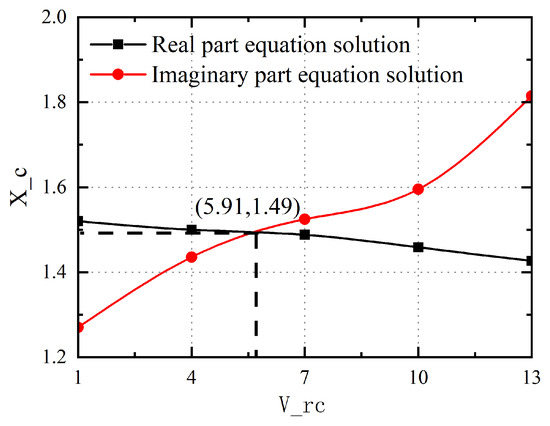
Figure 19.
Graphical method to obtain intersection.
The gives the critical wind speed for flutter as (4),
4. Discussion
Section 3 details the calculation methods of static and dynamic wind for Han River cable-stayed bridges and calculates the three-part force coefficients, vortex vibration, and flutter performance of π-type main girder sections. This section further discusses the effect of deck slope rate on the static and dynamic wind performance of Han River cable-stayed bridges based on the mature calculation method in Section 3.
In order to focus on the influence of the bridge deck cross slope rate on the static and dynamic wind characteristics of the π-shaped combined beam, the bridge deck is uniformly adopted with a double-sided cross slope. In the simulation, the standard section is simplified, and the structural facilities and other bridge deck appurtenances are ignored. Four different deck slope rates of 0%, 1.5%, 2%, and 2.5% are considered for the π-shaped combined beam sections as shown in Figure 20.
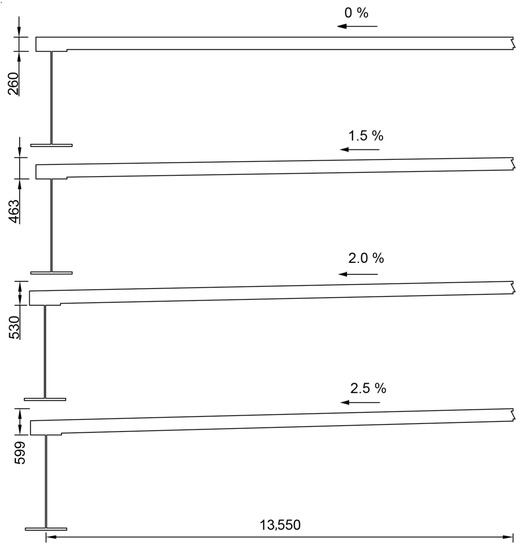
Figure 20.
The different deck slope rates of a π−type composite beam (unit: 10−3 m).
4.1. Effect on Static Wind Three-Component Force Coefficient
Figure 21 shows the comparison results of the three-component force coefficient obtained from the simulation of π-combination beam sections with four different deck cross slope rates. For the purpose of analysis, the wind attack angle and the magnitude of the three-component force coefficient are absolute values. From Figure 21a, it can be seen that the drag coefficient increases with the increase of wind attack angle under four different slope rates, and the value is the smallest at 0° attack angle. The difference is that with the gradual increase of the bridge deck cross slope rates, the deck resistance coefficient gradually decreases. The maximum resistance coefficient when the bridge deck cross slope is not set, and the minimum resistance coefficient when 2.5% of the bridge deck cross slope is set, the change law is basically consistent in the range of −3–3°angle of attack. The reason for the result is that with the increase of the deck slope rate, the contact area between the upper surface of the bridge section and the wind increases, and the frictional resistance caused by the surface viscous shear stress increases. However, the presence of the deck slope makes the obtuseness of the bridge section weaker and the differential pressure resistance decreases. For the blunt section, the differential pressure resistance is much greater than the frictional resistance on the flow resistance, so the overall resistance is reduced, and the resistance coefficient is reduced accordingly. From Figure 21b, it is found that the lift coefficients at four different slope rates have the same trend with the wind angle of attack, and the lift coefficient is close to 0 at 1° angle of attack. Unlike the drag coefficient, there is no obvious relationship between the lift coefficient and the slope of the bridge deck, and the lift coefficients at four different slope rates do not differ much in the range of −3–3° wind attack angle. From Figure 21c, it can be seen that the lift moment coefficient decreases with the increase of wind angle of attack in the four different slope rates, and the maximum value of the lift moment coefficient is obtained at 0° angle of attack, and the value is about 0.04. As the moment coefficient itself is very small, the difference between the moment coefficients due to the different slope rates is almost negligible. From the above analysis, the change in the slope rate of the bridge deck has a large influence on the drag coefficient. Among the four slope rates, the drag coefficient is the smallest at 2.5% deck slope, and the design takes a 2.0% deck slope to make the bridge section relatively less affected by static wind. However, the three-part force coefficient obtained from a 0% cross slope can be used for subsequent wind analysis to retain sufficient safety reserve space when designing the bridge for wind resistance.
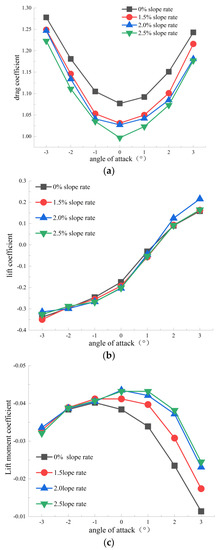
Figure 21.
Influence of bridge deck cross slope ratio on three−component force coefficient. (a) drag coefficient. (b) lift coefficient. (c) lift moment coefficient.
4.2. Effect on Flutter Stability
The variation of the eight aerodynamic derivatives with the discounted wind speed obtained from simulations of π-combined beam sections for four different bridge deck cross slope rates is shown in Figure 22. It can be seen that the eight aerodynamic derivatives at four different bridge deck cross slope rates have basically the same trend with the change in the discounted wind speed. The values of flutter derivatives H*1, H*3, A*1, and A*3 hardly change with the change in deck cross slope rate, and the deck cross slope rate has almost no effect on these four aerodynamic derivatives. The flutter derivatives values H*2, H*4, A*2, and A*4 also hardly changed with the change in the deck cross slope before the discounted wind speed 10. However, after the discounted wind speed 10, their values were more different, and the difference in their values tended to become larger as the wind speed increased. In general, the eight flutter derivatives are not very sensitive to the change in the bridge deck cross slope up to the discounted wind speed 13, and further analysis is needed for the discounted wind speed greater than 13.
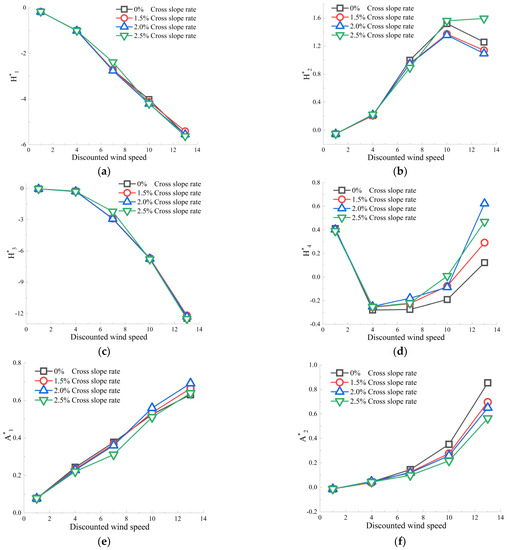
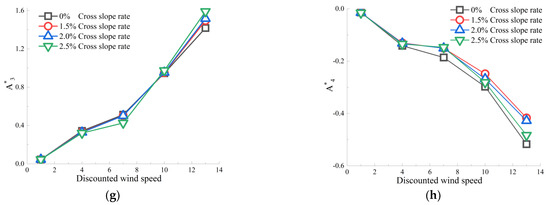
Figure 22.
Variation of aerodynamic derivative with the discounted wind speed for different bridge deck cross slope ratios. (a) variation of aerodynamic derivative of H*1. (b) variation of aerodynamic derivative of H*2. (c) variation of aerodynamic derivative of H*3. (d) variation of aerodynamic derivative of H*4. (e) variation of aerodynamic derivative of A*1. (f) variation of aerodynamic derivative of A*2. (g) variation of aerodynamic derivative of A*3. (h) variation of aerodynamic derivative of A*4.
Table 7 shows flutter critical wind velocity for the π-beam section based on the identification of flutter derivatives for four different bridge deck cross slope rates of 0%, 1.5%, 2.0%, and 2.5%. According to the bridge wind resistance design code, the flutter test wind speed at the bridge site of this cable-stayed bridge is 51.6 m/s. It is clear that the flutter critical wind speeds obtained under the four different bridge deck cross slope ratios are far greater than the flutter test wind speeds of the bridge. Therefore, it is difficult for the bridge to be damaged by flutter within the range of 2.5% cross slope rate. In addition, it is found that the critical flutter wind speed of the real bridge is the smallest when the bridge deck cross slope is not set, and the critical flutter wind speed of the real bridge is the largest when the bridge deck cross slope is 2.5%. The existence of the bridge deck slope rate increases the critical flutter wind speed of the bridge.
Table 7.
Flutter critical wind speed with different deck cross slope ratios.
5. Conclusions
In this paper, the finite element dynamic model of the Han River Bridge was established by using ANSYS software. Based on the obtained dynamic characteristics of the bridge, the static and dynamic wind characteristics of the Han River cable-stayed bridge and the influence of the cross slope of the bridge deck on the wind characteristics of the π-type combination beam were analyzed by CFD numerical simulation. The following conclusions are obtained.
- (1)
- The static wind characteristics, vortex vibration performance, and flutter stability of the π-combined beam section of the Han River cable-stayed bridge were analyzed by numerical simulation, which provided a design reference for the preliminary wind resistance study. According to the analysis of the static wind characteristics of the Han River cable-stayed bridge, it is found that the change of the cross-slope of the beam section has a large influence on the resistance coefficient. The beam section with a 2.0% cross slope is relatively less affected by wind resistance, and the beam section without a cross slope can be used as the design benchmark to retain sufficient safety reserve space during design.
- (2)
- The vortex vibration was calculated for the π-shaped beam section of the Han River cable-stayed bridge by the loose-coupling method, so as to determine the wind speed “locking interval” as well as the maximum amplitude. It is found that the “locking phenomenon” occurred when the main beam vibration amplitude was larger in the wind speed range of 2.5–4.0 m/s. At the same time, the continuous vortex shedding up and down on the leeward side of the beam led to the vertical vortex-induced vibration of the π-shaped main beam section. It is necessary to further study the vibration suppression measures.
- (3)
- Eight aerodynamic derivatives of the Han River cable-stayed bridge were identified based on the time-domain method, and their flutter critical wind speeds were calculated. Within the discounted wind speed 13, the eight flutter derivatives are not very sensitive to the changes of the bridge deck cross slope ratios 0%, 1.5%, 2.0%, and 2.5%. However, compared with the case of no bridge deck cross slope, setting a certain bridge deck cross slope increases the flutter critical wind speed of the cable-stayed bridge. Due to the limited cases of bridge deck cross slope rates considered in the paper, the relationship between critical wind speed and bridge deck cross slope rates needs to be further investigated.
Author Contributions
Methodology, S.Z.; Software, S.Z.; Validation, X.W.; Investigation, S.Z.; Resources, X.W.; Writing—original draft, S.Z.; Supervision, X.W. All authors have read and agreed to the published version of the manuscript.
Funding
This research was funded by National Natural Science Foundation of China grant number 51178361 and Natural Science Foundation of Hubei Province grant number 2013CFB342.
Data Availability Statement
The data presented in this study are available on request from the corresponding author. The data are not publicly available due to the lab’s confidentiality policy.
Conflicts of Interest
We declare that we have no competing financial interest or personal relationships that could have appeared to influence the work reported in this paper.
References
- Gao, G.; Zhu, L.; Han, W.; Li, J. Nonlinear post-flutter behavior and self-excited force model of a twin-side-girder bridge deck. J. Wind Eng. Ind. Aerodyn. 2018, 177, 227–241. [Google Scholar] [CrossRef]
- Vu, T.V.; Kim, Y.M.; Lee, H.E. Coupled flutter analysis of long-span bridges using full set of flutter derivatives. KSCE J. Civ. Eng. 2016, 20, 1501–1513. [Google Scholar] [CrossRef]
- Wu, B.; Liao, H.; Shen, H.; Wang, Q.; Mei, H.; Li, Z. Multimode coupled nonlinear flutter analysis for long-span bridges byconsidering dependence of flutter derivatives on vibration amplitude. Comput. Struct. 2022, 260, 106700. [Google Scholar] [CrossRef]
- Ruiheng, W. Study on the Stability of the Tower of a Single-Column Cable-Stayed Bridge with Variable Sections. Master’s Thesis, Chongqing University, Chongqing, China, 2019. [Google Scholar]
- Zhichao, Y.; Jianxin, Y.; Zhijun, N.; Ruiheng, W.; Liangliang, Z. Research on pylon galloping vibration of single-column bridge with variable cross-section of cable-stayed bridge. Highway 2020, 65, 207–211. [Google Scholar]
- Du, L.; Sun, X. Suppression of vortex-induced vibration using the rotary oscillation of a cylinder. Phys. Fluids 2015, 27, 023603. [Google Scholar] [CrossRef]
- Wang, W.; Wang, X.; Hua, X.; Song, G.; Chen, Z. Vibration control of vortex-induced vibrations of a bridge deck by a single-side pounding tuned mass damper. Eng. Struct. 2018, 173, 61–75. [Google Scholar] [CrossRef]
- Li, M.; Sun, Y.; Jing, H.; Li, M. Vortex-induced vibration optimization of a wide streamline box girder by wind tunnel test. KSCE J. Civ. Eng. 2018, 22, 5143–5153. [Google Scholar] [CrossRef]
- Kavrakov, I.; Argentini, T.; Omarini, S.; Rocchi, D.; Morgenthal, G. Determination of complex aerodynamic admittance of bridge decks under deterministic gusts using the Vortex Particle Method. J. Wind. Eng. Ind. Aerodyn. 2019, 193, 103971. [Google Scholar] [CrossRef]
- Lei, S.; Cui, W.; Patruno, L.; de Miranda, S.; Zhao, L.; Ge, Y. Improved state augmentation method for buffeting analysis of structures subjected to non-stationary wind. Probabilistic Eng. Mech. 2022, 69, 103309. [Google Scholar] [CrossRef]
- Ma, T.; Cui, W.; Zhao, L.; Yang, Y.; Ge, Y. Optimization of long-span suspension bridge erection procedure considering flutter risk in mixed extreme wind events. J. Wind Eng. Ind. Aerodyn. 2022, 222, 104889. [Google Scholar] [CrossRef]
- Haque, M.N.; Katsuchi, H.; Yamada, H.; Kim, H. Influence of geometric configuration on aerodynamics of streamlined bridge deck by unsteady RANS. Wind. Struct. Int. J. 2019, 28, 331–345. [Google Scholar]
- Haque, M.; Katsuchi, H.; Yamada, H.; Nishio, M. Investigation of edge fairing shaping effects on aerodynamic response of long-span bridge deck by unsteady RANS. Arch. Civ. Mech. Eng. 2016, 16, 888–900. [Google Scholar] [CrossRef]
- Guoqiang, Z. Influence of Railing Structure on Vortex-Induced Vibration of π-Shaped Bridge Section. Master’s Thesis, Chang’an University, Xi’An, China, 2015. [Google Scholar]
- Lee, H.; Moon, J.; Chun, N.; Lee, H.E. Effect of beam slope on the static aerodynamic response of edge-girder bridge-deck. Wind. Struct. 2017, 25, 157–176. [Google Scholar]
- Bruno, L.; Mancini, G. Importance of deck details in bridge aerodynamics. Struct. Eng. Int. 2002, 12, 289–294. [Google Scholar] [CrossRef]
- Wang, Q.; Liao, H.; Li, M.; Ma, C. Influence of aerodynamic configuration of a streamline box girder on bridge flutter and vortex-induced vibration. J. Mod. Transp. 2011, 19, 261–267. [Google Scholar] [CrossRef]
- 18. Shiling. Study on Shear Lag Effect of Main Girder of Cable-Stayed Bridge with Combined Beam. Master’s Thesis, Zhejiang University, Hangzhou, China, 2019.
- Thai, L.M.; Luat, D.T.; Van Ke, T.; Phung Van, M. Finite-Element Modeling for Static Bending Analysis of Rotating Two-Layer FGM Beams with Shear Connectors Resting on Imperfect Elastic Foundations. J. Aerosp. Eng. 2023, 36, 04023013. [Google Scholar] [CrossRef]
- Phung, M.V.; Nguyen, D.T.; Doan, L.T.; Nguyen, D.V.; Duong, T.V. Numerical investigation on static bending and free vibration responses of two-layer variable thickness plates with shear connectors. Iran. J. Sci. Technol. Trans. Mech. Eng. 2022, 46, 1047–1065. [Google Scholar] [CrossRef]
- Feng, W. Analysis of wind resistance performance of long-span continuous bridges based on CFD. Highw. Eng. 2018, 3. [Google Scholar]
- Mannini, C.; Šoda, A.; Schewe, G. Unsteady RANS modelling of flow past a rectangular cylinder: Investigation of Reynolds number effects. Comput. Fluids 2010, 39, 1609–1624. [Google Scholar] [CrossRef]
- Matsumoto, M.; Yagi, T.; Tamaki, H.; Tsubota, T. Vortex-induced vibration and its effect on torsional flutter instability in the case of B/D = 4 rectangular cylinder. J. Wind Eng. Ind. Aerodyn. 2008, 96, 971–983. [Google Scholar] [CrossRef]
- Shaobo, W.; Yuanjie, L.; Xingpei, L.; Minghao, Z.; Zhengwei, W. Coupled vibration analysis of elastic plate in viscous fluid. Chin. J. Mech. Eng. 2004, 40, 63–66. [Google Scholar]
- Zhixiong, W.; Zhitian, Z.; Kai, Q.; Changqing, W. Research on bending-torsional coupled vortex-induced resonance and aerodynamic vibration reduction measures of π-shaped open-section cable-stayed bridge. Vib. Shock. 2021, 40, 52–57, 94. [Google Scholar]
- Yihua, C. Forced Vibration Simulation Identification and Application of Wing Segment Flutter Derivatives. PhD Thesis, Nanjing University of Aeronautics and Astronautics, Nanjing, China, 2005. [Google Scholar]


Disclaimer/Publisher’s Note: The statements, opinions and data contained in all publications are solely those of the individual author(s) and contributor(s) and not of MDPI and/or the editor(s). MDPI and/or the editor(s) disclaim responsibility for any injury to people or property resulting from any ideas, methods, instructions or products referred to in the content. |
© 2023 by the authors. Licensee MDPI, Basel, Switzerland. This article is an open access article distributed under the terms and conditions of the Creative Commons Attribution (CC BY) license (https://creativecommons.org/licenses/by/4.0/).