Article

Early Identification of Gait Asymmetry Using a Dual-Channel Hybrid Deep Learning Model Based on a Wearable Sensor

1
College of Computer and Cyber Security, Fujian Normal University, Fuzhou 350117, China
2
School of Management, University of Bristol, Bristol BS8 1QU, UK
*
Author to whom correspondence should be addressed.
Symmetry 2023, 15(4), 897; https://doi.org/10.3390/sym15040897
Submission received: 13 March 2023 / Revised: 2 April 2023 / Accepted: 3 April 2023 / Published: 12 April 2023

Abstract

:
Background: Lack of an effective approach to distinguish the subtle differences between lower limb locomotion impedes early identification of gait asymmetry outdoors. This study aims to detect the significant discriminative characteristics associated with joint coupling changes between two lower limbs by using dual-channel deep learning and wearable sensors, helping to detect asymmetric gait early. Methods: The gait data of sensors attached on lower limb joints of twenty-four healthy subjects were acquired by using the Delsys TrignoTM system. Asymmetric gait was simulated by controlling ankle motion settings. The CNN–LSTM hybrid deep learning-based gait classification model with high-generalization, was developed to discriminate one normal limb gait and the other limb gait with four different settings, accurately measuring asymmetric gait. Results: Our developed model could reach a high accuracy of 98.61% to detect mild gait asymmetry, while obtaining an approximate accuracy of 50% to identify gait symmetry. The ankle contains more information about gait asymmetry than the hip and knee. Conclusions: Our technique could achieve excellent representation of learning capability to detect significantly discriminative gait features from dual-channels corresponding to the two lower limbs, even with subtle differences.

1. Introduction

Gait, as a basic human activity in daily life, is a complex locomotion that originates from high level interactions between skeleton, joints and muscles under the control of the central nervous system and peripheral nervous system [1]. Gait symmetry is one of the most important characteristics for evaluating gait function. Perfect symmetry of gait not only has a great contribution to normal walking with the lowest oxygen consumption and energy cost, but can also indicate good health status in people. In the clinical setting, the evaluation of gait asymmetry is usually proposed in order to detect pathological gait such as postural instability, walking disorders and so on [2]. In addition, asymmetrical gait may result in an increase in the risk of osteoarthritis and musculoskeletal injury, and loss of bone mass density in the affected limb [3,4]. Therefore, early identification of gait asymmetry is of great benefit to the early diagnosis of possible gait function disorders [5,6]. The early recognition of gait asymmetry with the best accuracy has been a challenging endeavor in gait analysis. Considering that gait symmetry is hypothesized as the same function of movement between the left and right side of the body, many studies have attempted to search for quantitative techniques that can examine the significant differences between two limb locomotion, in order to accurately discriminate gait asymmetry [7,8,9]. Their research has mainly involved two aspects: gait data acquisition and gait symmetry assessment methods. The three-dimensional gait analysis system consisting of a camera-based motion capture system and the tri-axial force plates has usually been used for gait data acquisition. The acquired gait parameters mainly include kinematic and kinetic parameters such as gait cadence, gait velocity, stride length, stance duration, swing duration, joint angles, foot–ground reaction force, and so on [10,11,12]. Based on the collected gait parameters, various methods to measure gait symmetry or asymmetry have been proposed in relevant studies. These methods mainly included discrete approaches (i.e., symmetry indices), statistical algorithm-based approaches, and nonlinear approaches. The examples of symmetry indexes mainly included the ratio index, Robinson index [12], and symmetry angle. Although these investigations have made remarkable achievements, there exist some shortcomings, such as poor accuracy in identifying the subtle differences between two limb locomotion, and acquisition of gait parameters required in the special laboratory environment [13,14,15]. In particular, these works do not take into account measuring gait asymmetry in non-clinical environments such as at home or outdoors [16].
Recently, wearable sensors based on Micro-Electro-Mechanical Systems (MEMS) have been attracting increasing attention in the measurement of gait symmetry or asymmetry. Their advantages are accuracy, reliability, low-cost, and easier use in the outdoor environment [17,18]. These sensors are usually equipped with an accelerometer and a gyroscope. They are commonly attached to different anatomical parts of the body, in order to acquire time-series data containing human locomotion information. In view of the non-linearity, non-stationary and stochastic properties of the IMU sensor data, machine learning models with superior learning capabilities have been popularly applied to identify asymmetric gait in recent research. Their basic idea is that the identification of the difference between two limb locomotion (i.e., asymmetric gait) was considered a binary classification task. They tried to develop machine learning-based gait classification models with high-generalization for accurately discriminating the small changes in gait symmetry. For example, Aleš Procházka et al. evaluated motion symmetry by developing shallow machine learning models such as k-nearest neighbors(KNN), Bayesian approach, support vector machine(SVM), and artificial neural networks(ANN) based on a IMU sensor that included accelerometer and gyroscope data from the right and left leg [19]. Passara Chanchotisatien et al. also illustrated the feasibility of the identification of gait deviation levels of patients with foot or ankle impairment by constructing shallow machine learning models such as random forest(RF) and SVM based on inertial and load sensor data from a wearable controlled ankle motion boot [20]. Although these works have achieved fruitful research results, they could yield poor generalization performance because of shallow machine learning with limitations such as over-fitting and gradient vanishing.
Additionally, some recent investigations have attempted to develop the deep learning-based gait classification model for accurately detecting asymmetric gait. Their basic idea was that the excellent representation learning ability of deep learning can be taken advantage of by capturing the most representative discriminative features between two limb locomotion from wearable sensor data. Most of the studies showed the feasibility of construction of a convolutional neural network(CNN) or long short-term memory(LSTM)-based gait classification model for precisely identifying asymmetric gait using wearable sensor data [21,22]. Some recent investigations have used wearable sensors’ data to evaluate gait symmetry based on indicators such as joint angles.Their research also achieved remarkable performance in preventing falls, rehabilitation, healthcare and so on [23,24,25,26].Although recent research has made promising progress, they discovered the difficultly of the most representative gait features associated with limb locomotion from wearable sensor data. As we know, human gait represents a bipedal locomotion in a spatiotemporally complex fashion because of coupling across multiple limb joints of primary kinetic chains. However, recent studies applied CNN or LSTM so as not to exploit the most representative spatiotemporal gait dynamic characteristics associated with limb locomotion [27]. In particular, much recent research only considered a single or a few anatomical points of the limb or body, and did not take into account the coupling action across limb joints. These shortcomings could greatly limit the achievement of the best generalization capability to recognize asymmetric gait early. It is necessary to search for effective methods to overcome these limitations. To date, no studies with a technical solution for these limitations has been reported.
In this study, we propose a novel dual-channel hybrid deep learning model of CNN and LSTM to accurately measure asymmetric gait based on wearable sensors. Our basic idea is that the dual-channels correspond to the right and left side limbs, respectively. Each channel with identical CNN-LSTM hybrid deep learning architecture was utilized to exploit the most representative spatiotemporal gait dynamic features associated with the corresponding limb locomotion. This aims to detect the significantly discriminative gait features between the two side limbs’ locomotion for the best generalization capability to detect gait asymmetry early. To effectively evaluate our proposed method, we employed the Delsys TrignoTM system to acquire multi-sensor data from the lower limb joints of recruited healthy participants. Three wearable sensors equipped with accelerometer and gyroscope were attached to hip, knee and ankle joints of two lower limbs, respectively. A controlled ankle motion boot with adjustable angle of automatic chuck was worn on a lower limb to simulate the different levels of asymmetric gait [28]. In order to gain more valuable information about coupling across three joints of the lower limb [29], gait pattern was defined as a matrix fusing three sensors’ data attached to a lower limb. For each channel, CNN was firstly adopted to extract the spatial gait features from the defined gait pattern, and then LSTM was employed to explore the temporal dependence of gait features from the extracted spatial gait features. This could exploit the most representative spatiotemporal gait dynamic features associated with lower limb locomotion [29,30]. So, the dual-channel deep learning model could detect significant discriminative characteristics between two lower limbs’ locomotion. This greatly improved the generalization ability to detect the subtle differences between two lower limbs. A ten-fold cross-validation scheme was employed to examine the generalization performance. Experimental results showed that our proposed model could achieve a highest accuracy of 98.6% to identify mild asymmetry of gait simulated, while it could gain an accuracy of approximately 50% to detect gait symmetry. Moreover, the proposed model significantly outcompeted the compared models such as CNN, LSTM and SVM, and could achieve the best generalization ability to identify asymmetric gait early. In addition, the present study also found that the ankle joint contains more discriminative information associated with gait asymmetry than the hip and knee joint.

2. Materials and Methods

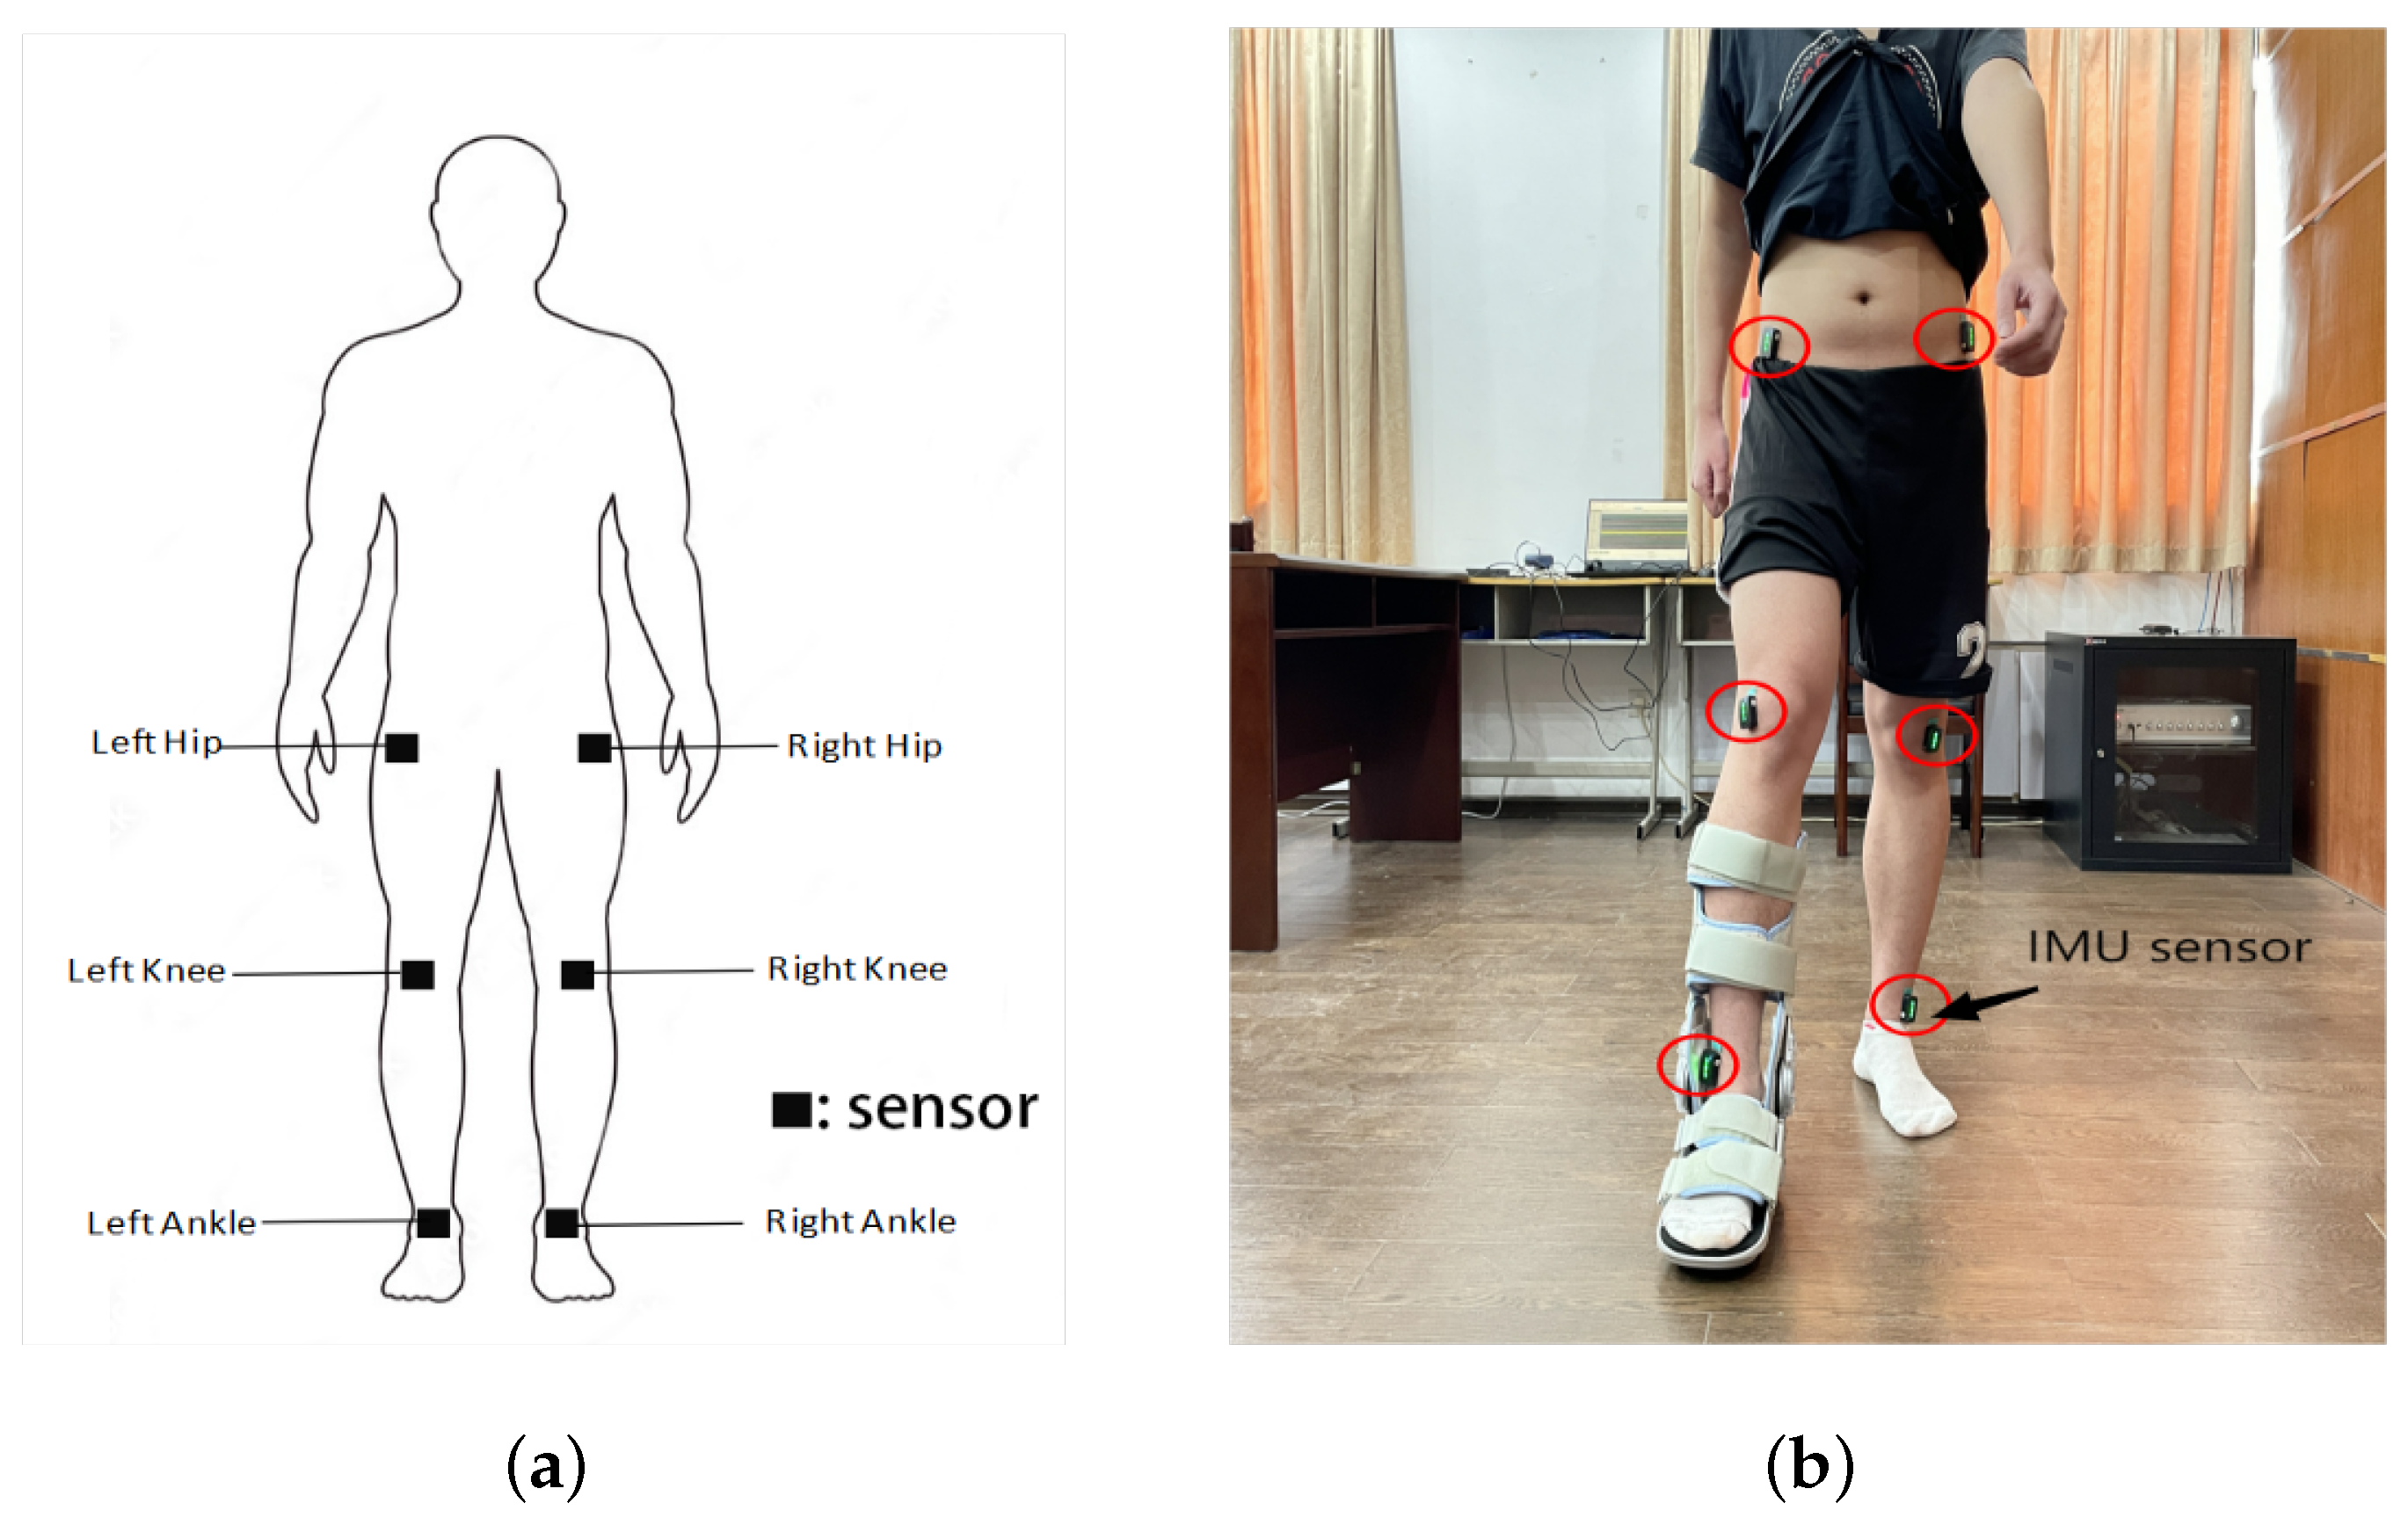
2.1. Acquisition of Multi-Sensor Data

Twenty-four healthy participants including 10 women and 14 men were recruited from Fujian normal university. Their mean age, weight and height were 23 ± 2.6 years, 70.77 ± 26.24 kg and 170.17 ± 15.3 cm, respectively. All participants had no known injuries or abnormalities that affected their walking pattern, and they agreed to participate by informed consent approved by the ethical Ethics Committee of Fujian Normal University.
In our scheme, a controlled ankle motion boot with an adjustable angle of automatic chuck [31,32], as shown in Figure 1a, was worn on a lower limb to simulate the different levels of asymmetric gait. The range of adjustable angle was from 0 to 40 degrees. The example of 20 degrees of adjusted angle is presented in Figure 1b.
We employed the Delsys TrignoTM system including Trigno wireless systems and wireless IMU sensors (Delsys Inc., Boston, MA, USA) to acquire on-body multi-sensor data. Six wireless IMU sensors were attached on the hip, knee and ankle joint of two lower limbs, respectively, as shown in Figure 2a, in order to gain more valuable information about coupling across joints of lower limb locomotion. Each wireless IMU sensor (size: 27 × 37 × 13 mm, weight: 10 g) is integrated with a tri-axial accelerometer (acceleration up to ±16 g), a tri-axial gyroscope (angular velocity up to 2000 degree/s) and magnetometer. The data from the accelerometer and gyroscope were only utilized in the present study. All six IMU sensors were connected via wireless communication to the Delsys Sensor Base that can transfer sensor data in real-time to the PC using the USB interface. Data transmission protocol from sensors to base (i.e., 2.400–2.483 GHz ISM Band, Proprietary RF Protocol BLE V4.2) was used. All data from six sensors were synchronously acquired by using EMGWorks 4.3.1 Acquisition software (Delsys Inc., Boston, MA, USA). Figure 2b shows an example of six wireless IMU sensors positioned on hip, knee and ankle joint of two lower limbs of a subject wearing a controlled ankle motion boot.
Prior to data collection, each participant was first asked to wear the controlled ankle motion boot on right or left lower limb, and six wireless IMU sensors were localized on the hip, knee and ankle of two lower limbs. Then, each subject was given 2 min to become familiar with walking in the laboratory when the adjustable angle of the automatic chuck was set to 0 degrees, 20 degrees and 30 degrees, respectively. During data collection, all subjects were asked to walk on a 20 m laboratory walkway at a comfortable walking speed. Each subject was asked to, respectively, perform four walking patterns wearing no boot (i.e., normal walking), wearing a boot with 0 degrees of adjusted angle, wearing a boot with 20 degrees of adjusted angle, and wearing a boot with 30 degrees of adjusted angle. After the data collection of one walking pattern had ended, each subject was asked to rest for 2 min before starting the next one. The sampling frequency of both the accelerometer and gyroscope was set to 144 Hz, and three minute periods of data were recorded. For all six sensors data from each walking pattern was recorded three times. Examples of the recorded tri-axial accelerometer and gyroscope data are illustrated Figure 3a,b, respectively. As shown in Figure 3, these collected data with nonlinearity could contain the most valuable feature information associated with right and left lower limb locomotion. Our proposed model was to detect the significant discriminative features between the two lower limbs from the collected data, which helps to detect asymmetric gait early. The detailed description of our proposed model for identifying gait asymmetry early is presented as follows.

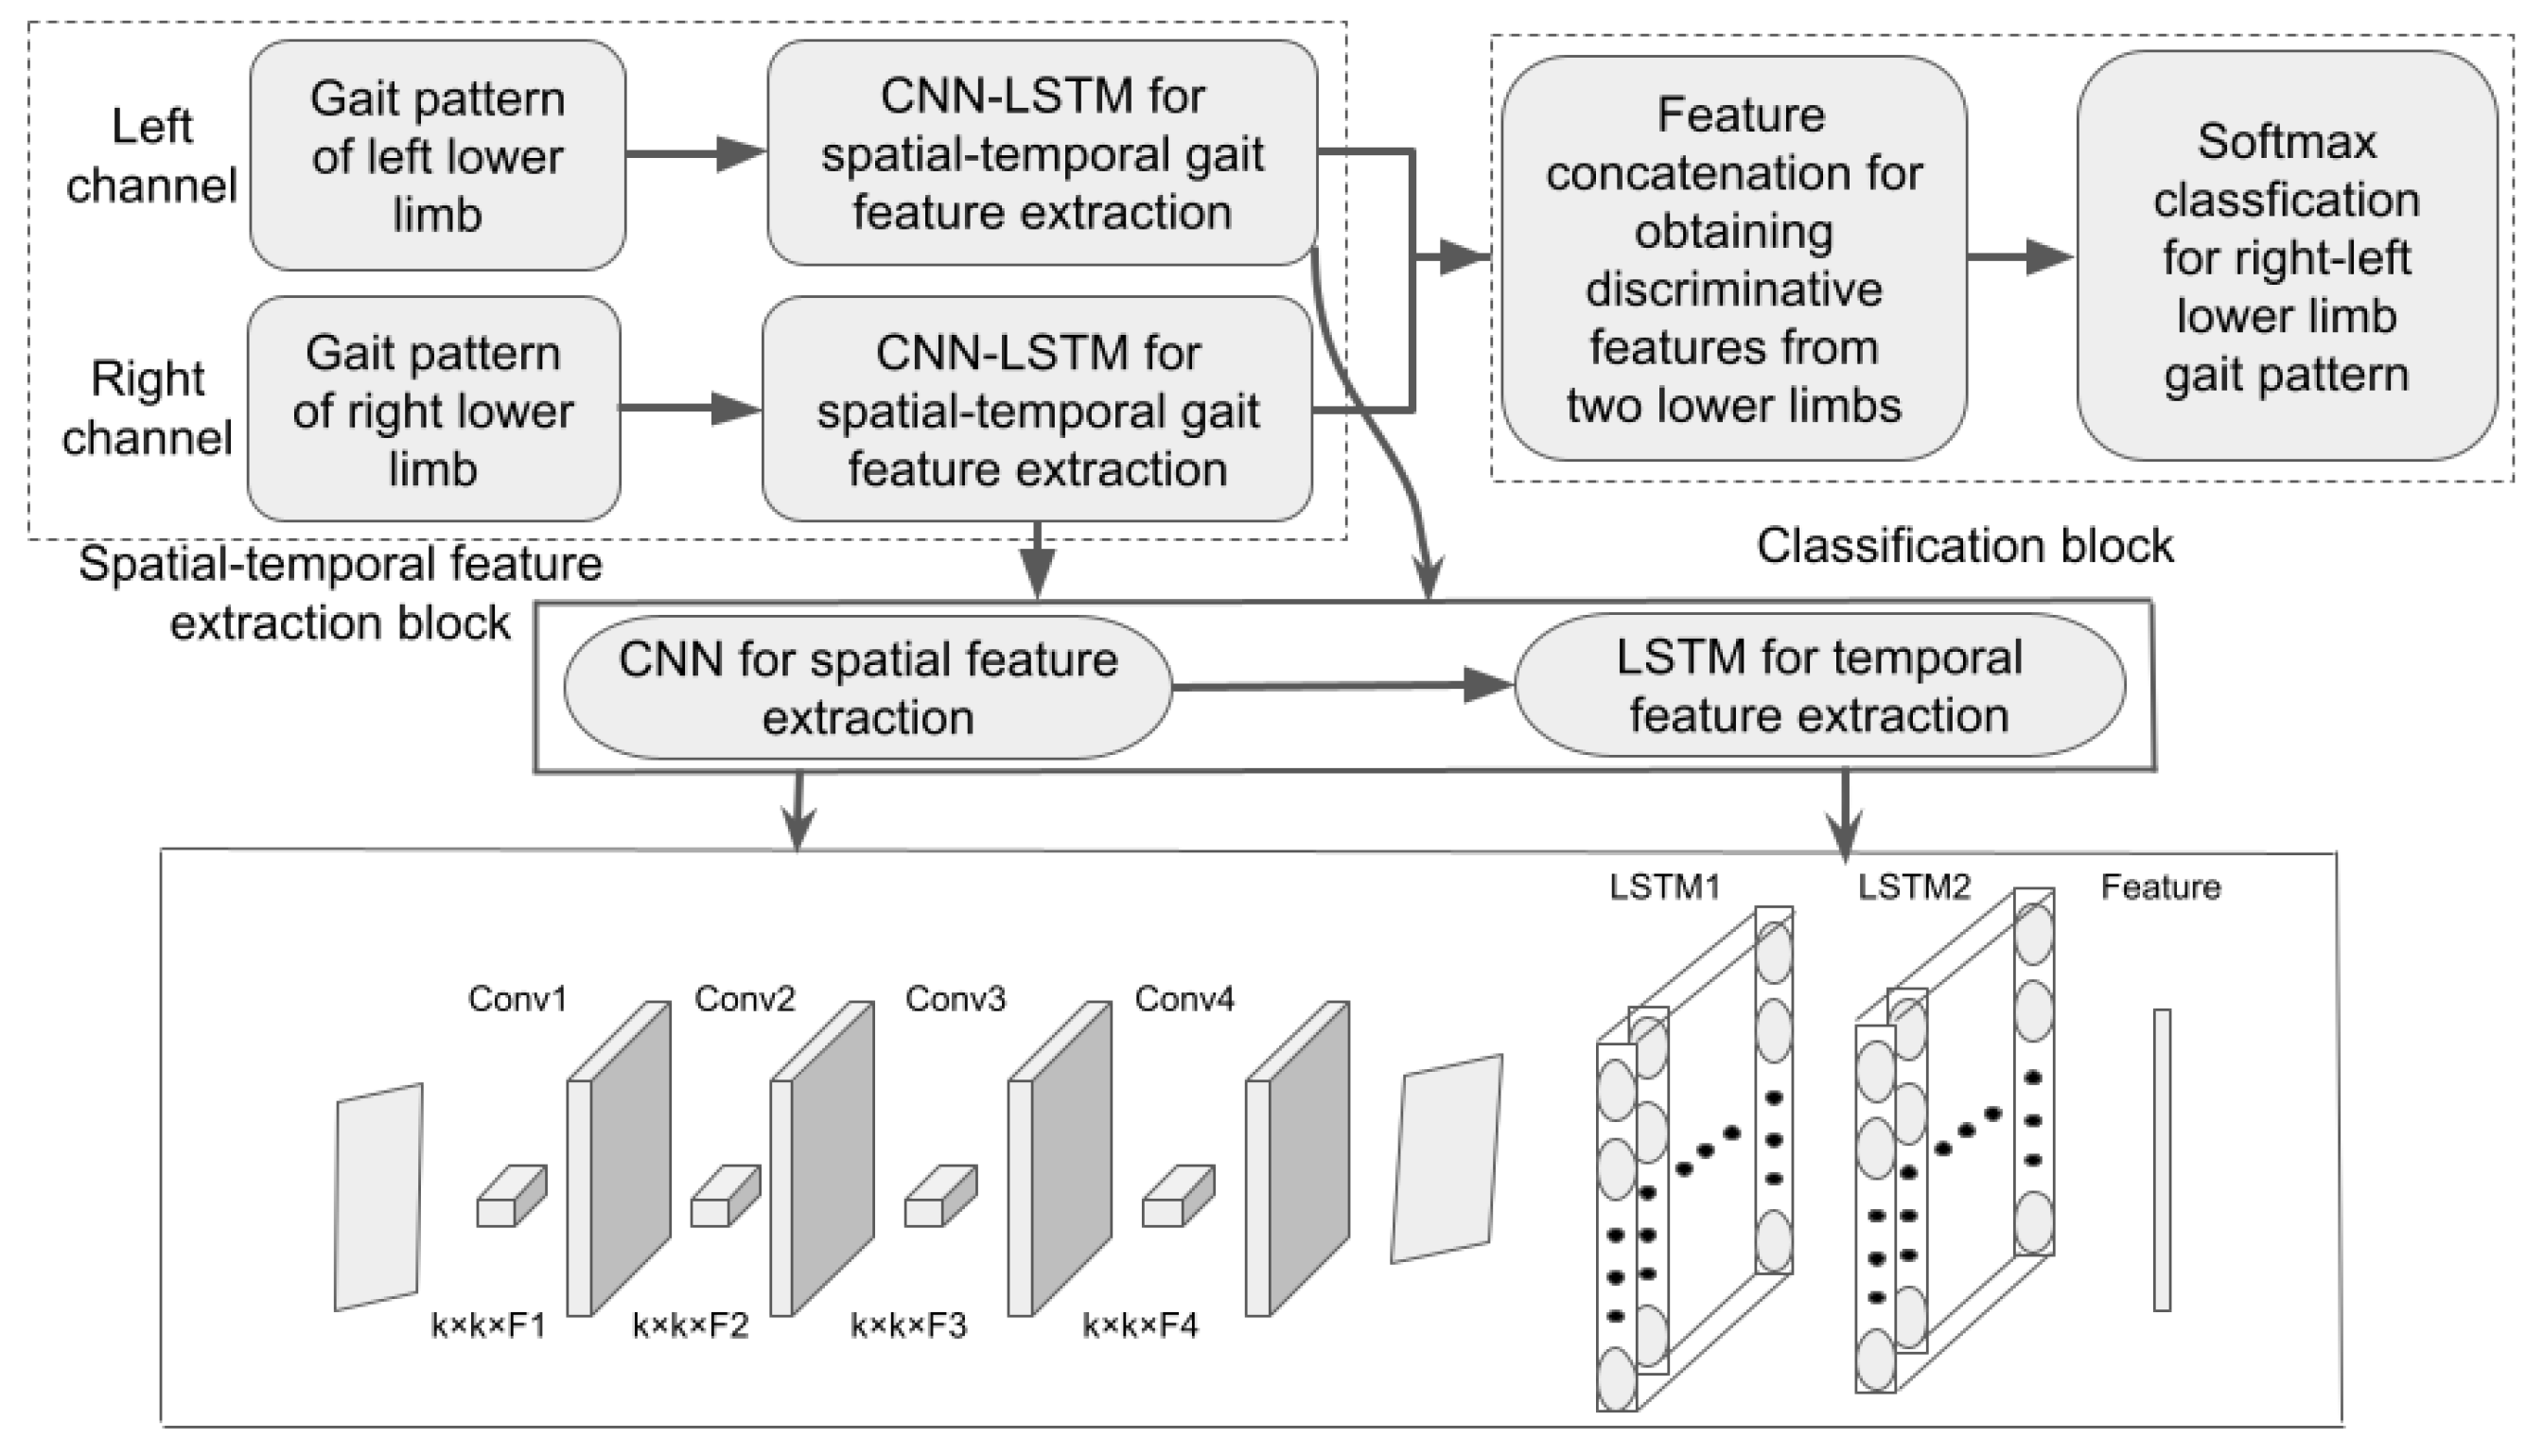
2.2. Cnn-Lstm Hybrid Deep Learning Gait Classification Model

We proposed the CNN-LSTM hybrid deep learning gait classification model for accurately identifying asymmetric gait. Our proposed model mainly included a spatiotemporal feature extraction block and classification block, as shown in Figure 4. In the first block, the dual-channel consists of right and left channels that correspond to right and left lower limbs, respectively. Each channel has the same hybrid deep learning model of CNN with four convolution layers and LSTM with two layers, in order to discover the most representative spatotemporal gait dynamic features from multi-sensor data of the corresponding gait pattern of the lower limb. The basic idea was that CNN was firstly used to extract the spatial gait features, and then LSTM was adopted to explore the temporal dependence features from the exact spatial gait features. The second block mainly includes feature concatenation and softmax classification. Feature concatenation is to concatenate all obtained spatiotemporal features from two limbs as a discriminative features vector. Softmax classification is to accurately identify gait patterns from right and left lower limbs with maximum probability. The detailed description of the solution algorithm of our proposed technique is presented as follows.

2.2.1. Definition of Gait Pattern of a Lower Limb

First, based on multi-sensor data from a lower limb, we defined gait patterns that contain more useful information about coupling across joints of the lower limb. Given that there are a total of N sensors attached to the different joints of a lower limb, the gait data of the sensor n n = 1 , 2 , · · · , N at time t is defined as vector a n t R s where S represents the number of features dimension of wearable sensor data.
According to the vector n, the gait pattern of the sensor during a length of time T is defined as a matrix A T n :
A = a 1 1 , a 2 2 , , a t n , , a T R S × T
Based on Equation (1), the gait pattern of a lower limb with all N sensors during T time length can be defined as a matrix Q:
Q = A 1 , A 2 A N R N S × T
The defined matrix Q can fuse multi-sensor data closely associated with coupling across joints of a lower limb. Then, according to Equation (2), the gait pattern from two lower limbs is defined as matrix X:
X = Q r , Q l = Q 1 , 1 , Q 1 , 2 Q G , Z R O × 2 Z
where Q r and Q l represent gait patterns of right and left lower limbs, respectively. Z denotes the total sample size of gait patterns from two lower limbs, and O = N S × T represents the number of features dimension of the data.
So, according to Equation (3), a sample dataset for a training and testing model can be defined as a matrix D:
D = X 1 , , X P = Q 1 r , Q 2 r , , Q Z r , Q 1 l , Q 2 l , , Q Z l R O × 2 Z P
where P represents the total number of subjects. Next, based on the defined sample dataset D, our constructed model could detect the significantly discriminative spatiotemporal characteristics between two lower limbs for identifying asymmetric gait.

2.2.2. Cnn for Spatial Gait Feature Extraction

CNN is first employed to exploit the most representative gait spatial features by constructing multiple convolution layers for expansion of the receptive field [33,34]. Given that there are L layers of CNN with different kernels, the gait spatial features y k of the k k = 1 , 2 , · · · , L layer can be extracted by the following definition:
y k = f Q i j k · W i j k + b k
where Q i j k denotes an input matrix of the layer. f · , · , W i j k , b k represents the activation function, inner product, the convolution kernel vector and the bias value, respectively.
In the present study, in view of the small sample size, we constructed four convolution layers with different convolution kernels without pooling layers, in order to discover the most representative spatial feature from multi-sensor data. In addition, the dropout layer was added to two convolution layers to avoid over-fitting and improve generalization ability. We selected the Relu function as the activation function. Therefore, based on the Equation (5), we could first discover the spatial feature vector of right and left lower limb when gait patterns of right and left lower limb from the sample dataset D, were served as the input of the dual-channel.
Then, the spatial features extracted by CNN were used as the input of LSTM to explore temporal dependency of the extracted spatial features in each channel, in order to capture the most representative spatiotemporal gait dynamic features associated with coupling across the joints of the lower limb.

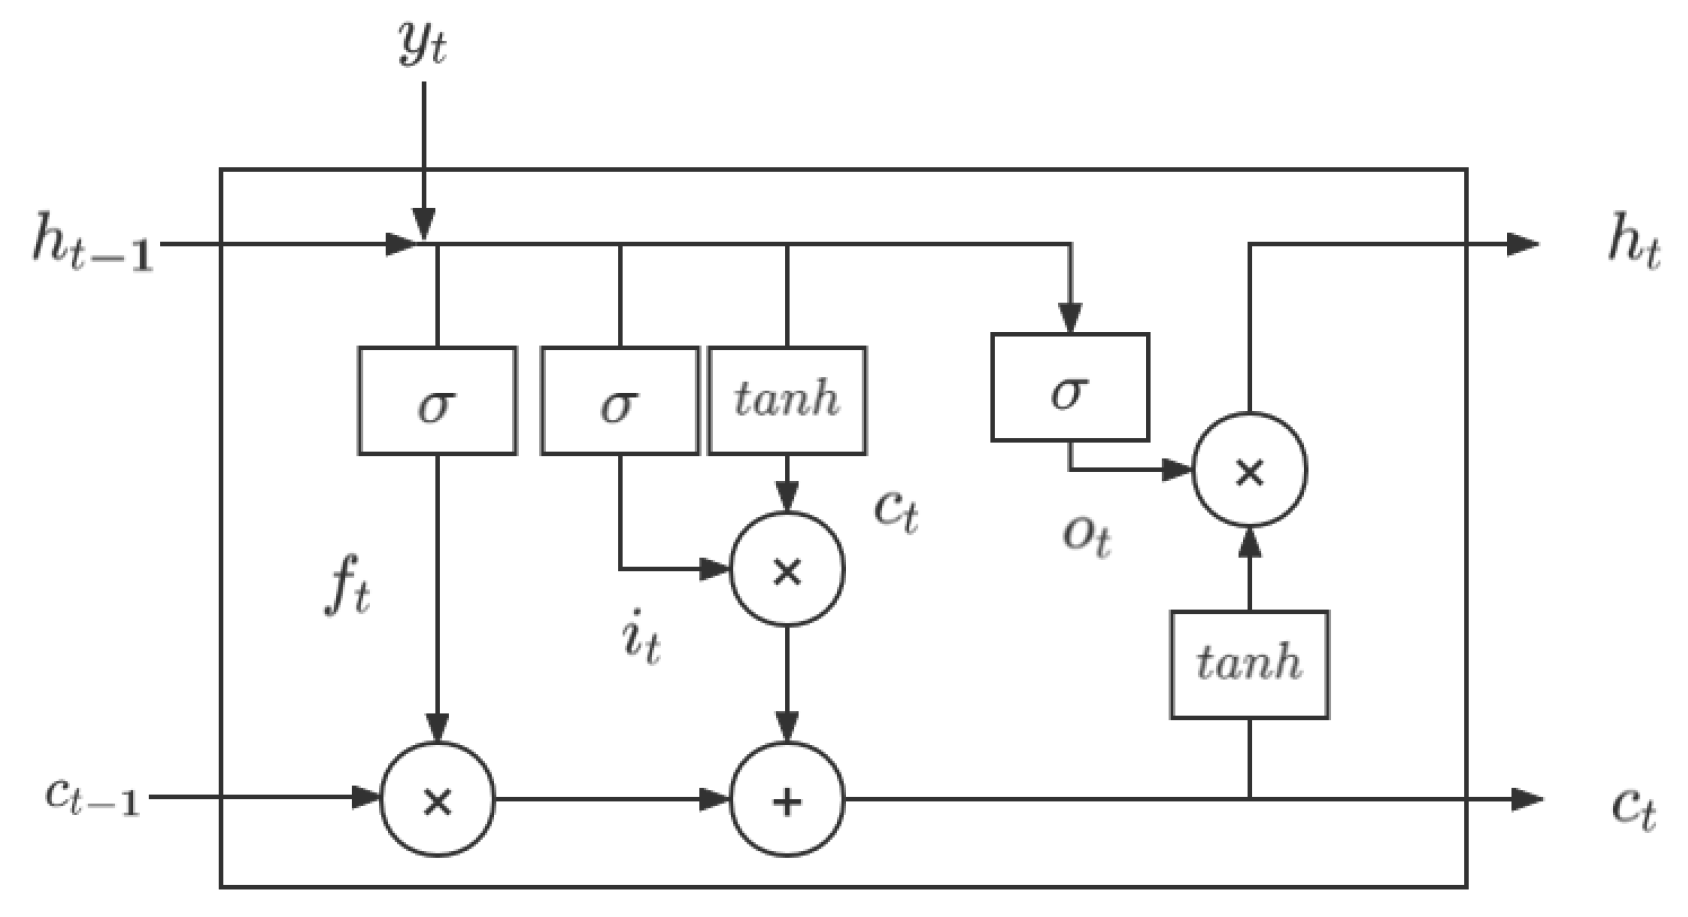
2.2.3. LSTM for Capturing Temporal Dependence Hidden in Gait Spatial Features

LSTM is an advanced recurrent neural network architecture including many basic cells that combines previous computation with current computation [35]. The basic cell, as shown in Figure 5, has superior learning ability to capture intrinsic temporal correlation features in time-series data by computing the memory unit C t , the input gate i t , forget gate f t and output gate O t . In this study, when a spatial gait feature y t k at t time stamp are used as input for the basic cell with the useful information about memory unit and hidden state h t 1 at t 1 time stamp, the forget gate function f t is firstly used to remove the uncorrelated information about spatial gait features between current time t and previous time t 1 by calculating the following equation
f t = σ ( W f · [ h t 1 , y t ] + b f )
where σ · denotes the non-linear function, W f and b f are the weighted matrix and bias vector to be learned during training, respectively. Then, the renewable information about temporal dependence at current time t can be obtained by computing the following input gate function and candidate memory unit C t :
i t = σ W i · y t k , h t 1 + b i
C ˜ = tan W c · y t k , h t 1 + b c
where tan represents tanh activation function. W i and W c denote the weighted matrix, respectively. b i and b c are bias vectors to be learned during training, respectively. According to Equations (7) and (8), we could obtain the updated information about temporal dependence associated with spatial features at current time t by computing the renewable memory unit C t :
C t = i t · C ˜ + f t · C t 1
Additionally, based on the extracted spatial gait feature y t k , the output gate function O t at current time t can be defined as:
O t = σ W o y t k , h t 1 + b o
where W o and b o denote the weighted matrix and bias vector to be learned during training, respectively. Thus, according to Equations (9) and (10), we could capture the temporal dependence feature hidden in the spatial gait feature at current time t by calculating the following hidden state h t
h t = o t · tan C t
Therefore, based on the above recurrence computation of the basic cell during a length of time T, we could obtain the spatiotemporal gait feature matrix q
q = h 1 n , h 2 n h T n
In this study, we constructed two layers of LSTM to capture the most representative spatiotemporal gait characteristics in different temporary levels associated with lower limb locomotion changes. The construction of each LSTM layer is identical, and a dropout layer was added to each LSTM layer to avoid over-fitting [35]. When the feature matrix q, obtained by the first LSTM layer was fed into the second LSTM layer, we could exploit the most representative spatiotemporal gait dynamic features q * .
q * = h 1 n * , h 2 n * h T n *
When the sample dataset D, including multi-sensor gait patterns of right and left lower limbs, were fed into the dual-channel block, we could explore the more representative spatiotemporal gait dynamic characteristics closely associated with the coupling across joints of lower limbs. This greatly contributes to discovering the significantly discriminative features between two lower limbs’ locomotion.

2.2.4. Classification of Lower Limb Gait Patterns from Dual-Channels

Next, a binary classification model was constructed to accurately identify the right and left lower limb gait patterns from dual-channels. In such a model, spatiotemporal gait dynamic features from each channel were first integrated by a concatenation fusion. The concatenated features q o was defined as
q o = q r * , q l *
where q r * and q l * denote the gait dynamic features extracted from right and left lower limb, respectively.
Then, the concatenated features q o were fed into a fully connected layer, in order to obtain two dimensional vectors aggregating the more useful discriminative information about two lower limbs. The output vector Y o of the fully connected layer was defined as
Y o L Y = f q o L q × W f u l l L q , L Y + b f u l l
where L Y and L q denote the lengths of vectors q o and Y o , respectively. W f u l l and b f u l l represent the weight matrix and deviation of the fully connected layer, respectively. f · denotes the activation function.
Finally, the Softmax function was adopted to precisely classify the right and left lower limb gait patterns with maximum probability, and defined as
y ^ = arg max P y y D D
P y i = e y i e y l + e y r
where e y i denoted the output of the lower limb gait pattern y i to be predicted. e y r and e y l represented the output of right and left lower limb gait patterns, respectively.
In addition, in order to achieve the best learning capacity, the two-classes cross entropy was used as a loss function that estimates error in the process of training and testing. This cross entropy function was defined as
L O S S = 1 N i [ y i log ( P i ) + ( 1 y i ) log ( 1 P i ) ]
where P i represented the probability for the lower limb gait pattern y i to be predicted.

3. Results

3.1. Construction of Sample Data Set

In the present study, we employed the three-axial accelerometer and gyroscope data from the wearable sensors. The linear Min-Max normalization algorithm was first adopted to normalize the acceleration and gyroscope data to the interval [−1,1]. In order to gain more useful information about the two lower limbs’ locomotion from the sensor data, a fixed-length sliding window method was schemed to segment time-series acceleration and gyroscope data into a sequence of fixed-length windows. In our scheme, the length of the sliding window was fixed at 2 s, and the overlap next to the window was set to 50 percent. A total of 96 windows were randomly extracted from the recorded data from a lower limb of each subject. In the experiment, our task was to accurately classify gait pattern of right and left lower limbs from a certain level of gait asymmetry, in order to examine the generalization ability to identify gait symmetry early. Therefore, for a certain level of gait asymmetry, the total number of samples of data were 4608 (i.e., 24 subjects × 2 lower limbs × 96 window samples).

3.2. Training and Testing Scheme

Because of the small sample size, the ten-fold cross-validation strategy was employed to train and test our classification model [36,37]. Here, all sample data were divided into ten similar subsets. Each subset consisted of 230 samples of data of the right lower limb and 230 samples of data of the left lower limb. In our strategy, nine subsets were randomly selected as the training set while the remaining one was used as the test set. The above procedure was repeated ten times, and each subset was required to be tested. In order to accurately evaluate generalization performance, the sample data that was used as training data was prohibited to test. Therefore, the averaged result of the whole testing was served as a final classification result.
In order to minimize the loss function, the backpropagation learning algorithm with Adam-based iteration rule was adopted to train the model. In such a learning algorithm, the initial learning rate for gradient descent was set to 0.001. The determination of all optimal parameters of our model depended on the best generalization performance. All programs of deep learning algorithms were developed in the Tensorflow using the python language, and were executed on a computer with AMD A10-9630P, RADEON R5 3.2 GHz CPU, and 8 GB RAM and the Windows 10 operating system.

3.3. Generalization Performance Measurement

We employed Accuracy, Recall, Precision and F1-score as metrics of generalization performance measurement [38], and these metrics were given as follows:
1.
Accuracy
Accuracy was adopted to evaluate the generalization ability to accurately identify the gait pattern of right and left lower limbs, and was defined as
A c c u r a c y = T R + T L T R + F R + T L + F L × 100 %
where TR and TL denote the total number of right and left lower limbs that were truly detected, respectively; FR denoted all numbers of the right lower limb that were falsely classified as left lower extremity. FL represented the total numbers of the left lower limb that were incorrectly recognized as the right lower limb.
2.
Recall
Recall was employed to assess the generalization capability to precisely recognize the gait pattern of the right lower limb, and was defined as
R e c a l l = T R T R + F R × 100 %
3.
Precision
Precision was utilized to measure the generalization ability to exactly identify the gait pattern of the left lower extremity, and was defined as
P r e c i s i o n = T L T L + F L × 100 %
4.
F1-score
F1-score was also employed to measure the generalization ability to accurately classify the gait pattern between the right and left lower limb, and was defined as
F 1 - s c o r e = 2 × P r e c i s i o n × R e c a l l P r e c i s i o n + R e c a l l × 100 %

3.4. Evaluation Results of the Accurate Identification of Asymmetric Gait

We first evaluate the generalization ability to identify the different levels of asymmetric gaits. In the experiment, we classified gait patterns of right and left lower extremities based on sample data of each level of asymmetric gait simulated by wearing a boot with 0 degrees, 20 degrees and 30 degrees adjusted, respectively. For comparison, the sample data wearing no boot (i.e., normal walking) was also chosen. All four metrics such as Accuracy, Recall, Precision and F1-score were adopted to measure generalization performance. The best classification results based on each level of asymmetric gait pattern are presented in Table 1. As shown in Table 1, our model could reach the best value for all four metrics up to 98% based on a mild level asymmetric gait pattern when wearing the boot with 0 degrees of adjustment. All four metrics slightly increase to almost the same values (more than 99%) when wearing the boot with 20 degrees or 30 degrees of adjustment. These results suggested that our proposed model could accurately identify the different level asymmetric gait patterns. In contrast, our model could gain all metric values of approximately 50% when walking normally. This demonstrated our model could detect almost the same locomotion between right and left lower limb in healthy subjects. In terms of comparison of results between a mild asymmetric gait and normal walking, our model could achieve the best lower limb locomotion representation learning capability to discriminate the subtle change of gait symmetry.

3.5. Measurement Results of the Generalization Performance

Next, we further examined the generalization ability to accurately detect the subtle difference between right and left lower limb locomotion. In this experiment, sample data from a mild level asymmetric gait pattern was adopted. All four metrics were employed to measure generalization performance. For comparison, we constructed some classification models used in existing studies such as CNN, LSTM, the combination model of principal component analysis with support vector machine (PCA-SVM) and SVM. Table 2 presents the best comparison results among these models. As illustrated in Table 2, our model (i.e., CNN–LSTM) could reach all of the same highest metrics of 98%, followed by CNN (average of 90%) and LSTM (average of 83%). PCA–SVM (average of 68%) and SVM (average of 58%) were poorer. In comparison, deep learning models such as CNN–LSTM, CNN, and LSTM were significantly superior to shallow machine learning models such as PCA–SVM and SVM. As far as a deep learning model is concerned, CNN–LSTM outcompeted CNN or LSTM. These comparison results demonstrated that our model could exploit the most representative spatiotemporal gait dynamic characteristics associated with the change of coupling across joints of the lower limb. This could greatly contribute to achieving the best generalization capability to identify asymmetric gait early.

3.6. Evaluation of the Effect of Coupling across Joints of the Lower Limb on Generalization Ability

In addition, we also evaluated the effect of coupling across joints of lower extremity on generalization ability, in order to further validate the feasibility of our proposed model for recognizing asymmetric gait early. In this experiment, in order to reflect the coupling across different joints of the lower limb, we tested the different combinations of hip, knee and ankle joint: ➀ all combinations of hip, knee and ankle; ➁ the random combination of two joints such as hip–knee, hip–ankle, and knee–ankle; ➂ a single joint such as hip, knee, and ankle. The sample data of mild level asymmetric gait pattern was used, and Accuracy was selected as the measurement metric of generalization performance. Based on the different combinations of hip, knee and ankle joint, our model was developed to detect the subtle difference between right and left lower limb locomotion. Figure 6 illustrates the best Accuracy among different combinations of hip, knee and ankle joint. As shown in Figure 6, the maximum Accuracy of 98.61% could be reached from all combinations of hip, knee and ankle, followed by the random combinations of two joints and the single joint. In terms of the random combination of two joints, a better accuracy of approximately 96% could be gained from ankle+hip or ankle+knee, increasing by 2% from hip+knee. As for the single joint, a higher accuracy from the ankle was 93.35%, increasing by 2% and 4% from knee and hip, respectively. These results suggested the coupling across hip, knee and ankle joint could contain the most representative features information associated with lower limb locomotion change. This could detect the most representative discriminative features between two lower limbs’ locomotion for the best generalization ability to recognize asymmetric gait early. In contrast, the random combination of two joints or a single joint was hard to achieve.
Using ankle joint sample data, we also further examined the generalization capability to accurately identify asymmetric gait when compared with shallow machine learning models such as SVM, ANN and RF. In the experiment, the ANN model consisted of an input layer, one hidden layer and an output layer, and was trained by using a standard backpropagation learning algorithm. The comparison results among different models are given in Table 3. From Table 3, we can obviously see that Accuracy from our model was significantly higher than that from SVM, RF, and ANN. The highest Accuracy of 93.35% was available when Accuracy from the three compared models was less than 82%. Our model increased this by more than 21%. This further suggested that based on the single ankle joint sample data, our model could also achieve superior representation learning capability to explore spatiotemporal features containing the more valuable information about lower limb locomotion change. This may be beneficial to finding a certain joint associated with an asymmetric gait.

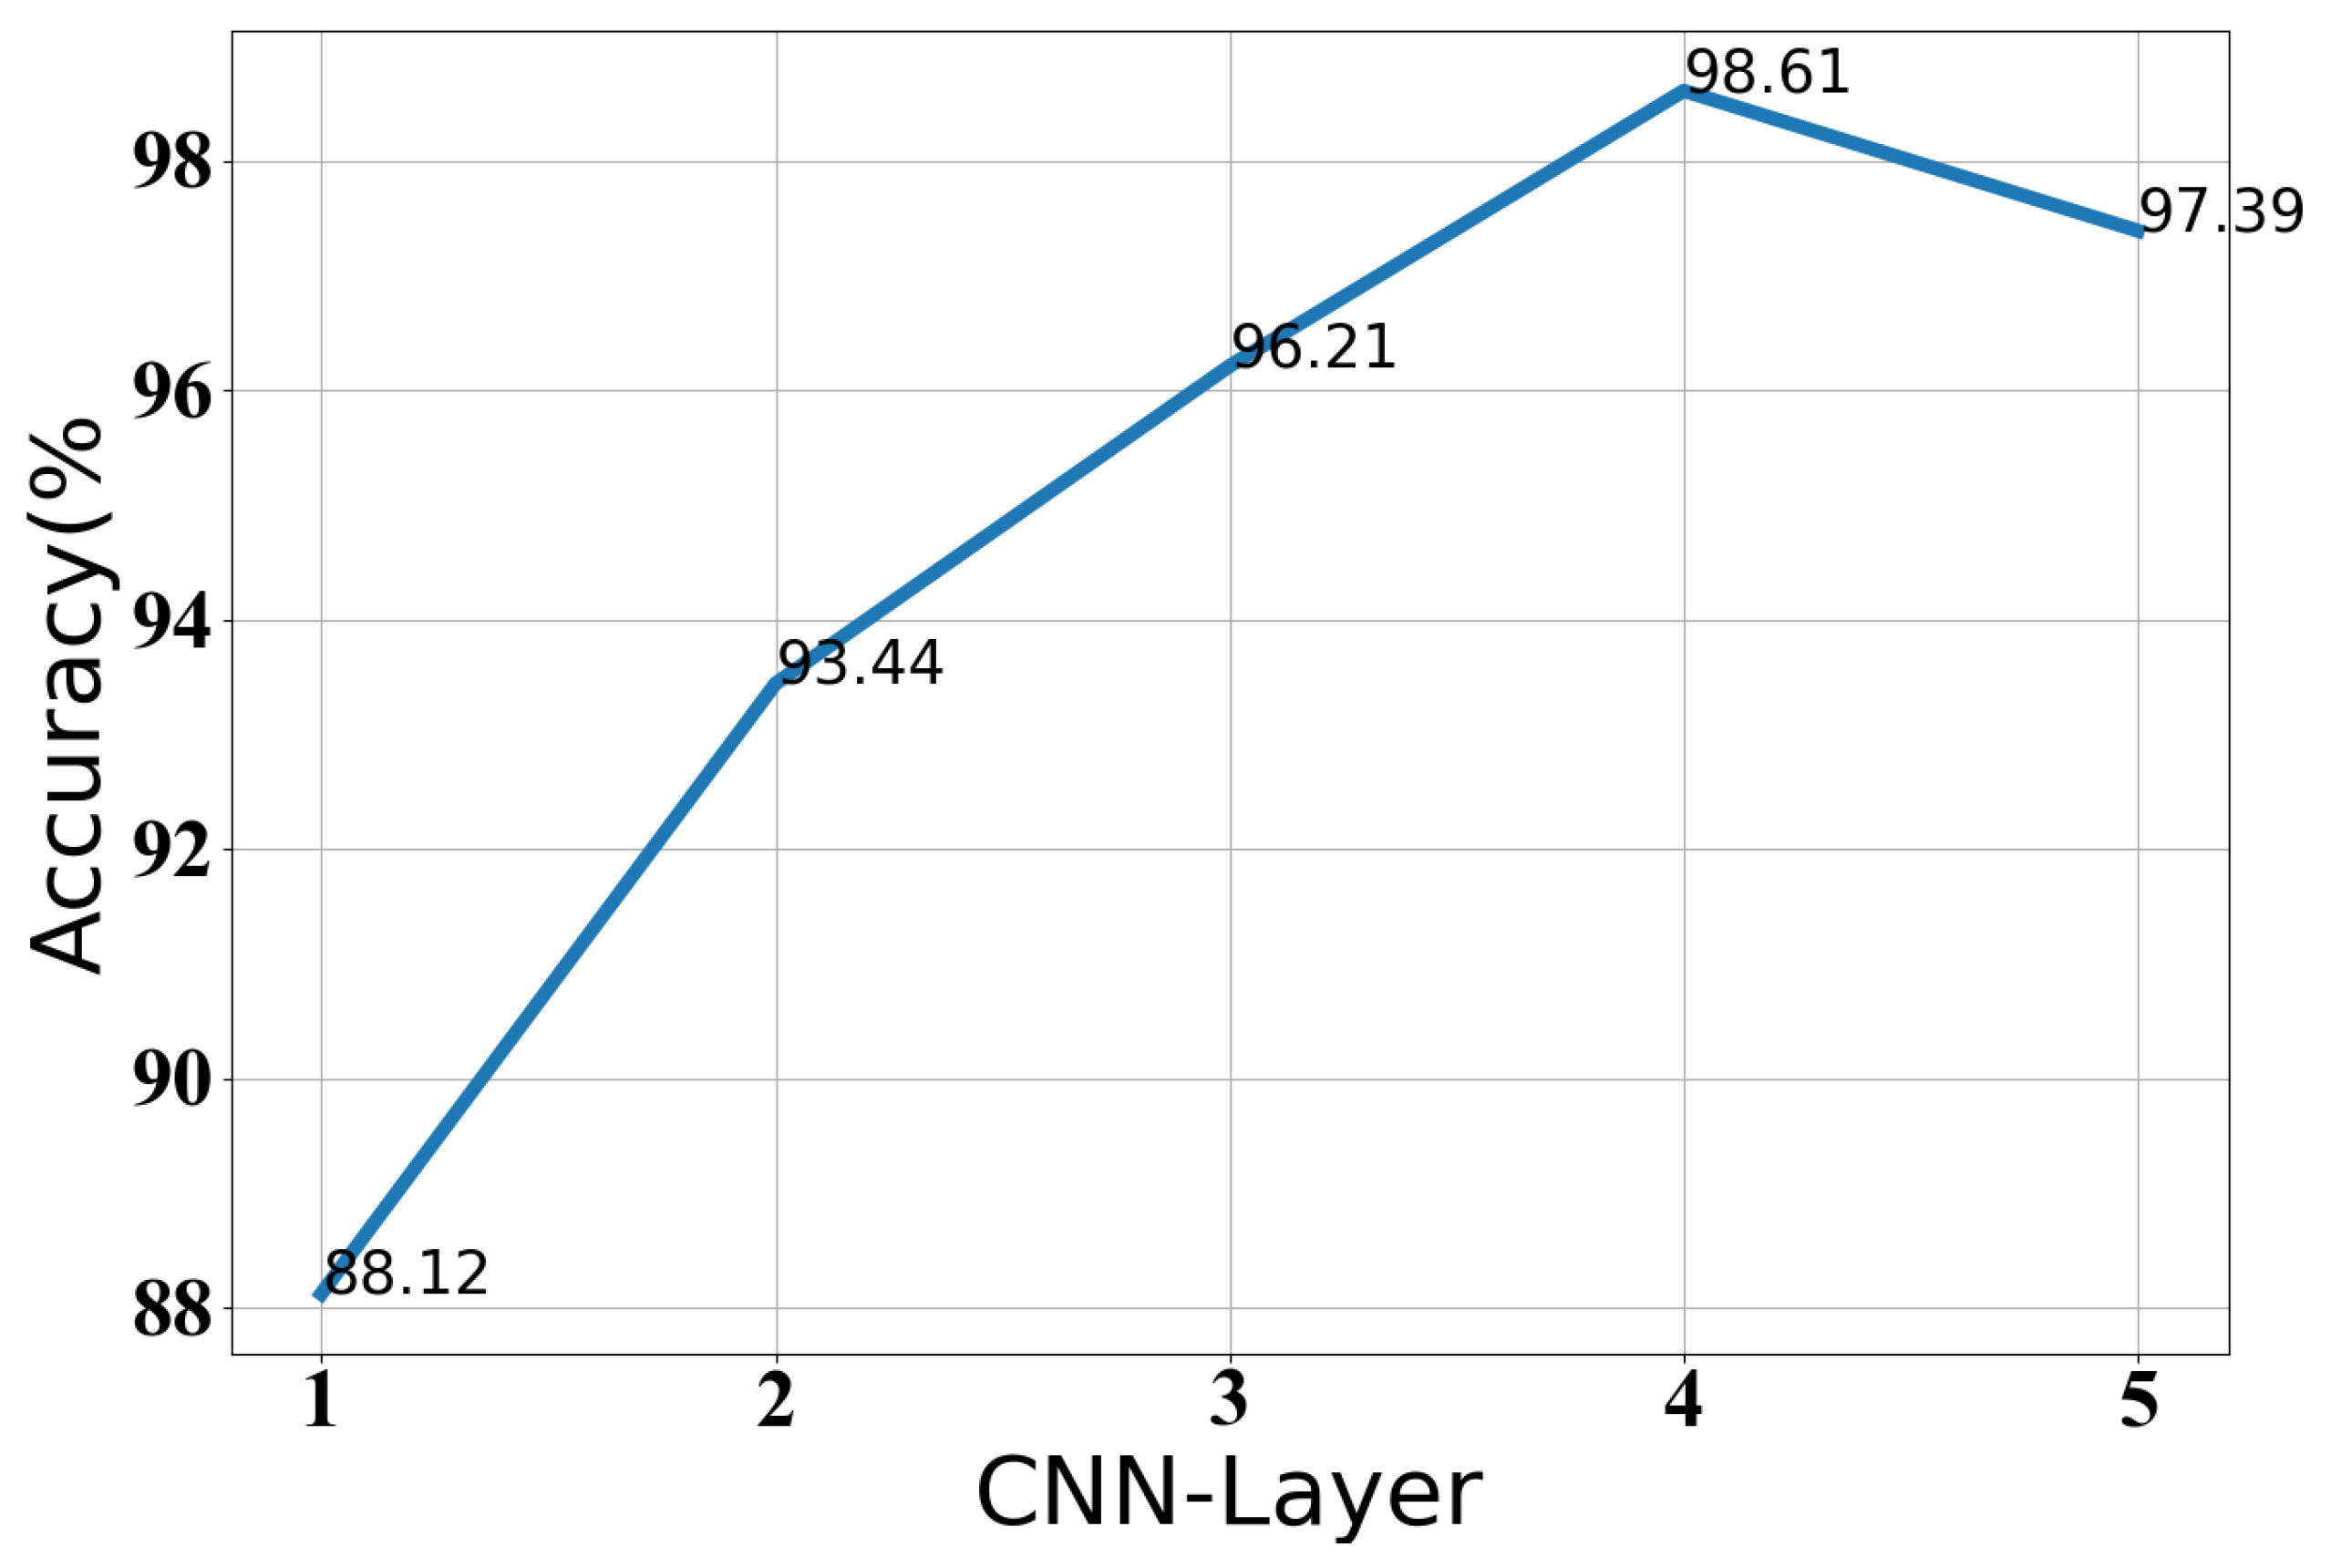
3.7. The Selection of the Optimal Parameters of Our Classification Model

In our study, it is very important to select the optimal parameters of the classification model for the best generalization. Since there have been no standard methods published for selecting the best parameters for machine learning-based classification models, we mainly employed the experimental method to determine the optimal parameters for our model. In the process of training and testing the model, each parameter value could vary with the other parameter values. The optimal parameters could be determined when the best generalization was achieved. Thus, in the experiment, we had to carefully select the best parameters, such as the number of convolutional layers, the number of LSTM layers, the number of neurons in CNN and LSTM, the learning rate, and the dropout. For example, Table 4 presents the selection of optimal parameter values of some deep learning models based on the highest generalization performance. Figure 7 illustrates that Accuracy varied with the increase of convolutional layers during training and testing, while the other parameters’ values were determined. As shown in Figure 7, the highest Accuracy was obtained when convolutional layers were increased to four. The possible reason is that the increase of CNN layers could expand the receptive field, which helps to discover the most representative spatial gait features associated with lower limb locomotion. This could detect significant discriminative features between two lower limbs’ locomotion for high generalization performance. However, excessive layers may lead to overfitting of the model, resulting in poor performance. These results demonstrated that the optimal parameter values of our model needed to be carefully selected by trial and error, in order to achieve the best generalization performance.

4. Discussion

The experimental results have demonstrated that our proposed model could take advantage of spatial and temporal representation learning ability to discover the most representative spatiotemporal gait dynamic characteristics closely associated with coupling across hip, knee and ankle joint from multi-sensor data. This could achieve the best generalization capability to identify asymmetric gait early. Currently, early identification of asymmetric gait outdoors has been a challenging issue in measuring gait asymmetry [39,40]. For solving such issues, it is critical to detect the most representative discriminative characteristics between right and left lower limb locomotion. In the present study, considering the assumption that the gait dynamic of two lower limbs is derived from the coupling across joints of the lower limb in the human kinetic chain, our basic idea was to develop a deep learning model with excellent representation of learning ability to exploit the most representative spatiotemporal gait dynamic features associated with coupling across joints of the lower limb [9,41]. Based on the above idea, we constructed a dual-channel deep learning model combining CNN with LSTM for detecting the most representative discriminative gait characteristics between two lower limbs, so as to accurately classify the gait pattern of the right and left lower limb locomotion.
In the present study, based on positioning sensors on the hip, knee and ankle joints, we designed the simultaneous acquisition scheme of multi-sensor data containing the more useful information about coupling across joints of lower limb locomotion. We simulated the different levels of asymmetric gait by wearing a controlled ankle motion boot with adjustable angle of automatic chuck, in order to validate the feasibility of our proposed model. In the experiment, we first examined the generalization ability to accurately detect the change in gait symmetry. As illustrated in Table 1, our model could reach all higher metrics values to accurately recognize asymmetric gait. Particularly, more than 98% of all metrics values were able to identify a mild level of asymmetric gait pattern wearing a boot with 0 degrees of adjustable angle. In contrast, our model could also gain all metrics values of approximately 50% to precisely detect symmetric gait from normal walking. These results demonstrated that our model could achieve the best generalization ability to accurately discriminate the change of gait symmetry. This is because wearing a boot may cause a change of coupling across hip, knee and ankle joints in lower limb locomotion, and such coupling action could change the lower limb locomotion function. Our proposed model could take advantage of excellent deep learning capabilities to explore these representative features associated with such coupling actions. This helps to accurately discriminate the subtle difference between two lower limbs’ locomotion. Similar relevant research using traditional gait parameters have been reported in [20,42].
Based on the sample data of mild level asymmetric gait simulations, we further validated the generalization ability to detect asymmetric gait early. As shown in Table 2, our model was best when compared with CNN, LSTM, PCA–SVM and SVM. The main reasons were that our model was built using a spatial and temporal gait representation deep learning architecture. This could discover the most representative spatiotemporal gait dynamic features associated with lower limb locomotion change from multi-sensor data. Therefore, the most representative discriminative features between two lower limbs’ locomotion could be obtained for the highest generalization capability to precisely detect the subtle difference between two lower limbs’ locomotion. However, the CNN model only extracts the local spatial gait features by expanding the receptive field, and the LSTM model can also only obtain temporal gait features by a recurrent neural network architecture. These limitations could result in the loss of important information about coupling across hip, knee and ankle joints during lower limb locomotion. This may reduce the generalization performance in our binary classification task. Additionally, SVM based on structural risk minimization could yield limitations such as over-fitting and gradient vanishing in our binary classification task, resulting in poorer generalization performance. Similar results in studies on human activity recognition have been reported [30,37].
In addition, we also evaluated the effect of coupling across joints of the lower limb on generalization performance, in order to further examine the feasibility of the present study. The experiment was implemented by different combinations of hip, knee and ankle joints. As illustrated in Figure 6, the highest generalization performance was from all combinations of hip, knee and ankle joints when compared with the random combination of two joints and a single joint. The possible reason was that the combination of all three joints could contain more useful information about coupling across joints of the lower limb on kinetic chains. It is beneficial for our model to detect the significant discriminative characteristics between two lower limbs’ locomotion, thus achieving the highest generalization performance. However, the random combination of two joints or a signal joint only offered limited useful information about lower limb locomotion changes, thus reducing the generalization performance. This feasibly validated the relation of lower limb locomotion change and coupling across joints of the lower limb on kinetic chains. Our present work could effectively avoid the shortcomings of reducing generalization ability when only using a single, or a few joints in previous research. Besides, in terms of a single hip, knee or ankle joint, they could all gain good generalization performance. In comparison, the ankle joint was best, followed by the knee and hip joint. The main reason was that wearing a controlled ankle motion boot may cause mild injury or abnormality of the ankle joint. This may subsequently cause injury or abnormality of the knee and hip joint based on coupling across joints of the lower limb on human kinetic chains. Each joint could contain a different level of useful information about its injury or abnormality in a lower limb wearing boot, thus yielding a different generalization performance. Meanwhile, based on ankle joint data, we also further examined the generalization ability when compared with shallow machine learning models such as SVM, RF and ANN used in previous studies. As shown in Table 3, our model significantly outcompeted the compared shallow machine learning models. This is because shallow learning architecture could cause an over-fitting and gradient vanishing problem due to its limitations, such as lots of model parameters and missing data, and thus having difficultly obtaining a high generalization ability to discriminate the similarity difference between right and left ankle joints. However, our model could make full use of the excellent deep learning ability to discover the most representative features associated with minor injury or mild abnormality of the ankle joint, thus gaining a better generalization capability to detect an asymmetric gait. This may possibly discover ways to provide valuable insight into a specific joint with an injury or abnormality in gait asymmetry. In particular, our present work will help to gain deeper insight into the compensation mechanisms of hip, knee and ankle joints in gait symmetry or asymmetry. In general, our proposed method could achieve excellent lower limb locomotion representation learning capability to detect asymmetric gait early. This could potentially help to conduct further research on the measurement of different levels of dynamic change of gait asymmetry.
In the present study, with trial and error we adopted the experimental method to carefully select the optimal parameters of our model for the best generalization performance. As shown in Table 4 and Figure 7, all selected optimal parameters relied on achievement of the best generalization performance considering that each optimal parameter value varied with the other parameters’ values in the process of training. The trial and error experimental method has often been used in most relevant research [41,42].

5. Conclusions

The present study proposed a novel dual-channel hybrid deep learning model of CNN and LSTM to identify asymmetric gait based on wearable sensors early. Each channel could feasibly exploit the most representative spatiotemporal gait dynamic features associated with coupling across hip, knee and ankle joints, which captures the most valuable information about lower limb locomotion change hidden in kinetic chains. Dual-channel could detect significantly discriminative features between two lower limbs’ locomotion, thus achieving the highest generalization capability to identify asymmetric gait early. The proposed model could also achieve excellent generalization ability when distinguishing abnormalities in asymmetric gait, and may help to gain insight into the compensatory changes among lower limb joints caused by gait asymmetry. Our present work would provide a feasible technical solution to identify gait asymmetry early in the outdoor environment.

Author Contributions

J.W. conceived the original idea of the study, and is a corresponding author. He participated in designing the model and drafting the manuscript. Y.L. participated in designing the algorithm and developing the programme for analyzing the data, and X.W. participated in writing part of the manuscript. All authors have read and agreed to the published version of the manuscript.

Funding

This study was funded by the National Natural Science Foundation of China (Grant Number 82072043) and the Fujian Provincial Natural Science Foundation of China (Grant Number 2020J01163).

Institutional Review Board Statement

This study was in accordance with the ethical standards of the institutional and/or national research committee.

Informed Consent Statement

All recruited participants agreed with the informed content requirement. This study was approved by the ethical Ethics Committee of Fujian Normal University.

Data Availability Statement

The datasets analyzed in the current study are available from the corresponding author on reasonable request.

Acknowledgments

We are thankful to the National Natural Science Foundation of China (Grant Number 82072043) and the Fujian Provincial Natural Science Foundation of China (Grant Number 2020J01163). In addition, the authors wish to acknowledge the participants recruited from Fujian Normal University.

Conflicts of Interest

The authors declare that they have no conflict of interest.

Abbreviations

The following abbreviations are used in this manuscript:
CNNConvolutional Neural Networks
LSTMLong Short-Term Memory
RNNRecurrent Neural Network
RFRandom Forest
ANNArtificial Neural Network
KNNK-Nearest Neighbor
SVMSupport Vector Machine
IMUInertial Measurement Unit
PCAPrincipal Component Analysis
MEMSMicro-Electro-Mechanical System

References

  1. Sadeghi, H.; Allard, P.; Prince, F. Symmetry and limb dominance in able-bodied gait: A review. Gait Posture 2000, 12, 34–45. [Google Scholar] [CrossRef] [PubMed]
  2. Gimunová, M.; Vodička, T.; Bozděch, M.; Vespalec, T. Changes in plantar pressure, contact area and contact time symmetry during the gait 4 weeks before and 12 and 24 weeks after unilateral total hip arthroplasty. Clin. Biomech. 2021, 89, 105473. [Google Scholar] [CrossRef] [PubMed]
  3. Jørgensen, L.; Crabtree, N.J.; Reeve, J.; Jacobsen, B.K. Ambulatory level and asymmetrical weight bearing after stroke affects bone loss in the upper and lower part of the femoral neck differently: Bone adaptation after decreased mechanical loading. Bone 2000, 27, 701–707. [Google Scholar] [CrossRef] [PubMed]
  4. Block, J.A.; Shakoor, N. Lower limb osteoarthritis: Biomechanical alterations and implications for therapy. Curr. Opin. Rheumatol. 2010, 22, 544–550. [Google Scholar] [CrossRef]
  5. Verghese, J.; Wang, C.; Lipton, R.B. Quantitative gait dysfunction and risk of cognitive decline and dementia. J. Neurol. Neurosur. Psychiatry 2007, 78, 929–935. [Google Scholar] [CrossRef] [PubMed]
  6. Beauchet, O.; Annweiler, C.; Dubost, V. Stops walking when talking: A predictor of falls in older adults? Eur. J. Neurol. 2009, 16, 786–795. [Google Scholar] [CrossRef] [PubMed]
  7. Wall, J.C.; Turnbull, G.I. Gait asymmetries in residual hemiplegia. Arch. Phys. Med. Rehabil. 1986, 67, 550–553. [Google Scholar]
  8. Wang, Y.; Mukaino, M.; Ohtsuka, K. Gait characteristics of post-stroke hemiparetic patients with different walking speeds. Int. J. Rehabil. Res. 2020, 43, 69–75. [Google Scholar] [CrossRef]
  9. Kiwon, P.; Ryan, T.; Jonathan, M. Effects of aging and Parkinson’s disease on joint coupling, symmetry, complexity and variability of lower limb movements during gait. Clin. Biomech. 2016, 33, 92–97. [Google Scholar]
  10. Xia, Y.; Ye, Q.; Gao, Q. Symmetry analysis of gait between left and right limb using cross-fuzzy entropy. Comput. Math. Methods Med. 2016, 2016, 1737953. [Google Scholar] [CrossRef] [Green Version]
  11. Viteckova, S.; Khandelwal, S.; Kutilek, P. Gait symmetry methods: Comparison of waveform-based methods and recommendation for use. Biomed. Signal Process. 2020, 55, 101643. [Google Scholar] [CrossRef]
  12. Ghaderyan, P.; Beyrami, S.M. Neurodegenerative diseases detection using distance metrics and sparse coding: A new perspective on gait symmetric features. Comput. Biol. Med. 2020, 120, 103736. [Google Scholar] [CrossRef] [PubMed]
  13. Robinson, R.O.; Herzog, W.; Nigg, B.M. Use of force platform variables to quantify the effects of chiropractic manipulation on gait symmetry. J. Manip. Physiol. Ther. 1987, 10, 172–176. [Google Scholar]
  14. Viteckova, S.; Kutilek, P.; Svoboda, Z. Gait symmetry measures: A review of current and prospective methods. Biomed. Signal Process. Control 2018, 42, 89–100. [Google Scholar] [CrossRef]
  15. Clemens, S.; Kim, K.J.; Gailey, R.; Kirk-Sanchez, N.; Kristal, A.; Gaunaurd, I. Inertial sensor-based measures of gait symmetry and repeatability in people with unilateral lower limb amputation. Clin. Biomech. 2020, 72, 102–107. [Google Scholar] [CrossRef] [PubMed]
  16. Caldas, R.; Mundt, M.; Potthast, W. A systematic review of gait analysis methods based on inertial sensors and adaptive algorithms. Gait Posture 2017, 57, 204–210. [Google Scholar] [CrossRef]
  17. Chen, S.; Lach, J.; Lo, B. Toward pervasive gait analysis with wearable sensors: A systematic review. IEEE J. Biomed. Health 2016, 20, 1521–1537. [Google Scholar] [CrossRef]
  18. Vienne, A.; Barrois, R.P.; Buffat, S. Inertial sensors to assess gait quality in patients with neurological disorders: A systematic review of technical and analytical challenges. Front. Psychol. 2017, 8, 817. [Google Scholar] [CrossRef] [PubMed] [Green Version]
  19. Wafai, L.; Zayegh, A.; Woulfe, J. Automated Classification Of Plantar Pressure Asymmetry During Pathological Gait Using Artificial Neural Network. In Proceedings of the 2nd Middle East Conference on Biomedical Engineering, Doha, Qatar, 17–20 February 2014. [Google Scholar]
  20. Lemoyne, R.; Heerinckx, F.; Aranca, T. Wearable body and wireless inertial sensors for machine learning classification of gait for people with Friedreich’s ataxia. In Proceedings of the IEEE 13th International Conference on Wearable and Implantable Body Sensor Networks (BSN), San Francisco, CA, USA, 14–17 June 2016. [Google Scholar]
  21. Hoerzer, S.; Federolf, P.A.; Maurer, C.; Baltich, J.; Nigg, B.M. Footwear Decreases Gait Asymmetry during Running. PLoS ONE 2015, 10, e0138631. [Google Scholar] [CrossRef]
  22. Nouriani, A.; McGovern, R.A.; Rajamani, R. Step length estimation with wearable sensors using a switched-gain nonlinear observer. Biomed. Signal Process. Control 2021, 69, 102822. [Google Scholar] [CrossRef]
  23. Watanabe, T.; Saito, H.; Koike, E.; Nitta, K. A preliminary test of measurement of joint angles and stride length with wireless inertial sensors for wearable gait evaluation system. Comput. Intell. Neurosci. 2011, 2011, 975193. [Google Scholar] [CrossRef] [PubMed] [Green Version]
  24. Cudejko, T.; Button, K.; Al-Amri, M. Validity and reliability of accelerations and orientations measured using wearable sensors during functional activities. Sci. Rep. 2022, 12, 14619. [Google Scholar] [CrossRef] [PubMed]
  25. Kulurkar, P.; kumar Dixit, C.; Bharathi, V.C.; Monikavishnuvarthini, A.; Dhakne, A.; Preethi, P. AI based elderly fall prediction system using wearable sensors: A smart home-care technology with IOT. Meas. Sens. 2023, 25, 100614. [Google Scholar] [CrossRef]
  26. AbdelMaseeh, M.; Chen, T.; Stashuk, D.W. Extraction and Classification of Multichannel Electromyographic Activation Trajectories for Hand Movement Recognition. IEEE Trans. Neural Syst. Rehabil. Eng. 2016, 24, 662–673. [Google Scholar] [CrossRef]
  27. Allen, J.L.; Kautz, S.A.; Neptune, R.R. Step length asymmetry is representative of compensatory mechanisms used in post-stroke hemiparetic walking. Gait Posture 2011, 33, 538–543. [Google Scholar] [CrossRef] [Green Version]
  28. Gulgin, H.; Hall, K.; Luzadre, A. 3D gait analysis with and without an orthopedic walking boot. Gait Posture 2018, 59, 76–82. [Google Scholar] [CrossRef]
  29. Khan, A.; Sung, J.E.; Kang, J.W. Multi-channel fusion convolutional neural network to classify syntactic anomaly from language-related ERP components. Inf. Fusion 2019, 52, 53–61. [Google Scholar] [CrossRef]
  30. Soulard, J.; Vaillant, J.; Balaguier, R. Spatio-temporal gait parameters obtained from foot-worn inertial sensors are reliable in healthy adults in single-and dual-task conditions. Sci. Rep. 2021, 11, 10229. [Google Scholar] [CrossRef] [PubMed]
  31. Błażkiewicz, M.; Lann vel Lace, K.; Hadamus, A. Gait symmetry analysis based on dynamic time warping. Symmetry 2021, 13, 836. [Google Scholar] [CrossRef]
  32. McHenry, B.D.; Exten, E.L.; Cross, J.A.; Kruger, K.M.; Law, B.; Fritz, J.M.; Harris, G. Sagittal Subtalar and Talocrural Joint Assessment During Ambulation With Controlled Ankle Movement (CAM) Boots. Foot Ankle Int. 2017, 38, 1260–1266. [Google Scholar] [CrossRef] [PubMed]
  33. Hammerla, N.; Halloran, S.; Ploetz, T. Deep, convolutional, and recurrent models for human activity recognition using wearable sensor. J. Sci. Comput. 2016, 61, 454–476. [Google Scholar]
  34. Alex, K.; IIya, S.; Geoffrey, H. Image net classification with deep convolutional neural networks. In Proceedings of the Advances in Neural Information Processing Systems, Lake Tahoe, NA, USA, 3–6 December 2012; pp. 1097–1105. [Google Scholar]
  35. Hochreiter, S.; Schmidhuber, J. Long short-term memory. Neural. Comput. 1997, 9, 1735–1780. [Google Scholar] [CrossRef] [PubMed]
  36. Ramakrishnan, T.; Lahiff, C.A.; Reed, K.B. Comparing gait with multiple physical asymmetries using consolidated metrics. Front. Neurorobotics 2018, 12, 2. [Google Scholar] [CrossRef] [PubMed] [Green Version]
  37. Steinmetzer, T.; Wilberg, S.; Bönninger, I. Analyzing gait symmetry with automatically synchronized wearable sensors in daily life. Microprocess. Microsyst. 2020, 77, 103118. [Google Scholar] [CrossRef]
  38. Mitchell, E.; Ahmadi, A.; O’Connor, N.E. Automatically Detecting Asymmetric Running Using Time And Frequency Domain Features. In Proceedings of the IEEE 12th International Conference on Wearable and Implantable Body Sensor Networks (BSN), Beijing, China, 9–12 July 2015. [Google Scholar]
  39. Rovini, E.; Maremmani, C.; Moschetti, A. Comparative motor pre-clinical assessment in Parkinson’s disease using supervised machine learning approaches. Ann. Biomed. Eng. 2018, 46, 2057–2068. [Google Scholar] [CrossRef]
  40. Abdulhay, E.; Arunkumar, N.; Narasimhan, K. Gait and tremor investigation using machine learning techniques for the diagnosis of Parkinson disease. Future Gener. Comp. Syst. 2018, 83, 366–373. [Google Scholar] [CrossRef]
  41. Severin, A.C.; Gean, R.P.; Barnes, S.G. Effects of a corrective heel lift with an orthopaedic walking boot on joint mechanics and symmetry during gait. Gait Posture 2019, 73, 233–238. [Google Scholar] [CrossRef]
  42. Lann Vel Lace, K.; Błazkiewicz, M. A review of the effect of a Walker ankle-foot orthosis on gait biomechanics in healthy individuals. Postep. Rehabil. 2021, 35, 40. [Google Scholar] [CrossRef]
Figure 1. (a) A wearable controlled ankle motion boot with an adjustable angle of chuck. (b) An example of the boot with 20 degrees of adjusted angle of chuck.
Symmetry 15 00897 g001
Figure 2. (a) The illustration of six sensors attached to different joints of two lower limbs. (b) An example of a subject wearing six IMU sensors and a controlled ankle motion boot.
Symmetry 15 00897 g002
Figure 3. (a) Illustration of the tri-axial accelerometer data collected. (b) Illustration of the tri-axial gyroscope data collected.
Symmetry 15 00897 g003
Figure 4. The illustration of hybrid deep learning architecture of our constructed model.
Symmetry 15 00897 g004
Figure 5. The basic unit of LSTM for capturing temporal dependence features.
Symmetry 15 00897 g005
Figure 6. The classification results based on different combinations of lower limb joints.
Symmetry 15 00897 g006
Figure 7. Illustration of the variation of Accuracy with an increase of CNN layers.
Symmetry 15 00897 g007
Table 1. The best classification results based on the different walking patterns.
Walking PatternsClassification
Model
Classification Results
Precision (%)Recall (%)F1 (%)Accuracy (%)
wearing a boot with
30 degrees of adjustment
CNN-LSTM99.5999.6299.7299.59
wearing a boot with
20 degrees of adjustment
CNN-LSTM99.4599.5999.6699.62
wearing a boot with
0 degrees of adjustment
CNN-LSTM98.8098.4198.6098.61
wearing no bootCNN-LSTM52.9444.5348.3752.47
Table 2. Comparison results of generalization performance based on different classification models.
Classification ModelsClassification Results
Precision (%)Recall (%)F1 (%)Accuracy (%)
CNN–LSTM98.8098.4198.6098.61
CNN93.1888.0890.5692.38
LSTM89.9775.3982.0483.49
PCA–SVM66.6069.0267.7968.35
SVM66.2153.4759.1654.29
Table 3. The comparison results among different models using ankle joint data.
Classification ModelsSVMANNRFOur Model
Accuracy (%)63.2874.2181.5493.35
Table 4. The determined optimal parameter values from different deep learning models.
ModelsCNN
Layers
LSTM
Layers
Kernel
Size
Hidden
Cell
Learning
Rate
Dropout
CNN4/5 × 5/0.010.5
LSTM/2/180.010.5
CNN–LSTM423 × 3240.010.5
Disclaimer/Publisher’s Note: The statements, opinions and data contained in all publications are solely those of the individual author(s) and contributor(s) and not of MDPI and/or the editor(s). MDPI and/or the editor(s) disclaim responsibility for any injury to people or property resulting from any ideas, methods, instructions or products referred to in the content.

