Abstract
Various routing protocols have been developed for wireless ad hoc networks to shift from infrastructure-based networks to self-controlling and self-configurable networks. These ad hoc networks are easy to implement and have plenty of application in the fields of healthcare, transportation, smart cities, etc. Although almost all of the routing protocols work on the Open Systems Interconnection (OSI) model’s network layer, a few routing protocols support routing on the data link layer of the OSI model rather than the conventional one. One of these routing protocols include the Better Approach To Mobile Ad Hoc Networking (BATMAN). Though BATMAN is a comparably new routing protocol and included in the Linux kernel, it suffers from performance deterioration and latency issues that need to be addressed especially in the Internet of Things (IoT). This paper presents a symmetry-based split hop penalty for BATMAN version 4 to improve the network’s performance in multi-hop scenarios. Split hop penalty defines two different sets of penalties to accommodate the routing protocol metric based on the interface media type. The experiments were conducted within the campus building of the university with physical nodes, and the obtained results highlight that overall performance is improved in terms of throughput, latency, and jitter while no performance gain is measured in packet loss and routing loops that are still present.
1. Introduction
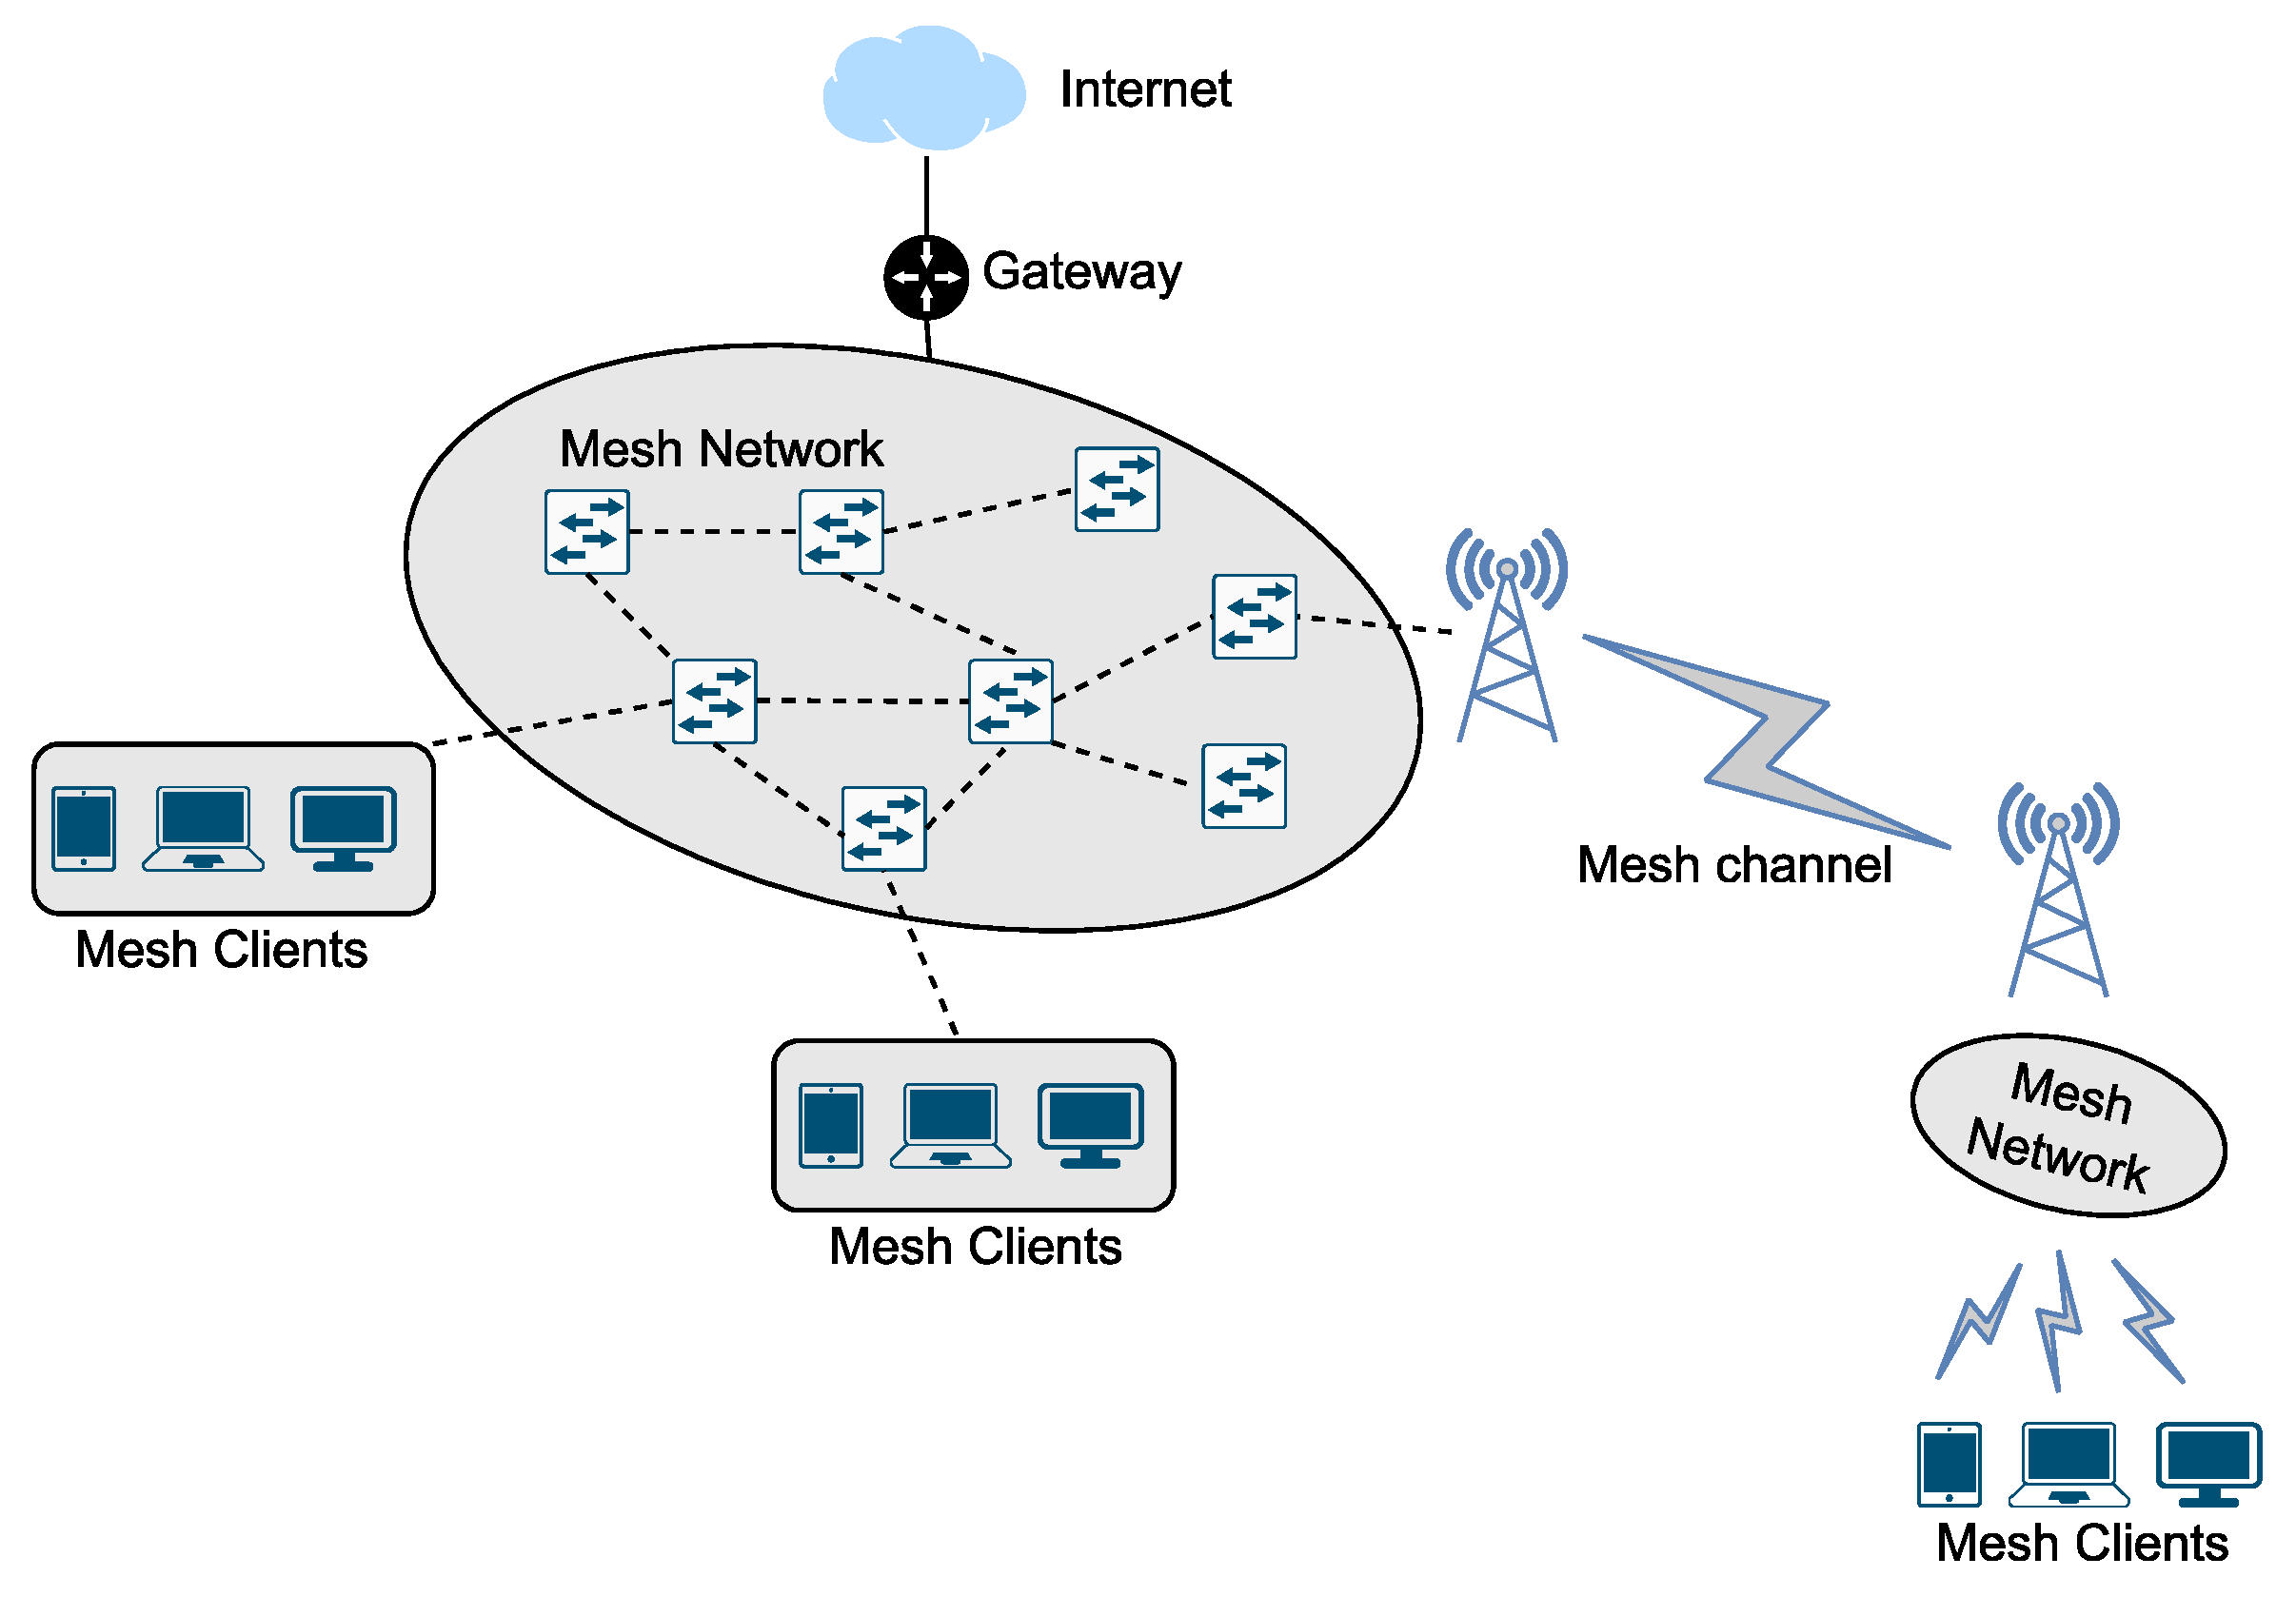
Mobile ad hoc networks (MANET) [1] support or enhance next-generation networks for applications including but not limited to the Internet of Things (IoT) [2], Industrial IoT [3], massive IoT [4], fifth-generation (5G) cellular network [5,6], and software-defined networks [7]. Almost all of the currently available routing protocols for ad hoc networks already support most of the mentioned network types, with or without modifications to better suit individual applications [8,9,10]. Apart from Media Access Layer (MAC) optimizations [11,12], the type of routing protocol selected (proactive or reactive) affects the performance and reliability of the whole network and the ability to deliver or drop the packets for unknown networks successfully [13]. Several symmetric and asymmetric cryptography techniques provides security in MANETs [14]. BATMAN [15] (Better Approach To Mobile Ad Hoc Networking) was introduced with limited functionality, after which several updates were made to provide better flexibility and convenience for network engineers to set up and maintain mesh networks and adapted to wide array of networks such as IEEE 802.11s as shown in Figure 1.
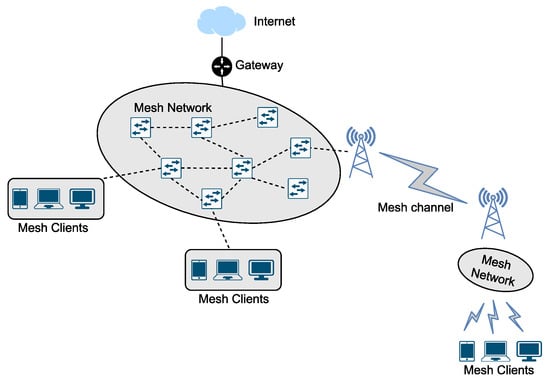
Figure 1.
IEEE 802.11s Wireless Mesh Network Architecture.
BATMAN is a distance-vector proactive routing protocol initially designed for self-configurable networks or wireless mesh networks with low overhead to support a wide array of ad hoc networks [16], e.g., IEEE 802.11s. Initially, BATMAN was a layer-3 routing protocol available with a daemon to be termed as Batmand but soon, the development of a layer-2 mesh routing protocol was started to support seamless network configuration to layer 3 and Batmand was abundant and is no longer developed or supported [17].
An advanced version of BATMAN, namely BATMAN-adv, follows the development from algorithm version IV and incorporates the newly devised algorithm version V. BATMAN-adv is purely designed on layer-2, which utilizes a virtual network interface to communicate with the neighboring symmetric nodes. BATMAN-adv no longer uses a daemon to control BATMAN-related tasks and works as a kernel module of Linux to implement the routing protocol. BATMAN-adv transports all the information using raw Ethernet frames rather than sending UDP packets and handles all the data forwarded by BATMAN nodes until it reaches the destination. The unique behavior of the routing protocol emulates a local area network using a virtual Ethernet switch rather than a router. This enables all nodes to appear as flat topology on the link–local interface and remains unaffected by any routing changes happening on layer 3 of the OSI model. BATMAN uses a handy tool to manage all the routing and debugging functions offered by the protocol named “batctl” which can be invoked from the user space of the operating system.
1.1. Problem Statement
The BATMAN routing algorithm was made for mesh networks with multiple hops that can be extended to heterogeneous networks with the inclusion of non-mesh nodes. The default implementation of BATMAN hop penalty needs optimization as wireless interfaces are treated as unidirectional links by the routing protocol and therefore, any hop penalty set is implemented twice, decreasing the metric quality of the routing protocol. This hop penalty leads to decreased overall performance of the routing protocol as it diminishes the metric of the routing protocol by a large margin when the number of nodes is high.
1.2. Contribution of the Paper
Based on the problem statement defined in Section 1.1, the contribution of this paper can be summarized by the following:
- An analytical study is carried out which highlights the impact of the original hop penalty when the hop count increases up to 10 nodes.
- The design and implementation of a test-bed suitable for implementing and testing BATMAN routing protocol with original hop penalty in a real environment.
- The design and implementation of a novel split-hop penalty for transmission quality of the routing protocol. The developed split-hop penalty was analyzed on a test-bed in an indoor environment using IoT prototypes.
- A comparison of the discussed collected results by testing the original hop penalty with the modified split-hop penalty in various network configurations.
The rest of the paper is organized as follows: Section 2 provides details of the methodology used to diagnose the vanilla version of BATMAN and the production of the split hop penalty. Experimental setup, software configuration, and assumptions made to make the experiment tractable and reproducible are presented in Section 3. Results and comparisons are presented and discussed in Section 4, while Section 5 concludes the findings and presents remarks on the performance of the proposed method.
2. Literature Review
The initial and recent versions of BATMAN have been compared to other similar routing protocols in [18,19]. As a proactive routing protocol, BATMAN is similar to most proactive routing protocols, including AODV [20] and OLSR, which it is most alike [21]. The initial work of the BATMAN routing protocol was derived and inspired by IETF Optimized Link State Routing Protocol (OLSR) [22]. Both routing protocols maintain a neighbor table with 2-hop nodes [23]; OLSR selects Multipoint Relays (MP), while BATMAN uses all the available neighbors to pass information [24]. Neighbor discovery in OLSR is carried out with HELLO messages, while the same function is carried out by Originator Messages (OGM). The only difference is that the link quality is also measured through OGM while OLSR separates Topology Control (TC) messages to announce network information. Some authors have also compared BATMAN with Destination Sequenced Distance Vector (DSDV), concluding that DSDV is much closer to BATMAN as both use sequence numbers to identify and discard obsolete information and prevent routing loops in the topology [25]. Some of the works carried out on the BATMAN routing protocol are discussed below in Table 1.

Table 1.
BATMAN extensions or modifications in the literature.
3. Methodology
3.1. BATMAN Algorithm
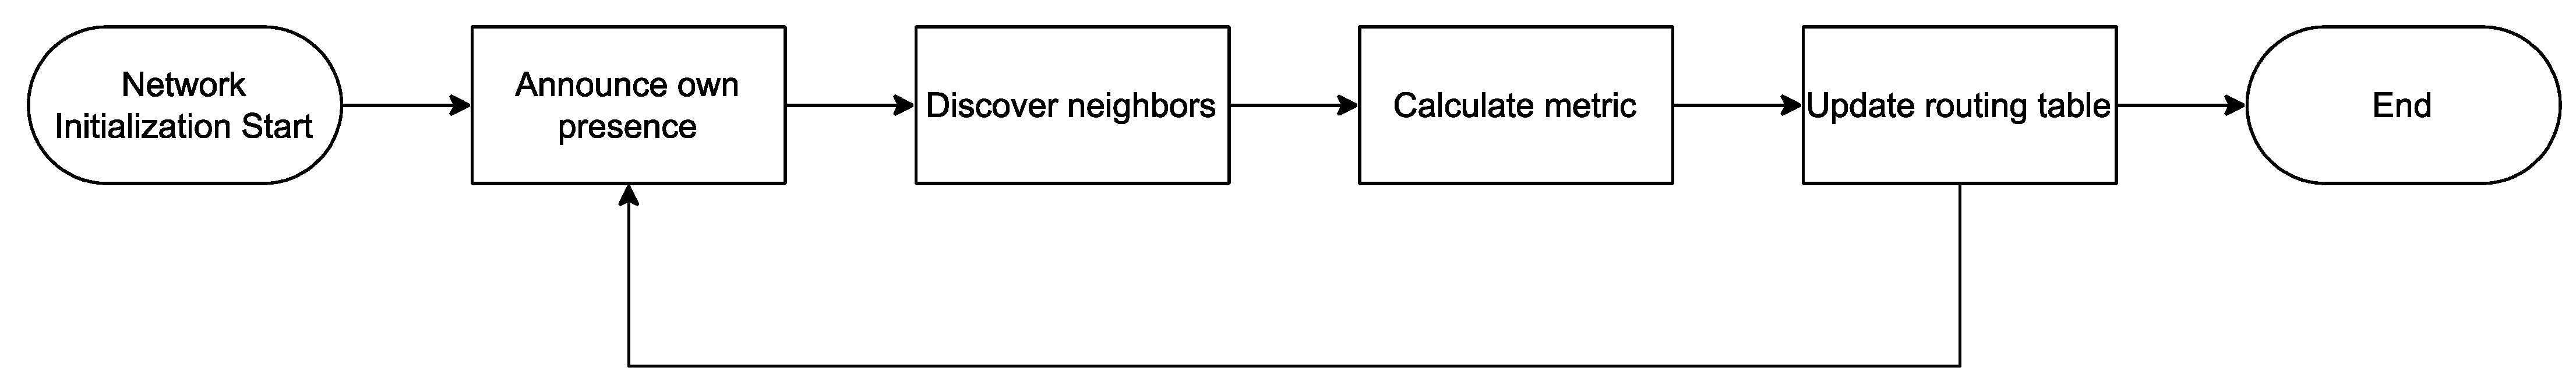
The very first step will be to announce the presence of the self to every neighbor using a customized message OGM after the initialization of the BATMAN protocol. This message will be broadcasted with the parameter time-to-live (TTL) equal to 1, ensuring that it only reaches direct neighbors and is not forwarded to other nodes. This message will continue being broadcast with a delay of 1 s by default (originator interval) until the algorithm is taken offline or the node is powered off. Each OGM is marked with a sequence number (SN), which helps in eliminating any received obsolete information. The SN also helps prevent any routing loops from forming as any packet re-broadcasted to the originator node can verify that it is the same information it broadcasted earlier, eliminating some of the causes of routing loops. The metric used by the protocol is termed Transmission Quality (TQ), which is calculated for each link toward the destination between neighbor nodes by analyzing the OGMs received by the neighbors. A similar transmission quality metric was also utilized, but based on geolocation [32]. A basic flowchart for BATMAN general components is presented in Figure 2.
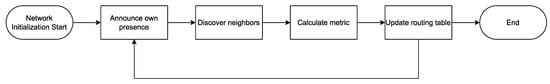
Figure 2.
Flowchart for BATMAN algorithm.
TQ is the performance measure between two neighbor nodes for sending and receiving information [33]. Two nodes communicating on a single wireless link will not exhibit similar performance measures towards each other, as in the case of wired links [31]. This behavior of wireless interfaces limits the ability of TQ to determine the performance of two neighbor nodes just by equating (sending only or receiving only) OGMs on one side. Therefore, TQ can be further classified into two parameters, receive quality (RQ) and echo quality (EQ), to measure the performance between two nodes, first by sending the OGM (RQ) and then after receiving the re-broadcasted OGM to compute the EQ.
The mentioned mechanism is only observed in BATMAN IV, which has its disadvantages, such as delay caused by the information collection procedure as OGM transmission and echo from the neighbor would take some time to transfer while data rate and packet losses in wireless channels vary over time. Therefore, a mechanism was required where local link quality can be detected with high frequency (default for OGMv1 vs. 1 s), and OGM advertisements would be separate from local link quality metric calculations for the stability of the network. Therefore, BATMAN V was introduced, which is still in the initial stages of development. In BATMAN V, Echo Location Protocol (ELP) is used to discover neighbors and announce their presence, while a modified variant of OGM, OGMv2, is used to calculate the transmit qualities of the links and flood this information onto the network. The metric for BATMAN V relies heavily on throughput rather than packet losses. The throughput can be either queried from the interface or ethtool can be used to determine the throughput at any stage. The transmission quality on the local level (between neighbors) can be found by using the numbers of packets sent and echo received to determine a statistical measure for reference to other nodes. This can be achieved by the mechanism and can be denoted using the expression [17]:
The same can be calculated for each neighbor of the node, and all the nodes with their neighbors can calculate the same.
3.1.1. Path Transmission Quality
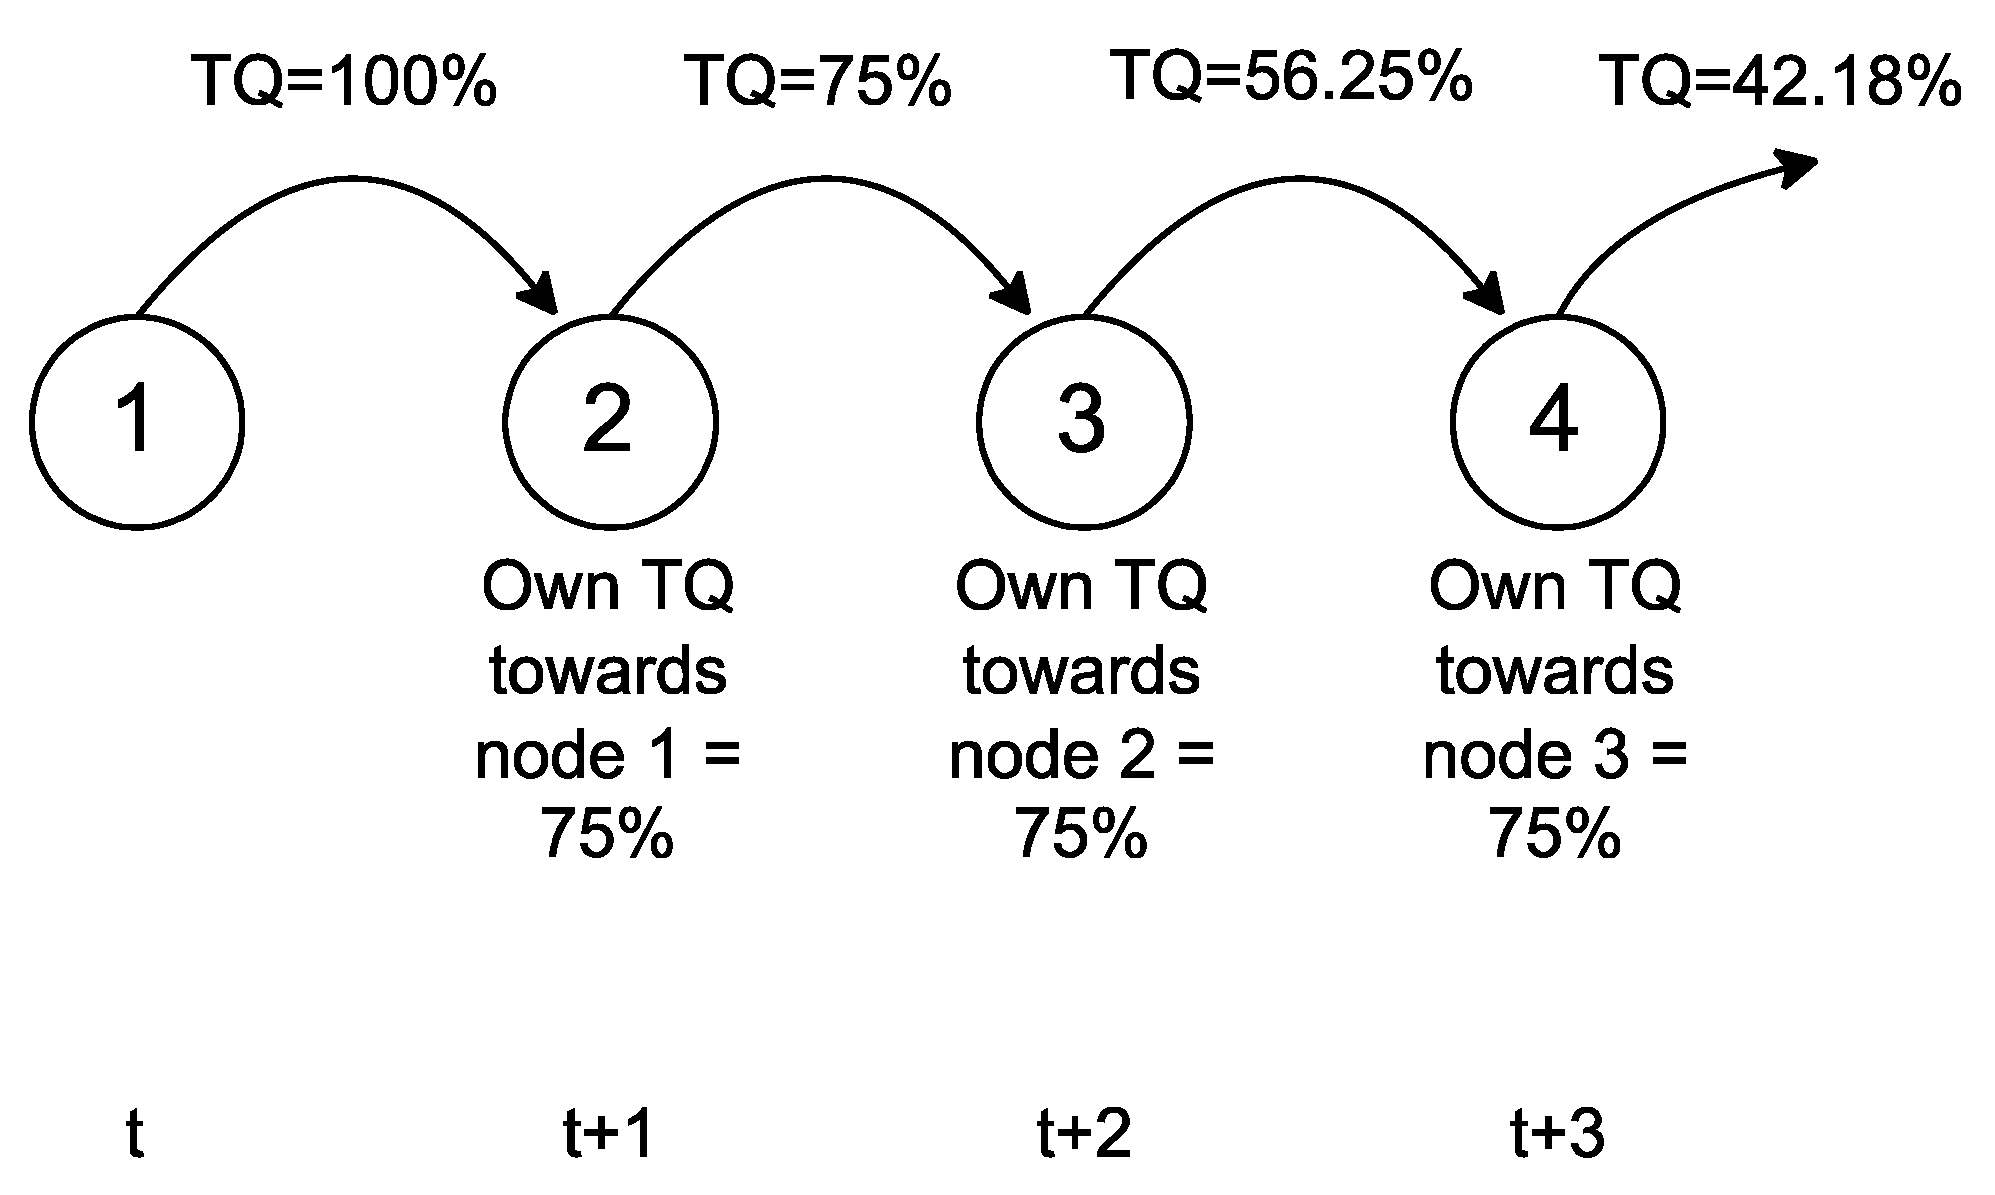
Path transmission quality is computed from source to destination with 1 or more intermediate nodes. The value of path transmission quality is measured with the incoming TQ in the OGMs and inducing it with the local TQ calculated towards that node and forwarded in the OGM to its neighbors. Since local TQ is the ratio of transmitted packets with the number of packets received through re-broadcast or echoes towards the sending node, it can be presented as a percentage of the quality of the node towards another node. We must consider the scenario presented in Figure 3, where node 1 transmits its TQ via OGM to node 2 assuming the best TQ of 100%.

Figure 3.
Path transmission quality computation and forwarding mechanism.
For the simplicity of the metric computations, all other TQs towards their neighbors are considered as 75%. When node 2 receives the OGM at time t, it will compute the path transmission quality [17] as follows:
where is extracted from the OGM received from node 1. The TQ that will be forwarded to another neighbor in the direction of the path will be , which when received by node 3 will be termed as simply , while is the same as calculated in the previous section. Node 3 at time interval will compute the new using (2) and transmit the calculated TQ when sending OGM to other neighboring in the path. The same procedure will be repeated for all other consecutive nodes in the path until the destination is reached.
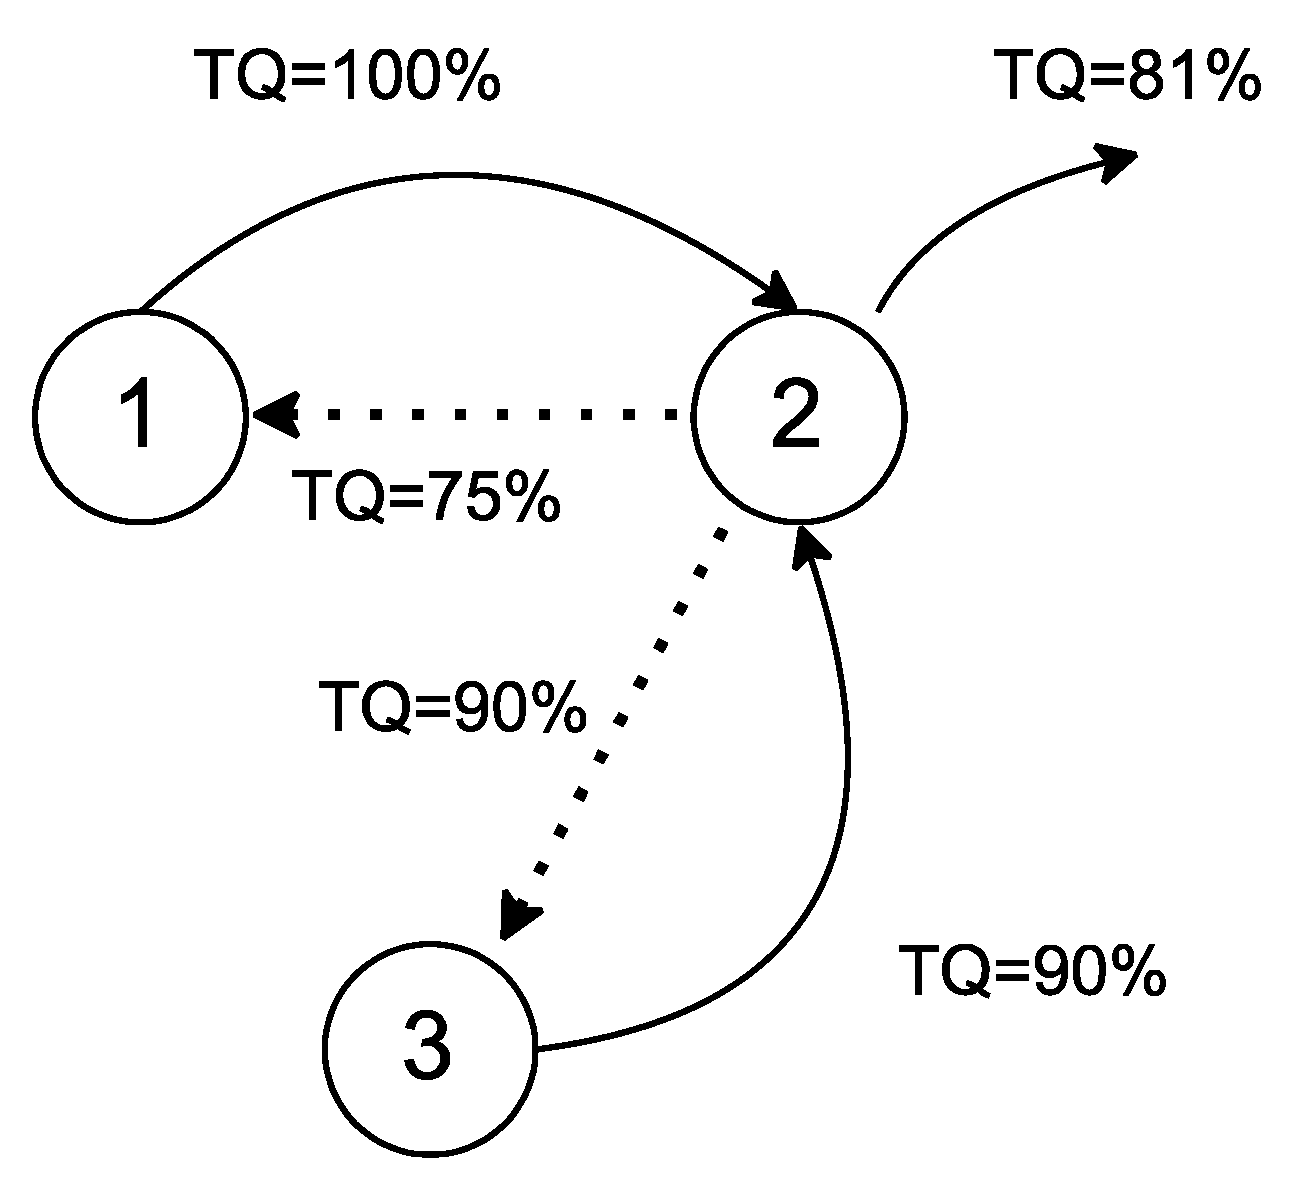
In such scenarios, where multiple paths lead to the destination, the best path metric would be identified by comparing the obtained from Equation (2) of two nodes. A similar case is presented in Figure 4, where node 1 and node 3 transmit their to node 2, and node 2 results as 75% and 81 for the paths from 1 and 3, respectively.
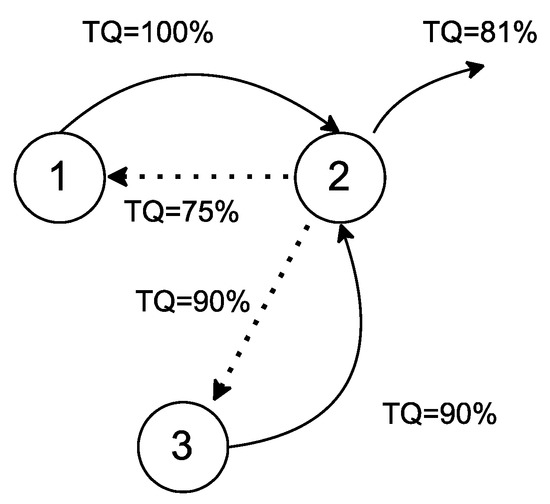
Figure 4.
Best path TQ calculation.
Since 81% offers a better quality of the link than 75% of node 1, node 2 will use the best value of 81% in the forwarding OGM(s). The compound path can be found using all the node(s) of using the below equation, where is the total number of nodes in a selected path towards the destination [17].
3.1.2. Penalty for Asymmetric links
Since the wireless channel from node 1 to 2 and vice versa are not the same, a penalty is therefore introduced in BATMAN to reduce the TQ value such that the link that has low RQ values should be penalized (reduced) in the overall TQ, as shown in the below equation [17].
The value presented herein (4) is derived analytically rather than by measuring the performance difference between RQ and EQ.
3.1.3. Hop Penalty
In an ad hoc network, each node acts as a router and is responsible for processing each packet, computing TQ, and forwarding OGM to neighbors, other than receiving and forwarding data packets. The processing delay also affects the transmission quality and is yet to be included as it is not easy to map the processing delay of the node as it will vary depending on the configuration/specification of the node, queue length, and number of free resources that a node possesses when processing a data packet or OGM. Therefore, many routing algorithms utilize a parameter called hop counter or hop penalty to affect the metric depending on the number of nodes/hops a data packet takes in reaching its destination. Hop penalty in BATMAN IV is a pre-defined and configurable parameter that can be altered at will to achieve desired results, e.g., enhancing the effect of hops into the metric or marring so that path transmission quality is less or more depending on the parameter, respectively. To compute the hop penalty effect on TQ, another parameter is introduced to show the maximum achievable TQ for any path set to 255 by default. This ensures that paths with an increasing number of hops are penalized regardless of their local transmission quality, and it is provided below [17]:
where is the hop penalty that is set to 30 by default in BATMAN.
3.2. Impact of Hop Penalty Value on the Performance of BATMAN
Experiments in [34] show that a hop penalty higher than 15 would have an overall impact on TQ, which will diminish the local link quality, and BATMAN as a routing protocol becomes a hop count rather than a composite metric. The variation in hop count also impacts the overall network throughput and delay performance. To better understand the impact of the hop penalty on the TQ, consider Figure 5, where 10 hop-to-hop nodes are presented in a serial fashion. All nodes have a TQ value of 255 (the maximum as per BATMAN specifications) and analytical results are plotted with the impact of increasing hop numbers. The figure shows that increasing hop decreases the overall TQ quality by 42% after 10 hops; therefore, networks with a higher number of hops suffer more as compared to networks with fewer hops. Another example of delay impact on the network where nodes are considered symmetric in nature is presented in [35]
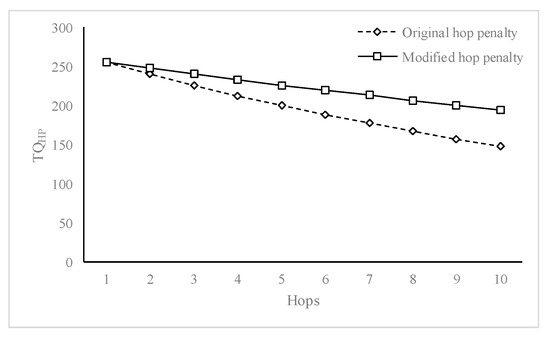
Figure 5.
Impact of hop penalty on transmission quality metric.
3.3. Split Hop Penalty for Unidirectional Links
All wireless links are unidirectional as opposed to Ethernet connections; although it is highly dependent on the hardware of the wireless interface, it causes the algorithm of the hop penalty to be doubled or implemented twice. This duplication of the hop penalty on the incoming and outgoing packets increases the hop penalty’s pre-configured value to twice the size and causes the TQ metric to decrease to low values, resulting in severely affected multi-hop transmission. The problem is also present for multi-channel and multi-antenna multiple input/multiple output (MIMO) systems as the data link layer for all the antennas is the same and a packet is processed twice when entering layer 2 from the physical layer and when it is being forwarded to the physical layer of the OSI model.
The default implementation of BATMAN IV suffers from performance issues caused by the high hop penalty values, which have twice the effect and cause the metric to function as a simple hop-count metric. To solve the above problem, several different formations of a split hop penalty were tested to differentiate the links that cause this problem from those interfaces in which this problem does not exist. The tests were conducted on a hit-and-trial basis rather than analytically derived for multi-hop communication. The scenario was chosen to be diverse enough so that the topology supports more than one path towards the destination in an indoor scenario. The basic idea was to use a different hop-penalty value to compute the overall TQ such that the effect caused by the duplication of the hop penalty can be dismissed. This is achieved by dividing the hop penalty configured value by 2, as it will be implemented on a unidirectional interface exactly two times; therefore, the actual value set by the user will be accommodated on the TQ metric only once. The new penalty is similar or symmetrical to the original one but only uses half of the HP value. If the interface chosen is a wired interface, the hop penalty value is implemented as defined by the user with no change. Therefore, can be incorporated with the newly developed hop penalty through the below equation:
The path metric presented in (6) will be used after the is calculated with its own metric according to (3) and before the transmission of into the forwarding OGM. This would prevent any deduction that may happen twice for the hop penalty and cause the link cost to be of better quality as compared to the original. It is important to notice that if a node has multiple interfaces, then each node will calculate individual hop penalties for each physical interface as presented in Figure 6.
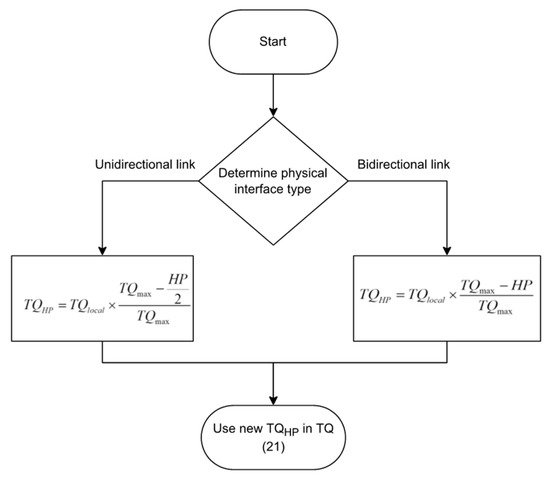
Figure 6.
Split hop penalty flow-chart for each interface in node.
The algorithm of the code that was inserted to modify the behavior exhibited by the BATMAN nodes is presented in Algorithm 1.
The algorithm takes the HP value and value as input to the function. The value is taken after it is calculated using (3) and before the inclusion of in OGM that is to be sent out to the wireless interface through its own interface bat0. The algorithm checks the type of interface and applies the appropriate hop penalty to the metric. A list of frequently used notations can be found in Table A5. The algorithm is simple enough not to cause any performance lag or excess CPU utilization. The effect is either negligible or too small to measure by normal methods and therefore is best suited to mobile applications, including IoT, MANET, and other similar architecture-based networks.
3.4. Overall Transmission Quality
All the individual transmission qualities have been computed in (2), (4), and (6) for , and , respectively. To compute the overall TQ or combined TQ (as mentioned in open-mesh documentation), the product of all individual transmission qualities is taken, and since each TQ has a range of 0.255, to normalize the combined TQ to retain it in the same boundary, the product is then divided by the cube of , which has a default value of 255 and is presented below:
| Algorithm 1 Split hop penalty for batman-adv version iv |
| 1. Input: HP, |
| 2. Output: |
| 3. Function split_hop_penalty (HP, ) |
| 4. For all bat interfaces |
| 5. For all bind interfaces |
| 6. If the interface is uni-directional then |
| 7. |
| 8. Else |
| 9. |
| 10. End If |
| 11. End for |
| 12. End for |
| 13. Return |
4. Test-Bed Implementation Setup
4.1. Hardware Setup
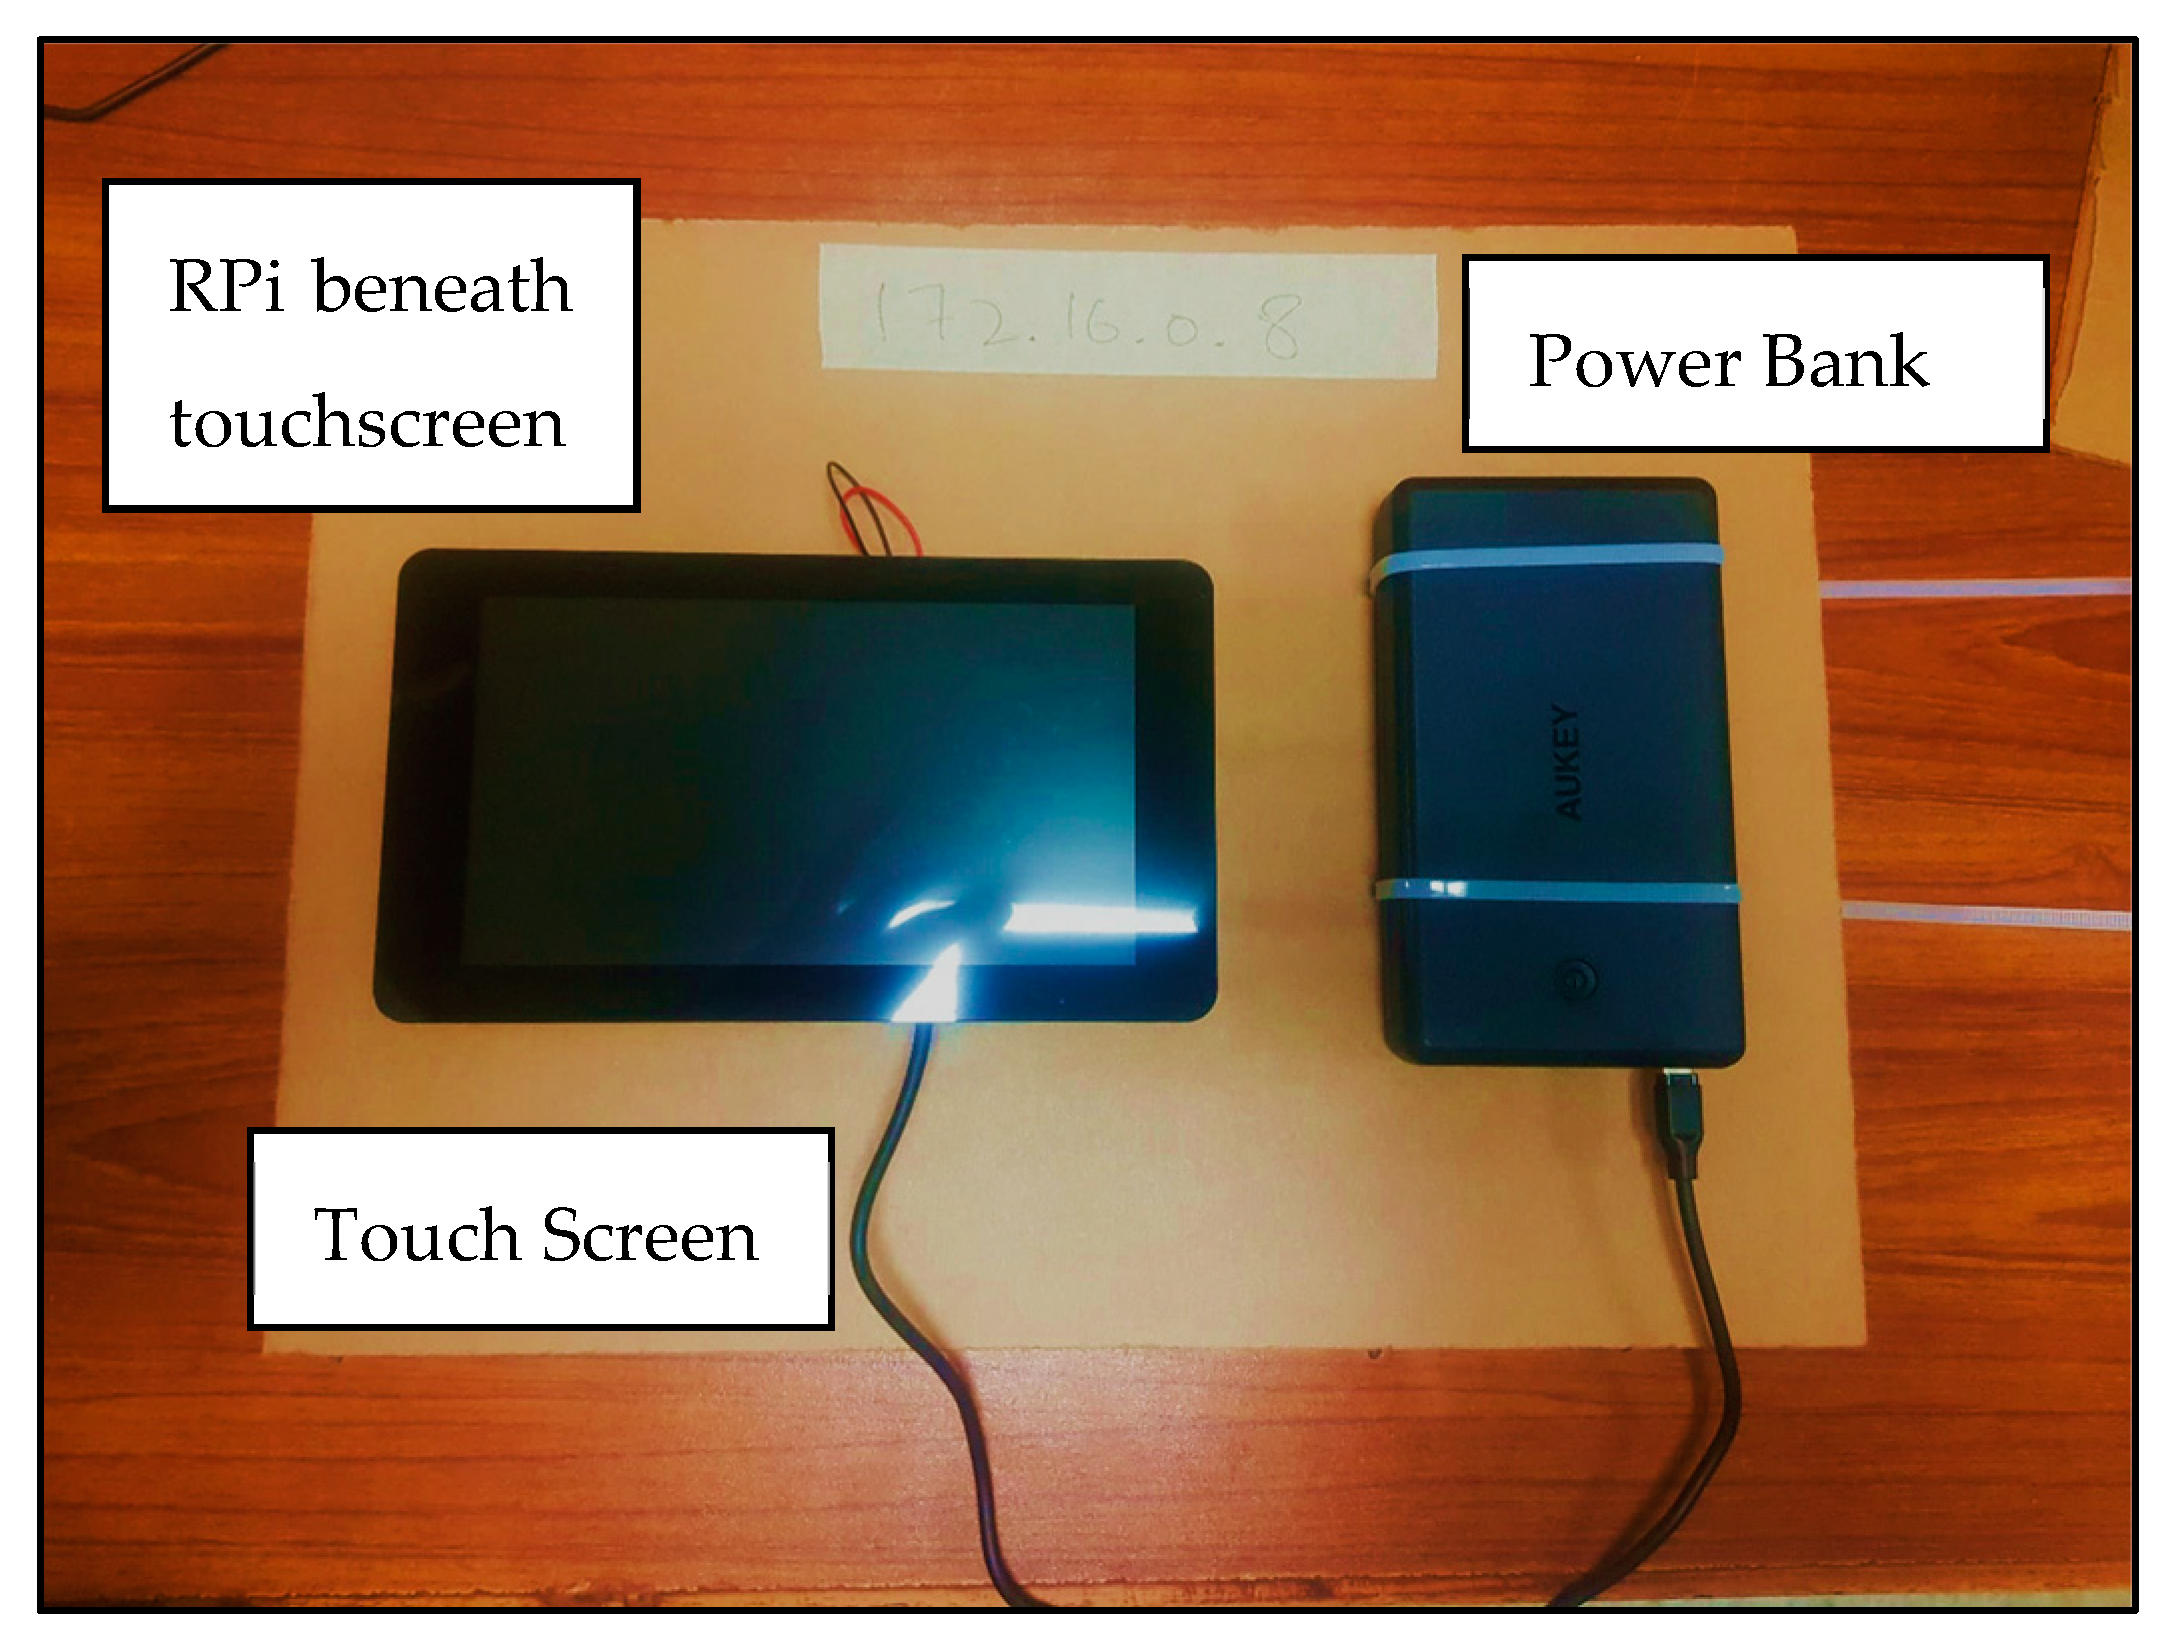
In order to present the performance improvements that are incurred with the inclusion of the split hop penalty in the path transmission quality metric, a test-bed is set up within the campus of NED University of Engineering and Technology, which comprises four labs with a maximum lab size of 24 feet × 56 feet. The total covered area of the labs where the experiment is conducted is 4896 sq ft or 545.8533 m2. The testbed is composed of a total of 14 real nodes, complete with power backup on a single board. Each node comprises a raspberry pi 4 model B with 4 GB RAM, 8 GB SD card, a 7-inch touchscreen-enabled LCD mounted on top of the raspberry pi, and a 30,000 mAh rechargeable battery to support both raspberry pi and touch-screen. Each node is pasted with the node’s IP address for easy access to Secure Shell (SSH) as the MAC address would not be used directly in any test, and address resolution protocol (ARP) will be used to translate IP addresses to MAC addresses. It is also necessary as the tools required to generate data and collect performance measurements also require IP addresses rather than MAC addresses. The touch-screen is mounted with the help screws onto the board so that ample space is available for heat dissipation for both the touchscreen and raspberry pi.
The complete node is presented in Figure 7, in which the image is captured from the top; therefore, raspberry pi is hidden as it is mounted below the touchscreen. The node is easy to carry and place anywhere around the campus.
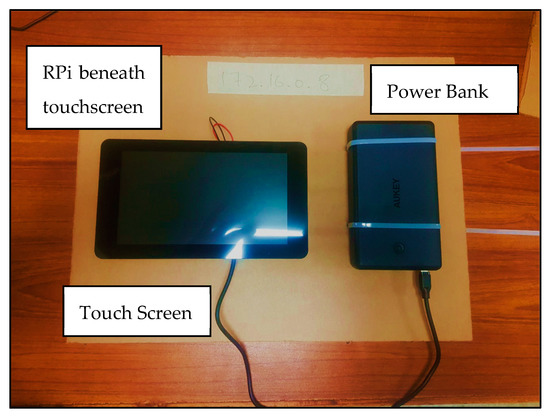
Figure 7.
Top view of a node comprising raspberry pi (below the touch-screen), touch-screen, and power bank.
4.2. Software Configuration
Each node is accompanied by an operating system provided by the manufacturer, which aims to provide the majority of the hardware functions, and a keen focus is on the performance. A lot of operating systems are available for raspberry pi in the market, but Raspbian OS is chosen due to its affiliation with the hardware manufacturer, and the performance it provides is beyond any other OS except the operating systems without x-server (which is GUI for Linux). The latest Raspbian OS (sometimes called Raspberry Pi OS) is available at the experiment’s time, and Debian version 10 (buster) is installed. Buster comes with Linux kernel version 5.10, but it was later upgraded to kernel 5.15 before any experiment was conducted. Although batman-adv is already part of Linux as a kernel module, any modification is not possible directly into the kernel module. Therefore, the latest version of batman-adv (2022.0-13-ge009ae23-dirty) was downloaded from GitHub, recompiled from scratch, and then loaded into kernel memory through the available modprobe program in Linux for kernel module management.
All the wireless interfaces of the raspberry pi OS are managed by the wpa_supplicant program which is responsible for connecting and managing infrastructure-based networks that support Wi-Fi Protected Access (WPA). Since all the nodes do not need any infrastructure access point in ad hoc mode to enable communication, wpa_supplicant utility is terminated on all nodes, and iwconfig (also a free utility in Linux to manage wireless interfaces) is used to create an ad hoc network with the essid “batman-network”. After setting all the parameters through the iwconfig and ifconfig utility, the batman-adv module was loaded through the batctl command. Batctl is the controlling application for batman, which includes all the commands for controlling batman routing protocol in user space.
Since, the operating system boots and loads all the kernel modules and utilities by pushing them into RAM, which takes some time. Therefore, a delay of 30 s was included before the script began. Eliminating the delay between the execution of the script and the point where crontab is executed will result in misconfiguration. During the experiments, several parameters of the initialization script were changed over the runtime, including the wireless interface transmit power and batman routing algorithm. Regarding the steps required for initialization of the batman network, Table 2 highlights the tasks that need to be executed in that specific order at boot.
Table 2.
Pseudocode for bash script executed on node boot.
4.3. Test-Bed Parameters
Table 3 summarizes the earlier discussed and other parameters necessary to be set up for the reproduction of the results. An explanation of some of the parameters was discussed in previous sections.
Table 3.
BATMAN-adv experimental (test-bed) parameters.
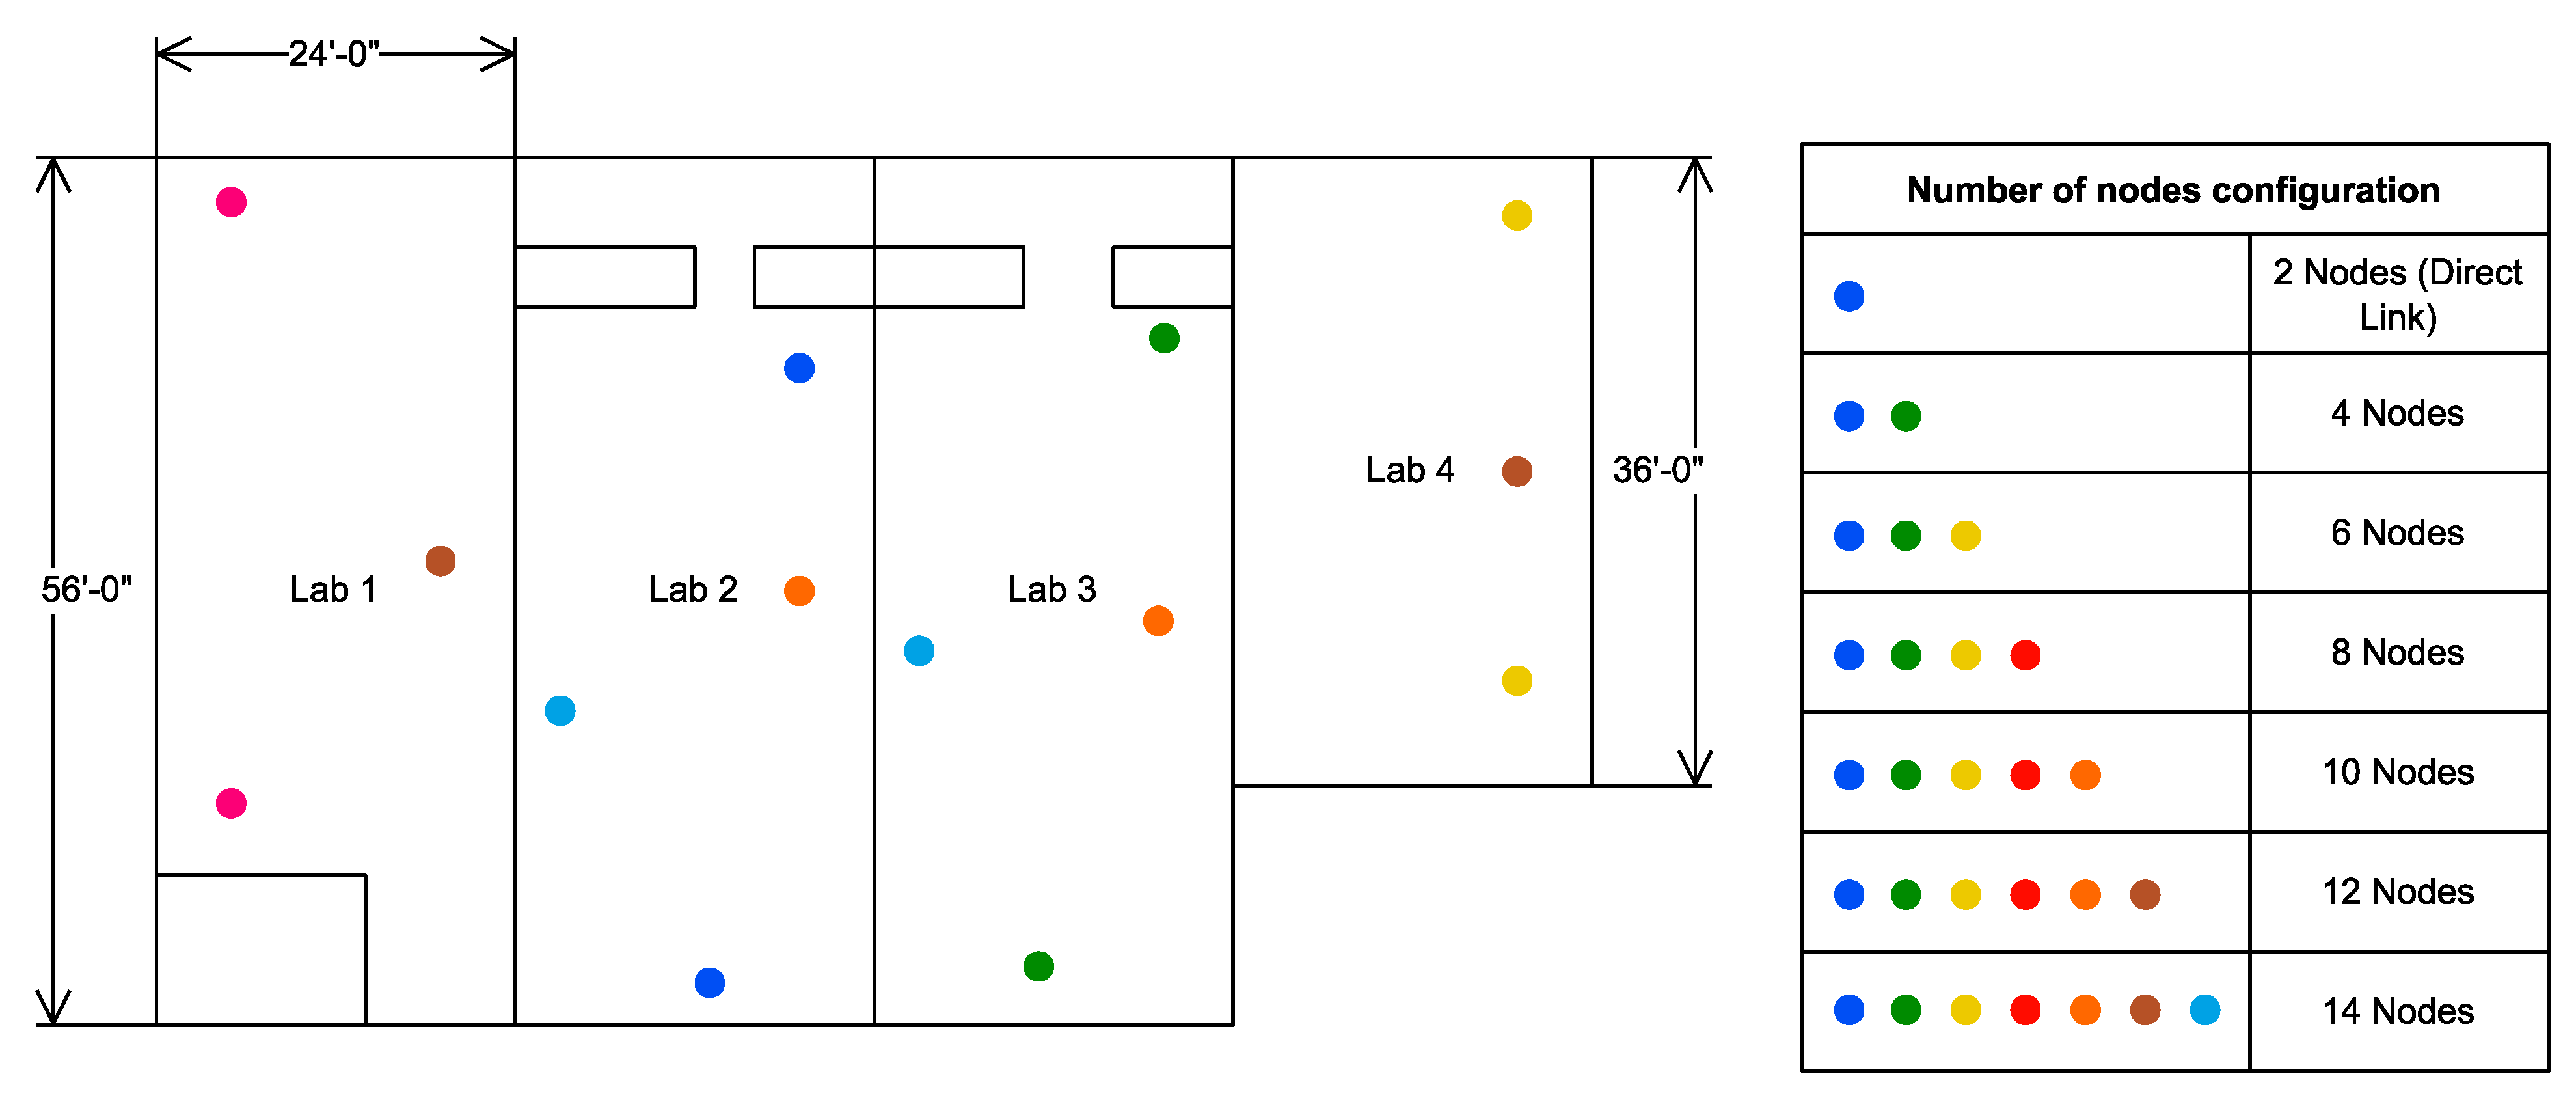
The experiment was conducted in a lab environment with consecutive labs in a corridor situated on the first floor in the Telecommunication Department of NED University of Engineering and Technology. The map of the experiment’s location is presented in Figure 8. It is important to note that there are several configurations where different numbers of nodes were deployed. Therefore, Figure 8 contains a legend that shows the configurations of nodes and placement in a tabular manner. The nodes were placed such that a smaller number of nodes cover the entire area provided for this experiment. After covering the entire lab area of 4896 sq ft. with only eight nodes, an additional number of nodes were placed in between the nodes, which caused multiple paths between source and destination with a relatively good transmission quality metric.

Figure 8.
Placement of nodes at various locations in the campus block with configuration.
Since there is always clutter in the lab (compared to the experimental setup), e.g., computers, furniture, electrical components fittings, and other lab equipment and trainers, it is essential to attach images with this report to achieve a better idea of every lab part of the experiment. The following images, including Figure 9, were captured during the conduction of the experiment.
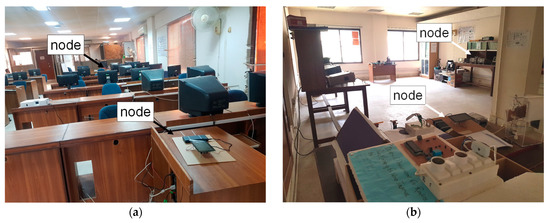
Figure 9.
(a) Lab 1 with 3 nodes (2 in sight) and (b) Lab 4 with 3 nodes (2 in sight).
4.4. Assumptions
Since the raspberry pi OS driver for WLAN only provides support for a maximum MTU (Maximum Transmission Unit) of up to 1500 bytes and increasing the limit requires Linux kernels to be configured, recompiled, and reconfigured, it is left as a maximum of 1500 bytes. It is also acceptable to set the maximum MTU to 1500 bytes as indicated in the batman-adv documentation. In this case, the batman algorithm automatically fragments the frames on the data-link layer and combines the de-fragmented frames on the receiver node. Though the authors of BATMAN do not recommend this method, additional overhead for fragmentation and de-fragmentation is required and may impact the network’s performance. As the topology utilized in the experimental setup is the same for all the tests conducted (BATMAN IV, BATMAN V, and BATMAN IV with split hop penalty) during the study, they are comparable, and therefore, any changes to the MTU would affect the results in the same manner for all protocols tested.
Another assumption is that the availability of the RF medium on the 2.4 GHz band for all the nodes to communicate is limited in the tested scenarios, as labs (where the evaluation has been conducted) are within the wi-fi range of the campus. Channel 9 with a band of 2.542 GHz was chosen for the ad hoc network, though choosing a different channel would have the same density as choosing the 8 or 9 channel of the wi-fi. However, due to the nature of radio waves, coverage and throughput might change but will exhibit similar performance deltas as presented in the results [36]. Due to the real scenario, the footprint movement of the people involved in the experiment and a limited number of people part of the staff was minimized to the best of our abilities but could not be kept to zero.
5. Experimental Results
5.1. BATMAN IV with Split Hop Penalty
The results collected after the experimental work for the split hop penalty are presented in this section. Since the results are collected for seven different node setups and with four different transmit powers, presenting all of them with two different algorithms will be hard to differentiate on a single graph. Therefore, the results presented here contain two graphs each for different types of hop penalties. The summarized results will be used to average the results for better comparison.
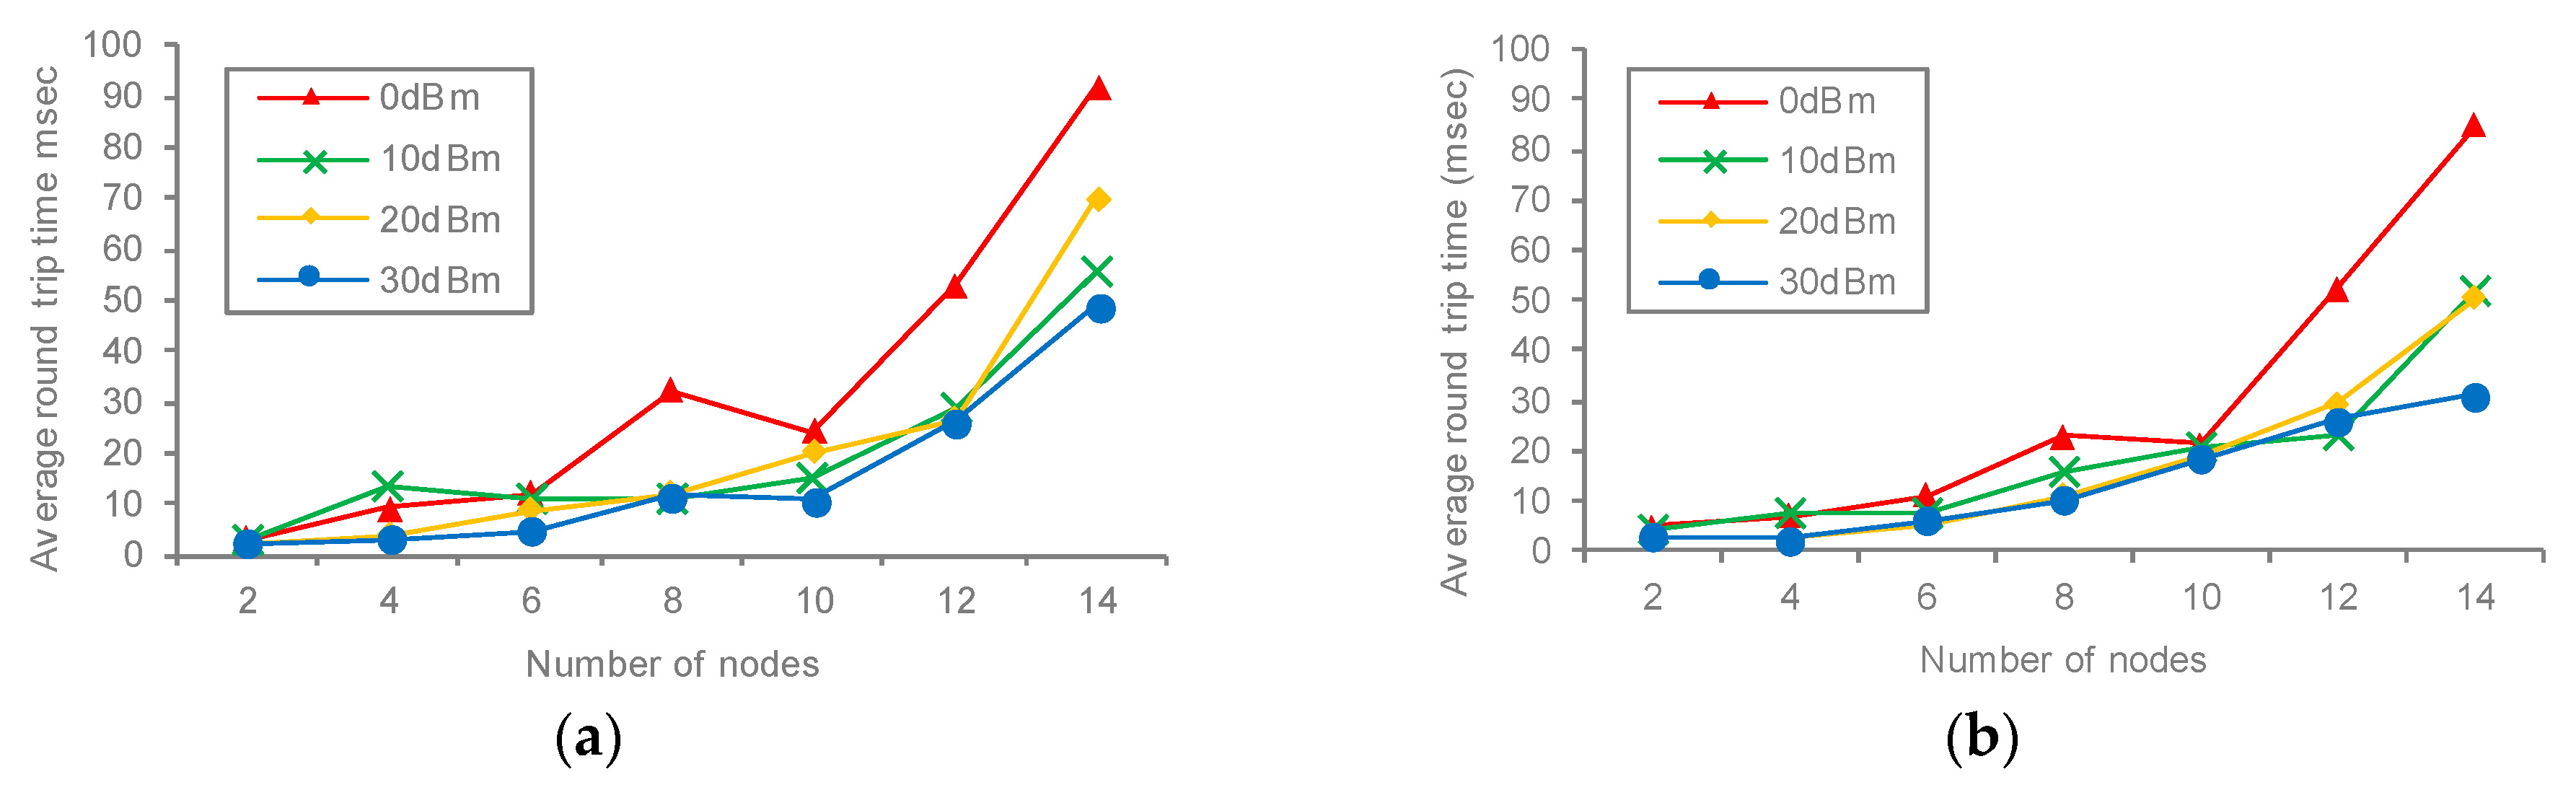
The average roundtrip time or end-to-end delay is presented in Figure 10 with (a) original hop penalty and (b) split hop penalty. The experimental data are shown in Table A1. The results show a great performance increment overall, with some points where BATMAN IV still performs slightly better than the newly adapted hop penalty. The lowest RTT achieved by the original hop penalty was 2.362 ms compared to 2.45 ms for the split hop penalty. The highest delay was recorded to be 91.921 ms for the original hop penalty in contrast to 84.867 ms for the split hop penalty. The overall average gain of 10.2% was recorded in average roundtrip time for the two techniques. The most obvious performance gain was recorded with the highest number of nodes, i.e., 14, which was found to be a 22.09% improvement over the original hop penalty.
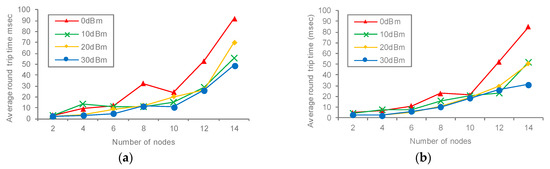
Figure 10.
Average roundtrip time for (a) original hop penalty and (b) split hop penalty.
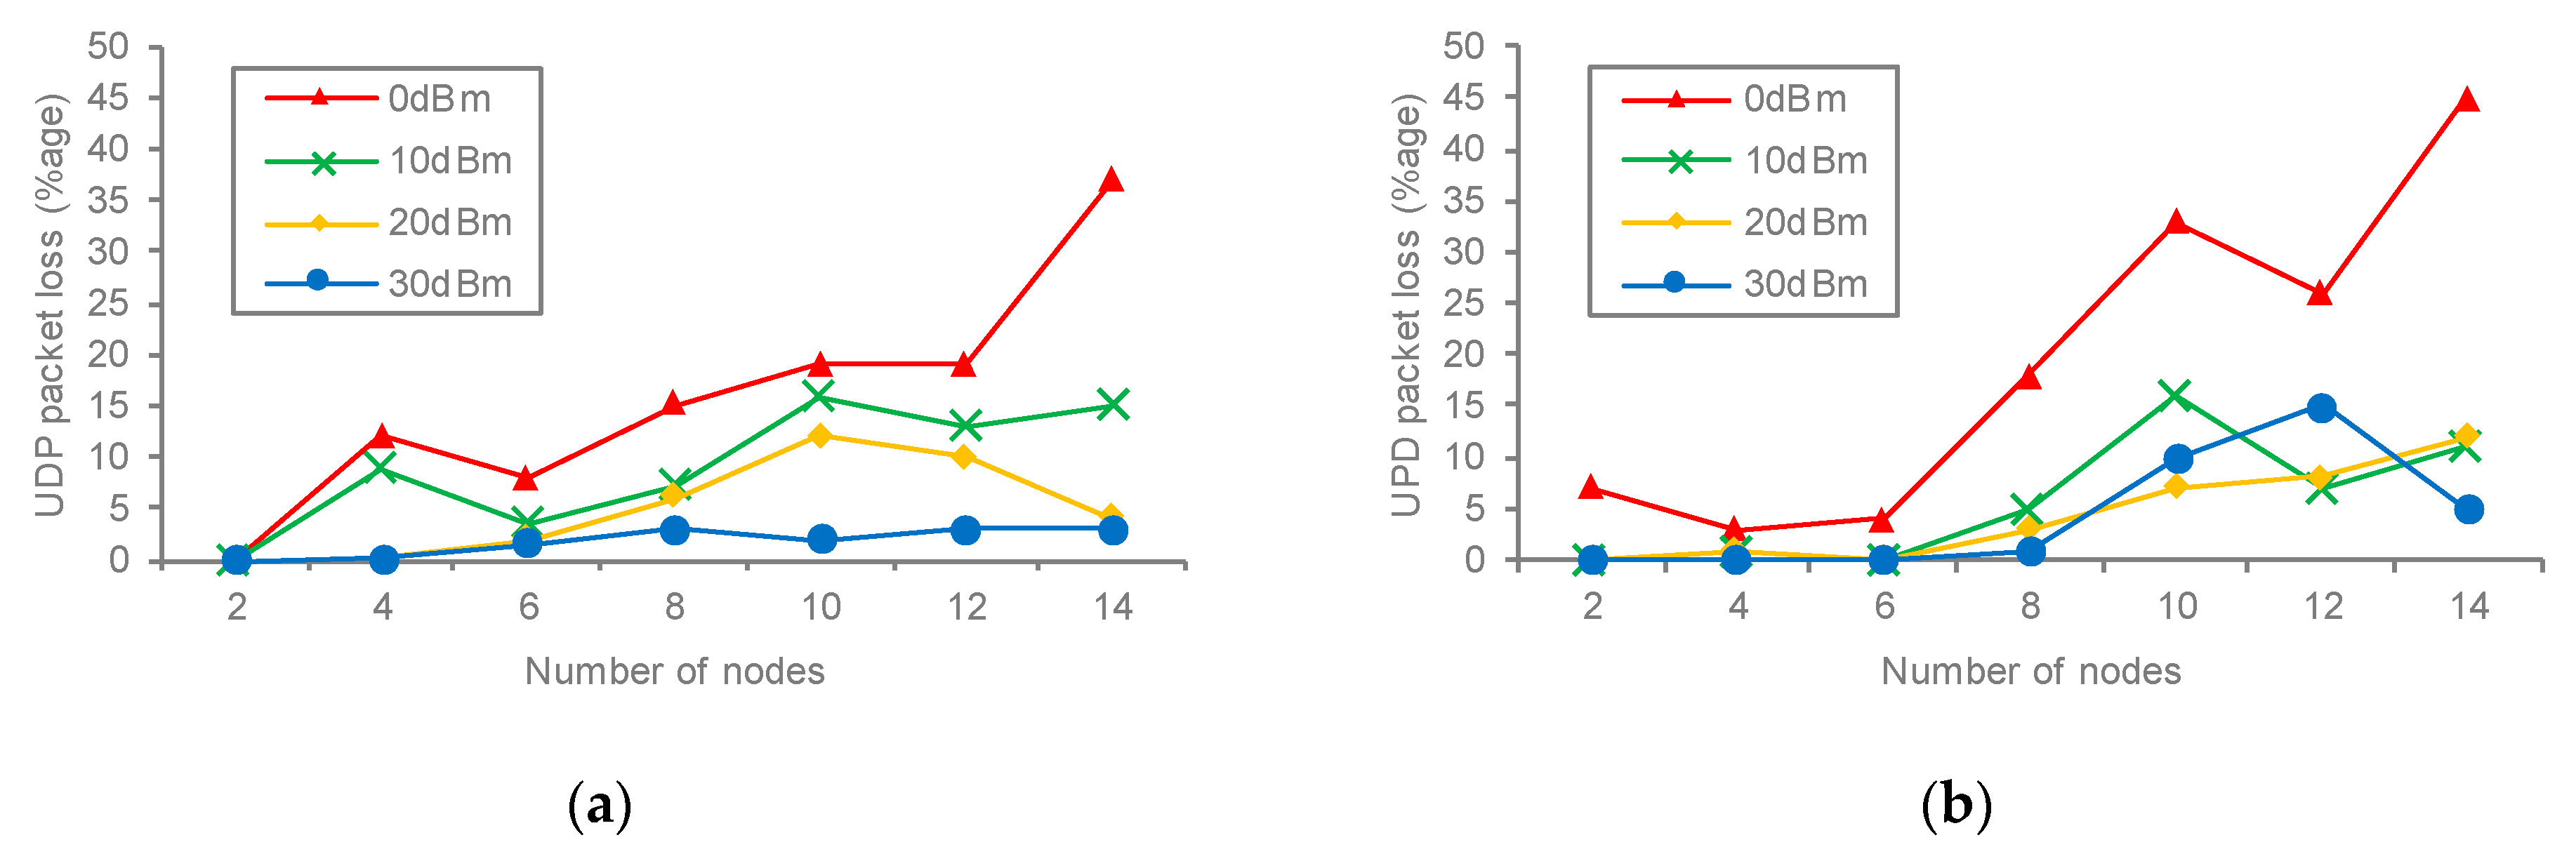
All the packets that are lost during the transfer of information from source to destination lead to information loss and sub-quality hardware. However, some techniques might help recover some of the lost information but will require additional hardware and further cause a delay in processing or due to re-transmissions. The packet loss information is provided in Figure 11, whose results can be seen by dividing the graphs into two different phases depending on the number of nodes. The experimental data are shown in Table A3. Scenarios, from the lowest number of nodes to a total of eight nodes, including the split hop penalty show remarkable performance in keeping packet loss low as compared to the original hop penalty. There is a whopping 37.01% greater chance of packets reaching the final destination than the earlier technique. Although this good performance is later stopped as we increase the number of nodes, the original hop penalty provides better results than the split hop penalty. Therefore, it is safe to say that the split hop penalty will not always provide a better performance, especially where the number of nodes is large in the same area.
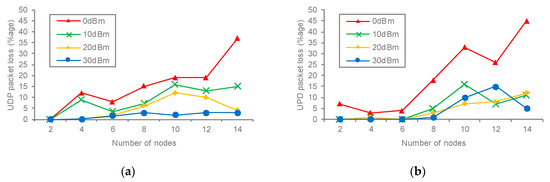
Figure 11.
UPD packet loss for (a) original hop penalty and (b) split hop penalty.
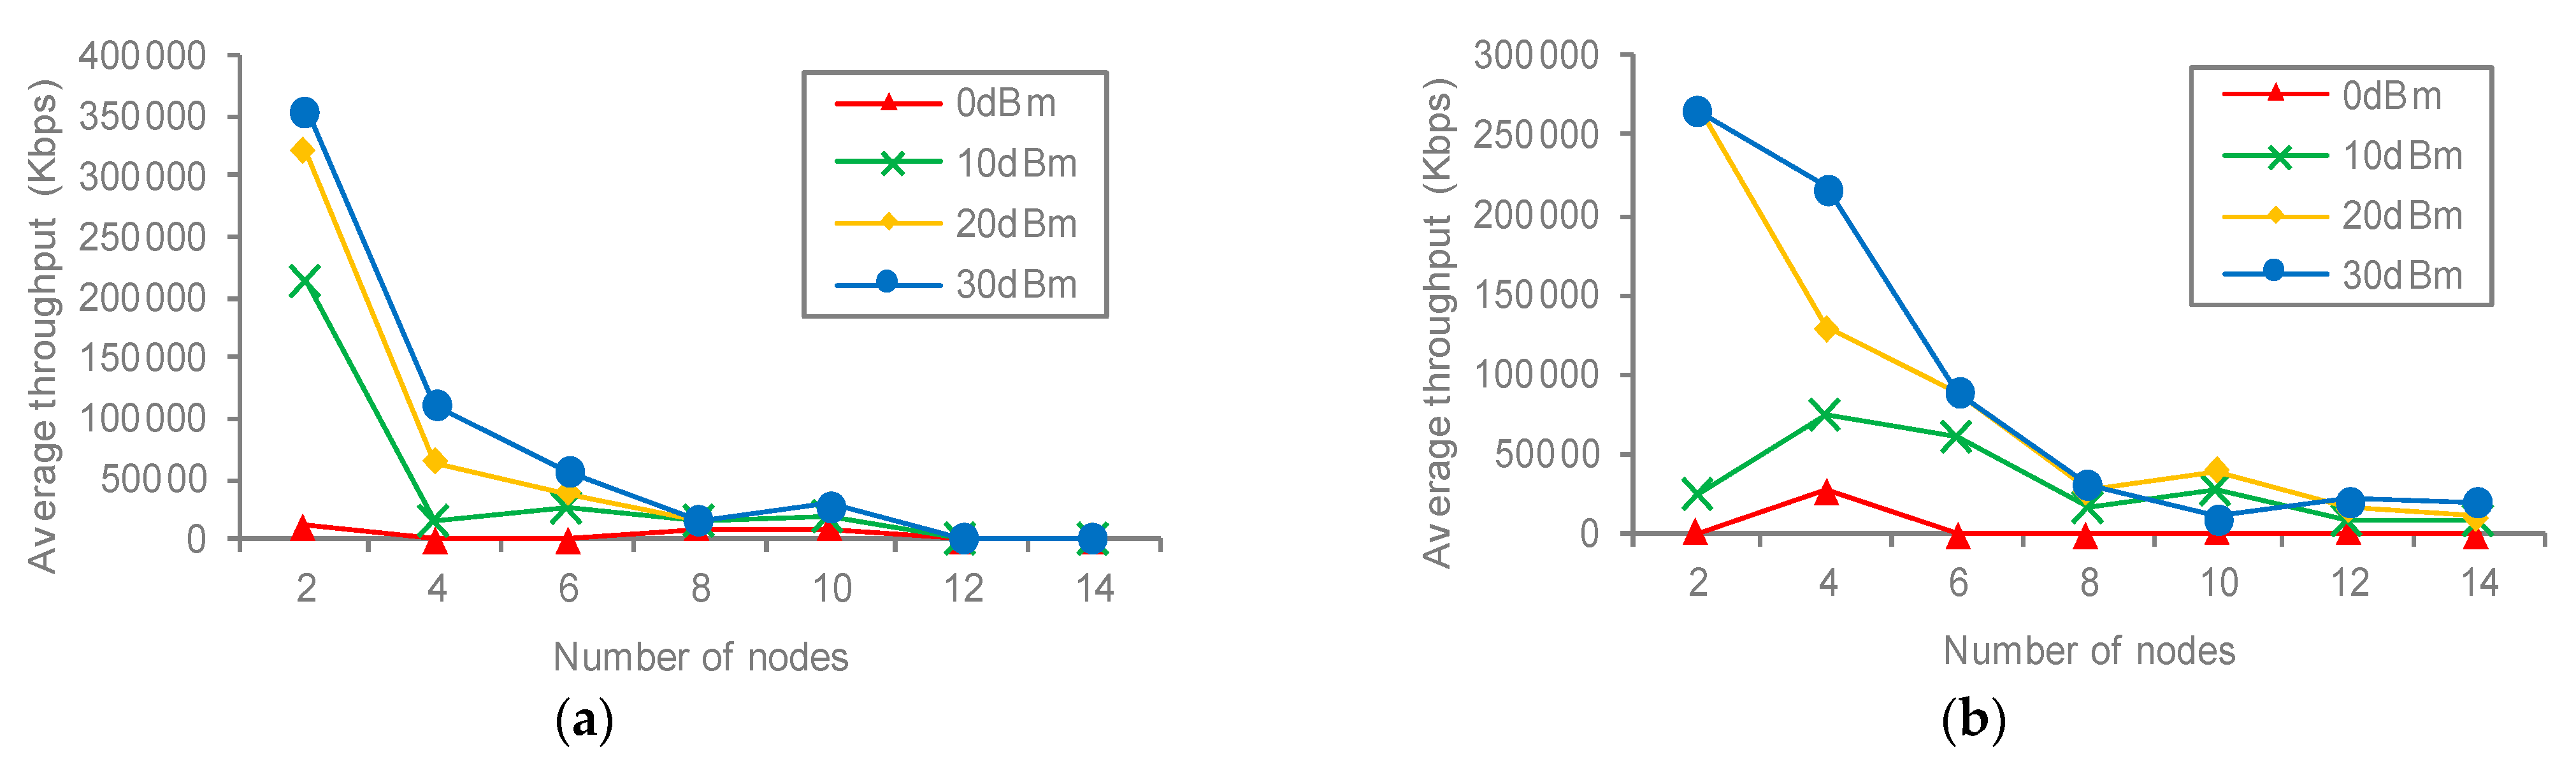
It is also important to note here that during our experimental results, we found multiple incidents where duplicate packets were received and several duplicate packets were equal in both techniques. This needs further investigation as routing loops or unnecessary broadcasts may cause it. The most important factor for communication is the speed offered by the protocol or speed difference that is caused by a change in the operation of the network. Figure 12 represents the spontaneous speed in Kbps toward the destination for both techniques. The experimental data are shown in Table A2. An average difference of 21 times greater was recorded for the proposed split hop penalty compared to the original hop penalty. This proves that the split hop penalty can be utilized in a wide variety of applications requiring a high data rate, as the proposed scheme boosts the performance of BATMAN drastically. The difference is most prominent where a higher number of nodes were utilized, e.g., an average of 209 Kbps throughput was recorded for the original scheme, while the proposed scheme increases the average throughput to 9840 Kbps, which is at least 47 times greater as compared to the original scheme. This difference is caused by the appropriate metric adjustment provided in the new scheme and proves its worthiness to be used in advanced communication systems requiring high transmission rates.
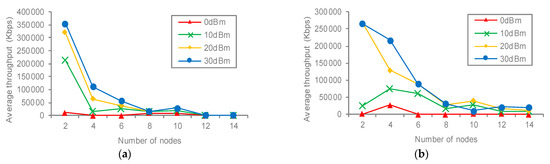
Figure 12.
UPD average throughput for (a) original hop penalty and (b) split hop penalty.
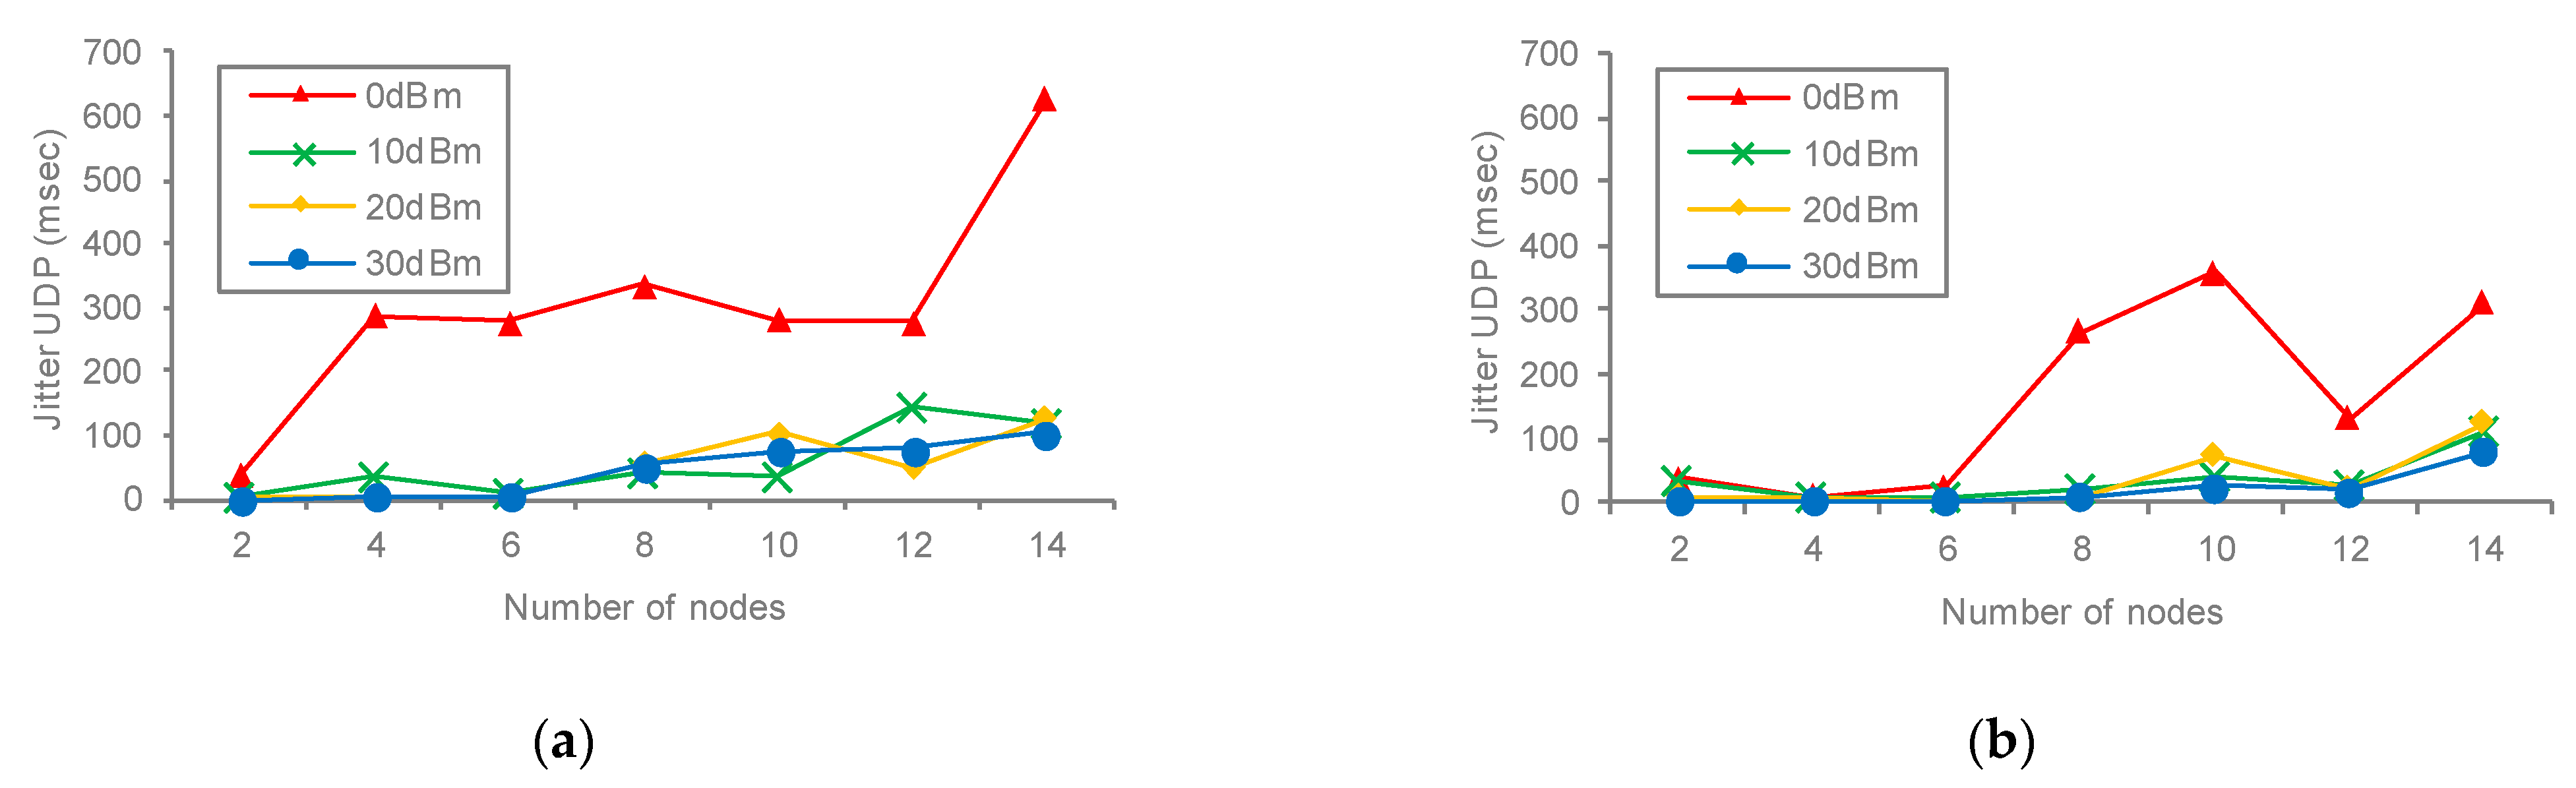
Jitter, a measure of variance in the delay, is an important factor for real-time applications, where updated information has a higher priority as compared to the number of packets lost during the mission-critical transmission. Figure 12 presents the comparisons of jitter for (a) the original hop penalty and (b) the split hop penalty. The experimental data are shown in Table A4. The differences can be spotted at several points in Figure 13. The most prominent is the axis which shows that the overall jitter for the newly proposed scheme is much less than the original hop penalty. The less jitter will contribute to much more reliable communication, less re-transmission, and smaller delays. The most prominent measure of jitter 243 ms was recorded with the highest number of nodes of 14, while it is only 156 ms with the same number of nodes in split hop penalty. Similarly, the smallest average calculated with the original hop penalty is 9.95 ms as compared to 5.64 ms for the split hop penalty. The data recorded at 0 dBm are mostly distinguished as compared to other transmit power. Still, the split hop penalty not only performs better but is also comparable to other transmit powers in the range of 2 to 6 nodes, while increasing rapidly as the number of nodes increases.
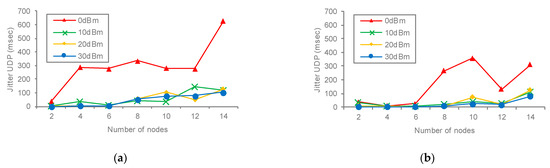
Figure 13.
UDP jitter for (a) original hop penalty and (b) split hop penalty.
5.2. Comparison of Original Hop Penalty and Split Hop Penalty
To better understand the differences in performance for the proposed scheme, it is better to average out all the results with different transmit powers and present them against the increasing number of nodes. Though including 0 dBm is not recommended, it is also kept to show unbiased results to help cover all possible transmission powers.
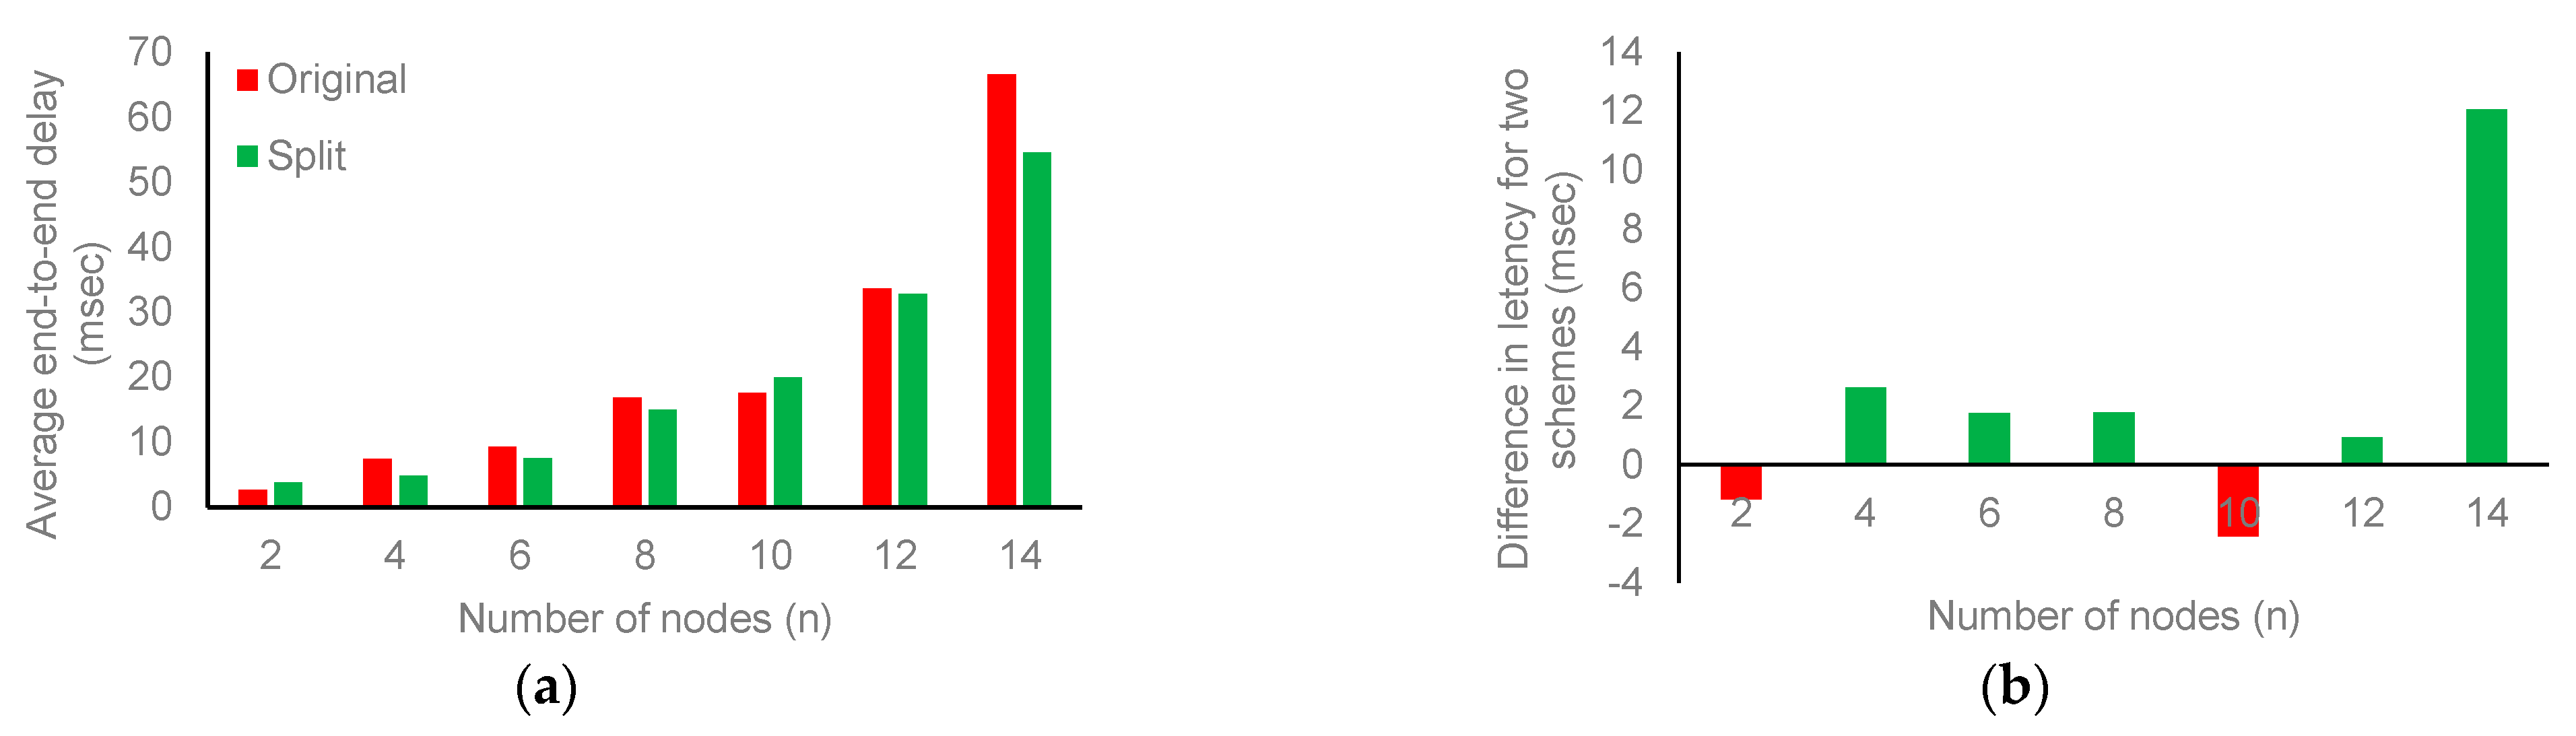
Figure 14 shows a brief comparison of the latency or delay incurred throughout the experiment, accumulating all the transmit power presented in the previous section. Except for when the number of nodes is 2 and 10, the performance gain is visible in the graph, adapting the newly suggested split hop penalty. The most noticeable difference is when the number of nodes is maximum, e.g., 14 with a difference of 12.05 ms, while the least performance difference is 0.9 ms improvement over the original hop penalty. However, there are some instances where the newly adapted scheme has subpar performance, as recorded to be −1.16 ms and −2.41 ms difference (greater than the original hop penalty).
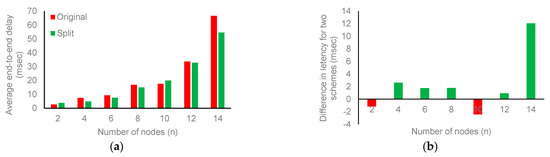
Figure 14.
Comparison of average end-to-end delay (a) values and (b) difference.
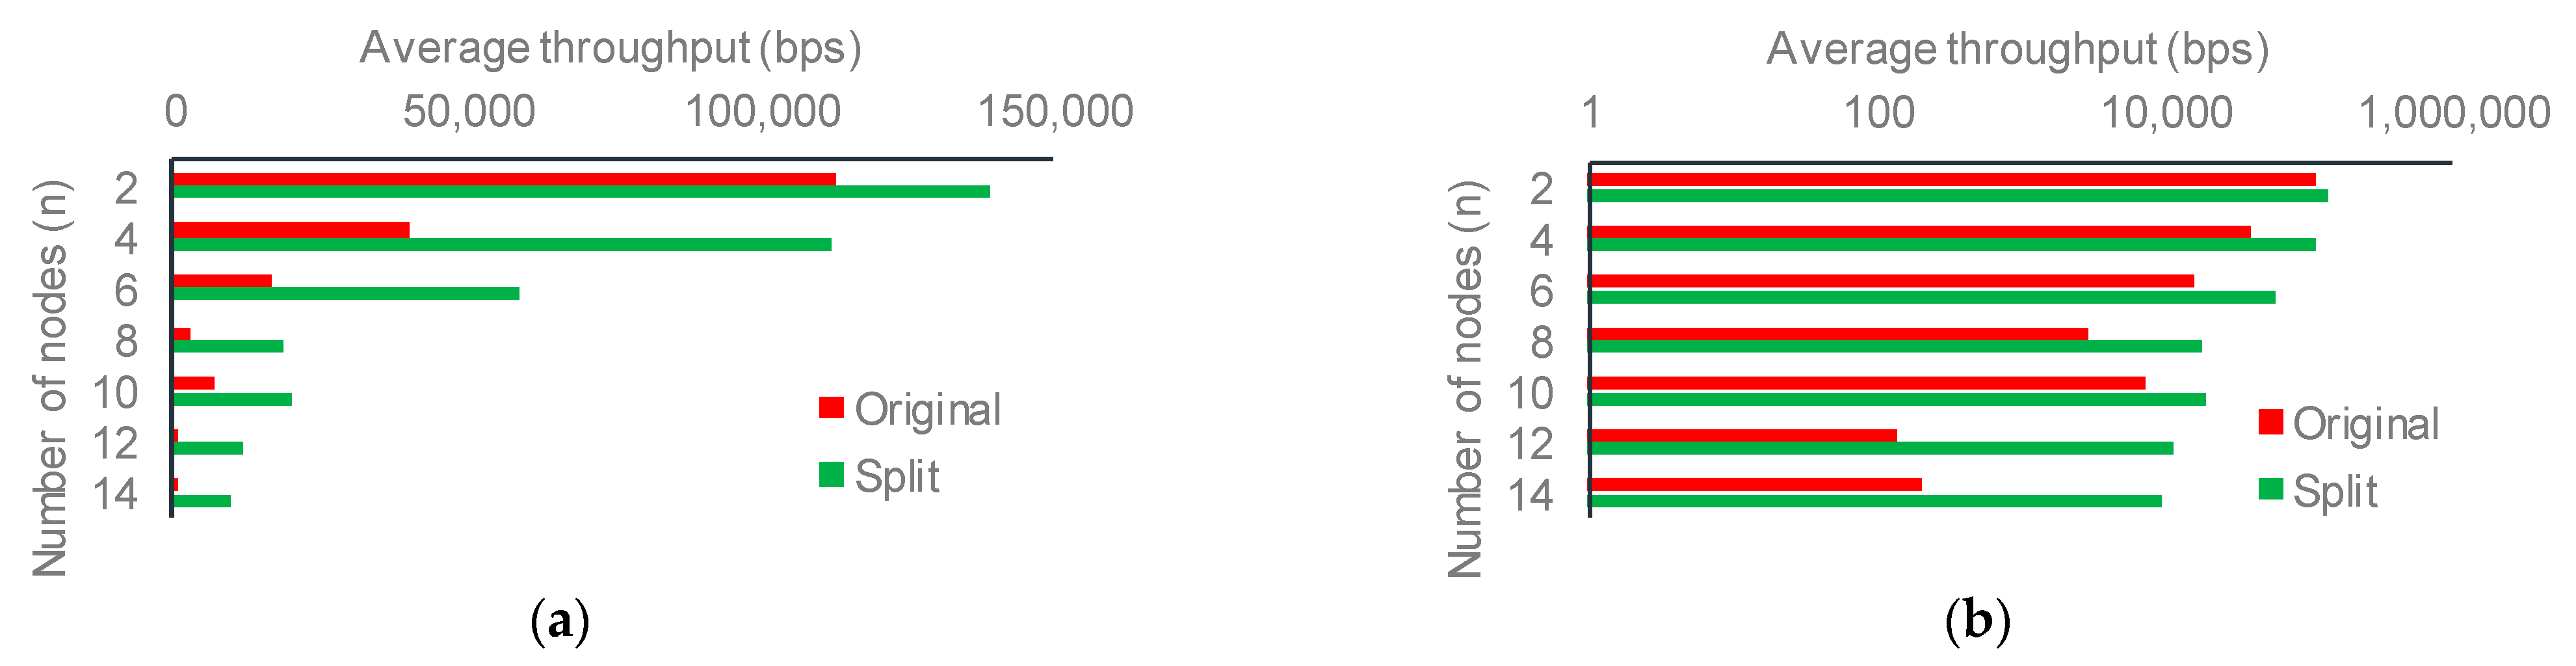
Since throughput is an important factor, to highlight all the differences clearly, it is plotted against Figure 15a on a linear scale and Figure 15b logarithmic scale. The linear scale shows a massive improvement when the number of nodes is low and throughput is maximum. As the number of nodes starts increasing, the average throughput keeps becoming smaller due to the massive number of broadcasts in the network, and more OGM packets are re-transmitted and consume overall bandwidth. The improvement trend as compared to the original hop penalty continues if we start increasing the number of nodes, which may not be clear in Figure 15a, but is very much visible in the logarithmic scale presented in Figure 15b. As mentioned previously, the average improvement by employing the split hop penalty is found to be 21 times that offered by the original scheme.
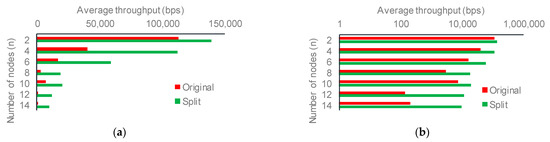
Figure 15.
Comparison of average throughput with (a) linear scale and (b) logarithmic scale.
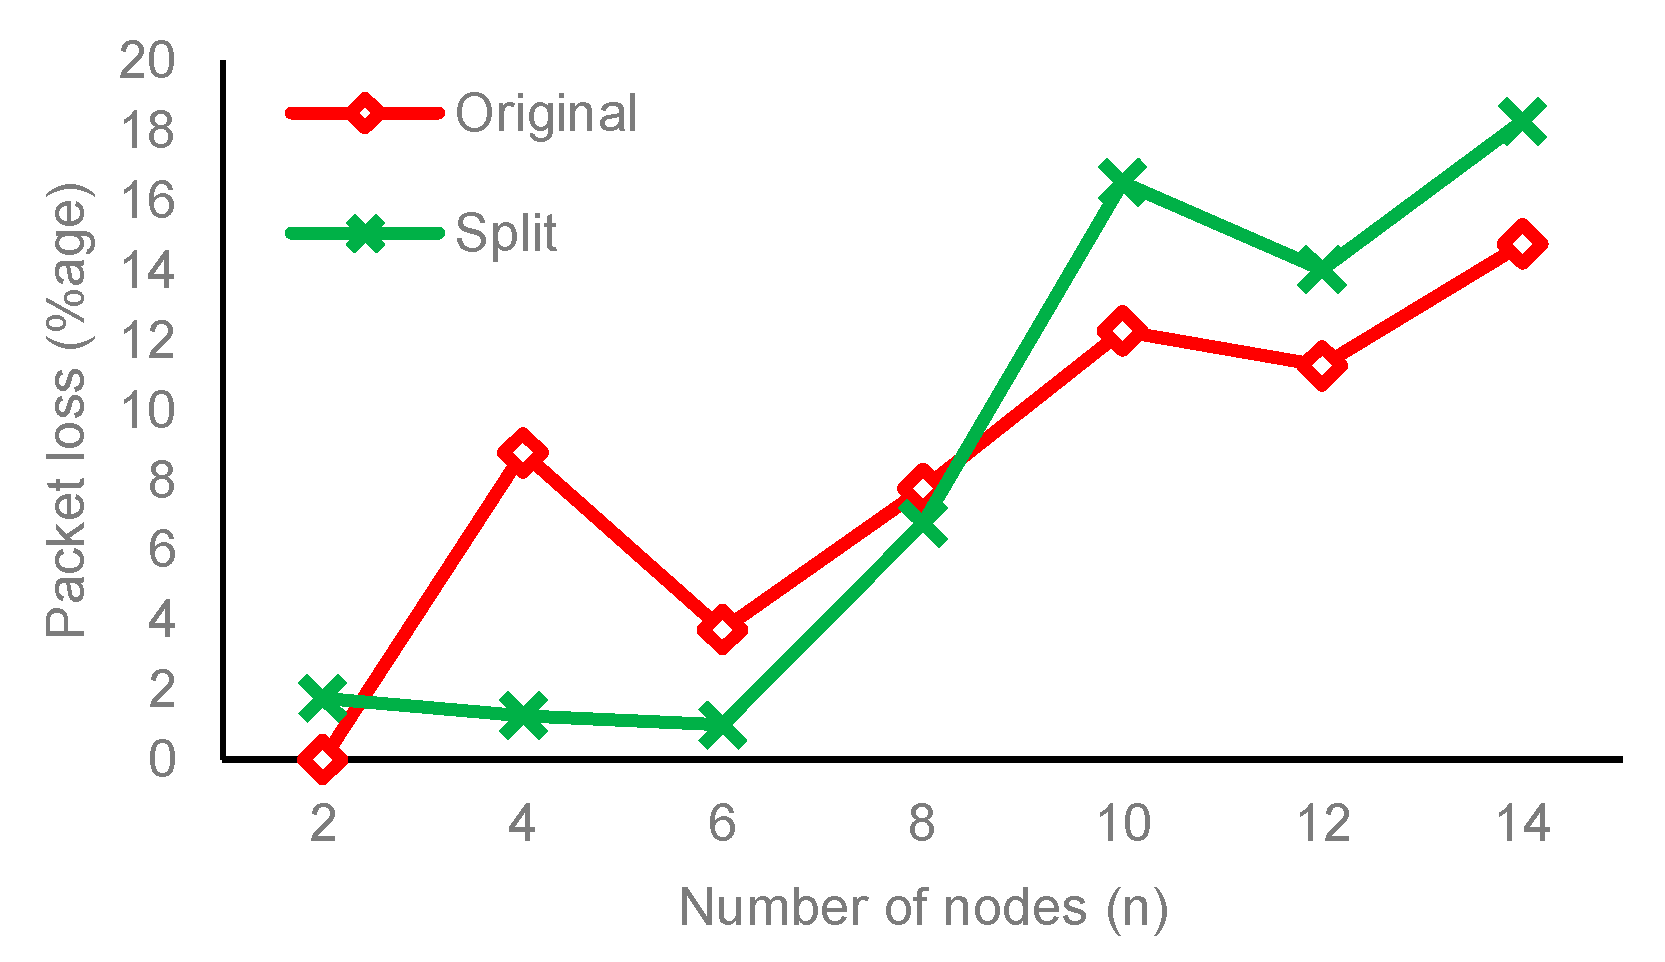
Packet loss percentage as compared with a varying number of nodes is presented in Figure 16. As presented in Section 4.1, the graph presented can be seen as a two-part difference, where split hop penalty provides lesser packet losses as compared to the original, while as the number of nodes increases the performance of split hop penalty drops below the original base-line provided by the default hop penalty. This parameter is considered the only con of the newly proposed scheme; therefore, caution is advised in implementing a split hop penalty on networks with a large number of nodes. However, further investigation might help in this regard.
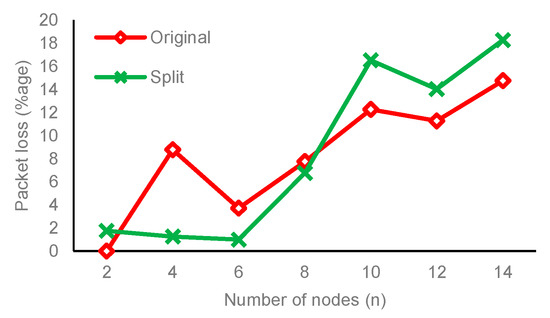
Figure 16.
Comparison of packet loss vs. number of nodes.
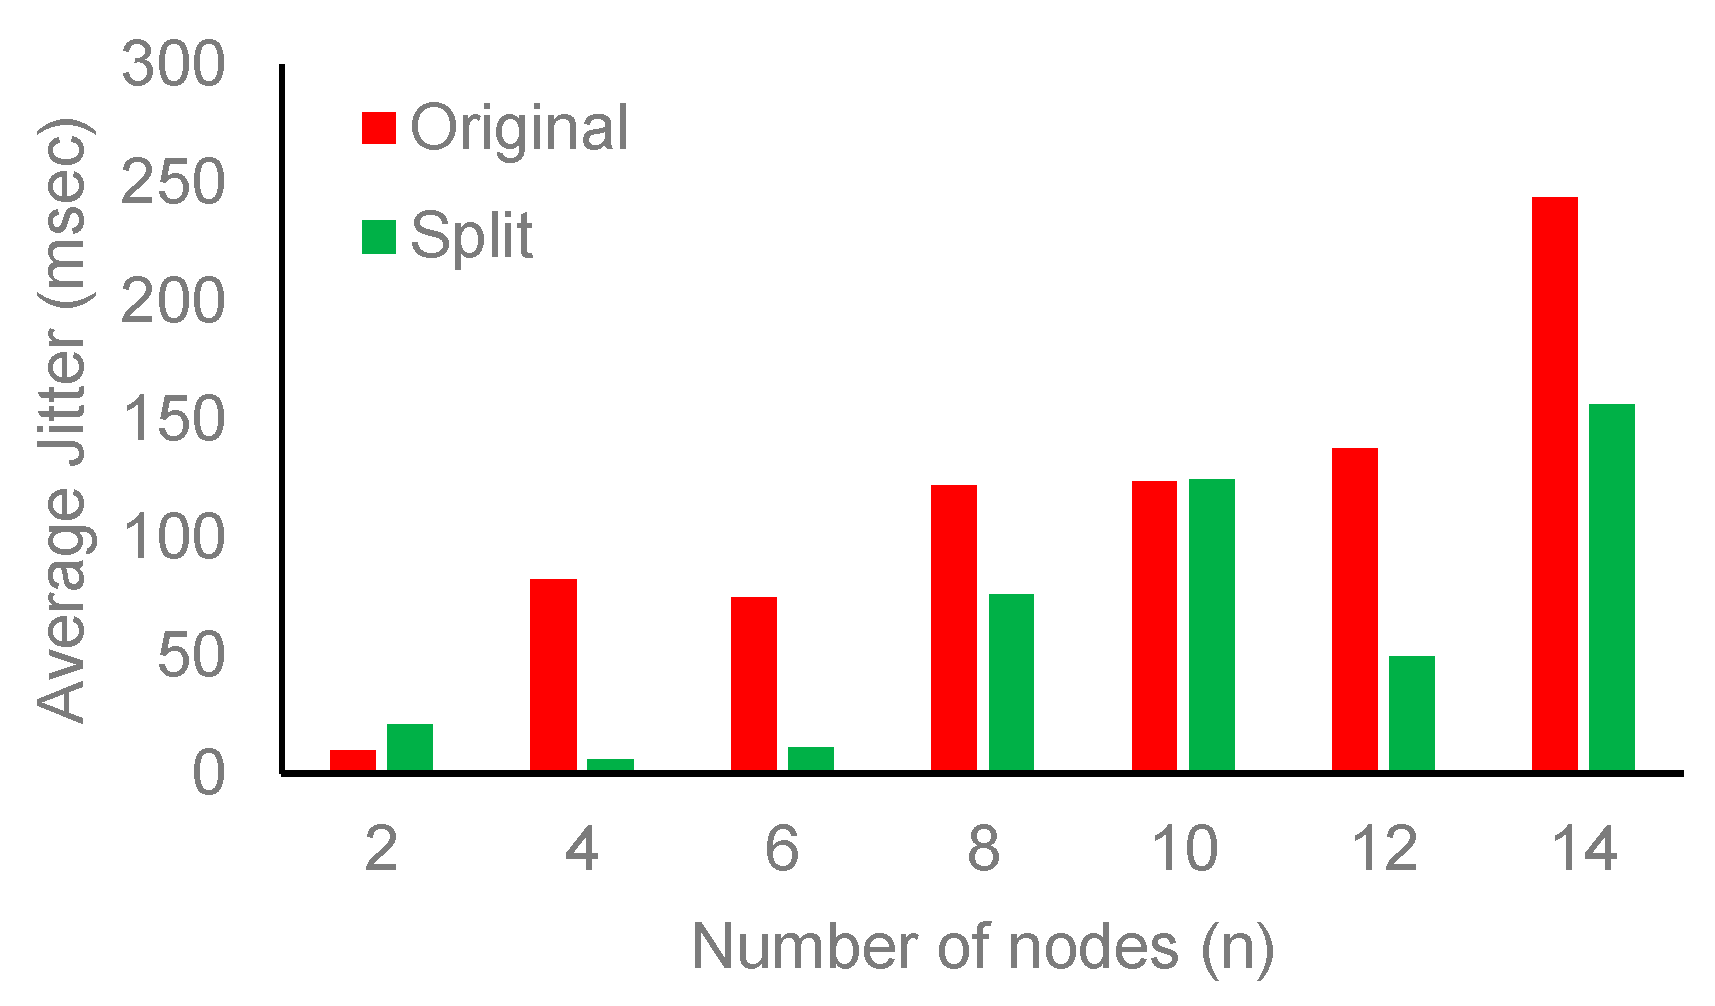
Figure 17 shows the performance improvement in the jitter as plotted with averages over all transmit powers. Most of the time, the jitter is less than the original hop penalty.

Figure 17.
Comparison of average jitter.
The only two instances where the jitter is very slightly higher than the original scheme are where the number of nodes is 2 or 10, which also justifies the higher delays at the same number of nodes in Figure 10. The overall improvement in jitter counting all the number of nodes (where jitter is slightly higher than the original) was found to be 50.1 ms on average, while the highest difference or performance gain was recorded for 14 nodes where the jitter was 87.57 ms less as compared to original hop penalty.
6. Conclusions
Most of the routing protocols for ad hoc networks suffer from low throughput and overhead, especially in large network scenarios where the number of nodes per area is high. BATMAN, a layer-2 routing protocol for ad hoc networks, defines transmission quality as a metric that comprises link quality, path quality, asymmetric link penalty, and hop penalty. The analytical analysis presented in this paper points out that the hop penalty used in BATMAN suffers from TQ metric decrement as the number of hops is increased. Therefore, to balance the heavy impact imposed by the hop penalty, a split hop penalty is proposed to improve the network’s performance, especially delays, throughput, and jitter. The improvement is achieved by splitting the hop penalty into two branches: one where wireless links are utilized and the same radio is used for the reception and transmission of the data packets, and into a wired medium where transmitter and receiver are separated internally. The results presented show an average improvement of 11% in end-to-end delay, increased average throughput by 52%, and a 45% improvement in jitter as compared to the original BATMAN. The packet loss results differ from the original hop penalty, but the overall average is similar, as the new method offers less packet loss when the number of nodes is low, while it increases with the increasing number of nodes. During the experimental tests, we found several duplicate packets of acknowledgment from ICMP received at the transmitter’s end, suggesting that BATMAN is not a loop-free routing protocol and should be investigated in the future. The future work resides in improving the TQ metric of BATMAN as the current method involves receiving echoes of sent packets, which takes more time in determining the link quality.
Author Contributions
Conceptualization: S.T.A.J. and F.Q.; Methodology: S.T.A.J. and I.A.; visualization: S.A., J.Y. and F.Q.; writing—original draft preparation: S.T.A.J. and I.A.; writing—review and editing: S.A. and Z.H.A.; funding acquisition: F.Q. and J.Y. All authors have read and agreed to the published version of the manuscript.
Funding
This paper is supported by Universiti Kebangsaan Malaysia Fundamental Research Grant Scheme Code # FRGS/1/2019/ICT01/UKM/02/1 and Geran Galakan Penyelidik Muda (GGPM) with Scheme Code # GGPM-2021-040. The research project is partially supported by the Ministry of Science and Technology (MoST), Pakistan.
Institutional Review Board Statement
Not applicable.
Data Availability Statement
Not applicable.
Acknowledgments
The authors would also like to thank the respected Editor and Reviewer for their support.
Conflicts of Interest
The authors declare no conflict of interest.
Appendix A. Experimental Data and Frequently Used Notations
Table A1.
End-to-end delay (ms) data for original hop penalty and split hop penalty.
Table A1.
End-to-end delay (ms) data for original hop penalty and split hop penalty.
| Original Hop Penalty | Split Hop Penalty | |||||||||
|---|---|---|---|---|---|---|---|---|---|---|
| Nodes | 0 dBm | 10 dBm | 20 dBm | 30 dBm | Average | 0 dBm | 10 dBm | 20 dBm | 30 dBm | Average |
| 2 | 3.08 | 2.713 | 2.362 | 2.271 | 2.6065 | 4.824 | 4.429 | 2.953 | 2.889 | 3.77375 |
| 4 | 9.166 | 13.3 | 4.067 | 3.289 | 7.4555 | 6.925 | 7.439 | 2.45 | 2.472 | 4.8215 |
| 6 | 12.255 | 10.973 | 8.83 | 4.965 | 9.25575 | 11.083 | 7.284 | 5.351 | 6.336 | 7.5135 |
| 8 | 32.451 | 11.013 | 12.085 | 11.567 | 16.779 | 23.051 | 15.465 | 11.03 | 10.505 | 15.01275 |
| 10 | 24.007 | 14.974 | 20.242 | 10.957 | 17.545 | 21.54 | 20.87 | 19.07 | 18.371 | 19.96275 |
| 12 | 52.882 | 28.833 | 26.794 | 26.235 | 33.686 | 52.331 | 22.962 | 29.407 | 26.36 | 32.765 |
| 14 | 91.921 | 55.618 | 70.127 | 48.75 | 66.604 | 84.867 | 51.644 | 50.4 | 31.3 | 54.55275 |
Table A2.
Throughput (kbps) data for original hop penalty and split hop penalty.
Table A2.
Throughput (kbps) data for original hop penalty and split hop penalty.
| Original Hop Penalty | Split Hop Penalty | |||||||||
|---|---|---|---|---|---|---|---|---|---|---|
| Nodes | 0 dBm | 10 dBm | 20 dBm | 30 dBm | Average | 0 dBm | 10 dBm | 20 dBm | 30 dBm | Average |
| 2 | 10,560 | 213,600 | 320,800 | 355,200 | 112,960 | 853 | 24,720 | 267,200 | 265,600 | 13,9593.3 |
| 4 | 247 | 14,400 | 64,560 | 112,000 | 40,478.25 | 27,200 | 73,680 | 129,600 | 217,600 | 112,020 |
| 6 | 409 | 27,440 | 38,000 | 55,760 | 16,477.75 | 371 | 60,480 | 87,200 | 88,800 | 59,212.75 |
| 8 | 8240 | 15,280 | 15,840 | 17,120 | 2940 | 269 | 16,000 | 27,120 | 32,080 | 18,867.25 |
| 10 | 8240 | 20,320 | 28,480 | 29,280 | 7300 | 891 | 28,960 | 40,000 | 10,240 | 20,022.75 |
| 12 | 226 | 549 | 555 | 704 | 141.25 | 490 | 9520 | 16,000 | 21,280 | 11,822.5 |
| 14 | 358 | 675 | 946 | 923 | 209 | 401 | 8160 | 10,160 | 20,640 | 9840.25 |
Table A3.
Packet loss data for original hop penalty and split hop penalty.
Table A3.
Packet loss data for original hop penalty and split hop penalty.
| Original Hop Penalty | Split Hop Penalty | |||||||||
|---|---|---|---|---|---|---|---|---|---|---|
| Nodes | 0 dBm | 10 dBm | 20 dBm | 30 dBm | Average | 0 dBm | 10 dBm | 20 dBm | 30 dBm | Average |
| 2 | 0 | 0 | 0 | 0 | 0 | 7 | 0 | 0 | 0 | 1.75 |
| 4 | 12 | 9 | 0.014 | 0.0083 | 5.255575 | 3 | 1 | 1 | 0 | 1.25 |
| 6 | 8 | 3.4 | 2 | 1.5 | 3.725 | 4 | 0 | 0 | 0 | 1 |
| 8 | 15 | 7 | 6 | 3 | 7.75 | 18 | 5 | 3 | 1 | 6.75 |
| 10 | 19 | 16 | 12 | 2 | 12.25 | 33 | 16 | 7 | 10 | 16.5 |
| 12 | 19 | 13 | 10 | 3 | 11.25 | 26 | 7 | 8 | 15 | 14 |
| 14 | 37 | 15 | 4 | 3 | 14.75 | 45 | 11 | 12 | 5 | 18.25 |
Table A4.
Jitter (ms) data for original hop penalty and split hop penalty.
Table A4.
Jitter (ms) data for original hop penalty and split hop penalty.
| Original Hop Penalty | Split Hop Penalty | |||||||||
|---|---|---|---|---|---|---|---|---|---|---|
| Nodes | 0 dBm | 10 dBm | 20 dBm | 30 dBm | Average | 0 dBm | 10 dBm | 20 dBm | 30 dBm | Average |
| 2 | 37.382 | 1.37 | 0.846 | 0.223 | 9.95525 | 39.54 | 33.47 | 8.17 | 2.185 | 20.84125 |
| 4 | 288.837 | 32.584 | 3.536 | 5.086 | 82.51075 | 8.471 | 6.219 | 5.25 | 2.642 | 5.6455 |
| 6 | 277.429 | 10.224 | 5.956 | 5.362 | 74.74275 | 27.04 | 9.998 | 3.319 | 3.355 | 10.928 |
| 8 | 336.471 | 41.286 | 57.972 | 52.222 | 121.9878 | 265 | 22.48 | 7.15 | 9.677 | 76.07675 |
| 10 | 280.294 | 37.195 | 103.707 | 74.321 | 123.8793 | 359 | 39.9 | 74.842 | 24.143 | 124.4713 |
| 12 | 276.673 | 142.024 | 51.124 | 80.323 | 137.536 | 130 | 27.7 | 22.064 | 18.08 | 49.461 |
| 14 | 625.815 | 119.25 | 125.921 | 103.531 | 243.6293 | 311 | 109 | 124.42 | 79.812 | 156.058 |
Table A5.
Frequently used notations.
Table A5.
Frequently used notations.
| OGM | Originator message |
| TQ | Transmission quality metric |
| EQ | Echo quality |
| RQ | Receive quality |
| Transmission quality for a specific destination | |
| Transmission quality calculated for own node | |
| Transmission quality received from neighbor | |
| Hop penalty value specified by network designer (default 30) | |
| Maximum transmission quality for 8-bit value (255) | |
| Transmission quality calculated for hop penalty |
References
- Al-Absi, M.A.; Al-Absi, A.A.; Sain, M.; Lee, H. Moving ad hoc networks—A comparative study. Sustainability 2021, 13, 6187. [Google Scholar] [CrossRef]
- Abbas, T.; Qamar, F.; Ahmed, I.; Dimyati, K.; Majed, M.B. Propagation channel characterization for 28 and 73 GHz millimeter-wave 5G frequency band. In Proceedings of the 2017 IEEE 15th student conference on research and development (SCOReD), Wilayah Persekutuan Putrajaya, Malaysia, 13–14 December 2017; pp. 297–302. [Google Scholar]
- Ibrahim, M.Z.; Hassan, R. The implementation of internet of things using test bed in the UKMnet environment. Asia Pac. J. Inf. Technol. Multimed 2019, 8, 1–17. [Google Scholar] [CrossRef]
- Hassan, R.; Qamar, F.; Hasan, M.; Aman, A.; Ahmed, A. Internet of Things and its applications: A comprehensive survey. Symmetry 2020, 12, 1674. [Google Scholar] [CrossRef]
- Qamar, F.; Hindia, M.N.; Abbas, T.; Dimyati, K.B.; Amiri, I.S. Investigation of QoS performance evaluation over 5G network for indoor environment at millimeter wave bands. Int. J. Electron. Telecommun. 2019, 65, 95–101. [Google Scholar]
- Malathy, S.; Jayarajan, P.; Ojukwu, H.; Qamar, F.; Hindia, M.; Dimyati, K.; Noordin, K.A.; Amiri, I.S. A review on energy management issues for future 5G and beyond network. Wirel. Netw. 2021, 27, 2691–2718. [Google Scholar] [CrossRef]
- Bocu, R.; Iavich, M.; Tabirca, S. A real-time intrusion detection system for software defined 5G networks. In Proceedings of the International Conference on Advanced Information Networking and Applications, Toronto, ON, Canada, 12–14 May 2021; pp. 436–446. [Google Scholar]
- Quy, V.K.; Ban, N.T.; Nam, V.H.; Tuan, D.M.; Han, N.D. Survey of Recent Routing Metrics and Protocols for Mobile Ad-Hoc Networks. J. Commun. 2019, 14, 110–120. [Google Scholar] [CrossRef]
- Muniyandi, R.C.; Qamar, F.; Jasim, A.N. Genetic optimized location aided routing protocol for VANET based on rectangular estimation of position. Appl. Sci. 2020, 10, 5759. [Google Scholar] [CrossRef]
- Talukdar, M.I.; Hassan, R.; Hossen, M.S.; Ahmad, K.; Qamar, F.; Ahmed, A.S. Performance improvements of AODV by black hole attack detection using IDS and digital signature. Wirel. Commun. Mob. Comput. 2021, 2021, 6693316. [Google Scholar] [CrossRef]
- Jafri, S.T.A.; Ahmed, I.; Ali, S. Queue-Buffer Optimization Based on Aggressive Random Early Detection in Massive NB-IoT MANET for 5G Applications. Electronics 2022, 11, 2955. [Google Scholar] [CrossRef]
- Sadeq, A.S.; Hassan, R.; Aman, A.H.M.; Sallehudin, H.; Allehaibi, K.; Albogami, N.; Prabuwono, A.S. MAC protocol with grouping awareness GMAC for large scale Internet-of-Things network. PeerJ Comput. Sci. 2021, 7, e733. [Google Scholar] [CrossRef]
- Tilwari, V.; Bani-Bakr, A.; Qamar, F.; Hindia, M.N.; Jayakody, D.N.K.; Hassan, R. Mobility and queue length aware routing approach for network stability and load balancing in MANET. In Proceedings of the 2021 International Conference on Electrical Engineering and Informatics (ICEEI), Kuala Terengganu, Malaysia, 12–13 October 2021; pp. 1–5. [Google Scholar]
- Kapur, R.K.; Khatri, S.K. Secure data transfer in MANET using symmetric and asymmetric cryptography. 4th International Conference on Reliability, Infocom Technologies and Optimization (ICRITO)(Trends and Future Directions) IEEE, Osaka, Japan, 27–30 October 2015; pp. 1–5. [Google Scholar]
- Neumann, A.; Aichele, C.; Lindner, M.; Wunderlich, S. Better approach to mobile ad-hoc networking (BATMAN). IETF Draft 2008, 1–24. [Google Scholar]
- Zheng, Z.; Yong, T.; Li, J.; Wen, Z. Simulation Research of UAANET Based on BATMAN-ADV Routing Protocol. In Proceedings of the 2022 IEEE International Conference on Unmanned Systems (ICUS), Guangzhou, China, 28–30 October 2022; pp. 232–236. [Google Scholar]
- Lindner, S.W.M. Open-Mesh, BATMAN Official Homepage. Available online: https://www.open-mesh.org (accessed on 1 December 2022).
- Liu, L.; Liu, J.; Qian, H.; Zhu, J. Performance evaluation of BATMAN-Adv wireless mesh network routing algorithms. In Proceedings of the 2018 5th IEEE International Conference on Cyber Security and Cloud Computing (CSCloud)/2018 4th IEEE International Conference on Edge Computing and Scalable Cloud (EdgeCom), Shanghai, China, 22–24 June 2018; pp. 122–127. [Google Scholar]
- Sanchez-Iborra, R.; Cano, M.-D.; Garcia-Haro, J. Performance evaluation of BATMAN routing protocol for VoIP services: A QoE perspective. IEEE Trans. Wirel. Commun. 2014, 13, 4947–4958. [Google Scholar] [CrossRef]
- Abbas, T.; Qamar, F.; Hindia, M.N.; Hassan, R.; Ahmed, I.; Aslam, M.I. Performance analysis of ad hoc on-demand distance vector routing protocol for MANET. In Proceedings of the 2020 IEEE Student Conference on Research and Development (SCOReD), Batu Pahat, Malaysia, 27–29 September 2020; pp. 194–199. [Google Scholar]
- Chache, F.M.; Maxon, S.; Narayanan, R.M.; Bharadwaj, R. Distributed network communication using BATMAN algorithm over LoRa. In Proceedings of the Radar Sensor Technology XXV, Online, 12–17 April 2021; pp. 47–55. [Google Scholar]
- Powell, N.H., III. BATSEN: Modifying the BATMAN Routing Protocol for Wireless Sensor Networks. Masters’ Thesis, Rochester Institute of Technology, New York, NY, USA, 2018. [Google Scholar]
- Al Mojamed, M. Integrating mobile ad hoc networks with the internet based on OLSR. Wirel. Commun. Mob. Comput. 2020, 2020, 8810761. [Google Scholar] [CrossRef]
- Kiran, K.; Kaushik, N.; Sharath, S.; Shenoy, P.D.; Venugopal, K.; Prabhu, V.T. Experimental evaluation of BATMAN and BATMAN-Adv routing protocols in a mobile testbed. In Proceedings of the TENCON 2018–2018 IEEE Region 10 Conference, Jeju, Republic of Korea, 28–31 October 2018; pp. 1538–1543. [Google Scholar]
- Guillen-Perez, A.; Montoya, A.-M.; Sanchez-Aarnoutse, J.-C.; Cano, M.-D. A comparative performance evaluation of routing protocols for flying Ad-Hoc networks in real conditions. Appl. Sci. 2021, 11, 4363. [Google Scholar] [CrossRef]
- Sanchez-Iborra, R.; Cano, M.-D. JOKER: A novel opportunistic routing protocol. IEEE J. Sel. Areas Commun. 2016, 34, 1690–1703. [Google Scholar] [CrossRef]
- Sliwa, B.; Behnke, D.; Ide, C.; Wietfeld, C. BAT Mobile: Leveraging mobility control knowledge for efficient routing in mobile robotic networks. In Proceedings of the 2016 IEEE Globecom Workshops (GC Wkshps), Washington, DC, USA, 4–8 December 2016; pp. 1–6. [Google Scholar]
- Cigno, R.; Furlan, D. Improving BATMAN Routing Stability and Performance. Ph.D. Thesis, University of Trento, Trento, Italy, 2011. [Google Scholar]
- Raffelsberger, C.; Hellwagner, H. A hybrid MANET-DTN routing scheme for emergency response scenarios. In Proceedings of the 2013 IEEE International Conference on Pervasive Computing and Communications Workshops (PERCOM Workshops), San Diego, CA, USA, 18–22 March 2013; pp. 505–510. [Google Scholar]
- Delosieres, L.; Nadjm-Tehrani, S. Batman store-and-forward: The best of the two worlds. In Proceedings of the 2012 IEEE International Conference on Pervasive Computing and Communications Workshops, Lugano, Switzerland, 19–23 March 2012; pp. 721–727. [Google Scholar]
- Davoli, L.; Cilfone, A.; Belli, L.; Ferrari, G. Design and experimental performance analysis of a BATMAN-based double Wi-Fi interface mesh network. Future Gener. Comput. Syst. 2019, 92, 593–603. [Google Scholar] [CrossRef]
- Abdali, T.-A.N.; Hassan, R.; Muniyandi, R.C.; Mohd Aman, A.H.; Nguyen, Q.N.; Al-Khaleefa, A.S. Optimized particle swarm optimization algorithm for the realization of an enhanced energy-aware location-aided routing protocol in MANET. Information 2020, 11, 529. [Google Scholar] [CrossRef]
- Gehreke, L.; Kientopf, K.; Güneş, M. BATMAN in the IoT. In Proceedings of the NOMS 2022–2022 IEEE/IFIP Network Operations and Management Symposium, Budapest, Hungary, 25–29 April 2022; pp. 1–6. [Google Scholar]
- Quartulli, A.; Lo Cigno, R. Client Announcement and Fast Roaming in a Layer-2 Mesh Network; Technical Report # DISI-11-472 Version 1; Universitá di trento: Trento, Italy, 2011. [Google Scholar]
- Jun, T.; Julien, C. Delay analysis for symmetric nodes in mobile ad hoc networks. 4th ACM Workshop on Performance Monitoring and Measurement of HeterogeneousWireless andWired Networks, Canary Islands, Spain, 26 October 2009; pp. 191–200. [Google Scholar]
- Tipparaju, V.V.; Mallires, K.R.; Wang, D.; Tsow, F.; Xian, X. Mitigation of Data Packet Loss in Bluetooth Low Energy-Based Wearable Healthcare Ecosystem. Biosensors 2021, 11, 350. [Google Scholar] [CrossRef] [PubMed]


Disclaimer/Publisher’s Note: The statements, opinions and data contained in all publications are solely those of the individual author(s) and contributor(s) and not of MDPI and/or the editor(s). MDPI and/or the editor(s) disclaim responsibility for any injury to people or property resulting from any ideas, methods, instructions or products referred to in the content. |
© 2023 by the authors. Licensee MDPI, Basel, Switzerland. This article is an open access article distributed under the terms and conditions of the Creative Commons Attribution (CC BY) license (https://creativecommons.org/licenses/by/4.0/).