
Evaluation of Photocatalytic Activity and Electrochemical Properties of Hematite Nanoparticles

 , , , and
Abstract
:1. Introduction
2. Experimental Procedure
2.1. Materials
2.2. Synthesis of α-Fe2O3 Nanoparticles
2.3. Study of Photocatalytic Activity
2.4. Study of Electrochemical Activity
2.5. Characterization
3. Results and Discussion
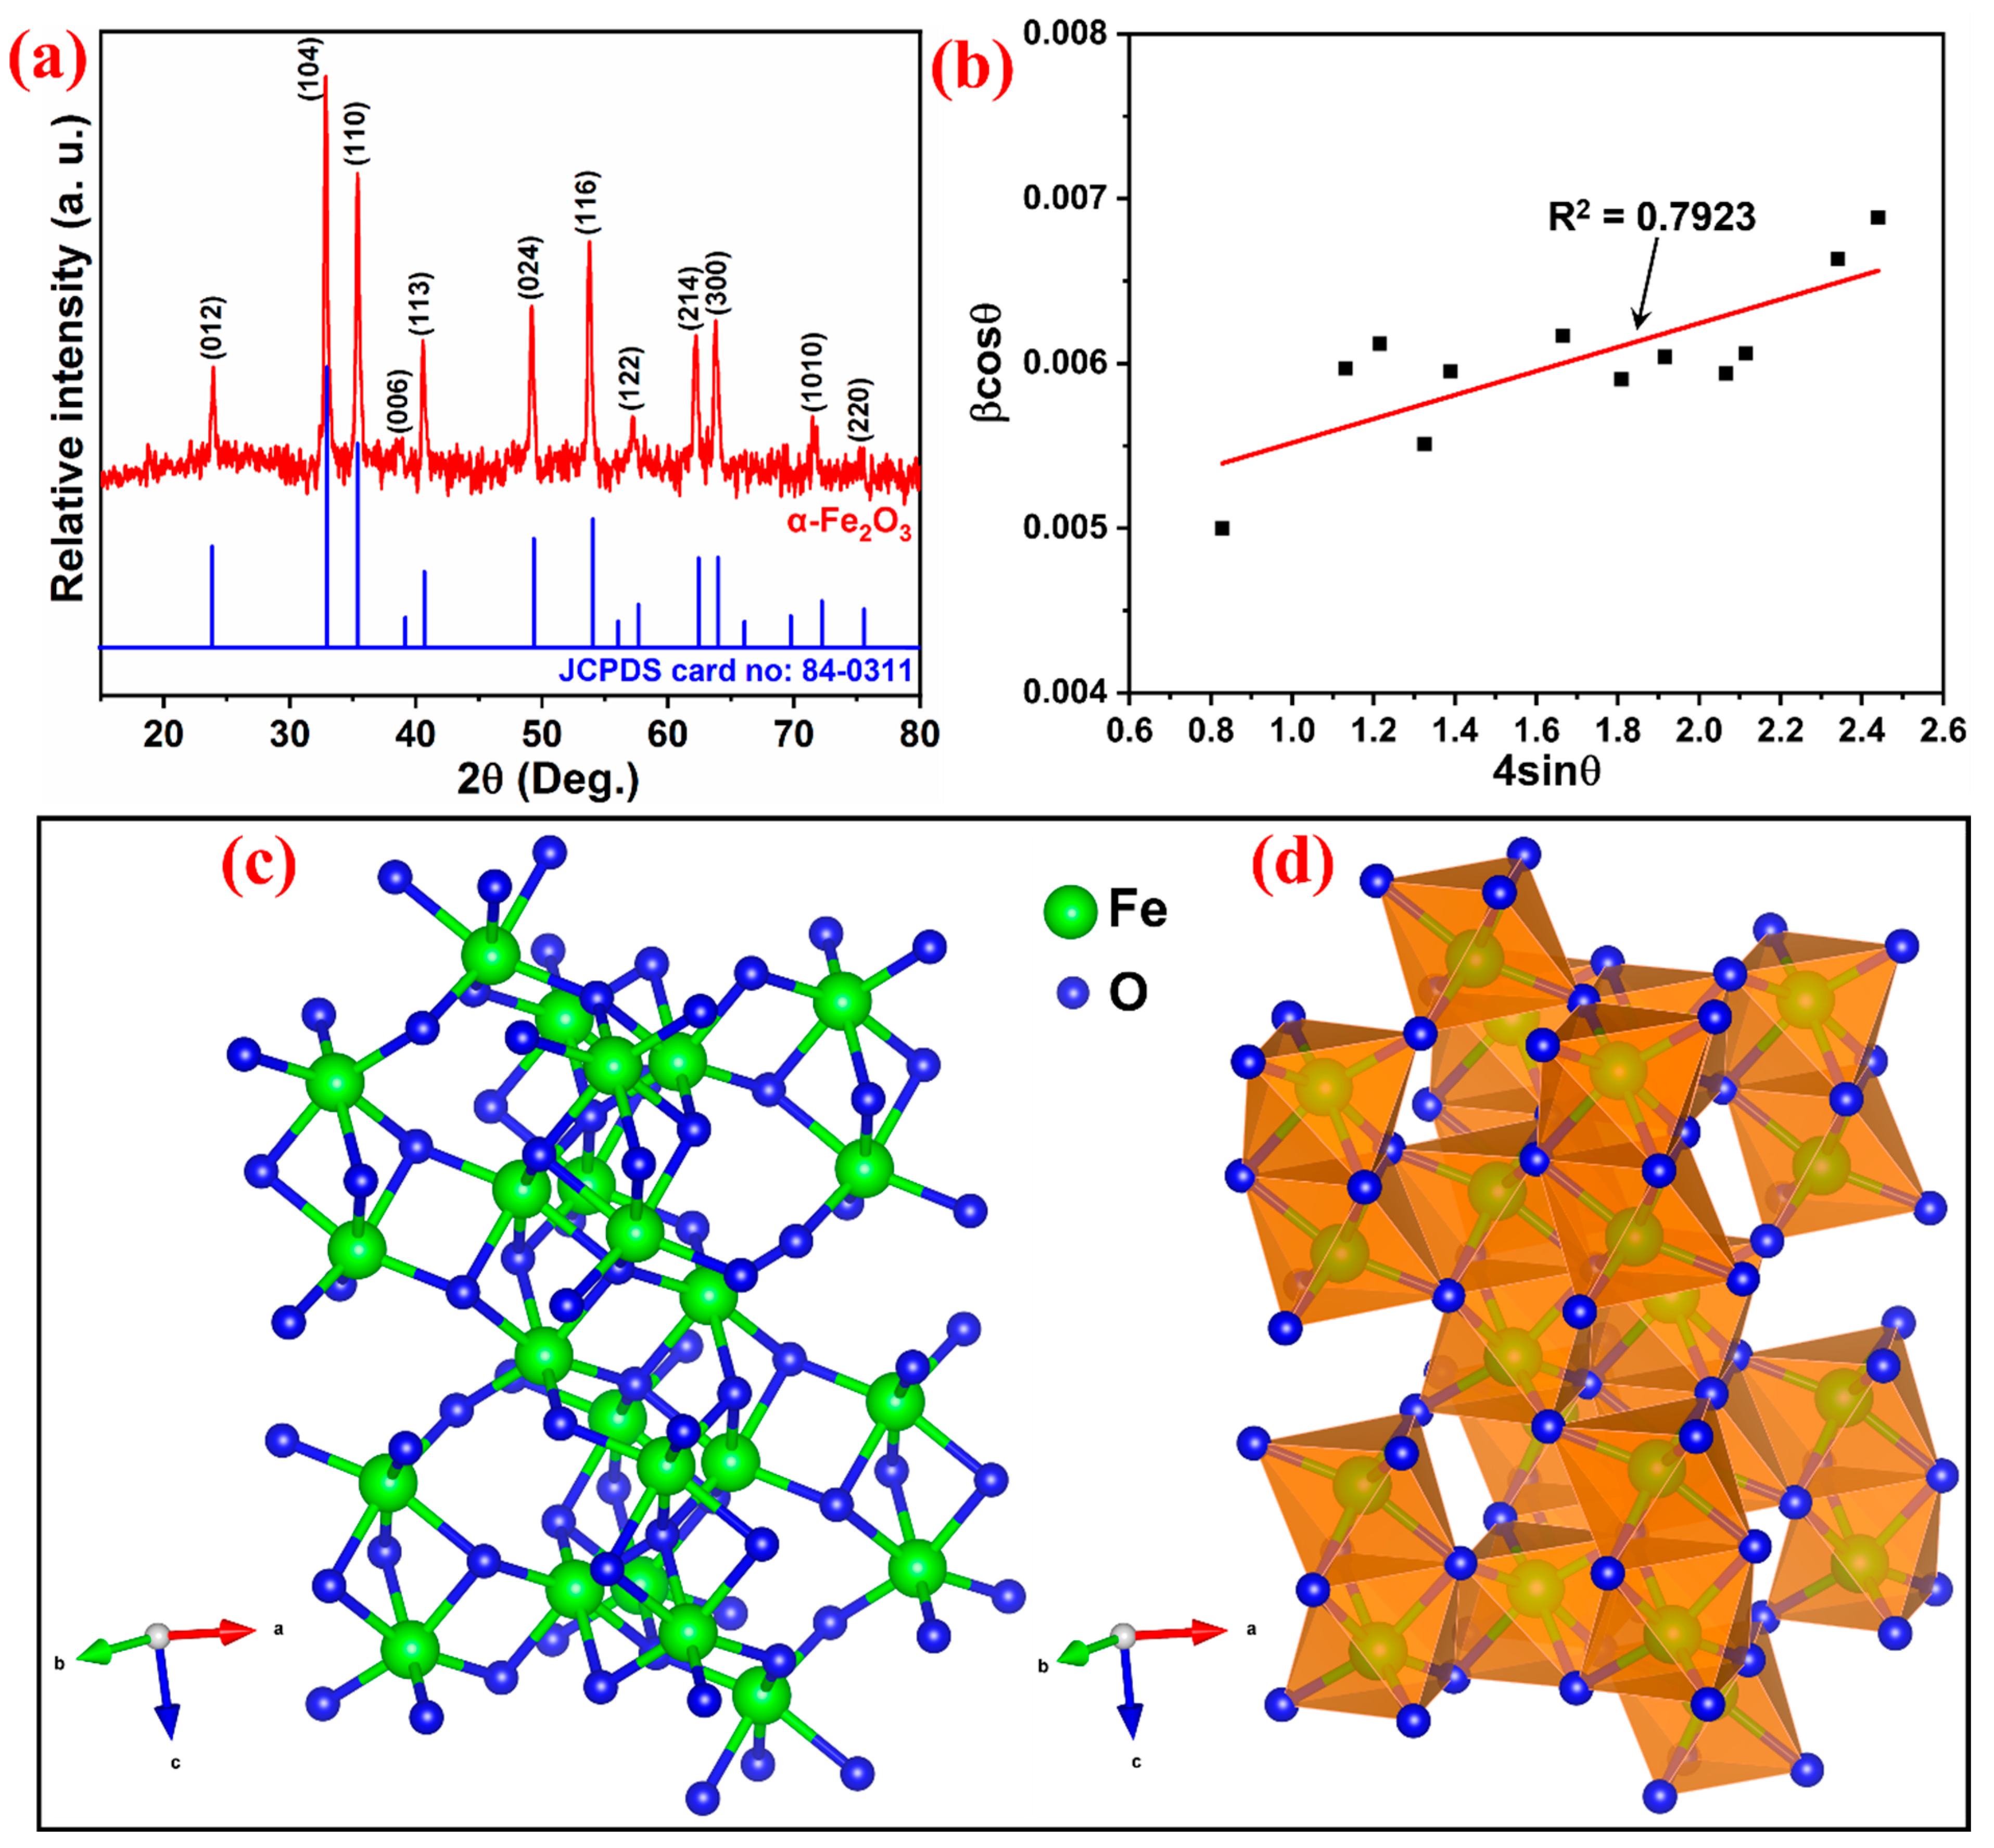
3.1. Structural Analysis
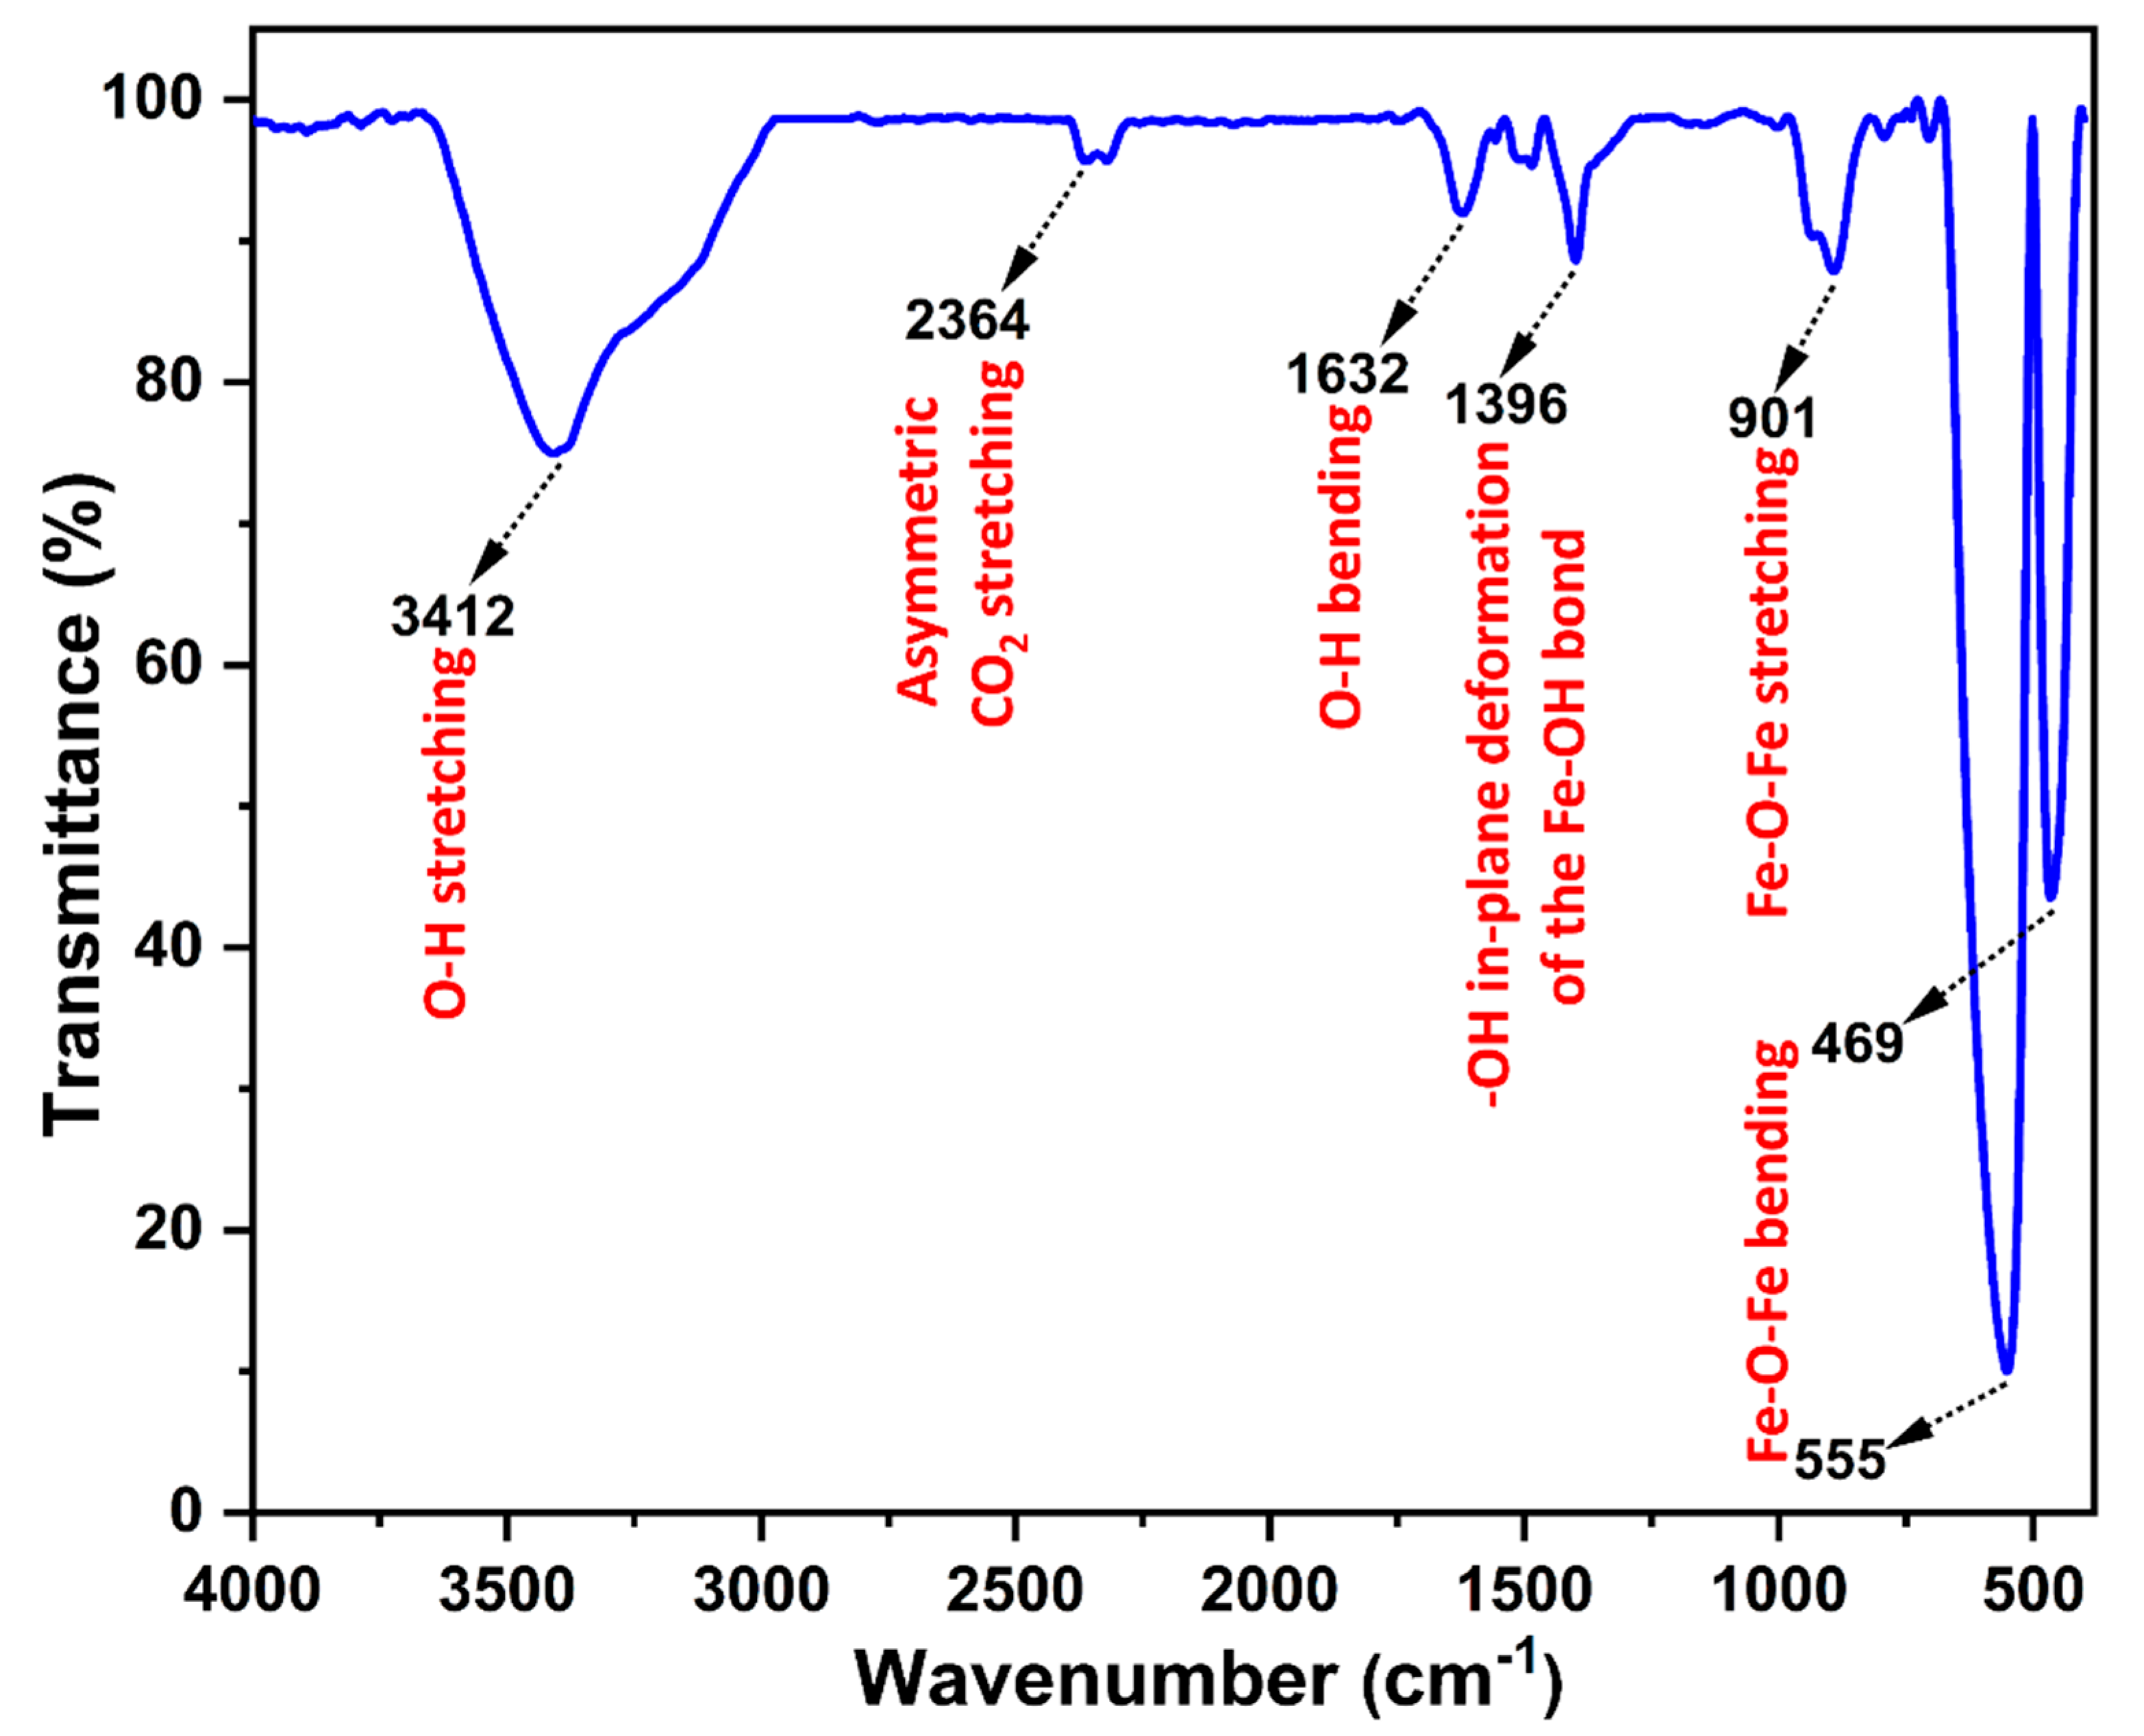
3.2. FT-IR Analysis
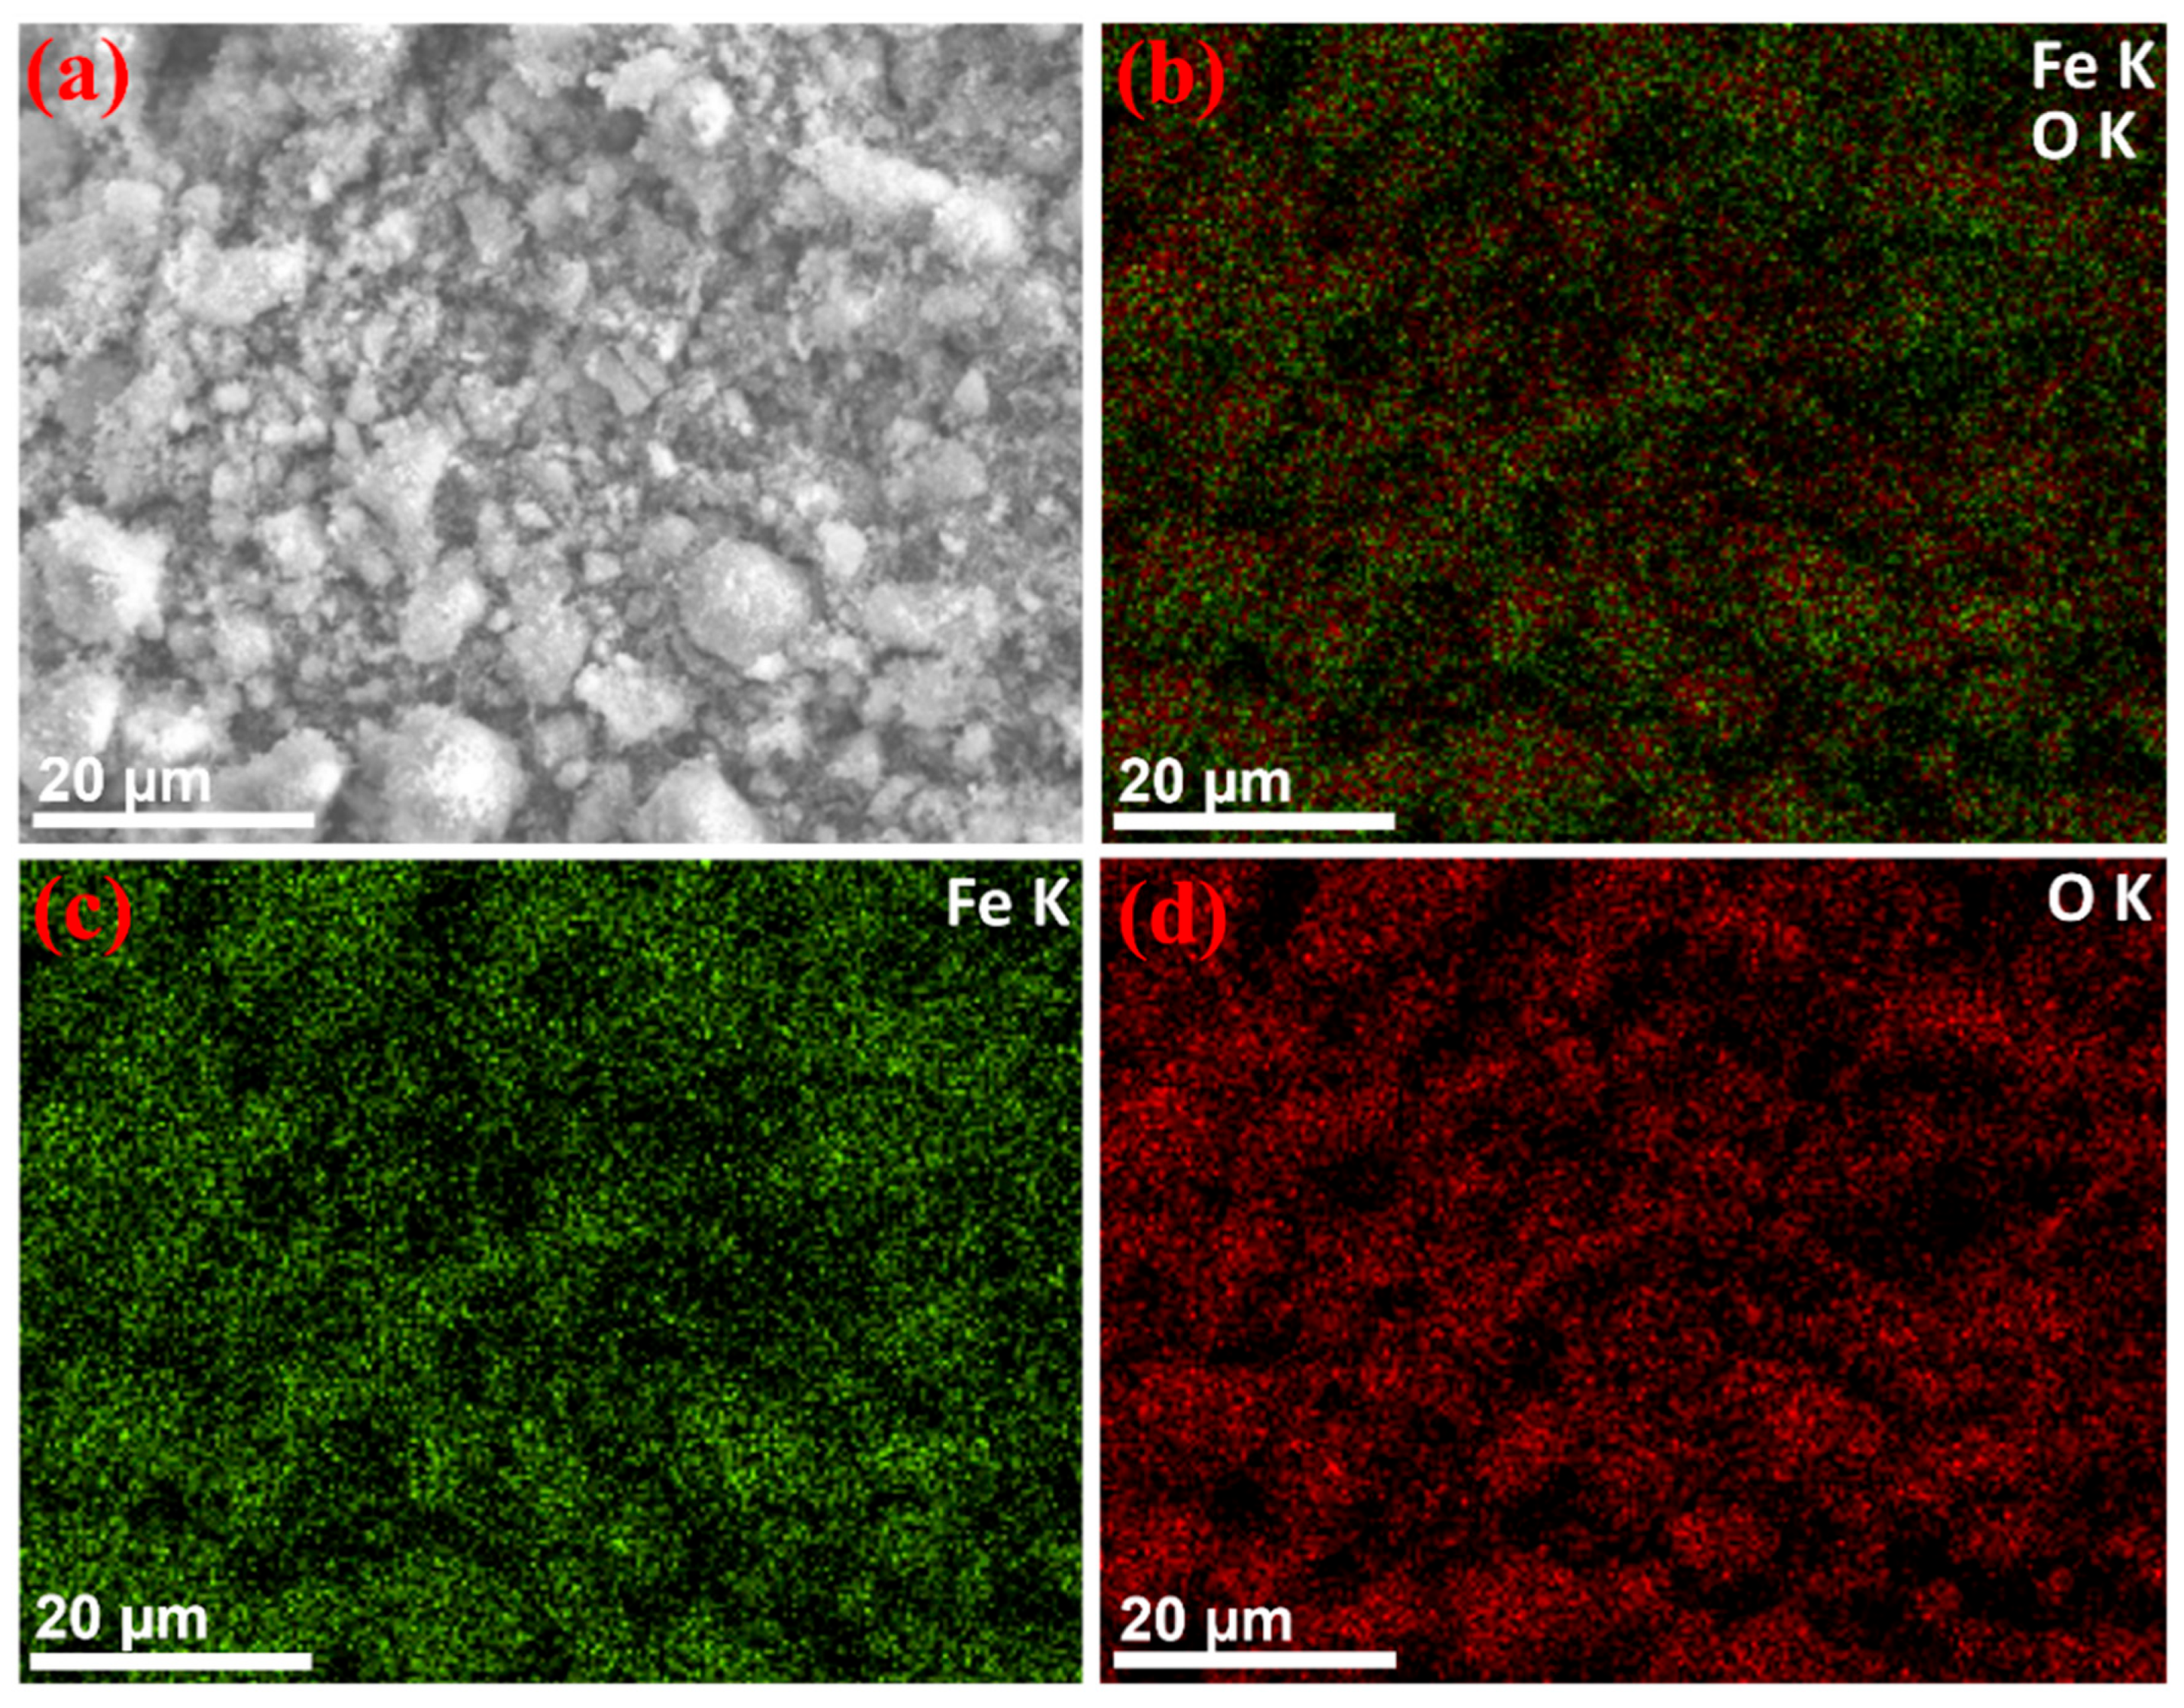
3.3. Morphology
3.4. Dynamic Light Scattering (DLS)
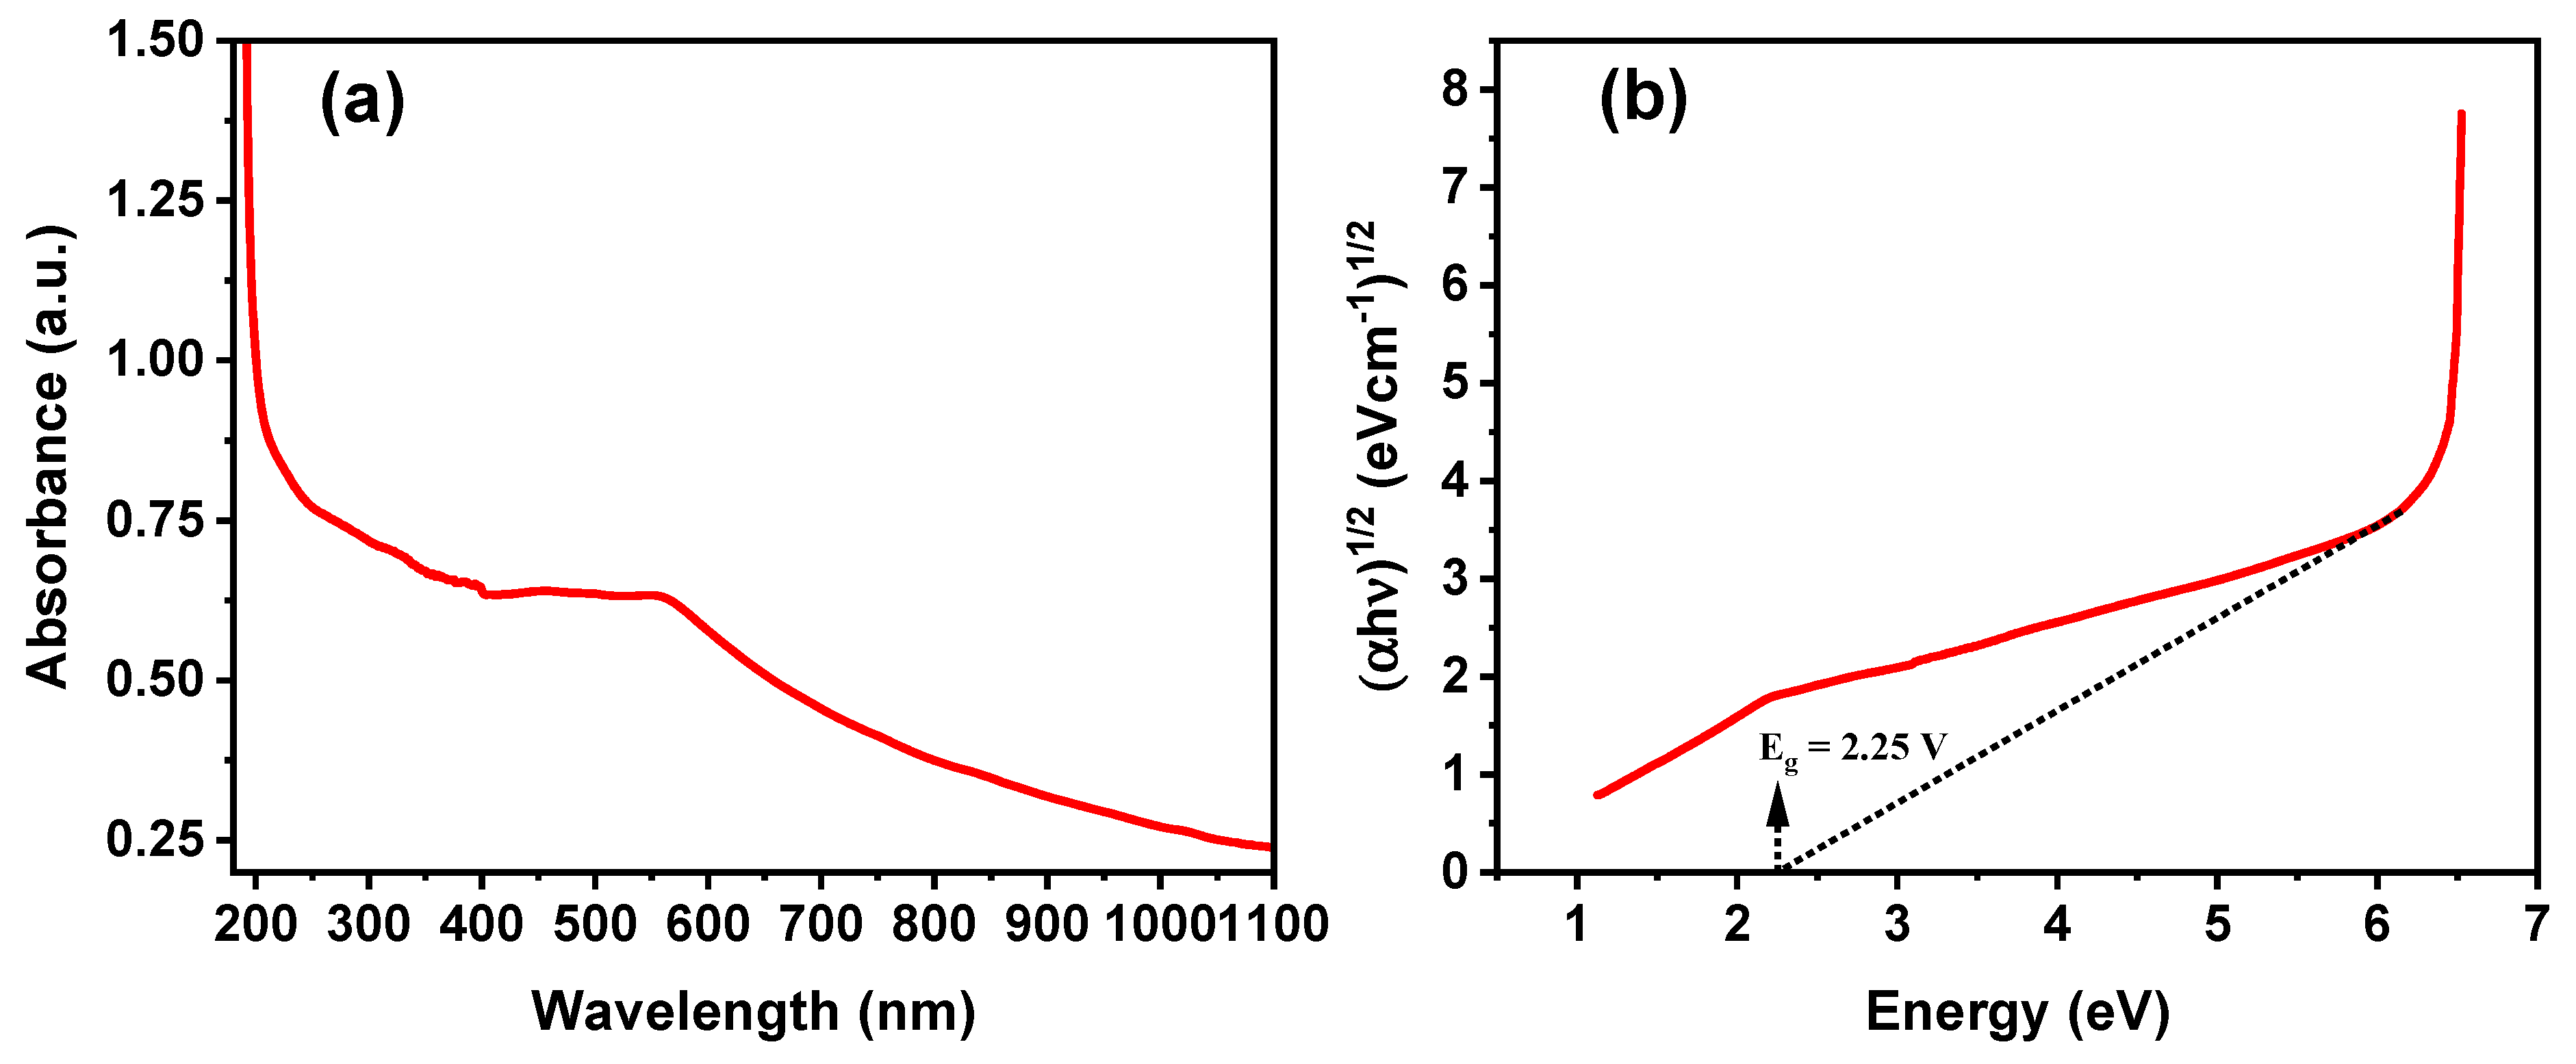
3.5. Optical Properties
3.6. Electrochemical Property Study
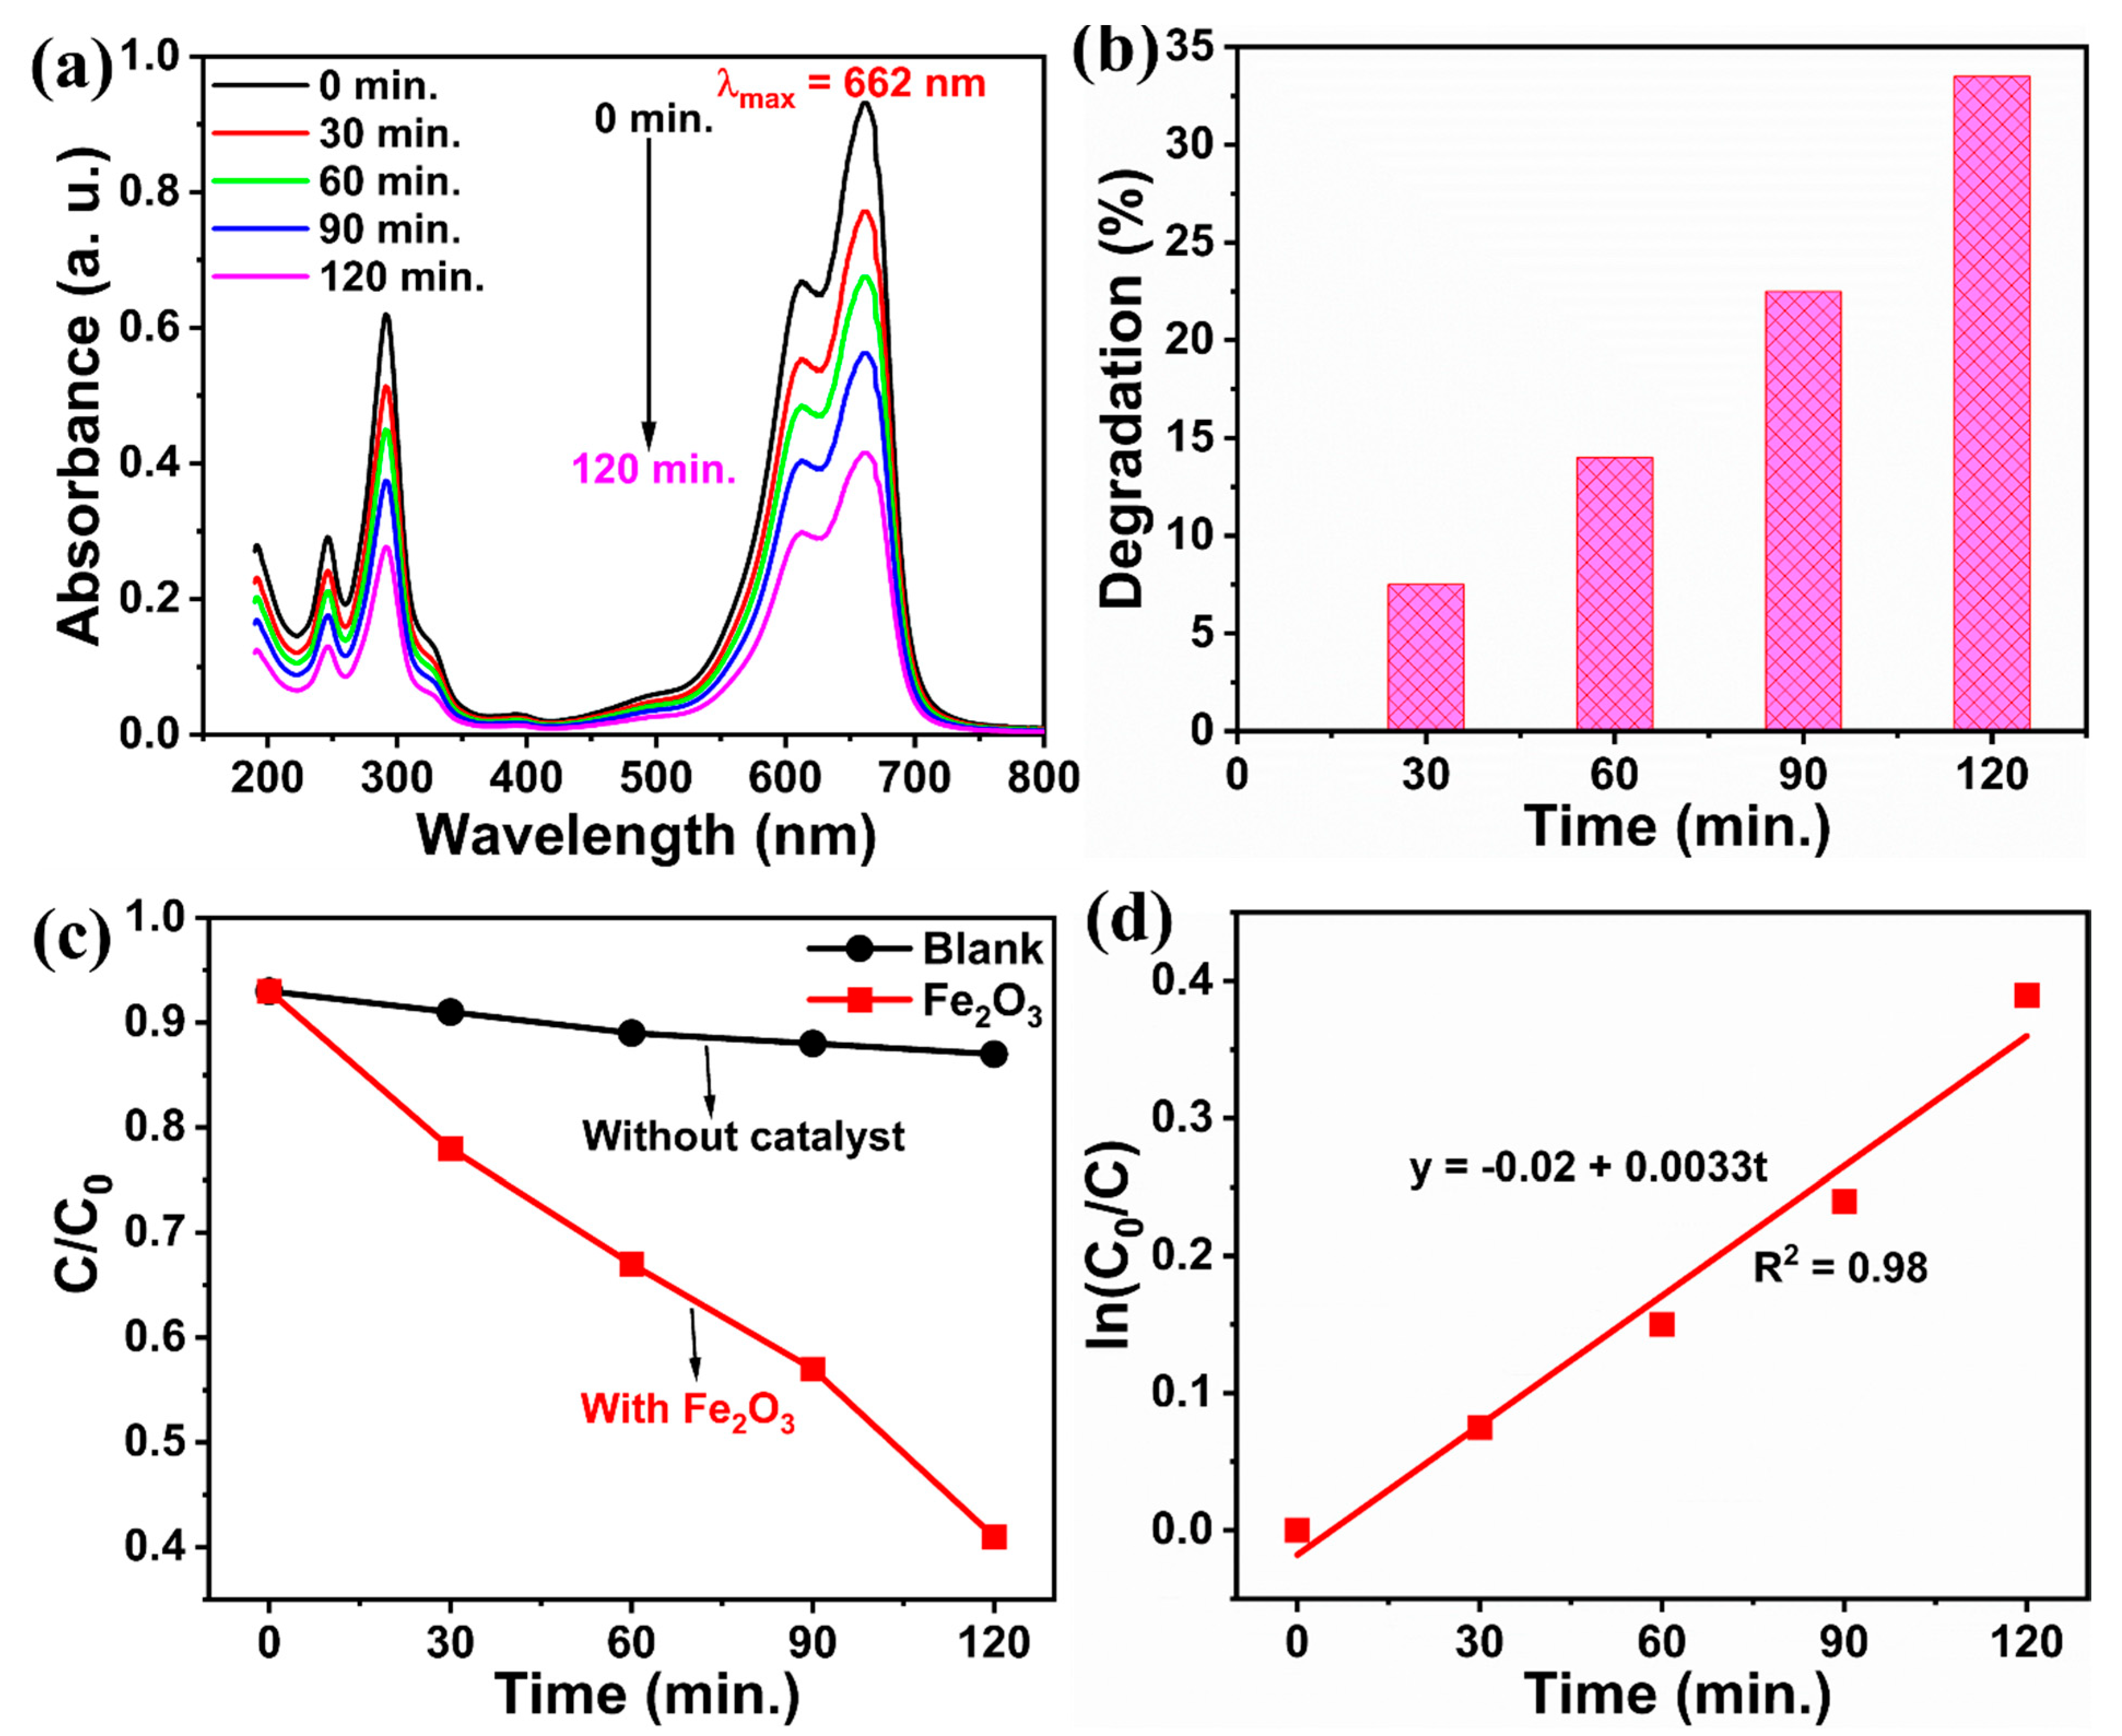
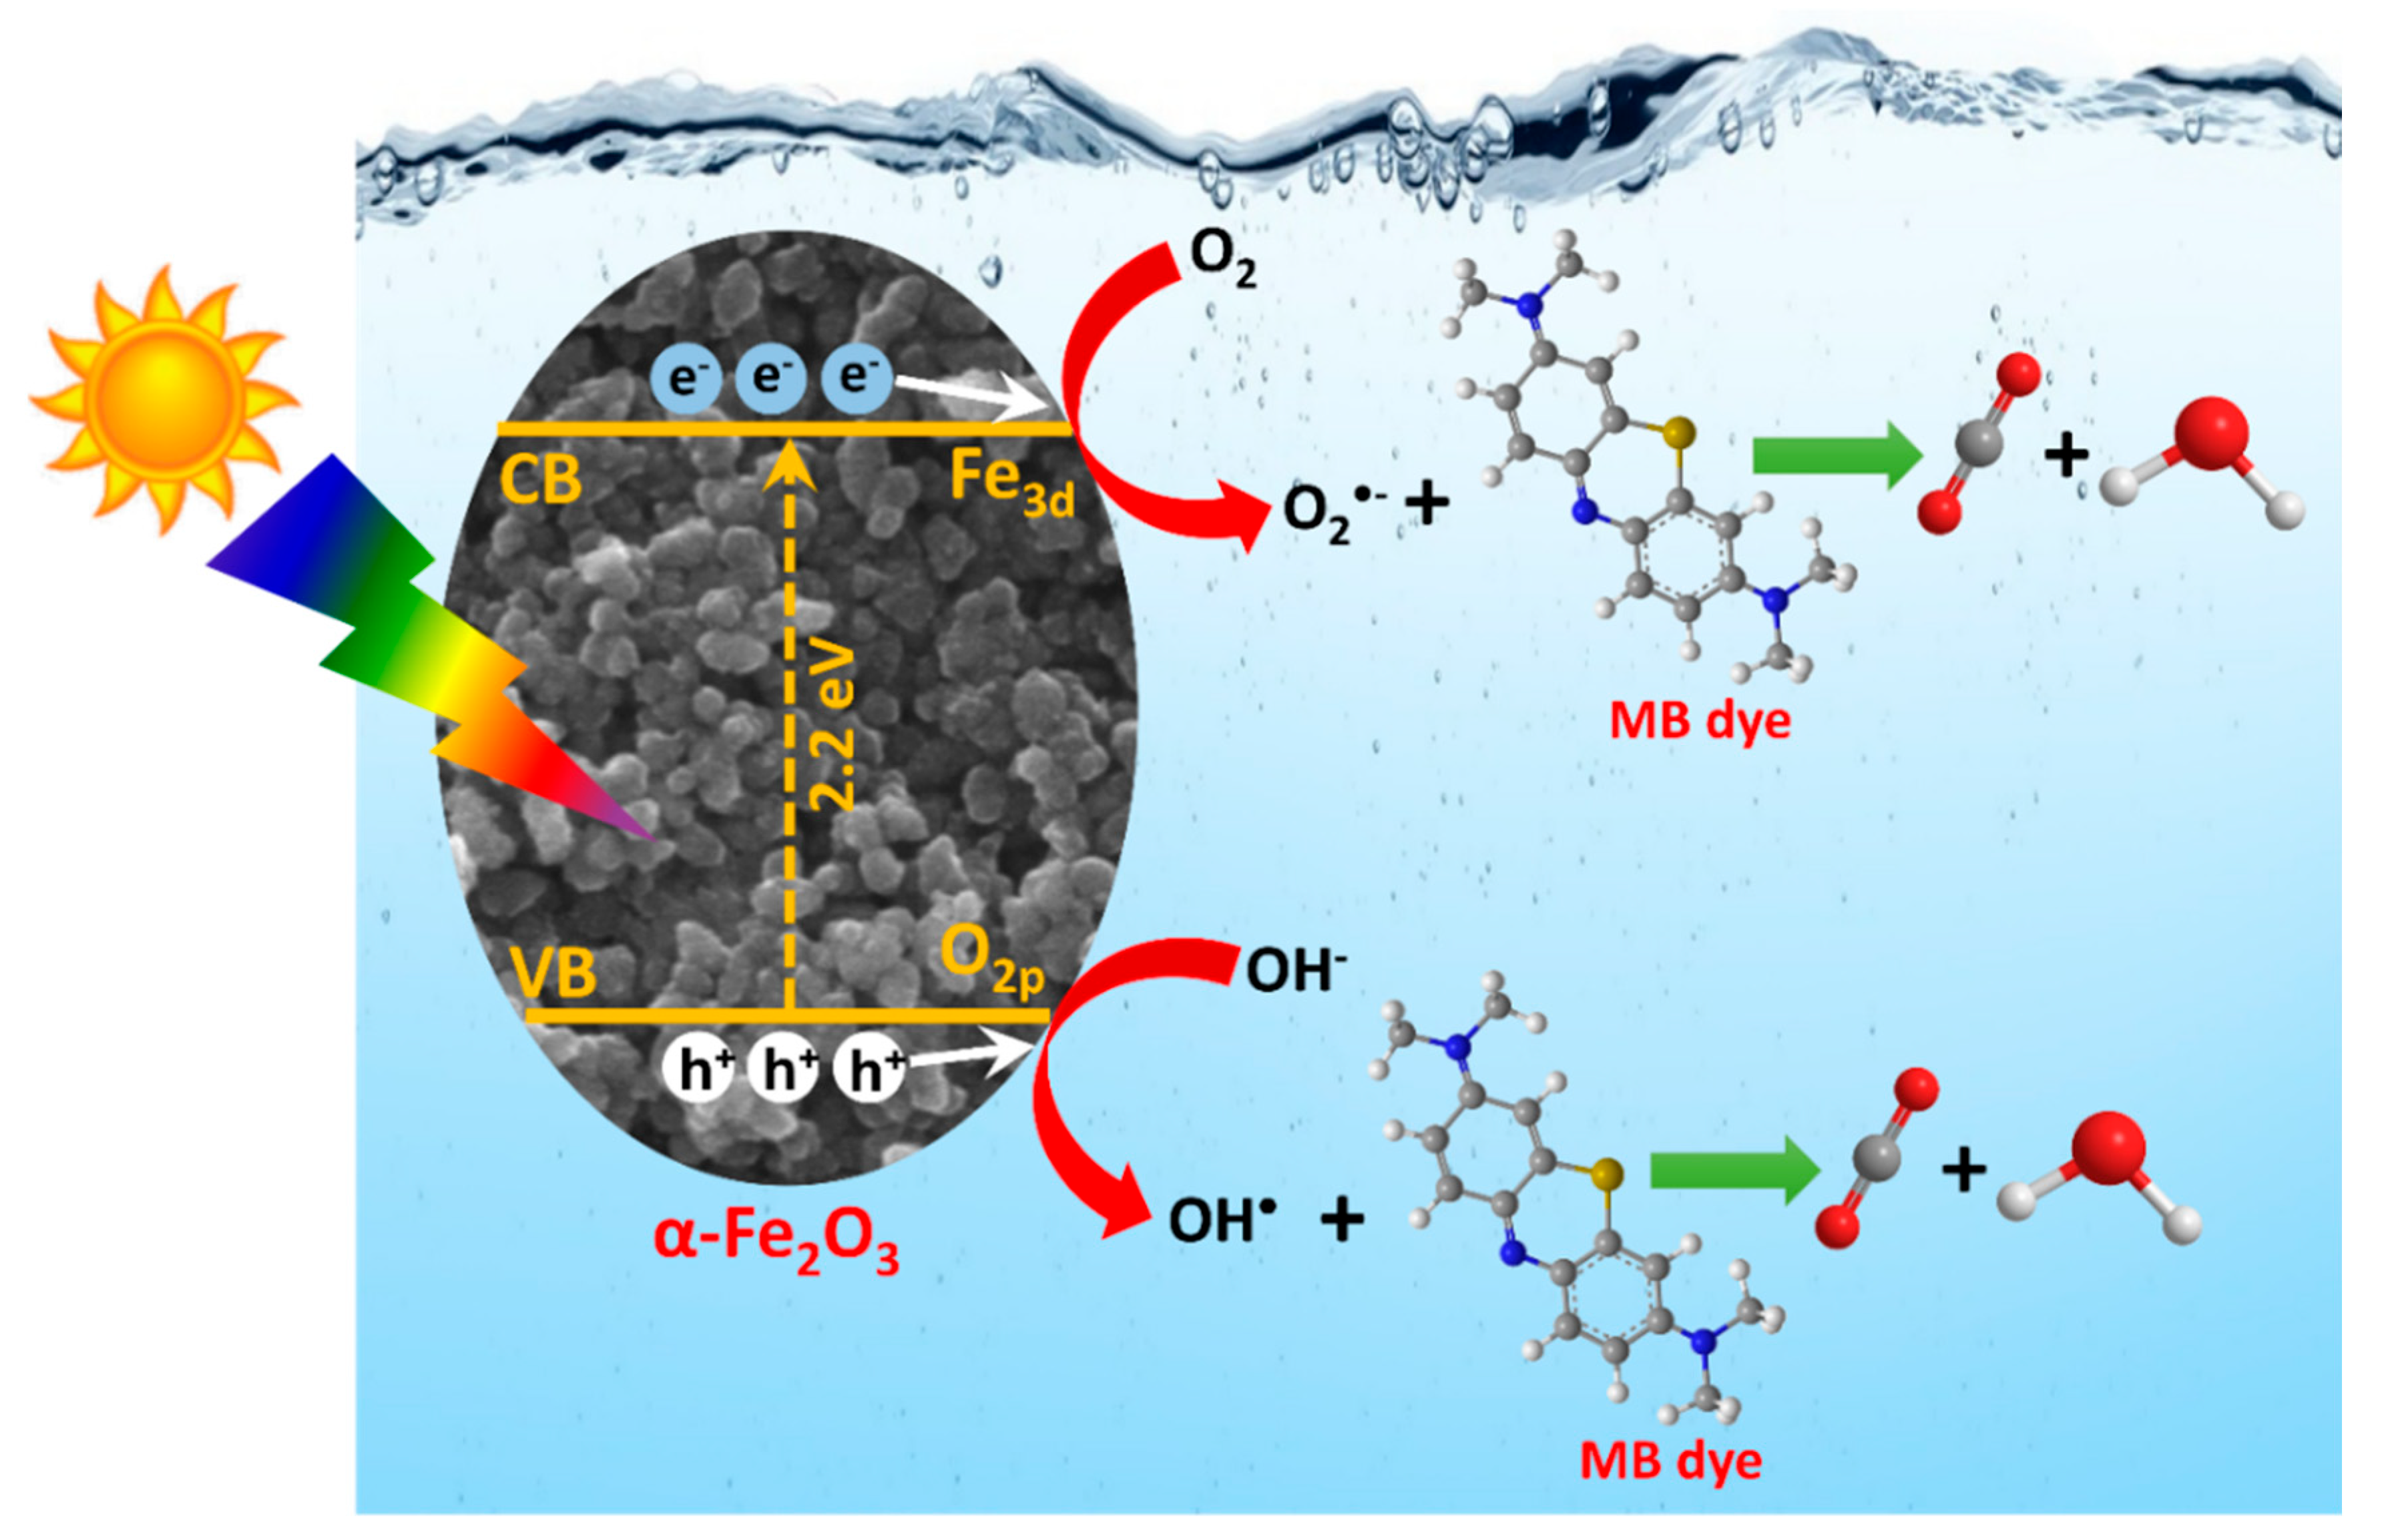
3.7. Photocatalytic Activity Study

| S.No. | Catalyst/ Morphology | Contaminant (s) | Lamp Power and Irradiance | Light | % Removal | Pseudo-First-Order Rate Constant | References |
|---|---|---|---|---|---|---|---|
| 1 | Porous Fe2O3 nanorods | Rhodamine B (RhB) eosin B, Methylene blue (MB), p-nitrophenol, Methylene orange (MO) | 500 W Xe lamp | Simulated solar light | 86% 83% 23% 17% 13% | 0.0131 min−1 | [39] |
| 2 | α-Fe2O3 nanowires | RhB | 350 W Xenon lamp | 420 nm cut-off filter | 85% | - | [40] |
| 3 | Porous Fe2O3 nanotubes | RhB | Xenon lamp | λ ≥ 420 nm | 99% | 0.282 min−1 | [41] |
| 4 | Cubic Fe2O3 Disc Fe2O3 | RhB | 12 Philips TL 8w/54-7656 bulb lamps | - | - | 0.005 min−1 0.042 min−1 | [42] |
| 5 | Mesoporous spindlelike Fe2O3 | RhB | Mercury and tungsten mixed light lamp (OSRAM, 250W, including UV and visible light) | UV and visible light | 95% | - | [43] |
| 6 | Ultrathin α-Fe2O3 nanosheets | Bisphenol S (BPS) | A 300 W xenon lamp (PE300BF) | 420 nm cut-off filter | 90% | 0.0164 min−1 | [44] |
| 7 | 1D α-Fe2O3 nanobraids 1D α-Fe2O3 nanoporous | Congo red (CR) | 400 W metal halide lamp | λ ≥ 365 nm | 91% 90% | - | [45] |
| 8 | Porous α-Fe2O3 nanorods | MB | 250 W halide lamp | 420 nm cut-off filter | 95% | 1.04 × 10⁻² min−1 | [46] |
| 9 | α-Fe2O3 hollow sphere | Salicylic acid | - | UV light | - | - | [47] |
| 10 | α-Fe2O3 hollow spindles | Phenol | high-pressure Hg lamp (500 W, Nanjing Stonetech) | UV irradiation (high-pressure Hg lamp is 365 nm after filtering) | 10% | - | [48] |
| 11 | α-Fe2O3 mesoporous | Salicylic acid | high-pressure Hg lamp | UV irradiation | 95% | - | [49] |
| 12 | α-Fe2O3 hollow microspheres | Salicylic acid | high-pressure Hg lamp (300 W) | UV light | 58% | - | [50] |
| 13 | α-Fe2O3 hollow microspheres assisted solvothermal method | RhB | 300 W Xe lamp | 400 nm cut-off filter | 98% | - | [51] |
| 14 | α-Fe2O3 | Rose Bengal | 200 W tungsten lamp | - | 98% | 1.57 × 10⁻² min−1 | [52] |
| 15 | α-Fe2O3 | H2S | Xe-lamp light source (Oriel, New-port Stratford, Stratford, CT) of intensity 450 W | cut-off filter (>420 nm) | - | - | [53] |
| 16 | α-Fe2O3 dendrites, αFe2O3 nanospindles, α-Fe2O3 nanorods, α-Fe2O3 nanocubes | RhB | 2 mW UV source | (λ = 365 nm) | 82% 83% 84% 84% | 0.322 min−1 0.589 min−1 0.8505 min−1 0.876 min−1 | [54] |
| 17 | α-Fe2O3 nanoparticles | RhB | 500 W xenon lamp | 420 nm cutoff filter | 52% | - | [55] |
| 18 | 1D α-Fe2O3 microrods 1D α-Fe2O3 nanorods | RhB | 300 W xenon lamp | λ > 420 nm | - | 0.00977 min−1 0.148 min−1 | [56] |
| 19 | α-Fe2O3 oblique α-Fe2O3 truncated nanocubes | RhB | 300 W Hg lamp | λ = 365 nm | 59% | - | [57] |
| 20 | α-Fe2O3 microflowers, α-Fe2O3 nanoparticles α-Fe2O3 nanospindles | RhB | 500 W xenon lamp | 420 nm cut-off filter | 98% 94% 91% | - | [58] |
| 21 | flowerlike α-Fe2O3 nanostructures | RhB | 250 W high-pressure Hg lamp | UV irradiation | 59% | - | [59] |
| 22 | α-Fe2O3 hollow core/shell hierarchical nanostructures | Phenol | high-pressure Hg lamp | UV irradiation | 60% | - | [60] |
| 23 | α-Fe2O3 nanoparticle | MB | outdoor sunlight | - | 33% | 0.0033 min−1 | Present work |
4. Conclusions
Author Contributions
Funding
Data Availability Statement
Acknowledgments
Conflicts of Interest
References
- Chakraborty, R.; Karmakar, S.; Ansar, W. Advances and Applications of Bioremediation: Network of Omics, System Biology, Gene Editing and Nanotechnology. In Environmental Informatics: Challenges and Solutions; Springer: Singapore, 2022; pp. 167–199. [Google Scholar]
- Fatimah, I.; Purwiandono, G.; Hidayat, H.; Sagadevan, S.; Ghazali, S.A.I.S.M.; Oh, W.-C.; Doong, R.-A. Flower-like SnO2 Nanoparticle Biofabrication Using Pometia pinnata Leaf Extract and Study on Its Photocatalytic and Antibacterial Activities. Nanomaterials 2021, 11, 3012. [Google Scholar] [CrossRef] [PubMed]
- Das, S.; Gupta, B.; Sarkar, A. Diverse Technological Initiatives for E-Waste Management and Its Impact on Ecosystem. In Conversion of Electronic Waste in to Sustainable Products; Springer Nature: Singapore, 2022; pp. 79–102. [Google Scholar]
- Ossai, I.C.; Ahmed, A.; Hassan, A.; Hamid, F.S. Remediation of soil and water contaminated with petroleum hydrocarbon: A review. Environ. Technol. Innov. 2020, 17, 100526. [Google Scholar] [CrossRef]
- Eibes, G.; Arca-Ramos, A.; Feijoo, G.; Lema, J.M.; Moreira, M.T. Enzymatic technologies for remediation of hydrophobic organic pollutants in soil. Appl. Microbiol. Biotechnol. 2015, 99, 8815–8829. [Google Scholar] [CrossRef]
- Xu, P.; Zeng, G.M.; Huang, D.L.; Feng, C.L.; Hu, S.; Zhao, M.H.; Lai, C.; Wei, Z.; Huang, C.; Xie, G.X.; et al. Use of iron oxide nanomaterials in wastewater treatment: A review. Sci. Total Environ. 2012, 424, 1–10. [Google Scholar] [CrossRef]
- Anita Lett, J.; Sagadevan, S.; Weldegebrieal, G.K.; Fatimah, I. Hydrothermal Synthesis and Photocatalytic Activity of NiO Nanoparticles under Visible Light Illumination. Bull. Chem. React. Eng. Catal. 2022, 17, 340–349. [Google Scholar] [CrossRef]
- Fatimah, I.; Purwiandono, G.; Jauhari, M.H.; Maharani, A.A.A.P.; Sagadevan, S.; Oh, W.C.; Doong, R.A. Synthesis and control of the morphology of SnO2 nanoparticles via various concentrations of Tinospora cordifolia stem extract and reduction methods. Arab. J. Chem. 2022, 15, 103738. [Google Scholar] [CrossRef]
- Fatimah, I.; Purwiandono, G.; Hidayat, A.; Sagadevan, S.; Kamari, A. Mechanistic insight into the adsorption and photocatalytic activity of a magnetically separable γ-Fe2O3/Montmorillonite nanocomposite for rhodamine B removal. Chem. Phys. Lett. 2022, 792, 139410. [Google Scholar] [CrossRef]
- Abdullah, N.H.; Shameli, K.; Etesami, M.; Chan Abdullah, E.; Abdullah, L.C. Facile and green preparation of magnetite/zeolite nanocomposites for energy application in a single-step procedure. J. Alloys Compd. 2017, 719, 218–226. [Google Scholar] [CrossRef]
- Chenab, K.K.; Sohrabi, B.; Jafari, A.; Ramakrishna, S. Water treatment: Functional nanomaterials and applications from adsorption to photodegradation. Mater. Today Chem. 2020, 16, 100262. [Google Scholar] [CrossRef]
- Fatimah, I.; Yahya, A.; Iqbal, R.M.; Tamyiz, M.; Doong, R.-A.; Sagadevan, S.; Oh, W.-C. Enhanced Photocatalytic Activity of Zn-Al Layered Double Hydroxides for Methyl Violet and Peat Water Photooxidation. Nanomaterials 2022, 12, 1650. [Google Scholar] [CrossRef]
- Akbari, A.; Sabouri, Z.; Hosseini, H.A.; Hashemzadeh, A.; Khatami, M.; Darroudi, M. Effect of nickel oxide nanoparticles as a photocatalyst in dyes degradation and evaluation of effective parameters in their removal from aqueous environments. Inorg. Chem. Commun. 2020, 115, 107867. [Google Scholar] [CrossRef]
- Sharma, N.; Kumar, J.; Thakur, S.; Sharma, S.; Shrivastava, V. Antibacterial study of silver doped zinc oxide nanoparticles against Staphylococcus aureus and Bacillus subtilis. Drug Invent. Today 2013, 5, 50–54. [Google Scholar] [CrossRef]
- Hassan, S.M.; Ahmed, A.I.; Mannaa, M.A. Preparation and characterization of SnO2 doped TiO2 nanoparticles: Effect of phase changes on the photocatalytic and catalytic activity. J. Sci. Adv. Mater. Devices 2019, 4, 400–412. [Google Scholar] [CrossRef]
- Khezrianjoo, S.; Lee, J.; Kim, K.-H.; Kumar, V. Eco-Toxicological and Kinetic Evaluation of TiO2 and ZnO Nanophotocatalysts in Degradation of Organic Dye. Catalysts 2019, 9, 871. [Google Scholar] [CrossRef]
- Sagadevan, S.; Lett, J.A.; Alshahateet, S.F.; Fatimah, I.; Weldegebrieal, G.K.; Le, M.V.; Leonard, E.; Paiman, S.; Soga, T. Photocatalytic degradation of methylene blue dye under direct sunlight irradiation using SnO2 nanoparticles. Inorg. Chem. Commun. 2022, 141, 109547. [Google Scholar] [CrossRef]
- Akbarzadeh, A.; Samiei, M.; Davaran, S. Magnetic nanoparticles: Preparation, physical properties, and applications in biomedicine. Nanoscale Res. Lett. 2012, 7, 144. [Google Scholar] [CrossRef]
- Wu, W.; Wu, Z.; Yu, T.; Jiang, C.; Kim, W.S. Recent progress on magnetic iron oxide nanoparticles: Synthesis, surface functional strategies and biomedical applications. Sci. Technol. Adv. Mater. 2015, 16, 023501. [Google Scholar] [CrossRef]
- Wang, F.; Qin, X.; Meng, Y.; Guo, Z.; Yang, L.; Ming, Y. Hydrothermal synthesis and characterization of α-Fe2O3 nanoparticles. Mater. Sci. Semicond. Process. 2013, 16, 802–806. [Google Scholar] [CrossRef]
- Sun, Y.; Zhang, Y.; Tian, Y.; Liu, Y.; Zhao, G.; Li, F.; Fang, D. Facile synthesis of snowflake-like magnetic Fe–Ni alloy with high magnetic properties. Mater. Res. Innov. 2012, 16, 413–416. [Google Scholar] [CrossRef]
- Wu, Y.; Wang, X. Preparation and characterization of single-phase α-Fe2O3 nano-powders by Pechini sol–gel method. Mater. Lett. 2011, 65, 2062–2065. [Google Scholar] [CrossRef]
- Teja, A.S.; Koh, P.Y. Synthesis, properties, and applications of magnetic iron oxide nanoparticles. Prog. Cryst. Growth. Character. 2009, 55, 22–45. [Google Scholar] [CrossRef]
- Yang, X.; Jiang, W.; Liu, L.; Chen, B.; Wu, S.; Sun, D.; Li, F. One step hydrothermal synthesis of highly water soluble secondary structured Fe3O4 nanoparticles. J. Magn. Magn. Mater. 2012, 324, 2249. [Google Scholar] [CrossRef]
- Lu, J.; Jiao, X.; Chen, D.; Li, W. Solvothermal synthesis and characterization of Fe3O4 and ɤ-Fe2O3 nanoplates. J. Phys. Chem. C 2009, 113, 4012–4017. [Google Scholar] [CrossRef]
- Islam, N.; Phong, L.V.; Jeong, J.R.; Kim, C.G. A facile route to sonochemical synthesis of magnetic iron oxide (Fe3O4) nanoparticles. Thin Solid Film. 2011, 519, 8277–8279. [Google Scholar] [CrossRef]
- Reda, S. Synthesis of ZnO and Fe2O3 nanoparticles by sol–gel method and their application in dye-sensitized solar cells. Mater. Sci. Semicond. Process. 2010, 13, 417–425. [Google Scholar] [CrossRef]
- Dealership, E.; Bakhtiari, F.; Alizadeh, M.; Ranjbar, M. Direct thermal decomposition synthesis and characterization of hematite (α-Fe2O3) nanoparticles. Mater. Sci. Semicond. Process. 2012, 15, 91–97. [Google Scholar]
- Wang, R.; Chen, Y.; Fu, Y.; Zhang, H.; Kisielowski, C. Bicrystalline Hematite Nanowires. J. Phys. Chem. B 2005, 109, 12245–12249. [Google Scholar] [CrossRef]
- Li, X.; Wei, W.; Wang, S.; Kuai, L.; Geng, B. Single-crystalline α-Fe2O3 oblique nano parallelepipeds: High-yield synthesis, growth mechanism and structure enhanced gas-sensing properties. Nanoscale 2011, 3, 718–724. [Google Scholar] [CrossRef]
- Liu, X.M.; Fu, S.Y.; Xiao, H.M.; Huang, C.J. Preparation and characterization of shuttle-like α-Fe2O3 nanoparticles by supermolecular template. J. Solid State Chem. 2005, 178, 2798–2803. [Google Scholar] [CrossRef]
- Du, Y.; Fan, H.; Wang, L.; Wang, J.; Wu, J.; Dai, H. α-Fe2O3 nanowires deposited diatomite: Highly efficient absorbents for the removal of arsenic. J. Mater. Chem. A 2013, 1, 7729–7737. [Google Scholar] [CrossRef]
- Tharani, K.; Christy, A.J.; Sagadevan, S.; Nehru, L. Photocatalytic and antibacterial performance of iron oxide nanoparticles formed by the combustion method. Chem. Phys. Lett. 2021, 771, 138524. [Google Scholar] [CrossRef]
- Liang, Y.-C.; Hsu, Y.-W. Enhanced Sensing Ability of Brush-Like Fe2O3-ZnO Nanostructures towards NO2 Gas via Manipulating Material Synergistic Effect. Int. J. Mol. Sci. 2021, 22, 6884. [Google Scholar] [CrossRef] [PubMed]
- Wang, B.; Chen, J.S.; Wu, H.B.; Wang, Z.; Lou, X.W. Quasiemulsion-Templated Formation of α-Fe2O3 Hollow Spheres with Enhanced Lithium Storage Properties. J. Am. Chem. Soc. 2011, 133, 17146–17148. [Google Scholar] [CrossRef]
- Lemecho, B.A.; Sabir, F.K.; Andoshe, D.M.; Gultom, N.S.; Kuo, D.H.; Chen, X.; Mulugeta, E.; Desissa, T.D.; Zelekew, O.A. Biogenic Synthesis of Cu-Doped ZnO Photocatalyst for the Removal of Organic Dye. Bioinorg. Chem. Appl. 2022, 2022, 8081494. [Google Scholar] [CrossRef] [PubMed]
- Su, S.; Liu, Y.; Liu, X.; Jin, W.; Zhao, Y. Transformation pathway and degradation mechanism of methylene blue through β-FeOOH@ GO catalyzed photo-Fenton-like system. Chemosphere 2019, 218, 83–92. [Google Scholar] [CrossRef]
- Shelar, S.G.; Mahajan, V.K.; Patil, S.P.; Sonawane, G.H. Effect of doping parameters on photocatalytic degradation of methylene blue using Ag doped ZnO nanocatalyst. SN Appl. Sci. 2020, 2, 1–10. [Google Scholar] [CrossRef]
- Liu, X.; Chen, K.; Shim, J.-J.; Huang, J. Facile synthesis of porous Fe2O3 nanorods and their photocatalytic properties. J. Saudi Chem. Soc. 2015, 19, 479–484. [Google Scholar] [CrossRef]
- Deng, J.; Liu, J.; Dai, H.; Wang, W. Preparation of α-Fe2O3 nanowires through electrospinning and their Ag3PO4 heterojunction composites with enhanced visible light photocatalytic activity. Ferroelectrics 2018, 528, 58–65. [Google Scholar] [CrossRef]
- Chen, C.; Duan, F.; Zhao, S.; Wang, W.; Yang, F.; Nuansing, W.; Zhang, B.; Qin, Y.; Knez, M. Porous Fe2O3 nanotubes with α-γ phase junction for enhanced charge separation and photocatalytic property produced by molecular layer deposition. Appl. Catal. B Environ. 2019, 248, 218–225. [Google Scholar] [CrossRef]
- Kusior, A.; Michalec, K.; Jelen, P.; Radecka, M. Shaped Fe2O3 nanoparticles—Synthesis and enhanced photocatalytic degradation towards RhB. Appl. Surf. Sci. 2019, 476, 342–352. [Google Scholar] [CrossRef]
- Wu, W.; Zhang, S.; Xiao, X.; Zhou, J.; Ren, F.; Sun, L.; Jiang, C. Controllable Synthesis, Magnetic Properties, and Enhanced Photocatalytic Activity of Spindlelike Mesoporous α-Fe2O3/ZnO Core–Shell Heterostructures. ACS Appl. Mater. Interfaces 2012, 4, 3602–3609. [Google Scholar] [CrossRef]
- Shao, P.; Ren, Z.; Tian, J.; Gao, S.; Luo, X.; Shi, W.; Yan, B.; Li, J.; Cui, F. Silica hydrogel-mediated dissolution-recrystallization strategy for synthesis of ultrathin α-Fe2O3 nanosheets with highly exposed (110) facets: A superior photocatalyst for degradation of bisphenol S. Chem. Eng. J. 2017, 323, 64–73. [Google Scholar] [CrossRef]
- Sundaramurthy, J.; Kumar, P.S.; Kalaivani, M.; Thavasi, V.; Mhaisalkar, S.G.; Ramakrishna, S. Superior photocatalytic behaviour of novel 1D nanobraid and nanoporous α-Fe2O3 structures. RSC Adv. 2012, 2, 8201–8208. [Google Scholar] [CrossRef]
- Zhang, G.-Y.; Feng, Y.; Xu, Y.-Y.; Gao, D.-Z.; Sun, Y.-Q. Controlled synthesis of mesoporous α-Fe2O3 nanorods and visible light photocatalytic property. Mater. Res. Bull. 2012, 47, 625–630. [Google Scholar] [CrossRef]
- Li, L.; Chu, Y.; Liu, Y.; Dong, L. Template-Free Synthesis and Photocatalytic Properties of Novel Fe2O3 Hollow Spheres. J. Phys. Chem. C 2007, 111, 2123–2127. [Google Scholar] [CrossRef]
- Li, X.; Yu, X.; He, J.; Xu, Z. Controllable Fabrication, Growth Mechanisms, and Photocatalytic Properties of Hematite Hollow Spindles. J. Phys. Chem. C 2009, 113, 2837–2845. [Google Scholar] [CrossRef]
- Cao, S.-W.; Zhu, Y.-J. Monodisperse α-Fe2O3 Mesoporous Microspheres: One-Step NaCl-Assisted Microwave-Solvothermal Preparation, Size Control and Photocatalytic Property. Nanoscale Res. Lett. 2010, 6, 1–7. [Google Scholar] [CrossRef]
- Xu, J.-S.; Zhu, Y.-J. α-Fe2O3 hierarchically hollow microspheres self-assembled with nanosheets: Surfactant-free solvothermal synthesis, magnetic and photocatalytic properties. CrystEngComm 2011, 13, 5162–5169. [Google Scholar] [CrossRef]
- Xu, L.; Xia, J.; Wang, K.; Wang, L.; Li, H.; Xu, H.; Huang, L.; He, M. Ionic liquid assisted synthesis and photocatalytic properties of α-Fe2O3 hollow microspheres. Dalton Trans. 2013, 42, 6468–6477. [Google Scholar] [CrossRef]
- Maji, S.K.; Mukherjee, N.; Mondal, A.; Adhikary, B. Synthesis, characterization and photocatalytic activity of α-Fe2O3 nanoparticles. Polyhedron 2012, 33, 145–149. [Google Scholar] [CrossRef]
- Apte, S.K.; Naik, S.D.; Sonawane, R.S.; Kale, B.B.; Baeg, J.O. Synthesis of Nanosize-Necked Structure α- and γ-Fe2O3 and its Photocatalytic Activity. J. Am. Ceram. Soc. 2007, 90, 412–414. [Google Scholar] [CrossRef]
- Bharathi, S.; Nataraj, D.; Senthil, K.; Yoshitake, M. Shape-controlled synthesis of α-Fe2O3 nanostructures: Engineering their surface properties for improved photocatalytic degradation efficiency. J. Nanoparticle Res. 2012, 15, 1346. [Google Scholar] [CrossRef]
- Yang, S.; Xu, Y.; Sun, Y.; Zhang, G.; Gao, D. Size-controlled synthesis, magnetic property, and photocatalytic property of uniform α-Fe2O3 nanoparticles via a facile additive-free hydrothermal route. CrystEngComm 2012, 14, 7915–7921. [Google Scholar] [CrossRef]
- Zhou, X.; Yang, H.; Wang, C.; Mao, X.; Wang, Y.; Yang, Y.; Liu, G. Visible Light Induced Photocatalytic Degradation of Rhodamine B on One-Dimensional Iron Oxide Particles. J. Phys. Chem. C 2010, 114, 17051–17061. [Google Scholar] [CrossRef]
- Liu, Y.; Yu, H.; Zhan, S.; Li, Y.; Lv, Z.; Yang, X.; Yu, Y. Fast degradation of methylene blue with electrospun hierarchical α-Fe2O3 nanostructured fibers. J. Sol-Gel Sci. Technol. 2011, 58, 716–723. [Google Scholar] [CrossRef]
- Xu, Y.; Zhang, G.; Du, G.; Sun, Y.; Gao, D. α-Fe2O3 nanostructures with different morphologies: Additive-free synthesis, magnetic properties, and visible light photocatalytic properties. Mater. Lett. 2013, 92, 321–324. [Google Scholar] [CrossRef]
- Cheng, X.-L.; Jiang, J.-S.; Hu, M.; Mao, G.-Y.; Bu, F.-X.; Lin, C.-C.; Zeng, Y.; Zhang, Q.-H. Controlled synthesis of novel flowerlike α-Fe2O3 nanostructures via a one-step biphasic interfacial reaction route. CrystEngComm 2012, 14, 7701–7708. [Google Scholar] [CrossRef]
- Cao, S.-W.; Zhu, Y.-J.; Cheng, G.-F.; Huang, Y.-H. Preparation and photocatalytic property of α-Fe2O3 hollow core/shell hierarchical nanostructures. J. Phys. Chem. Solids 2010, 71, 1680–1683. [Google Scholar] [CrossRef]


Disclaimer/Publisher’s Note: The statements, opinions and data contained in all publications are solely those of the individual author(s) and contributor(s) and not of MDPI and/or the editor(s). MDPI and/or the editor(s) disclaim responsibility for any injury to people or property resulting from any ideas, methods, instructions or products referred to in the content. |
© 2023 by the authors. Licensee MDPI, Basel, Switzerland. This article is an open access article distributed under the terms and conditions of the Creative Commons Attribution (CC BY) license (https://creativecommons.org/licenses/by/4.0/).
Share and Cite
Sagadevan, S.; Sivasankaran, R.P.; Lett, J.A.; Fatimah, I.; Weldegebrieal, G.K.; Léonard, E.; Le, M.-V.; Soga, T. Evaluation of Photocatalytic Activity and Electrochemical Properties of Hematite Nanoparticles. Symmetry 2023, 15, 1139. https://doi.org/10.3390/sym15061139
Sagadevan S, Sivasankaran RP, Lett JA, Fatimah I, Weldegebrieal GK, Léonard E, Le M-V, Soga T. Evaluation of Photocatalytic Activity and Electrochemical Properties of Hematite Nanoparticles. Symmetry. 2023; 15(6):1139. https://doi.org/10.3390/sym15061139
Chicago/Turabian StyleSagadevan, Suresh, Ramesh Poonchi Sivasankaran, J. Anita Lett, Is Fatimah, Getu Kassegn Weldegebrieal, Estelle Léonard, Minh-Vien Le, and Tetsuo Soga. 2023. "Evaluation of Photocatalytic Activity and Electrochemical Properties of Hematite Nanoparticles" Symmetry 15, no. 6: 1139. https://doi.org/10.3390/sym15061139